Abstract
Speckle noise is a ubiquitous artifact that limits the interpretation of optical coherence tomography images. Here we apply various speckle-reduction digital filters to optical coherence tomography images and compare their performance. Our results indicate that shift-invariant, nonorthogonal wavelet-transform-based filters together with enhanced Lee and adaptive Wiener filters can significantly reduce speckle and increase the signal-to-noise ratio, while preserving strong edges. The speckle reduction capabilities of these filters are also compared with speckle reduction from incoherent angular compounding. Our results suggest that by using these digital filters, the number of individual angles required to attain a certain level of speckle reduction can be decreased.
1. Introduction
Optical coherence tomography (OCT) is a promising technology for imaging the microscopic structure of human tissue in vivo [1–14]. Owing to the coherent nature of the image formation process, OCT images suffer from speckle noise. Speckle noise limits the contrast and the signal-to-noise ratio (SNR) of OCT images, making the interpretation of architectural morphologic features required for clinical diagnosis difficult.
Speckle is problematic for other imaging modalities as well, including synthetic aperture radar (SAR), remote sensing, ultrasound, sonar, etc. In these fields, a substantial amount of signal processing research has been conducted to combat speckle noise, resulting in the development of powerful digital filters for reducing speckle while preserving edge sharpness [15–23]. Speckle reduction in OCT has been addressed by modifying imaging configurations and through the use of signal processing. Recently, some digital algorithms [6,9,12,13] have been applied to OCT images with encouraging results. Optical approaches that physically reduce speckle by incoherent averaging (compounding) have also been demonstrated [5,8,10,14].
In this paper, we evaluate classes of digital filters that are optimized to reduce speckle in an OCT image while maintaining strong edge sharpness. For this purpose, the performance of seven different speckle-reduction filters [15–23] were compared, namely, an enhanced Lee filter (ELEE) [15,17], two à trous wavelet-transform-based filters [18,19], a hybrid median filter (HMF) [20], a symmetric nearest-neighbor (SNN) filter [21], a Kuwahara filter [22], and an adaptive Wiener filter [23]. These filters have been successfully applied to the problem of speckle reduction for other imaging technologies as summarized in Table 1 [24–45]. Even though each filter will perform differently for different imaging modalities (depending on the physical origin of speckle), a quantitative comparison of the performance of these filters for different speckle patterns (e.g., OCT versus ultrasound) is beyond the scope of this paper.
Table 1. Prior Imaging Applications of the Studied Speckle-Reduction Filters.
| Filter's Name | Some Applications of the Filter | References |
|---|---|---|
| ELEE | Synthetic aperture radar (SAR), radar, remote sensing, ultrasound, sonar | 17, 24–26 |
| HMF | Remote sensing, high definition TV (HDTV), electron microscopy, scanning tunneling microscopy (STM) | 20,27–30 |
| SNN | Scanning Auger microscopy (SAM) | 21,31 |
| A trous wavelet 1 | Confocal microscopy, fluorescent imaging, wide-field microscopy, astrophysics, astronomical images, | 18, 36–40 |
| A trous wavelet 2 | Same as above | 19 |
| Kuwahara [22] | MRI, x-ray imaging, single-photon emission computed tomography (SPECT), electron backscattered diffraction (EBSD), neural networks | 22, 41–45 |
| Adaptive Wiener | Sonar, microarray imaging, SPECT, computed tomography (CT) | 23, 32–35 |
We also compare digital filtering with a physical speckle-reduction technique [8,14], which involves acquiring several angularly resolved images and incoherently compounding these images to reduce speckle. With angular compounding, use of a large number of angles increases the complexity of the imaging system and the overall acquisition time. We therefore studied the possibility that by combining digital filtering and angular compounding, fewer angles could be utilized to attain a given speckle-reduction performance level.
Among the filters summarized in Table 1, the ELEE filter [17] is an improved version of the original Lee filter [15], which operates on the assumption that speckle is a multiplicative noise process, i.e., the speckle pattern is fully developed. In terms of performance and principles of operation, the Lee filter [15] is very similar to the Kuan filter [16], and for speckle reduction, the ELEE filter performs better than the original versions of both the Lee [15] and the Kuan [16] filters. For this reason, in this study we focus only on the ELEE filter from this class of filters. This class of filters is based on computing the local coefficient of variation, which measures the image homogeneity [17].
We also used two speckle-reduction filters that are based on a shift invariant, nonorthogonal wavelet transform called the à trous wavelet transform [18]. These algorithms reduce visual artifacts in filtered images that usually occur in regular shift-variant wavelet-transform-based filters due to the nature of the decimated orthogonal wavelet basis [18]. The main difference between the two à trous wavelet-transform filters used in this work is that the second filter [19], which we refer to as wavelet 2, applies a separate threshold value for each individual wavelet level. This operation results in speckle reduction with reduced ringing artifacts that usually occur with wavelet-transform-based filters.
Among other digital filters that we investigated, HMF is an edge preserving speckle-reduction filter that combines the advantages of median filters with adaptive filters [20]. The HMF type of filtering is especially suitable for nonstationary signals, and the filter output is basically the median of two adaptive subfilters and the input image [20]. The SNN filter [21] uses spatial-symmetry and nearest-neighbor constraints within the smoothing window to preserve the edges and corners in an image. One of the main advantages of the SNN filter is that it operates without searching the location and the orientation of the edges within the smoothing window, thereby saving computation time and decreasing complexity.
With the Kuwahara filter [22], the mean and variance of four subquadrants of a windowed section of the image is computed, and the output value of the center pixel in the window is replaced by the mean value of the region that has the smallest variance. Finally, the adaptive Wiener filter [23] computes the local mean and variance and nearest-neighbor constraints within the smoothing inside a window centered on each pixel of the input image. These local statistics are then used adaptively to generate a pixelwise Wiener filter. The entire image is filtered by repeating the same procedure for each pixel [23].
In this work, all of the above digital filters were implemented using MATLAB (version 7.1) on a 1.6 GHz Pentium M personal computer. Filter performance was evaluated using established speckle-reduction performance metrics [6,9,12,13], including SNR, contrast-to-noise ratio (CNR), and equivalent number of looks (ENL), which is a measure of the smoothness of a homogeneous region of interest. The following definitions for these image quality metrics were used [6,9,12,13]:
| (1) |
where Flin is the linear magnitude image, is the variance of Flin in a background noise region, μb and are the mean and variance of the same background noise region, μh and are the mean and variance of all the homogeneous regions of interest (H), and finally μr and are the mean and variance of all the regions of interests (R), including the homogeneous regions (H). Following earlier work [12], except for the SNR calculations, all the other parameters were computed from the logarithmic OCT images. In our numerical investigation, we used H=5 and R=9, excluding the background region. And finally, for ELEE, HMF, SNN, Kuwahara, and the adaptive Wiener filters, a window size of 5 × 5 pixels was used in the numerical evaluation of these filters. This choice of window size for these filters is also commonly made in the literature [24–35,41–45]. On the other hand, for an OCT image to be filtered, the optimum choice of this window size should also take into account the residual correlation between two adjacent pixels of the OCT image. For instance, in the case of zero padding, the adjacent pixels in a single A line start to become correlated, and therefore the window size needs to be increased. The same phenomenon also holds for oversampled OCT images, where the physical distance between two adjacent A lines is significantly less than the beam width. In this work, we did not use zero padding for each A line, and the distance between two A lines was half of the beam diameter (FWHM), which gave us good results for a window choice of 5 × 5 pixels. However, for ELEE, HMF, SNN, Kuwahara, and the adaptive Wiener filters, the quantitative study of the effect of the window size on zero padding and oversampling in OCT images is left as a future work.
We also defined an average figure of merit (FOM), FOM=SNRn+ENLn+CNRn, where the subscript n refers to the fact that the image quality metric is normalized, i.e., for the filter that performed best in, e.g., SNR criteria, SNRn is equal to 1. Therefore, an FOM of 3 indicates that the filter performed the best in all of the three image quality metrics, SNR, ENL, and CNR.
To further quantitatively compare the performance of the filters, we defined the resultant image of the above-described angle compounding technique [14] (where N=64 mutually incoherent images were combined) as our gold standard image, IG(x,y). Using this gold standard image, we defined mean square error (MSE) as another image quality metric for each filter output, IF(x,y), i.e.,
| (2) |
2. Experimental Results
To compare the performance of the digital filters, we imaged a bovine retina ex vivo with an angle-resolved optical frequency-domain imaging (OFDI) system [14]. The OFDI system is composed of a wavelength-swept source (centered at 1295 nm with a range of 130 nm and a sweep rate of 25 Hz) and an InGaAs line-scan camera with 512 pixels [14]. We utilized 400 pixels of the InGaAs line camera to simultaneously record the backscattered light collected from an angular range of 32°. From these 400 images, approximately, 64 were determined to be mutually incoherent; these 64 were subsequently used for angular compounding.
The quantitative performance of the angle compounding is summarized in Fig. 1, and image data are presented in Fig. 2. The top row in Fig. 2 shows the unfiltered images of the same bovine retina for N=1, 4, and 64, where N refers to the number of angles used to form the compound image. Other rows of Fig. 2 (as will be explained in detail later on) show four different filter outputs for N=1, 4, and 64. Therefore each column in Fig. 2 shows the comparison (for a given N) between the unfiltered image and the filtered images. As can be seen in the top row of Fig. 2, it is evident that as N increases, speckle noise diminishes, due to the speckle reduction capability of the physical, angular compounding approach [14].
Fig. 1.
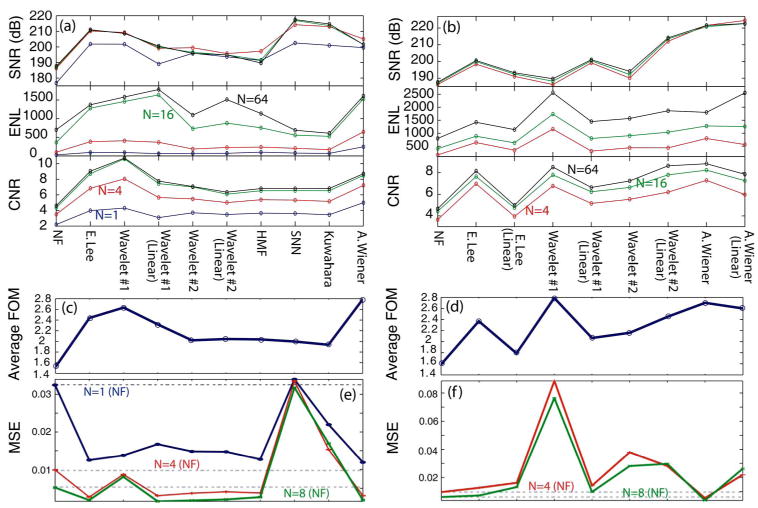
(Color online) Performance summary of various speckle-reduction filters applied to a bovine retina OFDI image. (a) and (b) show SNR, ENL, and CNR computed for each case. The results of (a) have been obtained by filtering the final image after angle compounding (postcompounding), whereas the results of (b) have been obtained by filtering each individual angle before forming the final angle compound image (precompounding). (c) and (d) show the average FOM for (a) and (b), respectively. (e) and (f) show the MSE of each filter, as defined in Eq. (2). N, number of angles; NF, no filtering; CNR, contrast-to-ratio; SNR, signal-to-noise ratio; ENL, equivalent number of looks; FOM, figure of merit; MSE, mean-square error; “(Linear),” filter applied to linear image as opposed to the logarithmic image. Only promising linear filter results are shown.
Fig. 2.
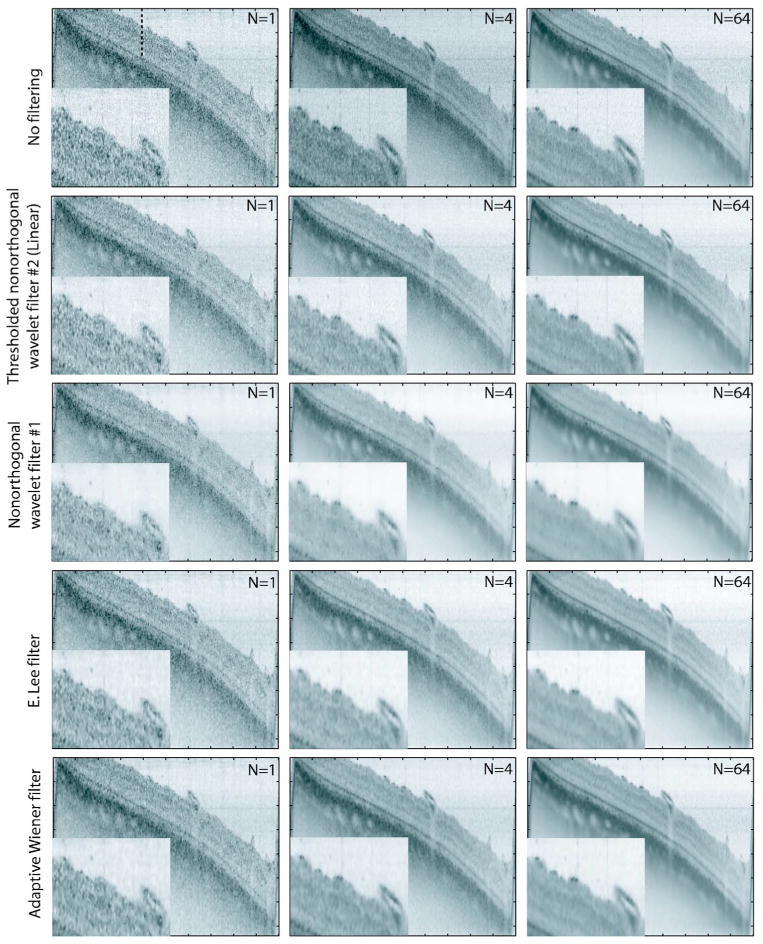
(Color online) Image recovery results for the à trous wavelet-transform-based filters (1 and 2), the ELEE, and the adaptive Wiener filters applied to the unfiltered images (postcompounding filtering). N number of angles; linear, filter applied to the linear image as opposed to the logarithmic image. The dashed line in the unfiltered N=1 image corresponds to the 400th A line, where the cross section of Fig. 3 is taken. Each image has 1000 A lines, where the distance between two adjacent A lines is ∼5 μm. There are 370 pixels shown for each A line covering a depth of 2.47 mm in air.
Digital speckle-reduction filters can be applied in two different ways to OCT images (for N>1). (1) Postcompounding digital filtering, where the digital filter is applied to the final image after the angle compounding is done; and (2) precompounding digital filtering, where the digital filter is applied to each individual angle separately, and N of these filtered images are combined to form the final image. Next, we present the results of these two methods in separate sections.
A. Postcompounding Digital Filtering
Figure 1(a) shows the performance of the filters, when the filter is applied to the final image of the angle compounding (postcompounding filtering), and it clearly indicates that, for the unfiltered [no filtering (NF)] images, as N increases, all the image quality metrics improve as expected. However, except for the ENL criteria, the improvement by moving from N=16 to N=64 becomes less visible for the unfiltered images. Figure 1(a) also shows that especially the ELEE filter, the à trous wavelet-transform-based filters (1 and 2), and the adaptive Wiener filter significantly increase SNR and CNR (by >20 dB and ∼2 times, respectively), and reduce speckle (an ENL increase of >2 times). Figure 1(c) shows the average FOM computed from the results of Fig. 1(a). The results show that the FOM was highest for the ELEE filter, the adaptive Wiener filter, and the wavelet-based filters [see Fig. 1(c)].
In terms of the MSE image quality metric [Eq. (2)], one can clearly see in Fig. 1(e) that as N increases the MSE drops rapidly, illustrating once again the speckle-reduction capability of the angular compounding approach [14]. For the NF image, an increase in N from 1 to 4 results in a decrease in MSE by more than a factor of 3 [see the dashed gray curves in Fig. 1(e)]. But what is more important is that for each N, the filtered images (except the SNN and Kuwahara filters) perform significantly better than the NF image corresponding to the same N. This property of Fig. 1(e) illustrates that for a given image (corresponding to a certain N value) digital filtering significantly reduces the speckle noise, making the final image look more like the gold standard image, IG(x,y). Furthermore, for N=4 [red (middle) solid line in Fig. 1(e)], the MSE performance of the ELEE, wavelets 1 and 2, HMF and the adaptive Wiener filters is better than the NF image corresponding to N=8 [green (bottom) solid line in Fig. 1(e)], illustrating the possibility of using twice as many fewer numbers of angles to achieve the same level of speckle reduction through digital filtering.
The resulting images obtained using these filters for N=1, 4, and 64 are also shown in Fig. 2, as rows. The filtered images indicate that the homogeneous regions of the image are smoothed out due to speckle reduction without any noticeable degradation in the edge sharpness. To further illustrate the effect of the filters on the edges, in Fig. 3, the retina edge in front of the background region is plotted in a single A line (400th A line of Fig. 2) for N=1, 4, 16, and 64 for the NF images as well as for the filtered images of Fig. 2. Figure 3 clearly demonstrates the excellent edge preserving properties of the filters: the background region (corresponding to pixel numbers ∼1–25 in Fig. 3) is significantly smoothened for all N values with the digital filters when compared with the NF image; whereas the retina edge (corresponding to pixel numbers ∼28–32 in Fig. 3) remained unchanged.
Fig. 3.
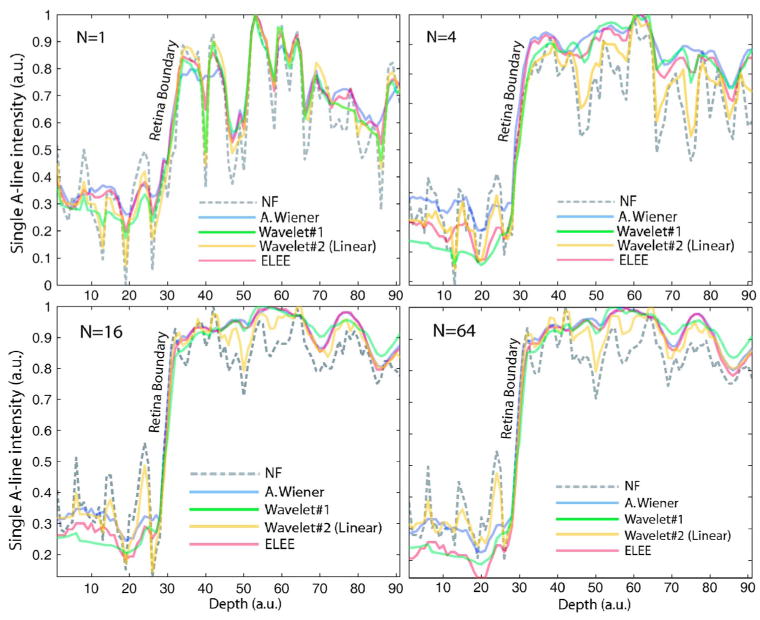
(Color online) Recovery results for the retina edge in a single A line (400th line of Fig. 2) for N=1, 4, 16, and 64. The edge of the retina boundary is shown for the NF image as well as for the filtered images. The y axis is in normalized decibel units. Linear, filter applied to the linear image as opposed to the logarithmic image.
B. Precompounding Digital Filtering
Figure 1(b) shows the performance metrics for the filters, when the filter was applied to each individual angle separately. Unless noted as “linear,” for each individual angle the logarithmic image was filtered, and this filtered image was then transformed back to linear units before the final compounding. For filters that are marked as linear in parentheses, for each angle the filter was applied to the linear image, and then the compounding of these filtered angles was again done in linear units. Therefore the compounding operation of N filtered images was always done in linear units. After compounding, the performance metrics (except SNR) were calculated for the logarithmic final compound image. The results of this second numerical study are only presented for the most promising filters, i.e., for the ELEE filter [17], the adaptive Wiener filter [23], and the wavelet-based filters [18,19]. The results indicate that, in the case of precompounding filtering, especially the adaptive Wiener filter together with the wavelet-based filter (e.g., wavelet 2, applied to linear images) perform relatively well, showing an SNR improvement of >25 dB with significant ENL and CNR improvements [see Fig. 1(b)]. Similar to Fig. 1(c), Fig. 1(d) shows the average FOM computed from the results of Fig. 1(b). This time wavelet 1 and the adaptive Wiener filters performed significantly better with respect to the above image quality metrics than the other filters, followed by the ELEE and wavelet 2 (applied to linear images).
The MSE performance [shown in Fig. 1(f)] of the precompounding approach was slightly worse than the MSE performance of the postcompounding approach [Fig. 1(e)]. Overall, in the case of precompounding filtering, the adaptive Wiener filter performed the best in terms of MSE criterion, providing for N=4 the same level of MSE as the unfiltered N=8 image yielded [see Fig. 1(f)]. This again illustrates that digital filtering can help to reduce the total number of angles used in an angle-compounding speckle-reduction scheme.
Figures 4 and 5 show the filtered images for the wavelet-transform-based filters (1 and 2), the ELEE filter, and the adaptive Wiener filter illustrating the improved speckle reduction with respect to the NF images at the top rows.
Fig. 4.
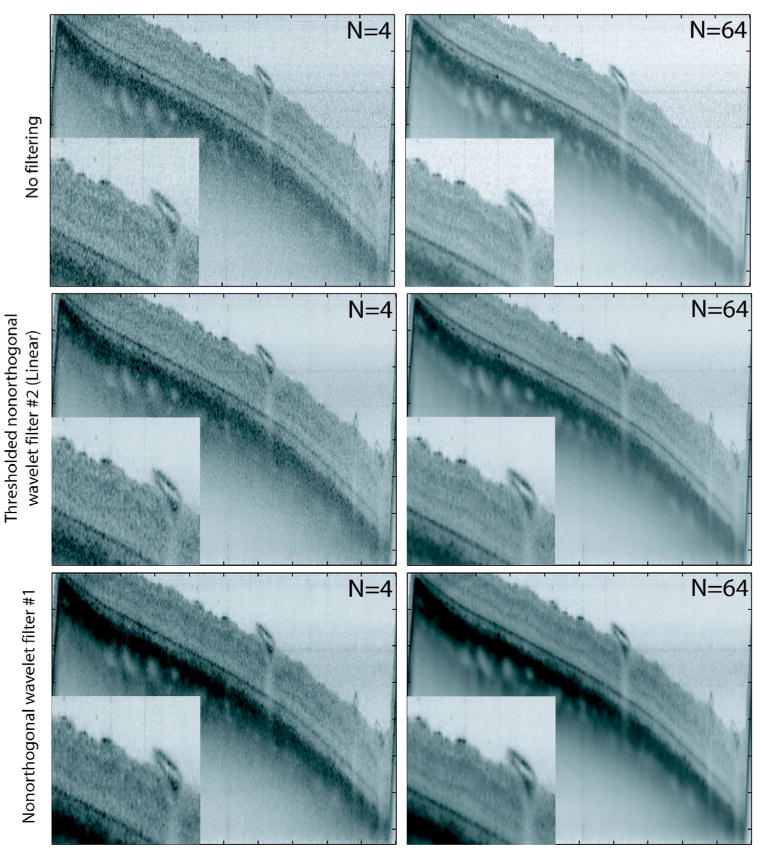
(Color online) Recovery results for the wavelet-transform-based filters (Refs. [17,18]) applied to each angle separately and then added in linear units (precompounding filtering). N number of angles; linear, filter applied to the linear image as opposed to the logarithmic image. Each image has 1000 A lines, where the distance between two adjacent A lines is ∼5 μm. There are 370 pixels shown for each A line covering a depth of 2.47 mm in air.
Fig. 5.
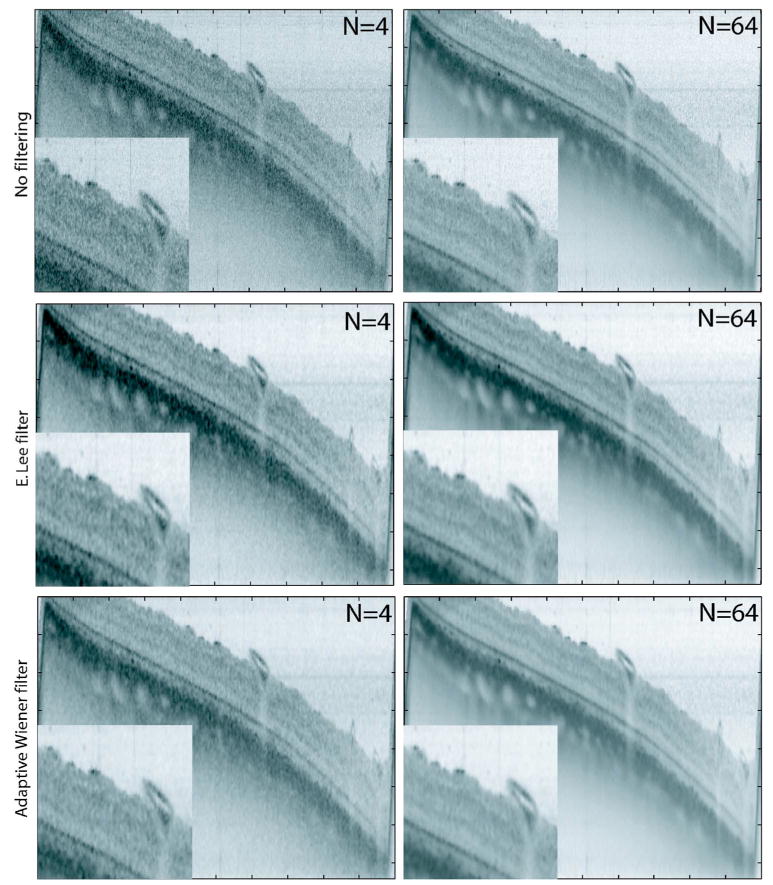
(Color online) Recovery results for the ELEE and the adaptive Wiener filters applied to each angle separately and then added in linear units (precompounding filtering). N, number of angles. Each image has 1000 A lines, where the distance between two adjacent A lines is ∼5 μm. There are 370 pixels shown for each A line covering a depth of 2.47 mm in air.
To be able to better compare the performance of these digital filters for postcompounding versus precompounding, in Figs. 6 and 7, a zoomed version of the same bovine retina image [Figs. 2–5] is illustrated for N=4 and 8, respectively. The two columns in these figures represent a comparison between postcompounding versus precompounding for the filtered images. And the top row in each figure shows, for comparison purposes, the NF image of the same region. The results indicate that the performance of each filter (Wiener filter, ELEE, and the wavelet filters) is very similar visually for both postcompounding and precompounding. This conclusion is further supported numerically by a comparison of Figs. 1(a) and 1(b). On the other hand, with respect to computational efficiency, the postcompounding approach is at least N times faster than precompounding filtering, making the postcompounding option computationally efficient. Moreover, the MSE performance of the postcompounding approach is slightly better than the precompounding approach making it even more advantageous. Meanwhile, in both of these filtering approaches, as one can clearly see in Figs. 6 and 7, the degree of speckle reduction is significant when compared with the unfiltered images (top rows in Figs. 6 and 7).
Fig. 6.
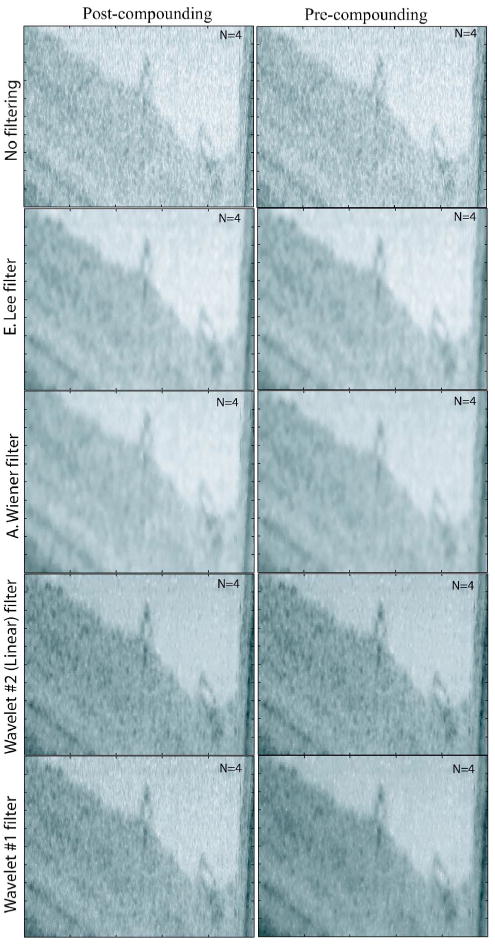
(Color online) Comparison of the performance of precompounding versus postcompounding. In this comparison N=4 is used. Each image has 250 A lines, where the distance between two adjacent A lines is ∼5 μm. One hundred pixels are shown for each A line covering a depth of 0.67 mm in air.
Fig. 7.
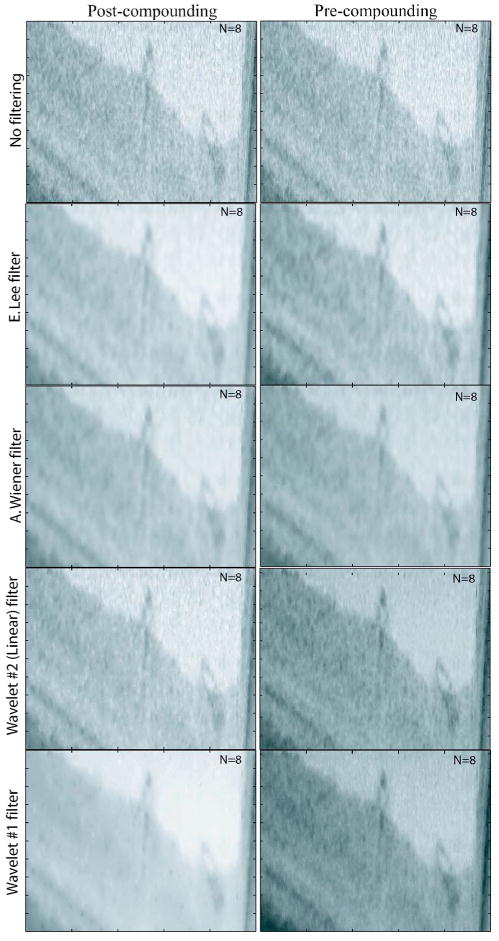
(Color online) Same as Fig. 6, except N=8.
It is quite important to note that, as is evident in Fig. 1, digital filtering improves the image quality metrics (SNR, ENL, CNR, and MSE) such that the number of individual angles and hence the total image acquisition time may be decreased with digital filtering. Specifically, the reader should compare the performance of the unfiltered N=16 image [the first green dots (middle line of top panel) in each row of Fig. 1(a)] with the adaptive Wiener filter's output for N=4 [the last red point (middle line) in each row of Fig. 1(a)], where in all of the three image quality metrics (SNR, ENL, and CNR) the result of the Wiener filter for N=4 performs better than the unfiltered N=16 image. A similar comparison between the unfiltered N=16 image and the filtered N=4 images can also be made in Fig. 1(b) for wavelet 1, ELEE, and the Wiener filters. These results, combined with the above-discussed MSE results of Figs. 1(e) and 1(f) imply a possible reduction in the number of required individual angles to achieve a given level of speckle reduction, defined by SNR, CNR, ENL, and MSE metrics. A comparison between Figs. 6 and 7 further supports this argument, since the zoomed versions of the filtered images for N=4 appear to have less speckle noise than the zoomed unfiltered image of N=8, again suggesting an important reduction in the number of required individual angles for speckle reduction.
We also applied the above-discussed digital filters to other OCT images and obtained similar good results. Another example is illustrated in Fig. 8 for an ex vivo human colon image obtained using the same OFDI system described above (for N=1). The digitally filtered images of Fig. 8 show the ability of these filters to reduce speckle in the OCT image, while strong edges and fine features are still well preserved.
Fig. 8.
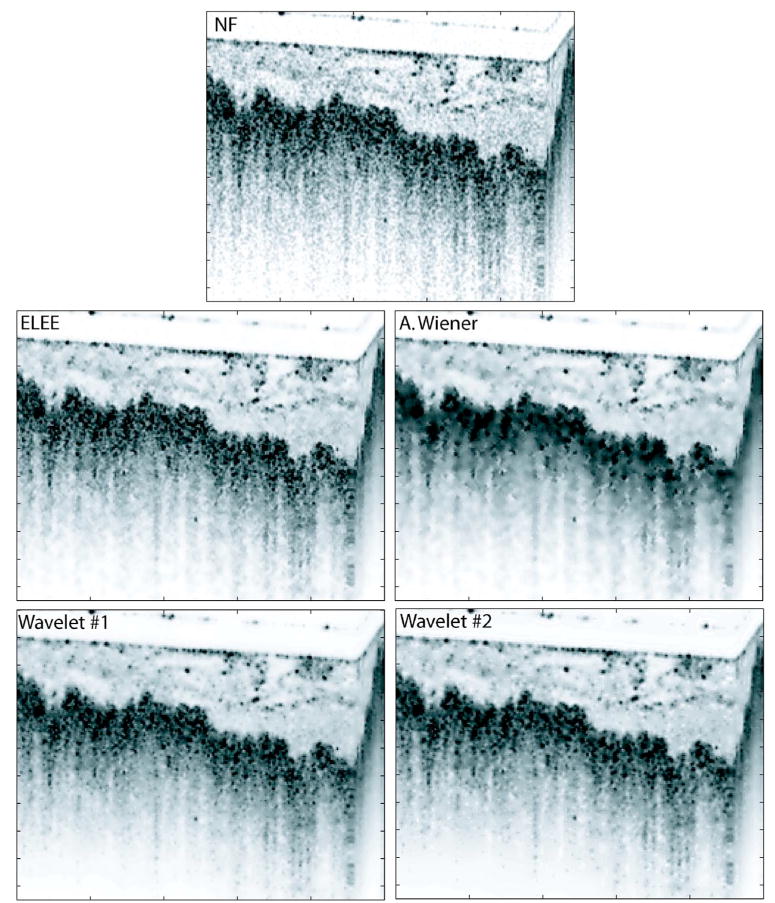
(Color online) Image recovery results for the à trous wavelet-transform-based filters (1 and 2), the ELEE, and the adaptive Wiener filters applied to the unfiltered image (top image) of an ex vivo human colon tissue imaged using an OFDI system. N=1 is used. Each image has 250 A lines, where the distance between two adjacent A lines is ∼5 μm. There are 210 pixels shown for each A line covering a depth of 1.40 mm in air.
Finally, Table 2 summarizes the computational performance of the filters for a representative case (unfiltered N=4 image of Fig. 2). The relative speed of each of the filters is determined from the computer's CPU time required to complete the processing. The adaptive Wiener filter was the fastest of all the filters, followed by the wavelet 1 filter. However, the MATLAB codes of the filters were not necessarily optimized to reduce the running time. The CPU times listed in Table 2 should therefore be considered preliminary estimates of the speed of the algorithms.
Table 2. Summary of the Speckle-Reduction Filters [from Figs. 1(a) and 1(e)] Applied to the Unfiltered (N=4) OCT Image of Fig. 2.
| Filter's Name | SNR (dB) | ENL | CNR | MSE (%) | CPU Time (s) |
|---|---|---|---|---|---|
| No filtering (NF) | 186.3 | 100 | 3.5 | 0.99 | 0 |
| ELEE | 210.2 | 383 | 6.84 | 0.27 | 8.9 |
| HMF | 197.2 | 238 | 5.37 | 0.38 | 15.8 |
| SNN | 214.2 | 205 | 5.32 | 3.35 | 29.5 |
| A trous wavelet 1 | 209.3 | 407 | 8.05 | 0.87 | 2.1 |
| A trous wavelet 1 (linear) | 199.1 | 367 | 5.66 | 0.30 | 2.1 |
| A trous wavelet 2 | 199.5 | 185 | 5.48 | 0.37 | 3.0 |
| A trous wavelet 2 (linear) | 195.7 | 228 | 5.00 | 0.40 | 3.0 |
| Kuwahara [22] | 213.0 | 169 | 5.16 | 1.53 | 42.1 |
| Adaptive Wiener | 205.1 | 647 | 7.21 | 0.31 | 0.4 |
3. Conclusions
We have compared the performance of various speckle-reduction digital filters applied to optical coherence tomography images. Our findings indicate that shift-invariant, nonorthogonal wavelet-transform-based filters together with enhanced Lee and adaptive Wiener filters can significantly reduce speckle and increase SNR while still preserving some of the fine details of the image. These filters are also compared with a physical speckle reduction technique that acquires several angularly resolved images and compounds these different angles to reduce speckle. Our results suggest that by using speckle-reduction filters, the number of compounded images required to achieve a given set of image quality metrics can be reduced. This finding may enable easier and more time-efficient implementation of angular compounding in future OCT systems.
Acknowledgments
The authors thank Brian Goldberg and Alex Chau of MIT for their valuable comments and fruitful discussions.
References
- 1.Huang D, Swanson E, Lin CP, Schuman JS, Stinson WG, Chang W, Hee MR, Flotte T, Gregory K, Puliafito CA, Fujimoto JG. Optical coherence tomography. Science. 1991;254:1178–1181. doi: 10.1126/science.1957169. [DOI] [PMC free article] [PubMed] [Google Scholar]
- 2.Fujimoto JG, Brezinski ME, Tearney GJ, Boppart SA, Bouma B, Hee MR, Southern JF, Swanson EA. Optical biopsy and imaging using optical coherence tomography. Nat Med. 1995;1:970–972. doi: 10.1038/nm0995-970. [DOI] [PubMed] [Google Scholar]
- 3.Fercher AF, Hitzenberger CK, Kamp G, El-Zaiat SY. Measurement of intraocular distances by backscattering spectral interferometry. Opt Commun. 1995;117:43–48. [Google Scholar]
- 4.Tearney GJ, Brezinski ME, Bouma BE, Boppart SA, Pitris C, Southern JF, Fujimoto JG. In vivo endoscopic optical biopsy with optical coherence tomography. Science. 1997;276:2037–2039. doi: 10.1126/science.276.5321.2037. [DOI] [PubMed] [Google Scholar]
- 5.Schmitt JM. Array detection for speckle reduction in optical coherence microscopy. Phys Med Biol. 1997;42:1427–1439. doi: 10.1088/0031-9155/42/7/015. [DOI] [PubMed] [Google Scholar]
- 6.Yung KM, Lee SL, Schmitt JM. Phase-domain processing of optical coherence tomography images. J Biomed Opt. 1999;4:125–136. doi: 10.1117/1.429942. [DOI] [PubMed] [Google Scholar]
- 7.Asakura T. International Trends in Optics and Photonics ICO IV. Springer-Verlag; 1999. pp. 359–389. [Google Scholar]
- 8.Bashkansky M, Reintjes J. Statistics and reduction of speckle in optical coherence tomography. Opt Lett. 2000;25:545–547. doi: 10.1364/ol.25.000545. [DOI] [PubMed] [Google Scholar]
- 9.Rogowska J, Brezinski ME. Evaluation of adaptive speckle suppression filter for coronary optical coherence tomography imaging. IEEE Trans Med Imaging. 2000;19:1261–1266. doi: 10.1109/42.897820. [DOI] [PubMed] [Google Scholar]
- 10.Pircher M, Gotzinger E, Leitgeb R, Fercher AF, Hitzenberger CK. Speckle reduction in optical coherence tomography by frequency compounding. J Biomed Opt. 2003;8:565–569. doi: 10.1117/1.1578087. [DOI] [PubMed] [Google Scholar]
- 11.Leitgeb RA, Drexler W, Unterhuber A, Hermann B, Bajraszewski T, Le T, Stingl A, Fercher A. Ultrahigh resolution Fourier domain optical coherence tomography. Opt Express. 2004;12:2156–2165. doi: 10.1364/opex.12.002156. [DOI] [PubMed] [Google Scholar]
- 12.Adler DC, Ko TH, Fujimoto JG. Speckle reduction in optical coherence tomography images by use of a spatially adaptive wavelet filter. Opt Lett. 2004;29:2878–2880. doi: 10.1364/ol.29.002878. [DOI] [PubMed] [Google Scholar]
- 13.Marks DL, Ralston TS, Boppart SA. Speckle reduction by I-divergence regularization in optical coherence tomography. J Opt Soc Am A. 2005;22:2366–2371. doi: 10.1364/josaa.22.002366. [DOI] [PubMed] [Google Scholar]
- 14.Desjardins AE, Vakoc BJ, Tearney GJ, Bouma BE. Speckle reduction in OCT using massively-parallel detection and frequency-domain ranging. Opt Express. 2006;14:4736–4745. doi: 10.1364/oe.14.004736. [DOI] [PMC free article] [PubMed] [Google Scholar]
- 15.Lee JS. Speckle analysis and smoothing of synthetic aperture radar images. Comput Graph Image Process. 1981;17:24–32. [Google Scholar]
- 16.Kuan DT, Sawchuk AA, Strand TC, Chavel P. Adaptive noise smoothing filter for images with signal-dependent noise. IEEE Trans Pattern Anal Mach Intell. 1985;7:165–177. doi: 10.1109/tpami.1985.4767641. [DOI] [PubMed] [Google Scholar]
- 17.Lopes A, Touzi R, Nesby E. Adaptive speckle filter and scene heterogeneity. IEEE Trans Geosci Remote Sens. 1990;28:992–1000. [Google Scholar]
- 18.Starck JL, Murtagh F, Bijaoui A. Image Processing and Data Analysis: The Multiscale Approach. Cambridge U. Press; 1998. [Google Scholar]
- 19.Fraser SI, Allen AR. A speckle reduction algorithm using the à trous wavelet transform. Proceedings of the IASTED International Conference on Visualization, Imaging and Image Processing; ACTA; 2001. pp. 313–318. [Google Scholar]
- 20.Nieminen A, Heinonen P, Neuvo Y. A new class of detail-preserving filters for image-processing. IEEE Trans Pattern Anal Mach Intell. 1987;9:74–90. doi: 10.1109/tpami.1987.4767873. [DOI] [PubMed] [Google Scholar]
- 21.Harwood D, Subbarao M, Hakalahti H, Davis L. A new class of edge-preserving smoothing filters. Pattern Recogn Lett. 1987;6:155–162. [Google Scholar]
- 22.Kuwahara M, Hachimura K, Eiho S, Kinoshita M. Digital Processing of Biomedical Images. Plenum; 1976. pp. 187–203. [Google Scholar]
- 23.Lim SJ. Two-Dimensional Signal and Image Processing. Prentice Hall; 1990. [Google Scholar]
- 24.Sauter D, Parson L. Spatial filtering for speckle reduction, contrast enhancement, and texture analysis of GLORIA images. IEEE J Ocean Eng. 1994;19:563–576. [Google Scholar]
- 25.Kofidis E, Theodoridis S, Kotropoulos C, Pitas I. Nonlinear adaptive filters for speckle suppression in ultrasonic images. Signal Process. 1996;52:357–372. [Google Scholar]
- 26.Zaitsev VV, Troshkin DV. Experimental study of speckle-noise filtering algorithms for radar images. Earth Observation and Remote Sensing. 1995;12:831–846. [Google Scholar]
- 27.Vassiliou AA, Bouluanne M, Blais JAR. On the application of averaging median filters in remote sensing. IEEE Trans Geosci Remote Sens. 1988;26:832–838. [Google Scholar]
- 28.Salo J, Neuvo Y, Hameenaho V. Improving TV picture quality with linear-median type operations. IEEE Trans Consum Electron. 1988;34:373–379. [Google Scholar]
- 29.Harauz G, Fonglochovsky A. Automatic selection of macromolecules from electron micrographs by component labeling and symbolic processing. Ultramicroscopy. 1989;31:333–344. doi: 10.1016/0304-3991(89)90331-8. [DOI] [PubMed] [Google Scholar]
- 30.Kokaram AC, Persad N, Lasenby J, Fitzgerald WJ, McKinnan A, Welland M. Restoration of images from the scanning-tunneling microscope. Appl Opt. 1995;34:5121–5132. doi: 10.1364/AO.34.005121. [DOI] [PubMed] [Google Scholar]
- 31.Bohmig SD, Beilschmidt H, Reichl BM. Noise suppression in scanning Auger images—Comparison of various digital filters, Fresenius'. J Anal Chem. 1993;346:196–199. [Google Scholar]
- 32.Chandran V, Elgar S. Detection of sea mines in sonar imagery using higher-order spectral features. Proc SPIE. 1999;3710:578–587. [Google Scholar]
- 33.Wang XH, Istepanian RSH, Song YH. Microarray image enhancement by denoising using stationary wavelet transform. IEEE Trans Nanobiosci. 2003;2:184–189. doi: 10.1109/tnb.2003.816225. [DOI] [PubMed] [Google Scholar]
- 34.Wen J, Lu H, Li T, Liang Z. Analytical solution to 3D SPECT reconstruction with non-uniform attenuation, scatter, and spatially variant resolution variation for variable focal-length fan-beam collimators. Proc SPIE. 2003;5032:1858–1867. [Google Scholar]
- 35.Funama Y, Noguchi Y, Shimamura M. Reduction of artifacts in degraded CT image by adaptive Wiener filter. Jpn J Med Electron Biol Eng. 2002;40:1–6. [Google Scholar]
- 36.Wegner FV, Both M, Fink RHA. Automated detection of elementary calcium release events using the à trous wavelet transform. Biophys J. 2006;90:2151–2163. doi: 10.1529/biophysj.105.069930. [DOI] [PMC free article] [PubMed] [Google Scholar]
- 37.Starck JL, Murtagh F. Automatic noise estimation from the multiresolution support. Publ Astron Soc Pac. 1998;110:193–199. [Google Scholar]
- 38.Stenborg G, Cobelli PJ. A wavelet packets equalization technique to reveal the multiple spatial-scale nature of coronal structures. Astron Astrophys. 2003;398:1185–1193. [Google Scholar]
- 39.Olivo-Marin JC. Extraction of spots in biological images using multiscale products. Pattern Recogn. 2002;35:1989–1996. [Google Scholar]
- 40.Muresan L, Heise B, Klement EP. Tracking fluorescent spots in wide-field microscopy images. Proc SPIE. 2006;6070:203–212. [Google Scholar]
- 41.Cornelis J, De Becker J, Bister M, Vanhove C, Demonceau G, Cornelis A. Techniques for cardiac image segmentation. Proceedings of the Annual International Conference of the IEEE Engineering in Medicine and Biology Society; IEEE; 1992. pp. 1906–1908. [Google Scholar]
- 42.Humphreys FJ, Bate PS, Hurley PJ. Orientation averaging of electron backscattered diffraction data. J Microsc. 2001;201:50–58. doi: 10.1046/j.1365-2818.2001.00777.x. [DOI] [PubMed] [Google Scholar]
- 43.Minato K, Tang YN, Bennett GW, Brill AB. Automatic contour detection using a fixed-point Hachimura–Kuwahara filter for SPECT attenuation correction. IEEE Trans Med Imaging. 1987;MI-6:126–133. doi: 10.1109/TMI.1987.4307812. [DOI] [PubMed] [Google Scholar]
- 44.van Staalduinen M, van der Lubbe JCA, Backer E. Circular analysis-based line detection filters for watermark extraction in x-ray images of etchings. Proceedings of the Tenth Annual Conference of the Advanced School for Computing and Imaging; ASCI; 2004. pp. 305–310. [Google Scholar]
- 45.de Ridder D, Duin RPW, Verbeek PW, van Vliet LJ. The applicability of neural networks to non-linear image processing. Pattern Anal Appl. 1999;2:111–128. [Google Scholar]


