Susceptibility weighted imaging (SWI) provides a new means to enhance contrast in magnetic resonance imaging (MRI) (1). Conventional imaging relies on the magnitude information to generate the image; the phase information on the other hand has typically been discarded except for a few applications in flow imaging. Historically, phase images have been difficult to interpret, as the valuable information about susceptibility changes between tissues was hidden by background field inhomogeneities caused by air/tissue interfaces and main magnetic field effects. It has been shown, however, that by using a special high-pass filter it is possible to remove most of these unwanted effects, leaving behind only the valuable information about susceptibility changes between tissues (2). The contrast in the phase image is complimentary to the magnitude contrast and the two can be combined to create what is now referred to as susceptibility weighted (SW) images. This triplet of images, magnitude, phase, and SW images, has now become part of the standard clinical neuroimaging protocol in at least one manufacturer’s product (Siemens Medical Systems).
SWI represents a new type of contrast (3–28) that is complementary to conventional spin-density, T1-, and T2-weighted imaging methods. SWI is particularly suited for imaging venous blood as it is very sensitive to deoxyhemoglobin, making it useful in imaging hemorrhages from trauma, visualizing blood products and the vascularization of tumors, and high resolution MR venography. It has also proven useful in other applications relating to iron such as measuring iron content in multiple sclerosis lesions, and aging (8).
Gradient Echo (GRE) Imaging
Susceptibility weighted images are collected with a long-TE, fully flow-compensated gradient echo scan; this can be in the form of a single-echo, multiple-echo, or echo-planar scan. Imaging with long echoes at 1.5T became possible by using 3D gradient echo imaging (29). This allowed for thinner slices (1–2mm) which reduced dephasing across the slice and improved image quality. In general, imaging at high resolution (~1mm3) reduces dephasing across the voxel and allows for longer echo times, from 40 to 80ms (30).
Flow compensation in all directions is useful at 1.5T because of the long echo times required and because phase is being used as a measure of susceptibility. This reduces flow related signal loss in the magnitude image, and flow induced phase changes in the phase image. Changes in the phase image are generated according to the formula (for a right handed system):
| (1) |
| (2) |
where γ is the gyromagnetic ratio, G represents a constant dependent on the geometry of the object, CS refers to chemical shift, and Bgeometry refers to the geometry of the brain and air/tissue interfaces. The last two terms represent unwanted field effects. The first two terms are of particular interest to us and are meant to represent the local changes in field, such as those that might be caused by iron in tissue. In equation (2), Δχ represents the local susceptibility change between tissues. The last two terms tend to be slowly varying spatial terms and can be to a large degree removed using a high-pass spatial frequency filter. Ideally, we can isolate the first two terms -γGΔχBoTE and –γΔBCSTE. Both of them lead to similar phase results inside the object of interest. A paramagnetic object causes a local increase in field and therefore a negative phase change relative to surrounding tissues.
Creating an SWI Data Set
The unwanted background field effects are usually removed from the phase image with a high-pass homodyne filter. To do this, a low-pass or smoothed version of the original image is created using an appropriate filter size (ranging from 32×32 up to 128×128, depending on the dataset). This is then divided into the original complex image, effectively removing the low spatial frequencies and generating a high-pass filtered phase image. When severe aliasing occurs, it is possible to get better results by first applying a phase unwrapping algorithm before the high-pass filter is applied. This removes much of the phase aliasing that could not be removed by the high-pass filter alone and helps improve results in areas of rapid phase change (near air/tissue interfaces such as the sinuses) (31). This filtered phase image is used in all subsequent steps and will be referred to as the SWI filtered phase image.
The contrast in the SWI filtered phase image is complimentary to that in the magnitude image. Our goal is to take advantage of features in both the magnitude and phase images, so the final step is to combine these features together to generate a SW image. The phase image is used to create a mask that is applied to the magnitude image. This mask focuses on certain phase values that will enhance the contrast of the original magnitude image. For example, if areas with increased iron are the subject of interest, then the mask is designed to enhance information related to negative phase as follows:
| (3) |
where the phase values can range from −π to π, ϕ(x) is the phase at location x, and f(x) is the phase mask. This phase mask can be multiplied by the original magnitude image an integer m number of times to create the SW image:
| (4) |
The number of times the mask is applied will change the contrast in the SW image. It has been shown that four multiplications produces good CNR for a wide range of phase values (32).
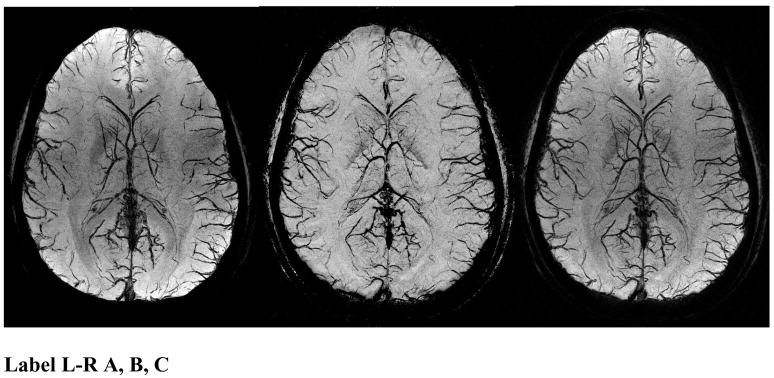
In each individual slice, the veins now appear dark and look like a set of circles or vessel cross-sections. To get a good SWI venogram, it is best to take a minimum intensity projection (mIP) over a number of slices (see Figure 1); this is similar to the maximum intensity projection (MIP) used in angiography. A disadvantage of using mIPs is that the dark background surrounding the brain will mask out the brain if it is included in the projection. The slices included in the mIP having the smallest visible brain area will dictate how much of the brain is visible in the final projection. This can be problematic at the top and bottom of the brain where the size changes very rapidly. This problem can be partly overcome by using a brain extraction algorithm, such as a complex threshold approach (33), to set the noise values outside the brain to a value much higher than the brain during the mIP processing and then back to zero afterward. Clinically, mIPs are usually limited to projections over 4–8mm, although it is certainly possible to project over more slices near the center of the brain or if the background has been removed.
Figure 1.
SWI data at 4T showing an mIP over 26mm of the magnitude (A, left), phase (B, center), and SW (C, right) images. The SW images combine the contrast of the magnitude and phase images. Note the magnitude and the SW processed data both have spatial inhomogeneities from rf penetration effects while the phase image (b) is remarkably uniform.
Venographic Contrast
The iron in deoxyhemoglobin in venous blood acts as an intrinsic contrast agent, causing T2*-related losses in the magnitude image and a shift in the phase relative to surrounding tissues in the phase image due to susceptibility differences. The oxygen in oxyhemoglobin shields the iron so the T2* and susceptibility effects are only seen in venous blood. This provides a natural separation of venous and arterial blood, and allows for venographic images without any arterial contamination.
The iron in deoxyhemoglobin induces changes to the local magnetic field, both inside and outside the veins. The changes to the local field depend on the shape of the structure of interest. If blood vessels are modeled as infinitely long cylinders, the field inside and outside the vessels can be analytically calculated. The field inside is given by:
| (5) |
where θ is the angle the cylinder makes to the main magnetic field and Δχ is the change in susceptibility between the cylinder and the surrounding substance. The field outside the cylinder is more complicated, and is given by:
| (6) |
where r is the distance to the axis of the cylinder and Φ is the angle the vector r makes to the projection of the main field direction onto a plane perpendicular to the axis of the vessel.
The changes in local field (which generate the contrast in the phase image, see Eq. (1)) depend on both the shape (modeled here as a cylinder) and the orientation of the blood vessels. This could potentially cause problems, as the field change inside the vessel will disappear at the so-called magic angle (ΔBin = 0 when θ = 54.7°) and vessels parallel to the field will have a positive phase shift (caused by a positive local field change) while vessels perpendicular to the field will have a positive phase shift (caused by a negative local field). Practically, this is overcome by collecting data with anisotropic resolution.
Data are usually collected with anywhere from a 2:1 to a 5:1 aspect ratio, meaning the voxels are two to five times larger in the direction of B0 than in the other two directions. The thicker slices allow the phase from outside the vessels (in the direction of B0) to average with the phase inside the vessel. This makes the average phase in a voxel negative for veins that are perpendicular to the field and at the magic angle even though the phase inside goes to zero or is positive. It has been shown that the optimal aspect ratio for maximum contrast in the phase image is generally 4:1, although it does depend on the resolution, the size of the vessels of interest, and even the field strength (34).
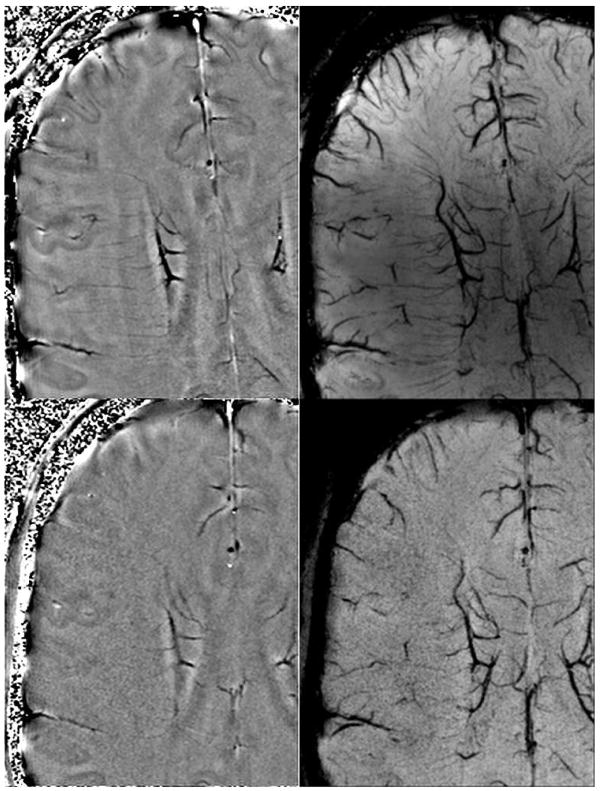
Since the phase shift is directly proportional to field strength and echo time (see Eq.(2)), scanning at higher fields allows the echo time to be shortened proportionally while maintaining the same contrast in the phase image. This fact, and the increased SNR available at higher fields, makes SWI well suited for high field and ultra high field MR as the shorter echo times make it possible to scan much faster (see Figure 2). Further, since SWI uses small flip angles, there is little problem with specific absorption rate (SAR). Increases in field strength allow increased resolution and generally improved image quality (5, 35), although 1.5T can still produce very nice SWI venographic images. Table 1 shows acceptaple parameters for optimal venous contrast at different field strengths.
Figure 2.
Filtered phase images (A & B, left top and left bottom) and mIP of SW images over 8mm (C & D, right top and right bottom) at 3T (B, D bottom) and 7T (A,C top) at identical resolutions on the same volunteer. This shows the improved visualization of veins at higher fields due to the higher SNR and increased susceptibility even at the same resolution. Imaging parameters are TR/TE/FA = 45ms/28ms/15° at 3T and 35ms/16ms/15° at 7T with identical resolutions of 0.44×0.44×2mm3 (images courtesy of Yulin Ge, New York University).
Table 1.
Suggested parameters for SWI as a function of field strength. Usually a bandwidth of 100 Hz/pixel is used but lower bandwidths are possible at the expense of more distortion near air/tissue interfaces and loss of rapidly flowing blood signal in the center of the arteries.
Recommended SWI Venography Parameters
| Field | FA in degrees | TR in ms | TE in ms |
|---|---|---|---|
| 1.5T | 20 | 50 | 40 |
| 3T | 12 | 30 | 20 |
| 4T | 12 | 25 | 15 |
| 7T | 10–15 | 25 | 10–15 |
Simultaneous MRV and MRA
Single echo approach
SWI provides a natural separation of arteries and veins, making it possible to image both simultaneously and have them be easily evaluated separately. As explained above, veins will be dark due to T2* losses and SWI processing with the phase image, while arteries will be bright from time-of-flight (TOF) inflow enhancement. It is possible to increase the contrast in the arteries without overly degrading the venography by using a slightly higher flip angle, short TR, and a thin slab. This is particularly effective at high and ultra high field as shorter echoes can be used to reduce flow dephasing in the arteries without affecting the venous contrast; this technique is unsuitable for 1.5T and lower fields.
By imaging both the arteries and the veins, a more complete picture of the vasculature can be created. The advantage of collecting both in a single acquisition is that there will be no registration artifacts and that their relationship to each other and to the overall brain tissue structure can be carefully reviewed.
In conventional imaging, a contrast agent is often used to enhance the arterial signal, but a longstanding problem has been the veins’ tendency to also get bright in the steady state. However, that is much less a difficulty with SWI because the veins may actually get darker in the presence of a contrast agent (and the arteries brighten), making it possible to do an even better job imaging both parts of the vascular system simultaneously. The shortened T1 boosts the signal in the arteries and veins but the increased venous signal leads to increased T2* or signal cancellation effects: this is referred to as a T1 to T2* coupling effect. The question then arises, “How are the data processed to arrive at both an MRA and MRV projection?”
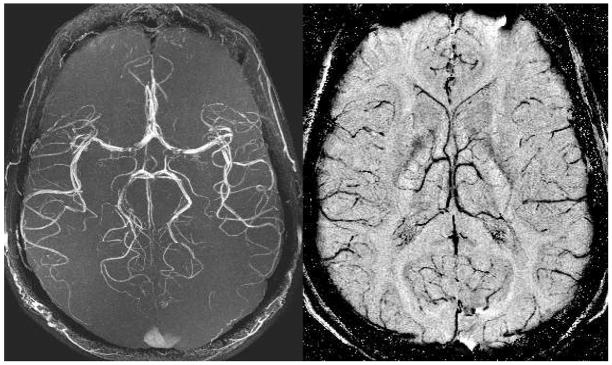
The arteries can be visualized using a standard MIP and veins can be visualized with a mIP after SWI processing. The choice of flip angle and echo time are particularly important in determining image quality. While a higher flip angle helps increase the TOF effect and enhance contrast in the arteries, it will also start to degrade the venography by oversuppressing the CSF. Likewise, the choice of echo time is also a compromise, for a longer echo time increases venous contrast, but will lead to flow-related losses in rapidly flowing arteries. This is due to the fact that higher-order flow effects for the low-bandwidth gradients being used, as well as the flow through local field inhomogeneities (which disrupt the flow compensation) will not be flow-compensated. Generally a slightly shorter echo time than is normally run (15ms instead of 20ms at 3.0T), higher bandwidth (120–140 Hz/pixel), and very thin slices (0.5 mm, to reduce dephasing) give good results, especially with the use of a contrast agent. However, there can be problems visualizing the faster-flowing blood (in the middle cerebral arteries, for example). Some examples of this approach are given in Figure 3.
Figure 3.
Both the MRA maximum intensity projection over 128 slices (A, left) and the minimum intensity projection over 32 SWI filtered phase slices (B, right) are acquired from a single echo SWI data set. The data were acquired at 3T with: TR = 35ms, TE = 15ms, FA = 15°, 0.5mm isotropic resolution, and 128 partitions. These high resolution scans depict the usual M4 arteries with excellent edge definition. There are some flow related losses in the MCA. The venous network is seen to be quite different than the arterial network in its distribution of vessels.
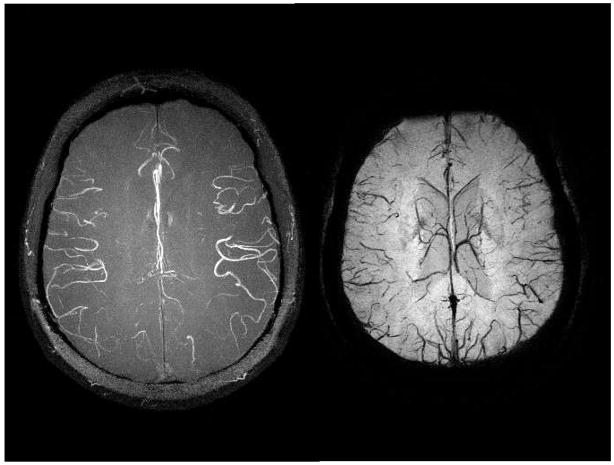
The thin slices improve the angiography by reducing through-plane dephasing, but SWI processing suffers as the data are not collected with the optimal 4:1 aspect ratio (discussed previously). This can be overcome by combining four slices together to generate a new dataset with a resolution of 0.5mm × 0.5mm × 2.0mm which has the 4:1 aspect ratio. This new data can then be used to do the SWI processing, resulting in improving the quality of the venography (see Figure 4).
Figure 4.
Both the MRA maximum intensity projection (A, left) and the minimum intensity projection over SWI processed data (B, right) are acquired from a single echo SWI data set with 0.5mm isotropic resolution. The data were acquired at 4T with: TR = 26ms, TE = 15ms, FA = 11°, and 80 partitions. These high resolution scans depict the usual M4 arteries with excellent edge definition. Again, the venous anatomy is seen to be quite different than the arterial pattern. The 4T image shows the capability of higher fields to produce better MRAV images.
Double echo approach
An alternate approach is to use a double echo scan with the short echo used to generate the angiography and the long echo for the venography (36). This is particularly useful at 1.5T as the long echo times required for SWI give ample time to insert a short echo, and are too long to generate a useful angiography. This becomes less effective or necessary at higher field strengths because of the need for higher bandwidth. Further, the shorter optimal echo times for SWI no longer suffer from the same arterial dephasing problems.
The approach taken by Du et al. added an extra echo to the flow-compensated GRE used for SWI. Flow compensation was applied in both phase-encoding directions. Asymmetrical echoes were used to save time and achieve a shorter echo time for the first echo. Flyback gradients were also added between the two echoes to maintain the flow compensation on both echoes. In this way, a short-echo TOF MRA dataset and a long-echo SWI MRV dataset are obtained in the same amount of time as collecting either of them separately.
Clinical Applications
Traumatic Brain Injury
We show here some new results related to venous involvement in traumatic brain injury (TBI). This is an area of interest throughout the world and particularly in the US. TBI is a major cause of morbidity, mortality, disability and lost years of productive life. Tong, et al. have shown that SWI was three to six times more sensitive than conventional T2*-weighted gradient-echo sequences in detecting the size, number, volume, and distribution of hemorrhagic lesions in diffuse axonal injury (DAI) (4, 25, 26). From this work it is clear that SWI shows an increase in the number and size of lesions compared to other sequences. Tong’s studies (4, 25, 26) also show that most patients had lesions in frontal white matter or parieto-temporo-occipital gray or white matter. SWI could play a very meaningful role in establishing the degree of injury more accurately, providing valuable prognostic information, and guiding the management and rehabilitation of patients with head injury.
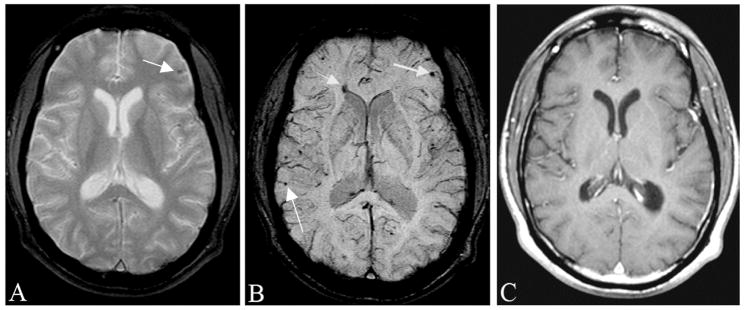
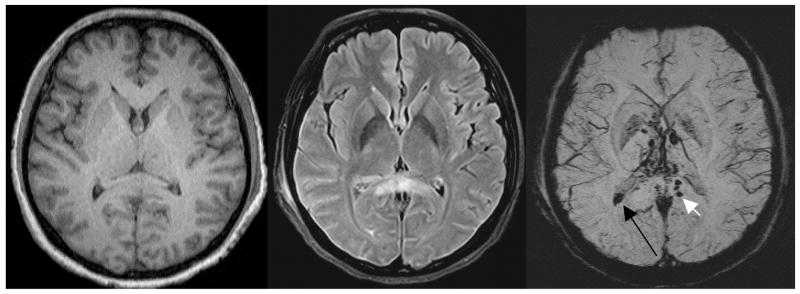
Here, we show a case of a motorcycle accident where conventional MR methods were unable to locate the many bleeds present (Figure 5). The gradient echo image shows evidence of a single microbleed. On the other hand, SWI shows a number of damaged veins, from the confluence at the large septal vein, to several smaller veins at the periphery of the brain. The smaller microbleeds are likely due to shearing of the venules. The post-contrast T1-weighted image shows no evidence of vascular damage (Figure 5, Right). A more dramatic example is shown in Figure 6, where damage can be clearly seen in the corpus callosum.
Figure 5.
Traumatic brain injury is often occult to conventional imaging methods in CT or MRI. Here, we show a case of a motorcycle accident where conventional MR methods were unable to locate the many bleeds present. A, The gradient echo image shows some sign of a microbleed (arrow). B, SWI shows a number of venous confluences (particularly striking is the junction of the medullary veins with the septal vein) that have shearing injury. The smaller microbleeds are likely due to shearing of the venules (see also Figure 12). C, The post-contrast T1-weighted image shows no evidence of vascular damage.
Figure 6.
An example of severe traumatic brain injury. The T1 image (A, left) shows dark signal in the lateral horns of the ventricles and some suspicious low signal intensity in the corpus callosum. The FLAIR image (B, center) shows some edema in the corpus callosum. The SWI data (C, right) clearly shows a hemorrhage inside the posterior horn of the right lateral ventricle (long black arrow) and a hemorrhage in the corpus callosum (short white arrow). (Images courtesy of Lei Jing, Tianjin Huan Hospital, China.)
Vascular Malformations and Venous Disease
Cerebral vascular malformations result from localized defects during vascular development. Most malformations are present at birth and may or may not grow with time. Cerebral cavernous malformations, developmental venous angiomas, and capillary telangiectasias have attenuated flow and can be less conspicuous or entirely missed by conventional neuroimaging techniques. While lesions that have previously bled can be detected by conventional MR imaging, those that have not bled tend to show as faint enhancements after contrast administration. Since SWI measures the presence of deoxyhemoglobin, there is no dependence on flow to visualize this blood and so these lesions are easily seen (28).
Similar arguments on behalf of SWI hold for studying Sturge-Weber syndrome (SWS). SWS is a rare neurocutaneous disorder, typically manifested in children and characterized by cutaneous angioma, glaucoma, and leptomeningeal venous angiomatosis. We have shown that T1-weighted gadolinium post-contrast (T1-Gd) MRI can demonstrate focal cortical atrophy, contrast-enhancing leptomeningeal angiomatosis, and abnormal cerebral veins. T1-Gd is currently an imaging standard for clinical SWS diagnosis (12). SWI complements conventional MRI by demonstrating numerous deep medullary veins that are not well visualized by any other MR imaging sequence, particularly in the early mild cases of SWS.
Cerebral venous thrombosis (CVT) is an infrequent neurological condition but one that is notoriously difficult to diagnose because of its non-specific clinical presentation (37). Direct evidence of sinus thrombosis such as “triangle sign” and “empty delta” on CT and loss of the normal flow voids on MRI can be easily missed unless clinical suspicion is high and direct signs are actively sought (38). Indirect signs of venous thrombosis vary, including cerebral edema, infarction and hemorrhage. CVT can be potentially deadly if it is not diagnosed and thrombolytic treatment is not started in time (39, 40). SWI has become a useful method to evaluate CVT by demonstrating venous stasis and collateral slow flow. Dural sinus thrombosis will cause the concentration of deoxyhemoglobin to increase in the involved veins, which will appear as a prominent hypointense signal in the SWI data. If treated successfully, this effect will disappear in the SWI data.
Atherosclerosis
Outside of imaging atherosclerosis in the carotid artery, another potential application of MRI is in imaging peripheral arterial occlusive disease (PAD). Similar to atherosclerosis, PAD is also a major clinical problem affecting 8 to 10 million Americans (41). To date, there have been few MRI studies of PAD (42–46) and most have used the black blood spin echo T2 approach. These techniques have had some success with imaging the wall of the femoral artery but have some difficulty suppressing the venous blood signal.
Calcification plays a significant role in atherosclerosis. Calcification scores have been associated with the stage of the disease and may be a better marker than the traditional risk factors in identifying people who are at high risk for amputation (47). The presence or absence of atherosclerosis also plays a key role in deciding whether treatment should consist of percutaneous transluminal angioplasty (PTA) or surgery (48, 49). In this section, we show that it is possible to image the vessel wall and calcifications with SWI without the need to suppress the signal from the blood. We show that it is possible to use the phase as a complement to the magnitude SWI MRA data as a means to discriminate calcium from hemorrhage.
A high-resolution SWI scan was performed at 3T using an 8 channel transmit/receive knee coil with an echo time of 15.6 ms and a low bandwidth of 80 Hz/pixel. The data were collected sagittally with an in-plane resolution of 0.5mm by 0.5mm and a slice thickness of 1mm. A flip angle of 10° was used to maximize inflow effects and minimize saturation effects. The MR data were compared to multi-detector CT data using a 64-detector computed tomography scanner (LightSpeed VCT, GE Healthcare, United States). The scan protocol was as follows: 64mm×0.625mm collimation, interval 0.625mm, 120kv, 420mA, pitch 1.375, tablefeed 110mm, with a 512×512 matrix size. The MDCT scanning ranged from the upper pole of the patella to the fibular head.
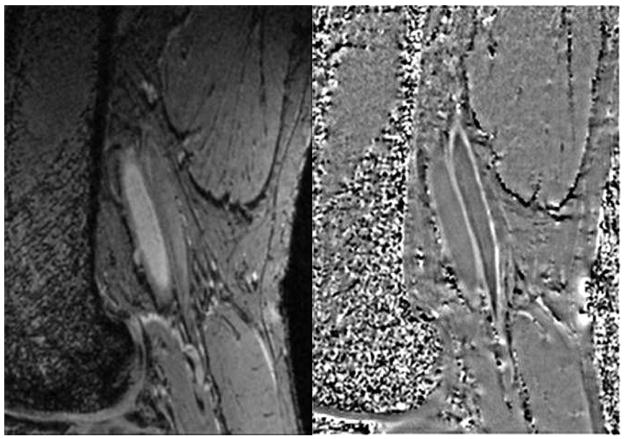
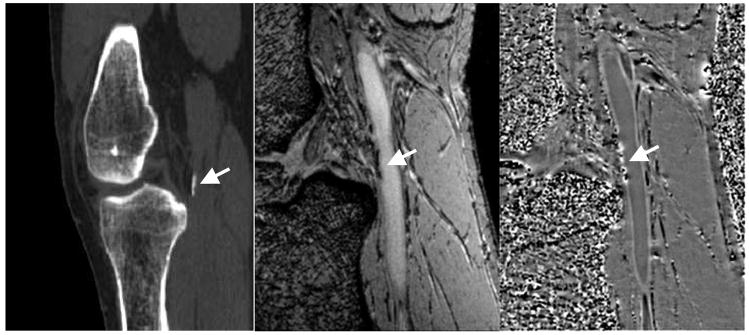
The magnitude SWI data are similar to low-flip-angle TOF MRA imaging. The phase images show that the vessel walls are slightly diamagnetic compared to surrounding tissue (Figure 7). The vessel walls shown in Figure 7 are for a healthy volunteer, show no disease and are straight (as one might expect). For patients with calcifications, comparisons between SWI and MDCT have been very encouraging. Both the size of the calcification and its distance to other structures appears the same in the SWI and MDCT data. The magnitude images clearly show the vessel lumen from the bright blood and the calcifications in the darker vessel wall (see Figure 8). The SWI filtered phase images show the walls as being diamagnetic and the calcification as being much more diamagnetic. One advantage of SWI is that there is little dependence on blood flow for either patent or stenosed vessels. Therefore, SWI offers an entirely new way to study and visualize both the healthy and diseased vessel wall.
Figure 7.
Delineation of femoral artery wall in a normal subject. Magnitude image (A, left) shows the lumen bright which serves as a good marker between the inside wall and blood. Note the vessel wall is straight with no indication of wall thickening. The phase image (B, right) shows the vessel wall with a brighter than background signal indicating that the vessel wall is diamagnetic. The phase of the venous wall appears to be brighter than that of the arterial wall indicating it is even more diamagnetic than the arterial wall.
Figure 8.
CT scan (A,left) showing calcification at the edge of the popliteal artery just behind the knee. Magnitude gradient echo image (B, center) showing the signal loss from the calcification in the same area. SWI filtered phase image (C, right) showing the diamagnetic effect from the calcification. Note the similar shape and extent of the calcification in both the CT and MR results.
Deep venous thrombosis and blood settling
Deep venous thrombosis (DVT) is a common occurrence. A recent study showed that for 2000 DVT patients with age-matched spouses, the probability of developing DVT after being stationary in a plane, train, or car for more than 4 hours was increased more than twofold (50). DVT is known to occur when there is blood stasis and where there is damage to the vessel wall (51). Blood stasis is known to occur when someone is seated or lying still for a long period (52, 53).
As discussed above, SWI relies on the susceptibility shift caused by deoxyhemoglobin in the venous blood to generate contrast. SWI is only sensitive to the deoxyhemoglobin in blood, so an increased concentration of red blood cells would cause increased contrast; this makes it ideal for imaging blood settling or the early formation of potential clots. SWI has been used to image the veins of the leg and to determine if the red blood cells settle during rest. Perhaps blood settling will prove to be a potential risk factor for DVT formation. As an initial investigation, we have investigated blood settling with SWI as described below.
A total of 9 subjects (18–58 years old) were scanned on a 1.5T Siemens Sonata system with a single-channel knee coil. A three-dimensional SWI sequence with the following image parameters was used: TR = 21 ms, TE = 9.95 ms, FA = 20°, BW = 190 Hz/pixel, a matrix of 384×512×64, a resolution of 0.39×0.39×1.6 mm3, an acquisition time of 8 minutes and no parallel imaging. The area of interest was below the knee at the level of the popliteal trifurcation with the region of interest (ROI) centered 12 cm below the tibial plateau. The knee was positioned to be slightly bent within the coil.
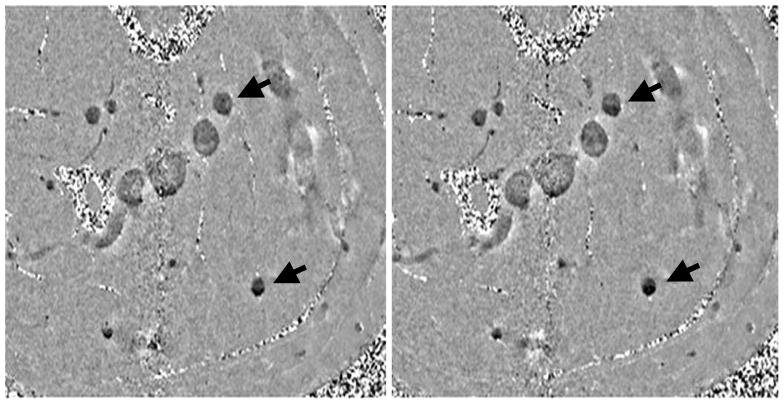
A layering effect in the veins was observed, with the bottom of the vein (defined according to the direction of gravity) accumulating much more phase than the top layer. The layering was also observed to increase with time spent stationary in the magnet. Two scans were performed on each subject, the early scan (~10 minutes stationary) showed very little or no layering, while the late scan (~40 minutes stationary) showed increased layering (see Figure 9). The larger vessels showed an increase in size of the dark layer at the later time points, filling up to roughly 70% of the vessel, while some of the smaller vessels became completely dark in the later scans as if the flow to them had completely stopped and all the oxygen had been used up.
Figure 9.
(A, Left) early scan (~10min) and (B, right) late scan (~40min). Notice in the late scan the dark layers on the bottom are more prominent than in the early scan. Male, age 54.
The layering effect was more prominent in the older subjects; younger subjects (including two father-son matched pairs) showed less layering in fewer veins, while older subjects showed much more pronounced layering in a greater number of veins. The younger subjects tended to have smaller veins with faster flow, while the veins of the older subjects were much larger (up to twice the diameter) with slower flow. Layering was seen to some extent in all subjects except the 18 year old. One other subject (female, 49) did not initially show layering, but after being kept in the magnet an additional 20 minutes (60 minutes total) and rescanned some minor layering in the smaller veins was observed.
The separation of the blood into different layers after less than 40 minutes has major implications. The denser red blood cells appear to sink as the blood flow from certain vessels seems to be naturally attenuated and shunted to other vessels. Deoxyhemoglobin in red blood cells is responsible for the phase shift in venous blood and as the cells settle out, the increased concentration of deoxyhemoglobin causes an increased phase shift in the lower layer.
This method could potentially be used as a screening procedure to determine a patient’s risk factor for developing a DVT. The increased concentration of red blood cells could increase the likelihood of a clot forming and the layering appears to be correlated with age which is a well-known risk factor for DVT (51). However, these remain unproven postulates at this time.
Imaging oxygen saturation with SWI
Measuring oxygen saturation in the brain is very important for monitoring the oxygen extraction fraction and the amount of oxygen getting to the tissue. This is important for stroke and venous thrombosis. SWI offers the potential to investigate oxygen saturation by measuring the phase in 3D throughout a large field-of-view. In addition to neuroimaging, such a method could also be useful for measuring the oxygen saturation in the vena cava and in other parts of the body non-invasively. In this section, we will discuss the ability to use phase information as a means to monitor oxygen saturation in vessels. This was first done in 1997 to monitor changes in oxygen saturation during an fMRI motor task experiment (54). Similar to the SWI approach taken today, a fully velocity-compensated flow sequence was used to make it possible to look at the susceptibility in the veins. However, before the results of Eq. (5) can be taken advantage of, we need to know the susceptibility difference between deoxygenated and oxygenated blood (to which we refer as χdo). Two distinct values have been quoted in the last 20 years, but only one can be correct. Weisskoff, et al. has quoted χdo = 0.18ppm in cgs units (55), while Spees, et al. has quoted χdo = 0.27ppm in cgs units(56). Our work demonstrates that using the phase information from an SWI sequence, it is the latter value which would appear to make the MR imaging data agree with the known physiologic data. For veins, we can write
| (7) |
If a specific substitution for χdo is made, for example 0.18 ppm, then a certain value for Y (the oxygen saturation) can be found once the other variables, Hct (hematocrit), B0 (the main field), and TE (the echo time) are known. If, on the other hand, Y is known as well, then χdo can be determined. Since χdo is usually assumed to be 0.18 ppm, one can look instead for the deviation of χdo from this value.
In this work, the phase difference between arterial and venous blood is used to determine oxygen saturation. Therefore, substituting χdo with Aχdo and using
| (8) |
A (and hence χdo) can be found from:
| (9) |
All data were acquired using a Siemens 1.5 T Magnetom Sonata MR Imager (Siemens Medical Systems, Erlangen, Germany) with a flexible four-channel surface array coil in the thigh region of the leg. The goal was to obtain high-resolution cross-sectional images of the femoral vein. Each subject was positioned inside the magnet feet first in a supine posture. A localizer scan was run to obtain a set of scout (or reference) images. The scout images were used to determine the imaging volume over which a 2D time-of-flight magnetic resonance venographic (MRV) sequence was run transversely with a saturation band to reduce signal from the inflowing arterial blood so as to obtain just the venous blood signal from the imaging volume. The imaging parameters were: TR=30 ms, TE=6 ms, FOV = 240 mm × 240 mm, Nx = Ny = 256, FA = 20°, BW = 400Hz/pixel, Nz=64 and phase encoding direction laterally (left to right). Using these venous images, 3D projection images were generated to determine how best to acquire the next set of 3D gradient echo images so that the vein would be perpendicular to the imaging slab in the center of the imaging volume. Shimming was then performed in the imaging volume to optimize the static field homogeneity. Transverse images were acquired typically using a flow-compensated, strongly T2*-weighted, high-bandwidth, four- or five-echo gradient echo susceptibility weighted imaging (SWI) sequence. This sequence was designed with a symmetric echo for each echo. From this data, the arterial-venous phase difference was found for four volunteers.
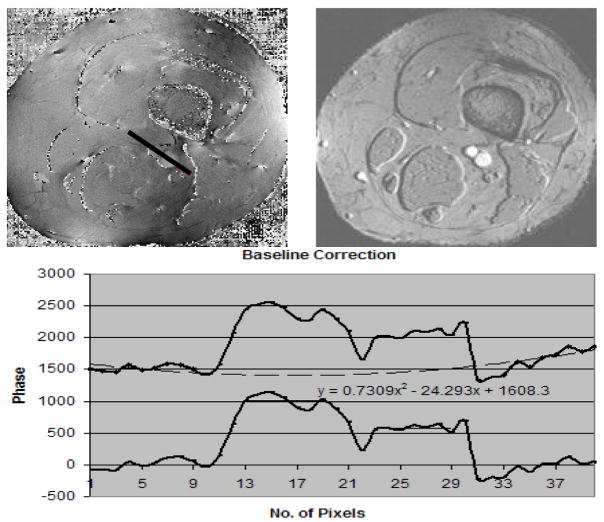
To extract the phase, we used either the high-pass filter approach or a parabolic fitting procedure excluding the vessels to remove the local background field variations (57–59). The latter method was found to give more consistent results between subjects than using high-pass filtering (see Figure 11). The real challenge comes in obtaining the actual oxygen saturation for the peripheral veins. We were not allowed to extract blood from this part of the body because of the need for the subjects to walk out of the scanner and leave afterward (weight bearing on this part of the body meant a higher potential for the puncture not to heal or lead to bleeding). Therefore, we turned to two other approaches. One was to measure T2* (since previous research claimed to correlate T2* with oxygen saturation from in vitro measurements (60)). The problem with this approach was that our T2* measurements were very inconsistent. We now understand why this was the case; based on the results in the previous section (where we saw that the venous blood can develop an inhomogeneous signal from blood separation), an accurate T2* measurement in vivo is very difficult.
Figure 11.
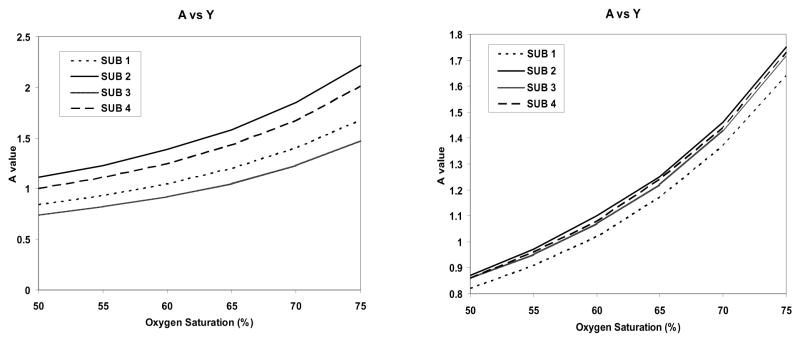
A(left) Plot of A versus oxygen saturation for the 4 subjects using a high pass filter approach to remove low spatial frequency background. B (right) Plot of A versus oxygen saturation for the 4 subjects using a least squares fit to a two dimensional quadratic function to remove the phase. If the oxygen saturation is known to be 70% that would suggest that A = 1.5.
The second approach was to go to the literature to see what invasive measures showed for oxygen saturation. Disappointingly, the results in the field have a very high error leading to results for the in vivo oxygen saturation measurements—which can vary from 50% to 80%, a range that encompasses the values of 55% (A = 1) or 70% (A = 1.5) that we are interested in finding. However, almost all clinically invasive studies using infrared sensors show that if the femoral artery blood flow was greater than 200ml/min, the femoral venous oxygen saturation was 70% or greater (61–65). If we take this at face value for young, normal volunteers, then our data suggest that A = 1.5 is the correct choice.
The correct choice of χdo is critically important for predicting the forward problem; that is, measuring the oxygen saturation from the phase of blood vessels once χdo is known with certainty. In principle, the SWI sequence can be used as a means to measure oxygen saturation throughout the body once the geometry of the vessel is taken into account. In the case of changes in blood oxygen saturation, a relative value can be found even without knowing the geometrical correction factors (66). The correct choice of χdo will determine the physiologic value of the oxygen saturation. For example, Haacke, et al. (54) quoted 55% oxygenation in the pial veins in the brain during the resting state and 70% oxygenation during activation. If A = 1.5, i.e., χdo = 0.27ppm, these numbers would change to 70% during resting and 80% during activation.
Assuming for now that A = 1.5, we can rewrite Eq.(8) as
| (10) |
where Bo is given in Tesla. From Eq.(9), we can find Y, the oxygen saturation in any given vein.
Conclusion
By combining filtered phase and magnitude information to create a novel and intrinsic source of contrast, susceptibility weighted imaging has shown great promise in clinical angiography and venography. SWI has contributed to new insights into traumatic brain injury, the role of calcification in atherosclerosis and the possible relationship between blood settling and deep venous thrombosis. A further contribution from SWI to DVT research (and also stroke) involves its application to the noninvasive measurement of oxygen saturation in the brain and in other tissues. Altogether, SWI offers manifold and diverse avenues for further research employing angiographic and venographic techniques.
Figure 10.
(A, the top left image) is the associated phase image to B (the top right image) which represents the magnitude image from a TE = 25ms scan The fitted line shows the profile through the phase of the background, artery and vein. The phase values along the profile (black line starting from bottom right moving to top left of the line) in the A runs through the background tissue, artery and vein which are measured. The phase values from the background are then fitted to a parabola and subtracted from the phases along the profile (black line) to create a background corrected phase of the artery (larger vessel) and vein (smaller vessel).
Acknowledgments
This work was supported by NIH Grant No. 2R01 HL062983-04A2 and by Siemens Medical Solutions USA, Inc.
Footnotes
Publisher's Disclaimer: This is a PDF file of an unedited manuscript that has been accepted for publication. As a service to our customers we are providing this early version of the manuscript. The manuscript will undergo copyediting, typesetting, and review of the resulting proof before it is published in its final citable form. Please note that during the production process errors may be discovered which could affect the content, and all legal disclaimers that apply to the journal pertain.
References
- 1.Reichenbach JR, Venkatesan R, Schillinger DJ, et al. Small vessels in the human brain: MR venography with deoxyhemoglobin as an intrinsic contrast agent. Radiology. 1997 Jul;204(1):272–277. doi: 10.1148/radiology.204.1.9205259. [DOI] [PubMed] [Google Scholar]
- 2.Haacke EM, Dmitriy SL, Yablonskiy A, et al. In vivo validation of the bold mechanism: A review of signal changes in gradient echo functional MRI in the presence of flow. International Journal of Imaging Systems and Technology. 1995;6(2–3):153–163. [Google Scholar]
- 3.Ashwal S, Babikian T, Gardner-Nichols J, et al. Susceptibility-weighted imaging and proton magnetic resonance spectroscopy in assessment of outcome after pediatric traumatic brain injury. Arch Phys Med Rehabil. 2006 Dec;87(12 Suppl 2):S50–58. doi: 10.1016/j.apmr.2006.07.275. [DOI] [PubMed] [Google Scholar]
- 4.Babikian T, Freier MC, Tong KA, et al. Susceptibility weighted imaging: neuropsychologic outcome and pediatric head injury. Pediatr Neurol. 2005 Sep;33(3):184–194. doi: 10.1016/j.pediatrneurol.2005.03.015. [DOI] [PubMed] [Google Scholar]
- 5.Barth M, Nobauer-Huhmann IM, Reichenbach JR, et al. High-resolution three-dimensional contrast-enhanced blood oxygenation level-dependent magnetic resonance venography of brain tumors at 3 Tesla: first clinical experience and comparison with 1.5 Tesla. Invest Radiol. 2003 Jul;38(7):409–414. doi: 10.1097/01.RLI.0000069790.89435.e7. [DOI] [PubMed] [Google Scholar]
- 6.de Souza JM, Domingues RC, Cruz LC, Jr, et al. Susceptibility-weighted imaging for the evaluation of patients with familial cerebral cavernous malformations: a comparison with t2-weighted fast spin-echo and gradient-echo sequences. AJNR Am J Neuroradiol. 2008 Jan;29(1):154–158. doi: 10.3174/ajnr.A0748. [DOI] [PMC free article] [PubMed] [Google Scholar]
- 7.Essig M, Reichenbach JR, Schad L, et al. [High resolution MR-venography of cerebral arteriovenous malformations] Radiologe. 2001 Mar;41(3):288–295. doi: 10.1007/s001170050989. [DOI] [PubMed] [Google Scholar]
- 8.Haacke EM, Cheng NY, House MJ, et al. Imaging iron stores in the brain using magnetic resonance imaging. Magn Reson Imaging. 2005 Jan;23(1):1–25. doi: 10.1016/j.mri.2004.10.001. [DOI] [PubMed] [Google Scholar]
- 9.Haacke EM, DelProposto ZS, Chaturvedi S, et al. Imaging cerebral amyloid angiopathy with susceptibility-weighted imaging. AJNR Am J Neuroradiol. 2007 Feb;28(2):316–317. [PMC free article] [PubMed] [Google Scholar]
- 10.Harder SL, Hopp KM, Ward H, et al. Mineralization of the deep gray matter with age: a retrospective review with susceptibility-weighted MR imaging. AJNR Am J Neuroradiol. 2008 Jan;29(1):176–183. doi: 10.3174/ajnr.A0770. [DOI] [PMC free article] [PubMed] [Google Scholar]
- 11.Hermier M, Nighoghossian N. Contribution of susceptibility-weighted imaging to acute stroke assessment. Stroke. 2004 Aug;35(8):1989–1994. doi: 10.1161/01.STR.0000133341.74387.96. [DOI] [PubMed] [Google Scholar]
- 12.Hu J, Yu Y, Juhasz C, et al. MR susceptibility weighted imaging (SWI) complements conventional contrast enhanced T1 weighted MRI in characterizing brain abnormalities of Sturge-Weber Syndrome. J Magn Reson Imaging. 2008 Aug;28(2):300–307. doi: 10.1002/jmri.21435. [DOI] [PMC free article] [PubMed] [Google Scholar]
- 13.Liang L, Korogi Y, Sugahara T, et al. Detection of intracranial hemorrhage with susceptibility-weighted MR sequences. AJNR Am J Neuroradiol. 1999 Sep;20(8):1527–1534. [PMC free article] [PubMed] [Google Scholar]
- 14.Matsushita T, Anami D, Arioka T, et al. Basic study of susceptibility-weighted imaging at 1.5T. Acta Med Okayama. 2008 Jun;62(3):159–168. doi: 10.18926/AMO/30978. [DOI] [PubMed] [Google Scholar]
- 15.Mentzel HJ, Dieckmann A, Fitzek C, et al. Early diagnosis of cerebral involvement in Sturge-Weber syndrome using high-resolution BOLD MR venography. Pediatr Radiol. 2005 Jan;35(1):85–90. doi: 10.1007/s00247-004-1333-2. [DOI] [PubMed] [Google Scholar]
- 16.Pinker K, Noebauer-Huhmann IM, Stavrou I, et al. High-resolution contrast-enhanced, susceptibility-weighted MR imaging at 3T in patients with brain tumors: correlation with positron-emission tomography and histopathologic findings. AJNR Am J Neuroradiol. 2007 Aug;28(7):1280–1286. doi: 10.3174/ajnr.A0540. [DOI] [PMC free article] [PubMed] [Google Scholar]
- 17.Rauscher A, Sedlacik J, Barth M, et al. Non-invasive assessment of vascular architecture and function during modulated blood oxygenation using susceptibility weighted magnetic resonance imaging. Magn Reson Med. 2005 Jul;54(1):87–95. doi: 10.1002/mrm.20520. [DOI] [PubMed] [Google Scholar]
- 18.Schad LR. Improved target volume characterization in stereotactic treatment planning of brain lesions by using high-resolution BOLD MR-venography. NMR Biomed. 2001 Nov–Dec;14(7–8):478–483. doi: 10.1002/nbm.714. [DOI] [PubMed] [Google Scholar]
- 19.Sedlacik J, Rauscher A, Reichenbach JR. Obtaining blood oxygenation levels from MR signal behavior in the presence of single venous vessels. Magn Reson Med. 2007 Nov;58(5):1035–1044. doi: 10.1002/mrm.21283. [DOI] [PubMed] [Google Scholar]
- 20.Sehgal V, Delproposto Z, Haacke EM, et al. Clinical applications of neuroimaging with susceptibility-weighted imaging. J Magn Reson Imaging. 2005 Oct;22(4):439–450. doi: 10.1002/jmri.20404. [DOI] [PubMed] [Google Scholar]
- 21.Sehgal V, Delproposto Z, Haddar D, et al. Susceptibility-weighted imaging to visualize blood products and improve tumor contrast in the study of brain masses. J Magn Reson Imaging. 2006 Jul;24(1):41–51. doi: 10.1002/jmri.20598. [DOI] [PubMed] [Google Scholar]
- 22.Somasundaram S, Kesavadas C, Thomas B. Susceptibility weighted imaging in holohemispheric venous angioma with cerebral hemiatrophy. Neurol India. 2008 Jan–Mar;56(1):104–105. doi: 10.4103/0028-3886.39336. [DOI] [PubMed] [Google Scholar]
- 23.Tan IL, van Schijndel RA, Pouwels PJ, et al. MR venography of multiple sclerosis. AJNR Am J Neuroradiol. 2000 Jun–Jul;21(6):1039–1042. [PMC free article] [PubMed] [Google Scholar]
- 24.Thomas B, Somasundaram S, Thamburaj K, et al. Clinical applications of susceptibility weighted MR imaging of the brain - a pictorial review. Neuroradiology. 2008 Feb;50(2):105–116. doi: 10.1007/s00234-007-0316-z. [DOI] [PubMed] [Google Scholar]
- 25.Tong KA, Ashwal S, Holshouser BA, et al. Diffuse axonal injury in children: clinical correlation with hemorrhagic lesions. Ann Neurol. 2004 Jul;56(1):36–50. doi: 10.1002/ana.20123. [DOI] [PubMed] [Google Scholar]
- 26.Tong KA, Ashwal S, Holshouser BA, et al. Hemorrhagic shearing lesions in children and adolescents with posttraumatic diffuse axonal injury: improved detection and initial results. Radiology. 2003 May;227(2):332–339. doi: 10.1148/radiol.2272020176. [DOI] [PubMed] [Google Scholar]
- 27.Warmuth C, Gunther M, Zimmer C. Quantification of blood flow in brain tumors: comparison of arterial spin labeling and dynamic susceptibility-weighted contrast-enhanced MR imaging. Radiology. 2003 Aug;228(2):523–532. doi: 10.1148/radiol.2282020409. [DOI] [PubMed] [Google Scholar]
- 28.Wycliffe ND, Choe J, Holshouser B, et al. Reliability in detection of hemorrhage in acute stroke by a new three-dimensional gradient recalled echo susceptibility-weighted imaging technique compared to computed tomography: a retrospective study. J Magn Reson Imaging. 2004 Sep;20(3):372–377. doi: 10.1002/jmri.20130. [DOI] [PubMed] [Google Scholar]
- 29.Reichenbach JR, Venkatesan R, Yablonskiy DA, et al. Theory and application of static field inhomogeneity effects in gradient-echo imaging. J Magn Reson Imaging. 1997 Mar–Apr;7(2):266–279. doi: 10.1002/jmri.1880070203. [DOI] [PubMed] [Google Scholar]
- 30.Akbudak E, Norberg RE, Conturo TE. Contrast-agent phase effects: an experimental system for analysis of susceptibility, concentration, and bolus input function kinetics. Magn Reson Med. 1997 Dec;38(6):990–1002. doi: 10.1002/mrm.1910380619. [DOI] [PubMed] [Google Scholar]
- 31.Rauscher A, Barth M, Reichenbach JR, et al. Automated unwrapping of MR phase images applied to BOLD MR-venography at 3 Tesla. J Magn Reson Imaging. 2003 Aug;18(2):175–180. doi: 10.1002/jmri.10346. [DOI] [PubMed] [Google Scholar]
- 32.Haacke EM, Xu Y, Cheng YC, et al. Susceptibility weighted imaging (SWI) Magn Reson Med. 2004 Sep;52(3):612–618. doi: 10.1002/mrm.20198. [DOI] [PubMed] [Google Scholar]
- 33.Pandian DSJ, Ciulla C, Haacke EM. Complex Threshold Method for Identifying Pixels That Contain Predominantly Noise in Magnetic Resonance Images. J Magn Reson Imaging. 2008 doi: 10.1002/jmri.21487. In Proof. [DOI] [PubMed] [Google Scholar]
- 34.Xu Y, Haacke EM. The role of voxel aspect ratio in determining apparent vascular phase behavior in susceptibility weighted imaging. Magn Reson Imaging. 2006 Feb;24(2):155–160. doi: 10.1016/j.mri.2005.10.030. [DOI] [PubMed] [Google Scholar]
- 35.Koopmans PJ, Manniesing R, Niessen WJ, et al. MR venography of the human brain using susceptibility weighted imaging at very high field strength. MAGMA. 2008 Mar;21(1–2):149–158. doi: 10.1007/s10334-007-0101-3. [DOI] [PubMed] [Google Scholar]
- 36.Du YP, Jin Z. Simultaneous acquisition of MR angiography and venography (MRAV) Magn Reson Med. 2008 May;59(5):954–958. doi: 10.1002/mrm.21581. [DOI] [PubMed] [Google Scholar]
- 37.Ameri A, Bousser MG. Cerebral venous thrombosis. Neurol Clin. 1992 Feb;10(1):87–111. [PubMed] [Google Scholar]
- 38.Tang PH, Chai J, Chan YH, et al. Superior sagittal sinus thrombosis: subtle signs on neuroimaging. Ann Acad Med Singapore. 2008 May;37(5):397–401. [PubMed] [Google Scholar]
- 39.Hinman JM, Provenzale JM. Hypointense thrombus on T2-weighted MR imaging: a potential pitfall in the diagnosis of dural sinus thrombosis. Eur J Radiol. 2002 Feb;41(2):147–152. doi: 10.1016/s0720-048x(01)00365-5. [DOI] [PubMed] [Google Scholar]
- 40.Preter M, Tzourio C, Ameri A, et al. Long-term prognosis in cerebral venous thrombosis. Follow-up of 77 patients. Stroke. 1996 Feb;27(2):243–246. doi: 10.1161/01.str.27.2.243. [DOI] [PubMed] [Google Scholar]
- 41.Criqui MH, Fronek A, Barrett-Connor E, et al. The prevalence of peripheral arterial disease in a defined population. Circulation. 1985 Mar;71(3):510–515. doi: 10.1161/01.cir.71.3.510. [DOI] [PubMed] [Google Scholar]
- 42.Boos M. Clinical value of high resolution MRI of vessel wall lesions in peripheral atherosclerosis disease: first in vivo experience before and after PTA. MAGMA. 1996;127:94. [Google Scholar]
- 43.Zimmermann GG, Erhart P, Schneider J, et al. Intravascular MR imaging of atherosclerotic plaque: ex vivo analysis of human femoral arteries with histologic correlation. Radiology. 1997 Sep;204(3):769–774. doi: 10.1148/radiology.204.3.9280257. [DOI] [PubMed] [Google Scholar]
- 44.Vink A, Schoneveld AH, Borst C, et al. The contribution of plaque and arterial remodeling to de novo atherosclerotic luminal narrowing in the femoral artery. J Vasc Surg. 2002 Dec;36(6):1194–1198. doi: 10.1067/mva.2002.128300. [DOI] [PubMed] [Google Scholar]
- 45.Wyttenbach R, Gallino A, Alerci M, et al. Effects of percutaneous transluminal angioplasty and endovascular brachytherapy on vascular remodeling of human femoropopliteal artery by noninvasive magnetic resonance imaging. Circulation. 2004 Aug 31;110(9):1156–1161. doi: 10.1161/01.CIR.0000140672.70862.5B. [DOI] [PubMed] [Google Scholar]
- 46.Isbell DC, Meyer CH, Rogers WJ, et al. Reproducibility and reliability of atherosclerotic plaque volume measurements in peripheral arterial disease with cardiovascular magnetic resonance. J Cardiovasc Magn Reson. 2007;9(1):71–76. doi: 10.1080/10976640600843330. [DOI] [PMC free article] [PubMed] [Google Scholar]
- 47.Guzman RJ, Brinkley DM, Schumacher PM, et al. Tibial artery calcification as a marker of amputation risk in patients with peripheral arterial disease. J Am Coll Cardiol. 2008 May 20;51(20):1967–1974. doi: 10.1016/j.jacc.2007.12.058. [DOI] [PMC free article] [PubMed] [Google Scholar]
- 48.Pentecost MJ, Criqui MH, Dorros G, et al. Guidelines for peripheral percutaneous transluminal angioplasty of the abdominal aorta and lower extremity vessels. A statement for health professionals from a special writing group of the Councils on Cardiovascular Radiology, Arteriosclerosis, Cardio-Thoracic and Vascular Surgery, Clinical Cardiology, and Epidemiology and Prevention, the American Heart Association. Circulation. 1994 Jan;89(1):511–531. doi: 10.1161/01.cir.89.1.511. [DOI] [PubMed] [Google Scholar]
- 49.Wright LB, Matchett WJ, Cruz CP, et al. Popliteal artery disease: diagnosis and treatment. Radiographics. 2004 Mar–Apr;24(2):467–479. doi: 10.1148/rg.242035117. [DOI] [PubMed] [Google Scholar]
- 50.Cannegieter SC, Doggen CJ, van Houwelingen HC, et al. Travel-related venous thrombosis: results from a large population-based case control study (MEGA study) PLoS Med. 2006 Aug;3(8):e307. doi: 10.1371/journal.pmed.0030307. [DOI] [PMC free article] [PubMed] [Google Scholar]
- 51.Mammen EF. Pathogenesis of venous thrombosis. Chest. 1992 Dec;102(6 Suppl):640S–644S. doi: 10.1378/chest.102.6_supplement.640s. [DOI] [PubMed] [Google Scholar]
- 52.Aldington S, Pritchard A, Perrin K, et al. Prolonged seated immobility at work is a common risk factor for venous thromboembolism leading to hospital admission. Intern Med J. 2008 Feb;38(2):133–135. doi: 10.1111/j.1445-5994.2007.01597.x. [DOI] [PubMed] [Google Scholar]
- 53.Shvartz E, Gaume JG, White RT, et al. Hemodynamic responses during prolonged sitting. J Appl Physiol. 1983 Jun;54(6):1673–1680. doi: 10.1152/jappl.1983.54.6.1673. [DOI] [PubMed] [Google Scholar]
- 54.Haacke EM, Lai S, Reichenbach JR, et al. In vivo measurement of blood oxygen saturation using magnetic resonance imaging: A direct validation of the blood oxygen level-dependent concept in functional brain imaging. Human Brain Mapping. 1997;5(5):341–346. doi: 10.1002/(SICI)1097-0193(1997)5:5<341::AID-HBM2>3.0.CO;2-3. [DOI] [PubMed] [Google Scholar]
- 55.Weisskoff RM, Kiihne S. MRI susceptometry: image-based measurement of absolute susceptibility of MR contrast agents and human blood. Magn Reson Med. 1992 Apr;24(2):375–383. doi: 10.1002/mrm.1910240219. [DOI] [PubMed] [Google Scholar]
- 56.Spees WM, Yablonskiy DA, Oswood MC, et al. Water proton MR properties of human blood at 1.5 Tesla: magnetic susceptibility, T(1), T(2), T*(2), and non-Lorentzian signal behavior. Magn Reson Med. 2001 Apr;45(4):533–542. doi: 10.1002/mrm.1072. [DOI] [PubMed] [Google Scholar]
- 57.Elangovan IR. Verification of magnetic susceptibility value of deoxyhemoglobin of blood using susceptibility weighted imaging. Detroit: Biomedical Engineering, Wayne State University; 2006. [Google Scholar]
- 58.Fernandez-Seara MA, Techawiboonwong A, Detre JA, et al. MR susceptometry for measuring global brain oxygen extraction. Magn Reson Med. 2006 May;55(5):967–973. doi: 10.1002/mrm.20892. [DOI] [PubMed] [Google Scholar]
- 59.Haacke EM, Prabhakaran KP, Elangovan IR, et al. Verification of the susceptibility value of deoxyhemoglobin in the blood using Susceptibility Weighted Imaging (SWI) Proc Intl Soc Mag Reson Med. 2005;13 [Google Scholar]
- 60.Li D, Wang Y, Waight DJ. Blood oxygen saturation assessment in vivo using T2* estimation. Magn Reson Med. 1998 May;39(5):685–690. doi: 10.1002/mrm.1910390503. [DOI] [PubMed] [Google Scholar]
- 61.Brismar B, Cronestrand R, Jorfeldt L, et al. Estimation of femoral arterial blood flow from femoral venous oxygen saturation. Acta Chir Scand. 1978;144(3):125–128. [PubMed] [Google Scholar]
- 62.Costes F, Barthelemy JC, Feasson L, et al. Comparison of muscle near-infrared spectroscopy and femoral blood gases during steady-state exercise in humans. J Appl Physiol. 1996 Apr;80(4):1345–1350. doi: 10.1152/jappl.1996.80.4.1345. [DOI] [PubMed] [Google Scholar]
- 63.Esaki K, Hamaoka T, Radegran G, et al. Association between regional quadriceps oxygenation and blood oxygen saturation during normoxic one-legged dynamic knee extension. Eur J Appl Physiol. 2005 Oct;95(4):361–370. doi: 10.1007/s00421-005-0008-5. [DOI] [PubMed] [Google Scholar]
- 64.MacDonald MJ, Tarnopolsky MA, Green HJ, et al. Comparison of femoral blood gases and muscle near-infrared spectroscopy at exercise onset in humans. J Appl Physiol. 1999 Feb;86(2):687–693. doi: 10.1152/jappl.1999.86.2.687. [DOI] [PubMed] [Google Scholar]
- 65.Sonnenfeld T, Nowak J, Cronestrand R, et al. LEg venous oxygen saturation in the evaluation of intra-operative blood flow during arterial reconstructive surgery. Scand J Clin Lab Invest. 1979 Oct;39(6):577–584. doi: 10.3109/00365517909108836. [DOI] [PubMed] [Google Scholar]
- 66.Shen Y, Kou Z, Kreipke CW, et al. In vivo measurement of tissue damage, oxygen saturation changes and blood flow changes after experimental traumatic brain injury in rats using susceptibility weighted imaging. Magn Reson Imaging. 2007 Feb;25(2):219–227. doi: 10.1016/j.mri.2006.09.018. [DOI] [PubMed] [Google Scholar]


