

Abstract
Many protocols have been used in clinical and research settings for collecting systolic blood pressure (SBP) measurements to calculate the ankle–brachial index (ABI); however, it is not known how useful it is to replicate measurements and which measures best reflect cardiovascular risk. Standardized measurements of ankle and arm SBP from 5140 overweight or obese individuals with type 2 diabetes were used to estimate sources of variation. Measurement characteristics of leg-specific ABI, as calculated using a standard algorithm based on the highest SBP of the dorsalis pedis or posterior tibial arteries, were projected using simulations. Coefficients of variability ranged from 2% to 3% when single SBP measurements were used and ABI was overestimated by 2–3%. Taking two SBP measurements at each site reduced standard errors and bias each by 30–40%. The sensitivity of detecting low ABI ranges exceeded 90% for ABI within 0.05 of the 0.90 clinical cut-point. The average and the minimum of the two (i.e. right and left) leg-specific ABI values had similar U-shaped relationships with Framingham risk scores; however, the average leg ABI had slightly greater precision. Replicating SBP measurements reduces the error and bias of ABI. Averaging leg-specific values may increase power for characterizing cardiovascular disease risk.
Keywords: diagnostic error, peripheral arterial disease, sensitivity, specificity
Introduction
The ankle–brachial index (ABI) is a hemodynamic measure commonly used to make the diagnosis of peripheral artery disease (PAD).1–3 In the clinical setting, the ABI is calculated separately for each leg and the lower of the two leg-specific ABI values (derived from the highest of the dorsalis pedis versus posterior tibial artery pressures in each ankle) serves as the basis for diagnosis. Individuals with an ABI value < 0.90 in either leg are considered to have PAD.2
ABI not only can be used to diagnose PAD, but is also an independent marker of systemic cardiovascular disease (CVD).4–9 There is a growing awareness that both low (<0.90) and high values (>1.30) are associated with increased risk of cardiovascular events9,10 and cardiovascular disease mortality may be doubled among individuals with elevated ABI compared to those with mid-range ABI4 (however, additional testing in such individuals may be required to confirm the presence of PAD). It is not clear how the ABI should best be calculated when used as a predictor of cardiovascular risk. Use of the lower of the two leg-specific ABI values ignores information from the ABI in the other leg. The total burden of atherosclerosis in a particular individual may be better described by accounting for the ABI values in both legs (herein defined as the average leg ABI).
This manuscript uses standardized systolic blood pressure (SBP) measurements collected from a large cohort to examine measurement issues with ABI. The measurement properties of leg-specific ABI for diagnosing PAD are examined. For this purpose, of interest are its variability (standard error), bias, and sensitivity and specificity at key cut-points, and the value of replicating SBP measurements. How ABI performs as a marker of CVD risk is then considered by comparing the minimum versus the average of leg-specific ABIs (average leg ABI). For this purpose, of interest are its standard error and associations with cardiovascular risk (which are portrayed using Framingham risk scores).
Methods
Study design
The Action for Health in Diabetes (Look AHEAD) is a multi-center randomized clinical trial that enrolled 5145 overweight or obese volunteers with type 2 diabetes between June 2001 and March 2004.11 Participants will be followed for up to 11.5 years to assess the long-term effects on CVD outcomes of an intensive lifestyle intervention program designed to achieve and maintain weight loss by decreased caloric intake and increased physical activity. The comparison intervention consists of diabetes support and education.12
At enrollment, a Look AHEAD participant was aged 45–76 years and had a body mass index ≥ 25 kg/m2, or ≥ 27 kg/m2 if on insulin. Other inclusion requirements included a source of medical care, blood pressure < 160/100 mmHg (treated or untreated), HbA1c < 11%, plasma triglycerides < 8.0 mmol/l (600 mg/dl), and willingness to accept random assignment. Potential volunteers judged to be unlikely to be able to carry out the components of the weight loss intervention were excluded.
Data collection protocol for cardiovascular disease risk factors
Standardized interviewer-administered questionnaires were used to obtain data on demography and medical history. History of cardiovascular disease was defined by self-report of prior myocardial infarction, stroke, coronary or lower extremity revascularization, carotid endarterectomy, or coronary bypass surgery. For calculating body mass index (ratio of weight to height squared), weight was measured in replicate on a digital scale and standing height was determined in replicate with a standard stadiometer. Seated blood pressure was measured in replicate with an automated device using a common protocol and certified staff. Three different sized cuffs were available; staff were trained to select the cuff whose width approximated 40% of the limb circumference. Hypertension was defined as SBP ≥ 140 mmHg, diastolic blood pressure ≥ 90 mmHg, or use of anti-hypertensive medications. Hyperlipidemia was defined as LDL-cholesterol > 3.37 mmol/l (130 mg/dl) or use of lipid-lowering medications. From these measures, estimates of the 1-year risk of CVD events were calculated using equations developed in the Framingham study.13
Ankle–brachial blood pressure measurement protocols
Look AHEAD transitioned through three measurement protocols in an effort to balance the need to streamline ABI data collection with that of replicating SBP measurements. The most labor-intensive protocol involved three replicate SBP measurements at the right arm, left arm, right dorsalis pedis, right posterior tibial, left dorsal pedis, left posterior tibial, and a repeat of the measurements from the original arm (a total of 18 separate measurements). A second protocol involved two replicate measurements from the right arm, left arm, right dorsalis pedis, right posterior tibial, left dorsalis pedis, and left posterior tibial (12 total measurements). The final and current protocol involves a single measurement at the right arm, left arm, right dorsalis pedis, right posterior tibial, left dorsalis pedis, and left posterior tibial, and a replicate measure at the arm with the highest initial SBP (seven total measurements). The measurement protocols were used in successive cohorts of enrollees; data from these cohorts were pooled for analysis. Measurements were obtained by trained and certified study personnel using a continuous wave Doppler with a 5–8 mHz probe for ankle pressures and a standard mercury sphygmomanometer for brachial pressures.
We asked whether replication of SBP measurements is materially useful for reducing measurement error and bias. We thus contrasted three approaches:
Approach 1: replicate SBP measurements at both arms and all ankle sites.
Approach 2: single SBP measurement at both arms and all ankle sites.
Approach 3: single SBP measurement at all sites with replication of the highest arm SBP
Approach 3 corresponds to the current Look AHEAD protocol. The rationale for replicating only an arm, rather than an ankle measurement, is that the two different ankle sites already provide some measure of replication.
ABI measures
As indicated in Table 1, leg-specific ABI was calculated according to a standard algorithm reported in guidelines from the American Heart Association (AHA),2 in which the ABI for each leg equals the ratio of the higher of the two ankle SBP measurements (posterior tibial versus dorsal pedis) divided by either the average of the right and left brachial artery pressures or, if there is a discrepancy ≥ 10 mmHg in SBP values between the two brachial values, the higher of the two brachial values. The ABI from this algorithm is then defined as the lower of the right and left leg-specific ABIs. Average leg ABI is calculated as the average of the right and left leg-specific ABIs. We define ‘true ABI’ as its value if there are no SBP measurement errors.
Table 1.
List of terms used in this manuscript
| Leg-specific ABI |
| ABI calculated according to the American Heart Association algorithm2 for an individual leg. This is the ratio of the higher of the two ankle SBP measurements (posterior tibial versus dorsal pedis) divided by either the average of the right and left brachial artery pressures, or if there is a discrepancy then the higher of the two brachial values. When replicate measurements are taken at sites, their average is used for the site-specific SBP. |
| Minimum ABI |
| Lowest of two leg-specific ABIs. |
| Average leg ABI |
| Average of two leg-specific ABIs. |
| True ABI |
| Value that ABI would take on if there were no SBP measurement error: in the special case in which there are no differences in the underlying SBP between arms and among ankle sites, the true leg-specific, minimum, and average ABI are identical. |
Statistical analysis
We estimated the sources of variance in underlying SBP measurements, using models detailed in the Appendix. Variance arises from differences between replicate measurements taken on the same site and underlying differences in SBP between arms and among ankle sites. Because the model was fitted using Bayesian methodology, we report posterior medians and credible intervals (rather than confidence intervals) for our estimates.14
We examined how measurement error in SBP translates to variance and bias in calculated leg-specific ABI and for the average and minimum of the two leg-specific ABIs, as defined in Table 1. To simplify matters, we considered the special case in which, except for measurement error, SBP did not vary between arms and between ankle sites. When this occurs, differences among leg-specific ABI values (minimum and maximum leg-specific ABI values) are solely due to this measurement error.
We used simulations (n = 10,000) to characterize the bias and standard error of leg-specific ABI for each of the three measurement approaches. We also examined how this measurement error translated to the sensitivity and specificity of leg-specific ABI at cut-points of ABI < 0.90 or > 1.30 for the true ABI. In this context, sensitivity and specificity portray how well the ABI measurement corresponds to the true ABI value; they do not reflect how well ABI corresponds to PAD, which cannot be determined from our simulations without a gold standard. The distribution of Framingham risk scores of Look AHEAD participants was portrayed across the range of minimum and average ABI, using spline regression. Finally, we used simulations to characterize the standard errors of minimum leg-specific ABI and average leg ABI.
Results
This report is based on results from the n = 5140 participants who provided at least one SBP measurement at both an arm and ankle site at baseline: n = 341 (Protocol 1), n = 540 (Protocol 2), and n = 4259 (Protocol 3). These comprise 99.9% of the n = 5145 Look AHEAD participants. Leg-specific ABIs had a mean of 1.17, standard deviation of 0.13, and range of 0.61–2.69. Average leg ABIs had a mean of 1.14, standard deviation of 0.10, and range of 0.69–1.95. Table 2 summarizes the distribution of CVD risk factors among these participants.
Table 2.
Baseline cardiovascular risk factors for 5140 Look AHEAD participants
| Cardiovascular disease risk factor subgroup | n (%) |
|---|---|
| Sex | |
| Female | 3062 (59.6) |
| Male | 2078 (40.4) |
| Age, years | |
| 45–54 | 1241 (24.1) |
| 55–64 | 2847 (55.4) |
| 65–75 | 1052 (20.5) |
| Hypertension | |
| Yes | 4328 (84.2) |
| No | 812 (15.8) |
| Hyperlipidemia | |
| Yes | 3528 (68.6) |
| No | 1612 (31.4) |
| Cigarette smoking | |
| Never | 2573 (50.2) |
| Former | 2325 (45.4) |
| Current | 228 (4.4) |
| Years with Type 2 diabetes | |
| <5 | 2390 (46.5) |
| 5–9 | 1399 (27.2) |
| 10+ | 1351 (26.3) |
| Cardiovascular disease history | |
| Yes | 720 (14.0) |
| No | 4420 (86.0) |
| Body mass index, kg/m2 | |
| 25–29 | 765 (14.9) |
| 30–34 | 1815 (35.3) |
| 35–39 | 1411 (27.5) |
| >40 | 1148 (22.3) |
| Insulin use | |
| Yes | 972 (19.2) |
| No | 4097 (80.8) |
| HbA1c | |
| <7.0% | 2356 (45.8) |
| 7.0–8.9% | 2301 (44.8) |
| 9.0–10.9% | 483 (9.4) |
| Framingham 1-year risk of cardiovascular disease events | |
| 0.0–0.01 | 2325 (46.9) |
| 0.01–0.03 | 1623 (32.8) |
| 0.03–0.2 | 1008 (20.3) |
Estimates for sources of variability among SBP measurements from Look AHEAD were as follows. The standard deviation between replicate measurements of SBP (pooled across the brachial and ankle sites) was 3.16 mmHg, with a 95% credible interval [3.11, 3.20]; estimates from the separate sites were comparable, i.e. the measurement error did not appear to vary among sites. The standard deviation of SBPs between arms of the same individual (after accounting for measurement error) was 5.16 [5.03, 5.31] mmHg. Standard deviations of SBPs between ankle sites were greater: 11.21 [11.00, 11.43] mmHg at the dorsal pedis and 10.40 [10.20, 10.26] mmHg at the tibialis posterior. Brachial SBP (pooled across arms) was estimated to average 132.7 [132.3, 133.2] mmHg and have a standard deviation of 14.97 [14.67, 15.30] mmHg among individuals.
We used the estimated standard deviation for replicate measurements to project (via simulation) the statistical properties of leg-specific ABIs from the three approaches (Figure 1). The standard error depends on the true ABI value, nearly doubling as it ranges from 0.80 to 1.60. Replicate SBP measures (Approach 1) reduce standard errors by 30–40% compared to single measures (Approach 2). Replicating only the highest arm SBP (Approach 3) reduces standard errors by 10–15%, compared to single measures. The coefficients of variation for ABI measures range from 2.2% to 1.3% (replication) and 3.1% to 2.2% (single measurement) across the ABI range.
Figure 1.
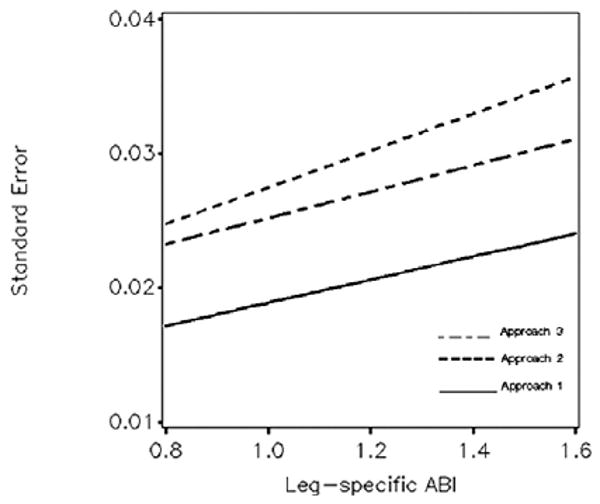
Standard error of leg-specific ABI from the three approaches across the range of ABI. Summary: for higher ABI, its variability due to measurement error is increased. Replicating SBP measurements (Approach 1) reduces variability.
By focusing on the maximum of SBP ankle measurements, the AHA algorithm tends to overestimate the true value due to measurement error. Figure 2 portrays the expected bias of leg-specific ABI, which increases as the true ABI increases. Replicating SBP measurements (Approach 1) yields lower bias (ranging from 1.8% to 1.3%); there is little difference in the bias between approaches 2 and 3 (which range from 2.8% to 1.8%).
Figure 2.
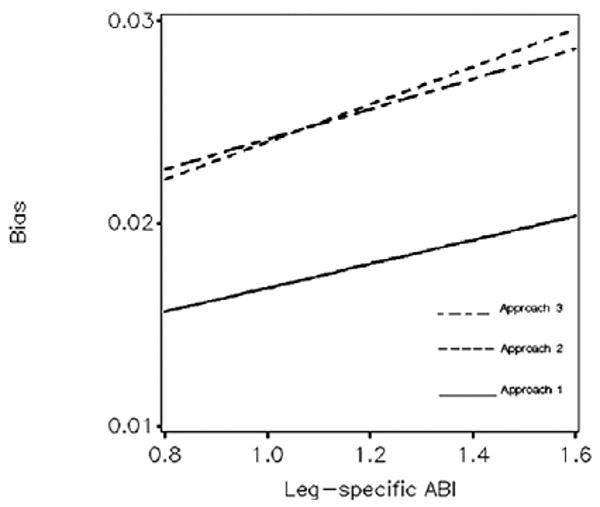
Expected bias of leg-specific ABI: from the three approaches and across the range of underlying ABI. Summary: ABI calculated by the AHA algorithm tends to overestimate its true value. Replicating SBP measurements (Approach 1) reduces bias.
The standard errors and biases affect the sensitivity and specificity of leg-specific ABI for detecting low (<0.90) and high (>1.30) ABI, as examined in Figure 3. Sensitivities and specificities rise quickly and exceed 90% when the true ABI is further than 0.05 units from these cut-points, with or without replication of SBP measurements. Because of greater bias, single measurement of SBP yields relatively less sensitivity and greater specificity for detecting low ABI compared to replicate measurement. Correspondingly, it yields relatively less specificity and greater sensitivity for detecting high ABI. Replicating a single SBP (Approach 3) yields intermediate sensitivities and specificities (not shown).
Figure 3.
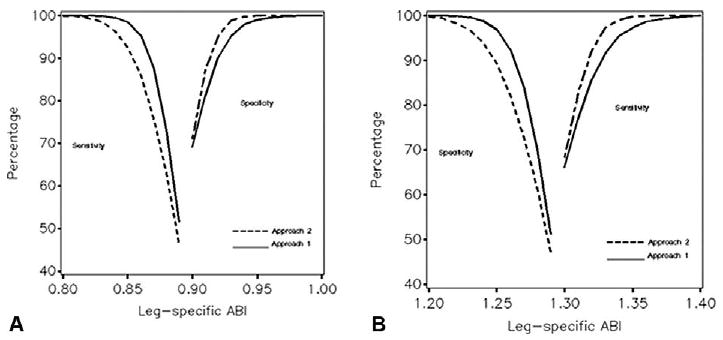
Expected sensitivity and specificity of leg-specific ABI for classifying individuals with respect to underlying ABI at cutpoints of < 0.90 (Panel A) and > 1.30 (Panel B) with (Approach 1) and without (Approach 2) replicate SBP measurements. Summary: when the value of ABI is more than 0.05 units from the clinical cutpoints of 0.90 and 1.30, it reliably distinguishes patients with low and high ABI.
Figure 4 portrays the association that minimum and average ABI values had with the 1-year Framingham cardiovascular disease risk estimates of the Look AHEAD cohort. For both ABI measures, scores tended to be greatest for lower ABI, but were also elevated for higher ABI. The nadirs of relationships were for ABI between 1.00 and 1.20. Because the minimum ABI never exceeds the average ABI, its risk factor relationships were shifted slightly toward lower ABI.
Figure 4.
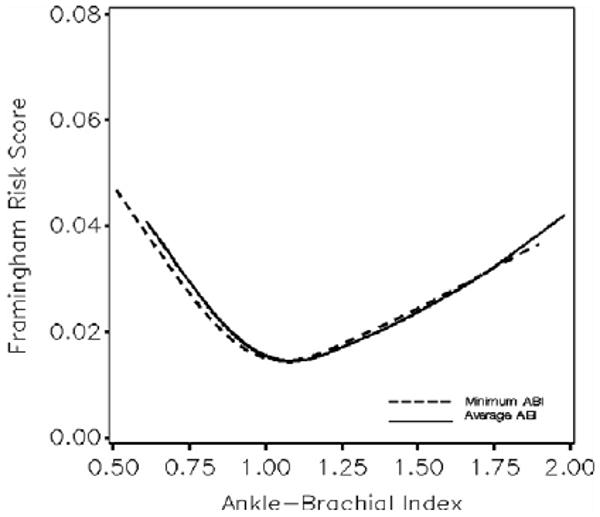
Distribution of Framingham 1-year risk scores across the distribution of average and minimum ABI values. Summary: cardiovascular disease risk scores are elevated for both low and high ABI.
Figure 5 portrays the standard errors of minimum and averaged ABI based with (Approach 1) and without (Approach 2) replicating SBP measures. Standard errors increase with ABI. Replicating SBP measurement reduces the standard errors of both minimum and average ABI by 30–50%. Average ABI has slightly lower standard error than minimum ABI. Replicating a single SBP measurement (Approach 3) produces intermediate results (not shown).
Figure 5.
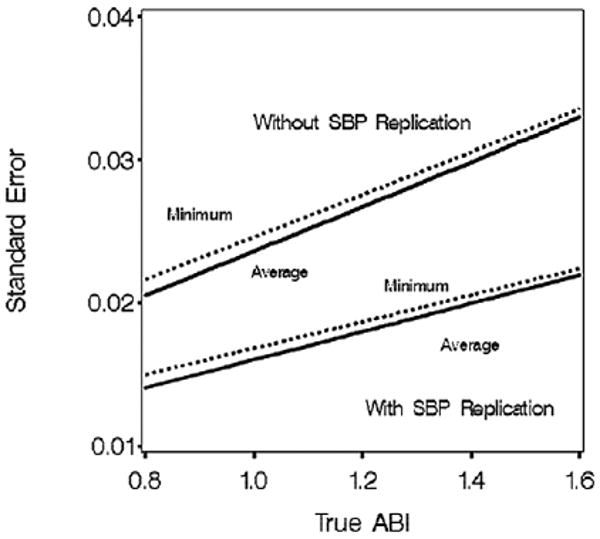
Standard error of minimum and average ABI with (Approach 1) and without (Approach 2) replication of SBP measurements. Summary: averaging ABI values from the right and left legs reduces standard error.
Discussion
Assessments of ABI have proven clinical importance for detecting PAD and assessing overall cardiovascular risk;2 however, all such measures have inherent error. It is important to understand the distributions of ABI error in order to interpret findings appropriately. We project that leg-specific ABI measures, developed from a standard protocol involving single SBP measurements by centrally trained staff, have standard errors of about 0.025 near the established cut-point of 0.90 for diagnosing PAD. The associated 95% confidence interval has a width of 0.10 units. Standard errors increase with higher ABI and are about 40% greater when the ABI is 1.60. Replicating SBP measurements reduces ABI standard errors by 30–40% and also reduces the rate at which errors increase with underlying ABI. Replicating a single SBP measurement (e.g. the maximum arm SBP) reduces the standard error slightly compared to no replication. While this increased precision may have little impact on the diagnosis of individual patients, it may translate to additional power in research studies.
The AHA algorithm typically overestimates the underlying ‘true’ ratio of ankle to arm blood pressures. The absolute magnitude of the expected bias for individual-specific ABI increases with underlying ABI and depends on whether SBP measurements are replicated. Without replication, bias ranges from approximately 0.022 to 0.030 for ABI from 0.8 to 1.6. With replication, bias ranges from 0.015 to 0.020 across this range. Published cut-points for leg-specific ABI, which are primarily based on the AHA algorithm, likely reflect these biases. Other algorithms for computing ABI are in current use, such as always using the higher of the two arm SBPs. For the case we examine in which differences in SBP measurement arms are solely due to measurement error, this approach tends to overestimate arm SBP and thereby reduce the biased overestimate of ABI. However, it increases standard error. For example, at ABI = 0.90, Approach 2 (single SBP measurements) has about half the bias of the AHA algorithm but 40% greater standard error.
Alternatively, ABI estimated using model-based approaches would be expected to have less bias; however, these would be difficult to implement for individuals in clinical settings and are likely to be useful only for research studies. Models, such as detailed in the Appendix, can be extended to include relationships between ABI and risk factors, and fitted to provide characterizations that would be expected to have better statistical properties. Individual ABI estimates (as random effects terms) may also be used, in a two-stage approach, to characterize relationships in separate regression analyses.15
We have explored the sensitivity and specificity of ABI measurements for detecting both low and high ABI. We have considered situations in which there are no underlying differences in mean SBP between arms or among ankle sites, so that the only differences between right and left leg-specific ABIs are due to measurement error. Sensitivities and specificities exceed 90% for detecting both low and high ABI when it is 0.05 units or greater away from established cut-points. By reducing bias, replicating SBP measurements increases sensitivity for detecting low ABI and specificity for ruling out high ABI.
Minimum and average ABI had similar relationships with the Framingham risk scores of Look AHEAD participants, suggesting that cardiovascular risk was elevated for both low and high ABIs. The standard error of average ABI is slightly less than minimum ABI, which may translate to slightly greater power for detecting risk factor relationships. Replicating SBP measurements translates to much greater precision and thereby would be expected to have more marked benefits for improving power.
Our findings may be limited by the nature of Look AHEAD participants and it is possible that measurement characteristics may differ in other cohorts, such as individuals without diabetes. For simplicity, we have not examined situations in which SBP varies between arms or among ankle sites. In such cases, differences in leg-specific, minimum, and maximum ABI are no longer solely due to measurement error. Relationships with Framingham risk scores may not accurately reflect true risk; follow-up of the Look AHEAD cohort will be used to examine the relationships that ABI has with incident cardiovascular outcomes.
Acknowledgments
Trial registration: Clinicaltrials.gov; identifier: NCT00017953.
Clinical sites:The Johns Hopkins Medical Institutions: Frederick Brancati, MD, MHS; Debi Celnik, MS, RD, LD; Jeff Honas, MS; Jeanne Clark, MD, MPH; Jeanne Charleston, RN; Lawrence Cheskin, MD; Kerry Stewart, EdD; Richard Rubin, PhD; Kathy Horak, RD
Pennington Biomedical Research Center: George A. Bray, MD; Kristi Rau; Allison Strate, RN; Frank L. Greenway, MD; Donna H. Ryan, MD; Donald Williamson, PhD; Elizabeth Tucker; Brandi Armand, LPN; Mandy Shipp, RD; Kim Landry; Jennifer Perault
The University of Alabama at Birmingham: Cora E. Lewis, MD, MSPH; Sheikilya Thomas, MPH; Vicki DiLillo, PhD; Monika Safford, MD; Stephen Glasser, MD; Clara Smith, MPH; Cathy Roche, RN; Charlotte Bragg, MS, RD, LD; Nita Webb, MA; Staci Gilbert, MPH; Amy Dobelstein; L. Christie Oden; Trena Johnsey
Harvard Center: Massachusetts General Hospital: David M. Nathan, MD; Heather Turgeon, RN; Kristina P. Schumann, BA; Enrico Cagliero, MD; Kathryn Hayward, MD; Linda Delahanty, MS, RD; Barbara Steiner, EdM; Valerie Goldman, MS, RD; Ellen Anderson, MS, RD; Laurie Bissett, MS, RD; Alan McNamara, BS; Richard Ginsburg, PhD; Virginia Harlan, MSW; Theresa Michel, MS
Joslin Diabetes Center: Edward S. Horton, MD; Sharon D. Jackson, MS, RD, CDE; Osama Hamdy, MD, PhD; A. Enrique Caballero, MD; Sarah Ledbury, MEd, RD; Maureen Malloy, BS; Ann Goebel-Fabbri, PhD; Kerry Ovalle, MS, RCEP, CDE; Sarah Bain, BS; Elizabeth Bovaird, BSN,RN; Lori Lambert, MS, RD
Beth Israel Deaconess Medical Center: George Blackburn, MD, PhD; Christos Mantzoros, MD, DSc; Ann McNamara, RN; Heather McCormick, RD
University of Colorado Health Sciences Center: James O. Hill, PhD; Marsha Miller, MS, RD; Brent VanDorsten, PhD; Judith Regensteiner, PhD; Robert Schwartz, MD; Richard Hamman, MD, DrPH; Michael McDermott, MD; JoAnn Phillipp, MS; Patrick Reddin, BA; Kristin Wallace, MPH; Paulette Cohrs, RN, BSN; April Hamilton, BS; Salma Benchekroun, BS; Susan Green; Loretta Rome, TRS; Lindsey Munkwitz, BS
Baylor College of Medicine: John P. Foreyt, PhD; Rebecca S. Reeves, DrPH, RD; Henry Pownall, PhD; Peter Jones, MD; Ashok Bala-subramanyam, MD; Molly Gee, MEd, RD
University of California at Los Angeles School of Medicine: Mohammed F. Saad, MD; Ken C. Chiu, MD; Siran Ghazarian, MD; Kati Szamos, RD; Magpuri Perpetua, RD; Michelle Chan, BS; Medhat Botrous.
The University of Tennessee Health Science Center: University of Tennessee: East. Karen C. Johnson, MD, MPH; Leeann Carmichael, RN; Lynne Lichtermann, RN, BSN
University of Tennessee Downtown: Abbas E. Kitabchi, PhD, MD; Jackie Day, RN; Helen Lambeth, RN, BSN; Debra Force, MS, RD, LDN; Debra Clark, LPN; Andrea Crisler, MT, Donna Green, RN; Gracie Cunningham; Maria Sun, MS, RD, LDN; Robert Kores, PhD; Renate Rosenthal, PhD; and Judith Soberman, MD
University of Minnesota: Robert W. Jeffery, PhD; Carolyn Thorson, CCRP; John P. Bantle, MD; J. Bruce Redmon, MD; Richard S. Crow, MD; Jeanne Carls, MEd; Carolyne Campbell; La Donna James; T. Ockenden, RN; Kerrin Brelje, MPH, RD; M. Patricia Snyder, MA, RD; Amy Keranen, MS; Cara Walcheck, BS, RD; Emily Finch, MA; Birgitta I. Rice, MS, RPh, CHES; Vicki A. Maddy, BS, RD; Tricia Skarphol, BS
St Luke's Roosevelt Hospital Center: Xavier Pi-Sunyer, MD; Jennifer Patricio, MS; Jennifer Mayer, MS; Stanley Heshka, PhD; Carmen Pal, MD; Mary Anne Holowaty, MS, CN; Diane Hirsch, RNC, MS, CDE
University of Pennsylvania: Thomas A. Wadden, PhD; Barbara J. Maschak-Carey, MSN, CDE; Gary D. Foster, PhD; Robert I. Berkowitz, MD; Stanley Schwartz, MD; Shiriki K. Kumanyika, PhD, RD, MPH; Monica Mullen, MS, RD; Louise Hesson, MSN; Patricia Lipschutz, MSN; Anthony Fabricatore, PhD; Canice Crerand, PhD; Robert Kuehnel, PhD; Ray Carvajal, MS; Renee Davenport; Helen Chomentowski
University of Pittsburgh: David E. Kelley, MD; Jacqueline Wesche-Thobaben, RN, BSN,CDE; Lewis Kuller, MD, DrPH.; Andrea Kriska, PhD; Daniel Edmundowicz, MD; Mary L. Klem, PhD, MLIS; Janet Bonk, RN, MPH; Jennifer Rush, MPH; Rebecca Danchenko, BS; Barb Elnyczky, MA; Karen Vujevich, RN-BC, MSN, CRNP; Janet Krulia, RN, BSN, CDE; Donna Wolf, MS; Juliet Mancino, MS, RD, CDE, LDN; Pat Harper, MS, RD, LDN; Anne Mathews, MS, RD, LDN
Brown University: Rena R. Wing, PhD; Vincent Pera, MD; John Jakicic, PhD; Deborah Tate, PhD; Amy Gorin, PhD; Renee Bright, MS; Pamela Coward, MS, RD; Natalie Robinson, MS, RD; Tammy Monk, MS; Kara Gallagher, PhD; Anna Bertorelli, MBA, RD; Maureen Daly, RN; Tatum Charron, BS; Rob Nicholson, PhD; Erin Patterson, BS; Julie Currin, MD; Linda Foss, MPH; Deborah Robles; Barbara Bancroft, RN, MS; Jennifer Gauvin, BS; Deborah Maier, MS; Caitlin Egan, MS; Suzanne Phelan, PhD; Hollie Raynor, PhD, RD; Don Kieffer, PhD; Douglas Raynor, PhD; Lauren Lessard, BS; Kimberley Chula-Maguire, MS; Erica Ferguson, BS, RD; Richard Carey, BS; Jane Tavares, BS; Heather Chenot, MS; JP Massaro, BS
The University of Texas Health Science Center at San Antonio: Steve Haffner, MD; Maria Montez, RN, MSHP, CDE; Connie Mobley, PhD, RD; Carlos Lorenzo, MD
University of Washington / VA Puget Sound Health Care System: Steven E. Kahn, MB, ChB; Brenda Montgomery, MS, RN, CDE; Robert H. Knopp, MD; Edward W. Lipkin, MD, PhD; Matthew L. Maciejewski, PhD; Dace L. Trence, MD; Roque M. Murillo, BS; S. Terry Barrett, BS
Southwestern American Indian Center, Phoenix, Arizona and Shiprock, New Mexico: William C. Knowler, MD, DrPH; Paula Bolin, RN, MC; Tina Killean, BS; Carol Percy, RN; Rita Donaldson, BSN; Bernadette Todacheenie, EdD; Justin Glass, MD; Sarah Michaels, MD; Jonathan Krakoff, MD; Jeffrey Curtis, MD, MPH; Peter H. Bennett, MB, FRCP; Tina Morgan; Ruby Johnson; Cathy Manus; Janelia Smiley; Sandra Sangster; Shandiin Begay, MPH; Minnie Roanhorse; Didas Fallis, RN; Nancy Scurlock, MSN, ANP; Leigh Shovestull, RD
Coordinating center:Wake Forest University School of Medicine: Mark A. Espeland, PhD; Judy Bahnson, BA; Lynne Wagenknecht, DrPH; David Reboussin, PhD; W. Jack Rejeski, PhD; Wei Lang, PhD; Alain Bertoni, MD, MPH; Mara Vitolins, DrPH; Gary Miller, PhD; Paul Ribisl, PhD; Kathy Dotson, BA; Amelia Hodges, BA; Patricia Hogan, MS; Kathy Lane, BS; Carrie Combs, BS; Christian Speas, BS; Delia S. West, PhD; William Herman, MD, MPH
Central resources centers:DXA Reading Center, University of California at San Francisco: Michael Nevitt, PhD; Ann Schwartz, PhD; John Shepherd, PhD; Jason Maeda, MPH; Cynthia Hayashi; Michaela Rahorst; Lisa Palermo, MS, MA
Central Laboratory, Northwest Lipid Research Laboratories: Santica M. Marcovina, PhD, ScD; Greg Strylewicz, MS
ECG Reading Center, EPICARE, Wake Forest University School of Medicine: Ronald J. Prineas, MD, PhD; Zhu-Ming Zhang, MD; Charles Campbell, AAS, BS; Sharon Hall
Diet Assessment Center, University of South Carolina, Arnold School of Public Health, Center for Research in Nutrition and Health Disparities: Elizabeth J. Mayer-Davis, PhD; Cecilia Farach, DrPH
Federal sponsors:National Institute of Diabetes and Digestive and Kidney Diseases: Barbara Harrison, MS; Susan Z. Yanovski, MD; Van S. Hubbard, MD, PhD, Mary Evans, PhD
National Heart, Lung, and Blood Institute: Lawton S. Cooper, MD, MPH; Eva Obarzanek, PhD, MPH, RD; Denise Simons-Morton, MD, PhD
Centers for Disease Control and Prevention: David F. Williamson, PhD; Edward W. Gregg, PhD
Funding and support: This study is supported by the Department of Health and Human Services through the following cooperative agreements from the National Institutes of Health: DK57136, DK57149, DK56990, DK57177, DK57171, DK57151, DK57182, DK57131, DK57002, DK57078, DK57154, DK57178, DK57219, DK57008, DK57135, and DK56992. The following federal agencies have contributed support: National Institute of Diabetes and Digestive and Kidney Diseases; National Heart, Lung, and Blood Institute; National Institute of Nursing Research; National Center on Minority Health and Health Disparities; Office of Research on Women's Health; and the Centers for Disease Control and Prevention. This research was supported in part by the Intramural Research Program of the National Institute of Diabetes and Digestive and Kidney Diseases. Additional support was received from The Johns Hopkins Medical Institutions Bayview General Clinical Research Center (M01-RR-02719); the Massachusetts General Hospital Mallinckrodt General Clinical Research Center (M01-RR-01066); the University of Colorado Health Sciences Center General Clinical Research Center (M01-RR-00051) and Clinical Nutrition Research Unit (P30 DK48520); the University of Tennessee at Memphis General Clinical Research Center (M01RR00211-40); the University of Pittsburgh General Clinical Research Center (M01RR000056 44) and NIH grant (DK 046204); and the University of Washington / Veterans Affairs Puget Sound Health Care System Medical Research Service, Department of Veterans Affairs. The following organizations have committed to make major contributions to Look AHEAD: Federal Express; Health Management Resources; Johnson & Johnson, LifeScan Inc.; Optifast-Novartis Nutrition; Roche Pharmaceuticals; Ross Product Division of Abbott Laboratories; and Slim-Fast Foods Company.
Appendix
We defined overall ABI for individual ‘i’ be λi and assumed that brachial SBPs for this individual were centered at mean θi, with random effects for arm (αij) and replicate measurements (ρAk) that followed Gaussian distributions of N(0,σ2α) and N(0,σ2ρ(α)), respectively. We also assumed that ankle SBPs were centered at mean λiθi, with random effects for ankle site (βij) and replicate measurements (ρBk) that were drawn from the Gaussian distributions N(0,σ2β) and N(0,σ2ρ(β)), respectively. If xijk denotes a single SBP measurement, these assumptions set the expected value of brachial, posterior tibial, and dorsal pedis artery SBP measurements to be, respectively:
E[xijk] = θi + αij + ρAk where j = 1,2 denotes the right and left brachial artery site
E[xijk] = λi θi + βij + ρBk where j = 3,4 denotes the right and left posterior tibial artery site
E[xijk] = λi θi + βij + ρBk where j = 5,6 denotes the right and left dorsal pedis artery site.
Subscript k = 1, 2, or 3 denotes the first, second, or (only in Protocol 1) third replicate measurement by Look AHEAD at each site. The assumption that SBP measurement error was equal at arm and leg sites (σ2ρ(α)) = σ2ρ(β)) was supported by the data.
We used the standard Bayesian algorithm of Gibbs sampling,14 which provided flexibility for exploring different distributions for λi and, given the facility of this approach for addressing missing data, allowed SBP measures from the three different Look AHEAD protocols to be easily accommodated. All models were fitted with the Bayesian Inference Using Gibbs Sampling (BUGS) software package.16 Non-informative priors were assumed for each of the underlying parameters. After a ‘burn-in’ phase during which 5000 samples were discarded, the next 5000 samples were used to estimate the posterior distribution for parameters. Analyses were re-run from a range of starting points, which yielded congruent results. From graphical inspection of the sequential samples, it appeared that the estimation process was stationary and that 5000 runs were sufficient to provide stable estimates. The medians of these posterior distributions were reported as point estimates. The 95% equal-tail credible intervals were also reported, which are roughly analogous of 95% confidence intervals.
We used simulation-based estimates generated from these analyses to examine how the SBP measurement error (i.e.σ2ρ(α)) and σ2ρ(β)) affects observed ABI. For consistency, we focused on the special case in which there were no differences between arms and among ankle sites: αij = βij = 0 or all i and j.
Footnotes
Disclosures: No conflicts to report.
References
- 1.Hiatt WR, Hoag S, Hamman RF. Effect of diagnostic criteria on the prevalence of peripheral arterial disease: The San Luis Valley Diabetes Study. Circulation. 1995;91:1472–1479. doi: 10.1161/01.cir.91.5.1472. [DOI] [PubMed] [Google Scholar]
- 2.Greenland P, Abrams J, Aurigemma GP, et al. Beyond secondary prevention: identifying the high-risk patient for primary prevention: noninvasive tests of atherosclerotic burden. Circulation. 2000;101:e16–e222. doi: 10.1161/01.cir.101.1.e16. [DOI] [PubMed] [Google Scholar]
- 3.Hiatt WR. Medical treatment of peripheral arterial disease and claudication. N Engl J Med. 2001;344:1608–1621. doi: 10.1056/NEJM200105243442108. [DOI] [PubMed] [Google Scholar]
- 4.Murabito JM, Evans JC, Larson MG, Nieto K, Levy D, Wilson PWF. The ankle–brachial index in the elderly and risk of stroke, coronary disease, and death. The Framingham Study. Arch Intern Med. 2003;163:1939–1942. doi: 10.1001/archinte.163.16.1939. [DOI] [PubMed] [Google Scholar]
- 5.Resnick HE, Lindsay RS, McDermott MM, et al. Relationship of high and low ankle brachial index to all-cause and cardiovascular disease mortality: the Strong Heart Study. Circulation. 2004;109:733–739. doi: 10.1161/01.CIR.0000112642.63927.54. [DOI] [PubMed] [Google Scholar]
- 6.Lee AJ, Price JF, Russell MJ, Smith FB, van Wijk MCW, Fowkes FGR. Improved prediction of fatal myocardial infarction using the ankle brachial index in addition to conventional risk factors. The Edinburgh Artery Study. Circulation. 2004;110:3075–3080. doi: 10.1161/01.CIR.0000143102.38256.DE. [DOI] [PubMed] [Google Scholar]
- 7.Koji Y, Tomiyama H, Ichihashi H, et al. Comparison of ankle–brachial pressure index and pulse wave velocity as markers of the presence of coronary disease in subjects with high risk of atherosclerotic disease. Am J Cardiol. 2004;94:868–872. doi: 10.1016/j.amjcard.2004.06.020. [DOI] [PubMed] [Google Scholar]
- 8.Lange S, Trampisch HJ, Haberl R, et al. Excess 1-year cardiovascular risk in elderly primary care patients with a low ankle–brachial index (ABI) and high homocysteine level. Atherosclerosis. 2005;178:351–357. doi: 10.1016/j.atherosclerosis.2004.09.003. [DOI] [PubMed] [Google Scholar]
- 9.McDermott MM, Liu K, Criqui MH, et al. Ankle–brachial index and subclinical cardiac and carotid disease. The Multi-Ethnic Study of Atherosclerosis. Am J Epidemiol. 2005;162:33–41. doi: 10.1093/aje/kwi167. [DOI] [PubMed] [Google Scholar]
- 10.Kweon SS, Shin MH, Park KS, et al. Distribution of the ankle–brachial index and associated cardiovascular risk factors in a population of middle-aged and elderly Koreans. J Korean Med Sci. 2005;20:373–378. doi: 10.3346/jkms.2005.20.3.373. [DOI] [PMC free article] [PubMed] [Google Scholar]
- 11.Look AHEAD Research Group. Look AHEAD: Action for Health in Diabetes. Design and methods for a clinical trial of weight loss for the prevention of cardiovascular disease in type 2 diabetes. Control Clin Trials. 2003;24:610–628. doi: 10.1016/s0197-2456(03)00064-3. [DOI] [PubMed] [Google Scholar]
- 12.Look AHEAD Research Group. The Look AHEAD Study: a description of the lifestyle intervention and the evidence supporting it. Obesity. 2006;14:737–752. doi: 10.1038/oby.2006.84. [DOI] [PMC free article] [PubMed] [Google Scholar]
- 13.D'Agostino RB, Russell MW, Huse DM, et al. Primary and subsequent coronary risk appraisal: new results from The Framingham Study. Am Heart J. 2000;139:272–281. doi: 10.1067/mhj.2000.96469. [DOI] [PubMed] [Google Scholar]
- 14.Gilks WR, Richardson S, Spiegelhalter DJ. Introducing Markov chain Monte Carlo. In: Gilks WR, Richardson S, Spiegelhalter DJ, editors. Markov Chain Monte Carlo in practice. London: Chapman and Hall; 1996. pp. 1–21. [Google Scholar]
- 15.Fitzmaurice GM, Laird NM, Ware JH. Applied longitudinal analysis. New York: Wiley and Sons; 2004. pp. 200–205. [Google Scholar]
- 16.Spiegelhalter D, Thomas A, Best N, et al. BUGS 0.5: Bayesian inference Using Gibbs Sampling manual (Version ii) Cambridge, England: MRC Biostatistics Unit; 1996. [Google Scholar]