

Abstract
In the intact eye, the transition from light to dark alters pH, [Ca2+], and [K] in the subretinal space (SRS) separating the photoreceptor outer segments and the apical membrane of the retinal pigment epithelium (RPE). In addition to these changes, oxygen consumption in the retina increases with a concomitant release of CO2 and H2O into the SRS. The RPE maintains SRS pH and volume homeostasis by transporting these metabolic byproducts to the choroidal blood supply. In vitro, we mimicked the transition from light to dark by increasing apical bath CO2 from 5 to 13%; this maneuver decreased cell pH from 7.37 ± 0.05 to 7.14 ± 0.06 (n = 13). Our analysis of native and cultured fetal human RPE shows that the apical membrane is significantly more permeable (≈10-fold; n = 7) to CO2 than the basolateral membrane, perhaps due to its larger exposed surface area. The limited CO2 diffusion at the basolateral membrane promotes carbonic anhydrase–mediated HCO3 transport by a basolateral membrane Na/nHCO3 cotransporter. The activity of this transporter was increased by elevating apical bath CO2 and was reduced by dorzolamide. Increasing apical bath CO2 also increased intracellular Na from 15.7 ± 3.3 to 24.0 ± 5.3 mM (n = 6; P < 0.05) by increasing apical membrane Na uptake. The CO2-induced acidification also inhibited the basolateral membrane Cl/HCO3 exchanger and increased net steady-state fluid absorption from 2.8 ± 1.6 to 6.7 ± 2.3 µl × cm−2 × hr−1 (n = 5; P < 0.05). The present experiments show how the RPE can accommodate the increased retinal production of CO2 and H2O in the dark, thus preventing acidosis in the SRS. This homeostatic process would preserve the close anatomical relationship between photoreceptor outer segments and RPE in the dark and light, thus protecting the health of the photoreceptors.
INTRODUCTION
The retinal pigment epithelium (RPE) is a polarized monolayer of cells that forms a part of the blood–retina barrier in the back of the vertebrate eye. This epithelium separates the choroidal blood supply from the extracellular or subretinal space (SRS) that surrounds the retinal photoreceptors. By transporting ions and fluid from the SRS to the choroid (Hughes et al., 1998; Maminishkis et al., 2002), the RPE plays a critical role in maintaining the volume and chemical composition of the SRS. Large amounts of CO2 and H2O are deposited into the SRS due to the high metabolic activity of the photoreceptors (Wangsa-Wirawan and Linsenmeier, 2003). The high choroidal blood flow, ≈1,200 ml/min/100 g (Alm and Bill, 1987), provides a sink for the removal of these metabolites. Failure to remove CO2 would result in acidosis detrimental to retinal function (Sillman et al., 1972; Meyertholen et al., 1986; Takahashi et al., 1993). In addition, abnormal accumulation of fluid in the SRS can cause retinal detachment and degeneration (Fisher et al., 2005).
The RPE expresses several different HCO3 transport proteins at the apical and basolateral membranes as illustrated in Fig. 1 (Hughes et al., 1989; Kenyon et al., 1997). As in other epithelia, the activities of these transporters in human RPE can be facilitated by carbonic anhydrases (CAs) expressed in the cytosol (CA II), on the apical membrane (CA IV, CA IX, CA XII, and CA XIV), or on the basolateral membrane (CA IX) (Casey, 2006; Purkerson and Schwartz, 2007; Zhi, C.G., F.E. Wang, T. Banzon, S. Jalickee, R. Fariss, A. Maminishkis, and S.S. Miller. 2007. Membrane-Bound Carbonic Anhydrases in Human Fetal Retinal Pigment Epithelial Cells (hfRPE)). The removal of CO2 from the SRS can be achieved by diffusion across the RPE or by conversion to HCO3 using the catalytic activity of CAs for transmembrane transport via HCO3 transporters, or both. CO2 diffusion into the RPE drives CA-mediated formation of HCO3 and protons that acidify the cell. Transporter-mediated HCO3 entry mitigates this acidification and helps maintain pH homeostasis in the RPE (Kenyon et al., 1997) and in the SRS (Borgula et al., 1989).
Figure 1.

13% apical CO2 increases net solute and fluid absorption across the RPE. The transporters and channels depicted in this model are adopted from earlier studies of frog, bovine, human, and cultured human RPE. Apical membrane proteins: Na/K ATPase, Na/K/2Cl cotransporter (NKCC1), Na/H exchanger (NHE), and Na/2HCO3 cotransporter (NBC1). Basolateral membrane proteins: Ca2+-activated Cl channels, cAMP-sensitive CFTR, Cl/HCO3 exchanger (AE2), and Na/nHCO3 cotransporter (NBC). Increasing apical CO2 increases Na (Cl + HCO3) and fluid absorption from the SRS to the choroid.
The close physiological relationship between HCO3 and fluid transport was demonstrated in frog RPE, where steady-state fluid absorption was reduced by ≈70% after the removal of HCO3 from both bathing solutions (Hughes et al., 1984). In cultured human fetal RPE (hfRPE), dorzolamide (DZA; nonspecific CA inhibitor) decreases steady-state fluid absorption (Zhi, C.G., F.E. Wang, T. Banzon, S. Jalickee, R. Fariss, A. Maminishkis, and S.S. Miller. 2007. Membrane-Bound Carbonic Anhydrases in Human Fetal Retinal Pigment Epithelial Cells (hfRPE)), suggesting the involvement of CA-mediated HCO3 transport in fluid transport. These in vitro results are in contrast to in vivo animal studies that suggest that acetazolamide (nonspecific CA inhibitor) enhances retinal adhesion and SRS fluid clearance (Kita and Marmor, 1992; Wolfensberger et al., 2000). In addition, clinical studies showed that some patients with macular edema respond to acetazolamide treatment by increasing SRS fluid clearance (Cox et al., 1988; Fishman et al., 1989), but the underlying physiological mechanisms remain to be determined.
In vivo studies of retinal metabolism indicate an increase in SRS CO2 level after the transition from light to dark (Wangsa-Wirawan and Linsenmeier, 2003). The present in vitro study investigates how an increase in apical CO2 level can alter the activities of apical and basolateral membrane ion transporters to drive solute-linked fluid from the SRS to the choroid. We show that the RPE basolateral membrane has a significantly lower CO2 permeability than the apical membrane. Therefore, an increase in apical CO2 would cause an accumulation of intracellular CO2 that is subsequently converted into HCO3 by the catalytic activity of CA II; this in turn stimulates HCO3 efflux at the basolateral membrane. We also show that the increase in apical CO2 affects several ion transporters at the apical and basolateral membranes that would lead to a net increase in Na, Cl, and HCO3 absorption and active solute-linked fluid transport across the RPE. The transition from light to dark is accompanied by an increase in photoreceptor metabolism. In vivo, the RPE can respond to the increased metabolic load by increasing the clearance of CO2/HCO3 and fluid from the SRS. This would help protect and maintain the health and integrity of the retina–RPE complex by preventing acidosis in the SRS and an abnormal separation of retina and RPE.
MATERIALS AND METHODS
hfRPE and bovine RPE preparation, and hfRPE culture
The methods used to extract intact native hfRPE monolayers and grow hfRPE cultures have been described previously (Maminishkis et al., 2006). Bovine RPE choroid was excised from fresh bovine eyes as described previously (Kenyon et al., 1997). The research presented in this study was performed in accordance with the tenets of the Declaration of Helsinki and the National Institutes of Health (NIH) institutional review board.
Intracellular pH (pHi) measurements
Cultured hfRPE monolayer grown on a porous polyester membrane transwell filter was incubated at room temperature and 5% CO2 for 30 min in Ringer solution containing 8 µM BCECF-AM (Invitrogen) pH-sensitive dye, 0.1% DMSO, and 0.01% pluronic acid. After incubation with BCECF-AM, the tissue was incubated in control (5% CO2) Ringer for another 30 min before mounting on a mesh (250 µM) in a modified Üssing chamber (exposed surface area of 7.1 mm2). The Üssing chamber was mounted on the stage of an axiovert-200 microscope (Carl Zeiss, Inc.) equipped with a 20× plan-neofluar objective. The hfRPE was continuously perfused with Ringer solution (equilibrated with 5% CO2 at 36.5°C) at a flow rate of 2 ml × min−1. Excitation photons (440/480 nm) were generated by a xenon light source, and the specific wavelengths were selected with a monochromator (Polychrome IV; Photonics). The emission fluorescence signals were captured with a photomultiplier tube (Thorn EMI). pHi calibrations were performed by perfusing high-K calibration solutions (at pH 6.8, 7.2, and 7.6) containing 20 µM nigericin into both solution baths. The average calibration parameters were used to linearly correlate fluorescence intensity to pHi for all pH-imaging experiments. We estimated the rate of dye loss from the RPE by calculating the percentage rate of loss of intracellular BCECF (k440) at intervals of 0.5 min with the following equation (Bevensee et al., 1995):
 , ,
|
where ( ) is the difference in BCECF fluorescence intensity between Δt = 0.5-min intervals. From 30 experiments, the average k440 was −2.21 ± 0.50% × min−1.
Intracellular Na measurements
Cultured hfRPE monolayers were incubated in control Ringer containing 22 µM SBFI-AM (Invitrogen), 0.18% DMSO, and 0.02% pluronic acid for 1 h at room temperature and 5% CO2. After incubating with SBFI-AM, the hfRPE was mounted onto the modified Üssing chamber. Fluorescent signals corresponding to intracellular Na concentration ([Na]i) were obtained by alternating the excitation wavelength between 340 and 380 nm. A three-point calibration was performed at the end of the experiment (Harootunian et al., 1989). In brief, high K+ (85-mM) calibration solutions containing 0, 10, or 30 mM [Na] and 10 µM gramicidin were perfused simultaneously to both the apical and basal baths. The fluorescence ratio for each [Na]o was used to obtain a calibration curve for the experiment.
Transepithelial potential (TEP) and total tissue resistance (RT) measurements
TEP was measured with a pair of calomel electrodes in series with Ringer solution agar (4% wt/vol) bridges placed in the apical and basal baths of the Üssing chamber. The electrophysiology of the RPE was described previously in detail (Hughes et al., 1998). All TEP recordings are moving averages of 3 s. The RT was calculated from Ohm’s law,
 |
where ΔTEP is the TEP deflection when a 3-µA Current was passed across the hfRPE monolayer (once every minute) with Ag/AgCl electrodes, and Area is the cross-sectional surface area of the RPE. All hfRPE culture preparations had an RT ≥ 200 Ω × cm2.
Estimating intrinsic buffering capacity
The intrinsic buffering capacity (βi mM/pH units) of the hfRPE cells was determined by using a previously described method (Weintraub and Machen, 1989) and was fitted to a third-order polynomial: βi = −93.4pHi3 + 2150.4pHi2 + 16483.6pHi + 42065.6 for pHi < 7.35, and for 7.35 ≤ pHi ≤ 7.7, βi = 9.06. The total buffering capacity (βtotal) was then calculated with the equation, βtotal = βi + βHCO3 = βi +2.3[HCO3]i. [HCO3]i was estimated from the Henderson-Hasselbalch equation with the assumption that intracellular CO2 level is 5%. H+ flux was determined by multiplying βtotal by an estimate of the initial dpHi/dt determined from the pHi response.
Steady-state fluid transport measurements
hfRPE monolayers cultured on porous membrane were mounted in a modified Üssing chamber, and the rate of transepithelial water flow (steady-state fluid absorption rate [JV]) was measured using a refined capacitance probe technique as described previously (Hughes et al., 1984; Maminishkis et al., 2006). The TEP and RT of the hfRPE monolayer were measured by injecting bipolar currents via Ag/AgCl pellet electrodes that were connected to the solution baths with agar bridges (4% wt/vol). All fluid transport experiments were performed in a Steri-Cult CO2 incubator (Thermo Fisher Scientific) at 37°C and 5% CO2. After a 15–30-min incubation in control Ringer (5% CO2), steady-state JV, TEP, and RT were reached and recorded. Next, the incubator CO2 control was set to 13%, and both bathing solutions were completely replaced with 13% CO2-equilibrated Ringer. After waiting another 15–30 min for JV, TEP, and RT to reach steady state, the values of these parameters were recorded.
Ringer solutions and chemicals
The ionic composition of the control Ringer solution was based on MEM solution (Sigma-Aldrich). Control CO2/HCO3-buffered solution (pH 7.51 with 5% CO2, pH 7.09 with 13% CO2, and pH 8.20 with 1% CO2) contains (in mM): 143.7 Na+, 126.1 Cl−, 26.2 HCO3−, 5 K+, 1 H2PO4−, 0.5 Mg2+, 1.8 Ca2+, 2 taurine, and 5 glucose. Low Cl (1 mM) Ringer (pH 7.5 when equilibrated with 5% CO2) was prepared by replacing all Cl−salts with gluconate salts (except for MgCl2). The high gluconate concentration (128.7 mM) in the low Cl Ringer requires consideration of the strong Ca2+- and Mg2+-chelating ability of gluconate. By using the stability constants of Ca and Mg gluconate (Furia, 1972), the estimated free [Ca2+] and [Mg2+] in the low Cl Ringer are 0.6 and 0.3 mM, respectively. As a test, the low Cl Ringer was supplemented with additional Ca2+ (to 5.7 mM) and Mg2+ (to 0.84 mM) to give free [Ca2+] and [Mg2+] of 1.8 and 0.5 mM, respectively. This adjustment did not significantly affect the low basal bath [Cl]-induced pHi, TEP, and RT responses. Low HCO3 Ringer (2.62 mM HCO3; pH 6.5 when equilibrated with 5% CO2) was prepared by replacing 23.58 mM NaHCO3 with equimolar Na gluconate. Ca2+/Mg2+-free Ringer was made by replacing all CaCl2 and MgCl2 with 4.6 mM NMDG-Cl. Sucrose was added to Ringer solutions to achieve osmolarity of 300 ± 5 mOsm. 0.5 mM probenecid was added to all Ringer solutions used in pHi and Na imaging experiments to slow dye leakage from the hfRPE. In fluid transport experiments, hfRPE culture media (300 mOsm and without any additives) equilibrated in 1, 5, or 13% CO2 was used. DZA hydrochloride was purchased from U.S. Pharmacopeia. 4,4′-diisothiocyanostilbene-2,2′-disulfonic acid (DIDS) and nigericin were purchased from EMD. All other chemicals were purchased from Sigma-Aldrich.
All values within this report are presented as means ± SD. Statistical significance was evaluated by using the Student’s t test (paired, two tailed). A p-value of <0.05 is considered statistically significant.
RESULTS
Apical or basal CO2-induced pHi responses in hfRPE
Fig. 2 A shows that increasing CO2 from 5 to 13% in the apical or basal baths acidified the hfRPE by ≈0.25 and ≈0.04, respectively. Data from 13 experiments show that 13% apical CO2 decreased pHi by 0.23 ± 0.03, from 7.37 ± 0.05 to 7.14 ± 0.06; in contrast, the 13% basal bath CO2-induced acidification (ΔpHi = 0.03 ± 0.01) was almost eightfold smaller. Similarly in Fig. 2 B, decreasing CO2 from 5 to 1% in the apical or basal baths alkalinized the hfRPE by ≈0.35 and ≈0.03, respectively. In four experiments, 1% apical or basal bath CO2 alkalinized the cell by 0.41 ± 0.05 and 0.03 ± 0.03, respectively. The CO2-induced changes in TEP and RT were relatively small and not significant statistically. In freshly isolated native hfRPE preparations, 13% apical CO2 also caused significantly larger acidification (ΔpHi = 0.29 ± 0.04) than 13% basal CO2 (ΔpHi = 0.03 ± 0.02; n = 4). This difference in the apical/basolateral CO2-induced pHi response is even more pronounced in bovine RPE choroid preparations. No pHi response to 13% basal CO2 was observed, but a significant acidification was produced by 13% apical CO2 (ΔpHi = 0.39 ± 0.09; n = 6).
Figure 2.

CO2 flux across the apical and basolateral membranes. (A) 13% CO2-equilibrated Ringer was perfused into the apical or basal bath. (B) 1% equilibrated Ringer was perfused into the apical or basal bath. The solid bars above the graph represent the beginning and end of a solution change (from control Ringer). The alteration in Ringer composition or the addition of drugs is indicated on the label above the solid bars. The time bar applies to pHi, TEP, and RT measurements and is located under the TEP/RT panels. In each experiment, pHi, TEP, and RT were measured simultaneously.
Tight junctions physically separate the RPE apical and basolateral membranes. Disruption of this barrier, by removing bath Ca2+ and Mg2+, could provide a paracellular pathway for movement of CO2 from the basal bath to the apical membrane. To test this notion, we increased basal bath CO2 (from 5 to 13%) 15 min after the removal of Ca2+ and Mg2+ from both bathing solutions. Upon Ca2+ and Mg2+ removal, RT rapidly decreased at a rate of 17.3 ± 7.3 Ω × cm2 × min−1 (n = 5). However, after 15 min in Ca2+- and Mg2+-free Ringer, the 13% basal bath CO2-induced acidification was not significantly different than control (0.02 ± 0.01 vs. 0.02 ± 0.01; n = 5; P > 0.05), suggesting that basal bath CO2 does not enter the apical membrane by diffusing across the tight junctions. When Ca2+ and Mg2+ were restored to the solution baths, RT slowly recovered at a rate of 11.9 ± 4.0 Ω × cm2 × min−1, but the recovery rate decreases significantly after ≈15–20 min, and RT recovered by only ≈40%.
Apical membrane electrogenic Na/2HCO3 cotransporter in hfRPE
We tested apical Na/2HCO3 cotransport activity by adding apical DIDS and comparing the resultant pHi and TEP responses in control Ringer (26.2 mM HCO3) versus low HCO3 Ringer (2.62 mM HCO3) in the apical bath (Fig. 3 A). Data from six experiments showed that in control Ringer, apical DIDS acidified the cell by 0.05 ± 0.02 and decreased TEP by 1.59 ± 0.63 mV, whereas adding apical DIDS in low apical bath [HCO3] alkalinized the cell by 0.04 ± 0.01 and transiently increased TEP by 0.30 ± 0.15 mV; these responses are reversible. The apical DIDS-induced pHi and TEP responses are consistent with the inhibition of an electrogenic HCO3-dependent mechanism, whose activity can be reversed by a 10-fold reduction in apical bath [HCO3].
Figure 3.

DIDS-sensitive Na/2HCO3 cotransporter at the apical membrane. (A) 0.5 mM DIDS was added to the apical bath to obtain initial control response (pHi, TEP, and RT). The DIDS-induced response was then obtained in the presence of low (2.62 mM) HCO3 Ringer in the apical bath. After washout with control Ringer, DIDS was added to the apical bath to obtain the final control response. (B) Low HCO3 (2.62 mM) Ringer was perfused into the apical bath to obtain initial control response. The low basal bath [HCO3]-induced response was then obtained in the presence of 0.5 mM of apical DIDS. After DIDS washout, low basal bath [HCO3]-induced control response was obtained. Solid bars above the graphs represent solution changes from control Ringer as described in the legend to Fig. 2.
To evaluate the potency of 0.5 mM of apical DIDS in the inhibition of the apical membrane Na/2HCO3 cotransporter, we decreased apical bath [HCO3] 10-fold and compared the resultant pHi and TEP responses in the presence or absence of apical DIDS (Fig. 3 B). In three experiments, DIDS reduced the apical bath Δ[HCO3]-induced TEP response by sevenfold, from 2.1 ± 0.2 to 0.3 ± 0.2 mV (P < 0.01). The effect of DIDS on the TEP response was partially reversible after a 5-min washout (ΔTEP = 1.28 ± 0.22 mV). This result suggests that apical DIDS almost completely blocked the apical membrane Na/2HCO3 cotransporter activity. Surprisingly, the apical bath Δ[HCO3]-induced acidification (ΔpHi = 0.10 ± 0.02) was not significantly affected by DIDS (ΔpHi = 0.09 ± 0.01; n = 3; P > 0.05), suggesting the presence of an electroneutral and DIDS-insensitive HCO3 transporter at the apical membrane (see Discussion).
Apical bath CO2 may be converted into HCO3 by transmembrane CAs on the apical membrane surface, thus stimulating apical Na/2HCO3 cotransport activity. Therefore, we tested the effect of altering apical bath CO2 on apical Na/2HCO3 cotransport activity by comparing apical DIDS (0.5 mM) -induced pHi and TEP responses in control Ringer (5% CO2) to that in 1 or 13% CO2-equilibrated Ringer (Fig. 4 A). In four experiments, apical DIDS-induced pHi and TEP responses in control Ringer (ΔpHi = 0.05 ± 0.02; ΔTEP = 1.52 ± 0.33 mV) were the same as that in 13% CO2-equilibrated Ringer (ΔpHi = 0.05 ± 0.02; ΔTEP = 1.57 ± 0.67 mV; P > 0.05). Similarly, the apical DIDS-induced pHi and TEP responses in control Ringer (ΔpHi = 0.05 ± 0.02; ΔTEP = 1.66 ± 0.59 mV) were the same as that in 1% CO2-equilibrated Ringer (ΔpHi = 0.06 ± 0.02; ΔTEP = 1.31 ± 0.78 mV; n = 5; P > 0.05). To further test the pHi sensitivity of the apical membrane Na/2HCO3 cotransporter, we perfused 13% CO2-equilibrated Ringer into the apical bath in the presence or absence of 0.5 mM of apical DIDS (Fig. 4 B). If increasing apical bath CO2 increases apical Na/2HCO3 cotransport activity, 13% apical CO2 should cause a larger acidification in the presence of apical DIDS compared with control. However, in the presence of apical DIDS, the 13% CO2-induced acidification (ΔpHi = 0.22 ± 0.03) was the same as control (ΔpHi = 0.22 ± 0.02; n = 4; P > 0.05). Collectively, these results lead to the conclusion that apical Na/2HCO3 cotransport activity is not affected by apical CO2-induced alterations in pHi.
Figure 4.

Effect of apical bath CO2 on apical membrane Na/2HCO3 cotransporter. (A) 0.5 mM DIDS was added to the apical bath to obtain initial control response. The DIDS-induced response was then obtained in the presence of 13% apical bath CO2. After washout with control Ringer, DIDS was added to the apical bath to obtain the final control response. (B) 13% CO2-equilibrated Ringer was perfused into the apical bath to record the initial control response. This maneuver was repeated in the presence of 0.5 mM of apical DIDS. After DIDS washout, 13% apical CO2-induced control response was obtained. Solid bars above the graphs represent solution changes from control Ringer as described in the legend to Fig. 2.
CA II catalyzes the interconversion of CO2 and HCO3 in the cytosol, and CA inhibition by DZA may affect apical Na/2HCO3 cotransport activity. We tested this notion by decreasing apical bath [HCO3] (10-fold) and compared the resultant pHi and TEP responses in the presence of 250 µM of apical DZA to that in control (Fig. 5). In five experiments, DZA decreased apical bath Δ[HCO3]-induced TEP response by 60% (from 2.25 ± 0.81 to 0.89 ± 0.29 mV; P < 0.01) and increased the pHi response from 0.11 ± 0.01 to 0.19 ± 0.01 (P < 0.01). The effect of DZA on the pHi and TEP responses was partially reversible after a 5-min washout in control Ringer (ΔTEP = 1.27 ± 0.46 mV; ΔpHi = 0.17 ± 0.02). The reduced apical bath Δ[HCO3]-induced TEP response in the presence of DZA indicates inhibition of apical Na/2HCO3 cotransport activity. On the other hand, the apical bath Δ[HCO3]-induced acidification was larger in the presence of DZA because CA II inhibition reduces intracellular CO2/HCO3 buffering capacity, which compromises the ability of the RPE to buffer the acidification caused by HCO3 efflux from the apical membrane.
Figure 5.

CA II dependence of apical membrane Na/2HCO3 cotransporter. Low HCO3 (2.62 mM) Ringer was perfused into the apical bath to record the initial control response. This maneuver was repeated in the presence of 250 µM of apical DZA. After DZA washout, low apical bath [HCO3]-induced control response was obtained. Solid bars above the graphs represent solution changes from control Ringer as described in the legend to Fig. 2.
Basolateral membrane Cl/HCO3 exchanger activity in hfRPE
To assess basolateral membrane Cl/HCO3 exchanger activity, basal bath [Cl] was reduced from 126 to 1 mM, which alkalinized the cell by ≈0.22 (Fig. 6). In three experiments, this alkalinization (ΔpHi = 0.18 ± 0.05) was abolished by 0.5 mM of basal DIDS (ΔpHi = 0.02 ± 0.01; n = 3; P < 0.05), but this effect was not reversible. Next, we tested the pHi dependence of the Cl/HCO3 exchanger by comparing the basal bath Δ[Cl]-induced pHi response in 5 versus 13% apical bath CO2 (Fig. 7 A). The steady-state pHi in 5 and 13% apical bath CO2 differed significantly, which required us to use the total buffering capacity of the hfRPE to calculate equivalent H+ fluxes. In the presence of 13% CO2-equilibrated Ringer in the apical bath, the basal bath Δ[Cl]-induced change in H+ flux was 2.3 ± 1.0 mM × min−1, approximately fourfold smaller than the H+ flux in 5% CO2 (9.0 ± 4.5 mM × min−1; n = 7; P < 0.01); this effect was fully reversible. Fig. 7 B summarizes a parallel experiment in which basal bath [Cl] was reduced in the presence of 1% CO2-equilibrated Ringer in the apical bath. In this case, the basal bath Δ[Cl]-induced proton flux was 27.4 ± 10.8 mM × min−1, or approximately fivefold larger than the flux in 5% CO2 (5.9 ± 6.5 mM × min−1; n = 5; P = 0.01). These experiments indicate that the DIDS-sensitive basolateral membrane Cl/HCO3 exchanger in hfRPE is pHi dependent.
Figure 6.

DIDS sensitivity of basolateral membrane Cl/HCO3 exchanger. Low (1 mM) Cl Ringer was perfused into the apical bath to record the initial control response. This maneuver was repeated in the presence of 0.5 mM of apical DIDS. After DIDS washout, the low basal bath [Cl]-induced control response was obtained. Solid bars above the graphs represent solution changes from control Ringer as described in the legend to Fig. 2.
Figure 7.

pH sensitivity of basolateral membrane Cl/HCO3 exchanger. Low (1 mM) Cl Ringer was perfused into the apical bath to record the initial control response. This maneuver was then repeated in (A) 13% or (B) 1% apical bath CO2. After returning to control Ringer, low basal bath [Cl]-induced control response was obtained. Solid bars above the graphs represent solution changes from control Ringer as described in the legend to Fig. 2.
Basolateral membrane electrogenic Na/nHCO3 cotransport in hfRPE
In confluent monolayers of hfRPE, reducing basal bath [HCO3] 10-fold (5% CO2) acidified the cells by 0.20 ± 0.05, with an equivalent H+ flux of 6.2 ± 1.5 mM × min−1 (n = 45), and increased TEP by 1.18 ± 0.60 mV (n = 53; Figs. 8–12 and Tables I and II). This TEP response is consistent with a basolateral membrane depolarization resulting from electrogenic Na/nHCO3 cotransport activity. We evaluated the DIDS sensitivity of this basolateral membrane Na/nHCO3 cotransporter by comparing the basal bath Δ[HCO3]-induced pHi and TEP responses in the presence of 0.5 mM of basal DIDS to that in control (Fig. 8). In five experiments, basal DIDS reduced the basal bath Δ[HCO3]-induced acidification from 0.20 ± 0.04 to 0.09 ± 0.05 (P < 0.05), and reduced the TEP response from 1.41 ± 0.69 to 0.42 ± 0.29 mV (P < 0.05). The inhibitory effect of DIDS on the pHi and TEP responses was irreversible after a 5-min washout with control Ringer (ΔpHi = 0.12 ± 0.03; ΔTEP = 0.56 ± 0.25 mV; P > 0.05).
Figure 8.

DIDS sensitivity of basolateral membrane Na/nHCO3 cotransporter. Low HCO3 (2.62 mM) Ringer was perfused into the basal bath to record the pHi, TEP, and RT responses, first in the absence and then in the presence of 0.5 mM of basal DIDS. After DIDS washout, low basal bath [HCO3]-induced control response was obtained. Solid bars above the graphs represent solution changes from control Ringer as described in the legend to Fig. 2.
Figure 9.

Na dependence of basolateral membrane Na/nHCO3 cotransporter. Low HCO3 (2.62 mM) Ringer was perfused into the basal bath to record the initial control response, and this maneuver was repeated in the absence of Na in both the apical and basal baths. After returning to control Ringer, low basal bath [HCO3]-induced control response was obtained. Solid bars above the graphs represent solution changes from control Ringer as described in the legend to Fig. 2.
Figure 10.

Linked activity of the apical and basolateral membrane Na/HCO3 cotransporters. Low HCO3 (2.62 mM) Ringer was perfused into the basal bath to obtain the initial control response, and this maneuver was then repeated in the presence of 0.5 mM of apical DIDS. After DIDS washout, the low basal bath [HCO3]-induced control response was obtained. Solid bars above the graphs represent solution changes from control Ringer as described in the legend to Fig. 2.
Figure 11.

CA II dependence of basolateral membrane Na/nHCO3 cotransporter. Low HCO3 (2.62 mM) Ringer was perfused into the basal bath to record the pHi, TEP, and RT responses, first in the absence and then in the presence of 250 µM of basal DZA. After DZA washout, low basal bath [HCO3]-induced control response was obtained. Solid bars above the graphs represent solution changes from control Ringer as described in the legend to Fig. 2.
Figure 12.

Effect of apical bath CO2 on basolateral membrane Na/nHCO3 cotransporter. Low HCO3 (2.62 mM) Ringer was perfused into the basal bath to record the initial control response, and this maneuver was repeated in (A) 13% or (B) 1% apical bath CO2. After returning to control Ringer, low basal bath [HCO3]-induced control response was obtained. Solid bars above the graphs represent solution changes from control Ringer as described in the legend to Fig. 2.
TABLE I.
Summary of basal bath Δ[HCO3]-induced pHi responses
| Inhibitor/conditiona | 2.62 mM basal bath [HCO3]-induced pHi responseb | ||||||
| Apical | Basal | Data | Control | w/inhibitor | Recovery | Pc | n |
| DIDS | ΔpHi | −0.20 ± 0.04 | −0.09 ± 0.05 | −0.12 ± 0.03 | <0.05 | 5 | |
| H+ flux | −6.5 ± 1.2 | −3.6 ± 2.7 | −4.3 ± 1.3 | <0.05 | |||
| Na-free | Na-free | ΔpHi | −0.21 ± 0.04 | −0.08 ± 0.01 | −0.14 ± 0.02 | <0.05 | 3 |
| H+ flux | −7.2 ± 1.7 | −2.8 ± 0.7 | −4.9 ± 0.8 | <0.05 | |||
| amiloride | ΔpHi | −0.22 ± 0.03 | −0.28 ± 0.05 | −0.21 ± 0.04 | <0.05 | 5 | |
| H+ flux | −7.1 ± 1.3 | −8.3 ± 1.6 | −5.7 ± 1.4 | <0.05 | |||
| bumetanide | ΔpHi | −0.20 ± 0.03 | −0.21 ± 0.03 | −0.22 ± 0.03 | >0.05 | 4 | |
| H+ flux | −6.9 ± 1.8 | −6.8 ± 0.9 | −7.6 ± 1.6 | >0.05 | |||
| ouabain | ΔpHi | −0.18 ± 0.02 | −0.20 ± 0.02 | −0.23 ± 0.03 | >0.05 | 3 | |
| H+ flux | −5.1 ± 2.1 | −5.4 ± 3.2 | −5.7 ± 2.7 | >0.05 | |||
| DIDS | ΔpHi | −0.19 ± 0.03 | −0.23 ± 0.03 | −0.21 ± 0.01 | <0.05 | 7 | |
| H+ flux | −5.0 ± 1.1 | −6.0 ± 1.1 | −5.3 ± 0.9 | <0.05 | |||
| DZA | ΔpHi | −0.17 ± 0.01 | −0.18 ± 0.03 | −0.18 ± 0.02 | >0.05 | 4 | |
| H+ flux | −5.2 ± 0.3 | −5.1 ± 0.7 | −5.6 ± 0.4 | >0.05 | |||
| 13% CO2 | ΔpHi | −0.21 ± 0.05 | −0.20 ± 0.03 | −0.24 ± 0.04 | >0.05 | 9 | |
| H+ flux | −6.0 ± 1.3 | −6.1 ± 2.3 | −6.5 ± 1.4 | >0.05 | |||
| 1% CO2 | ΔpHi | −0.24 ± 0.08 | −0.20 ± 0.06 | −0.20 ± 0.06 | >0.05 | 5 | |
| H+ flux | −7.2 ± 1.8 | −10.7 ± 1.9 | −6.0 ± 1.3 | <0.05 | |||
Blank cells indicate that control Ringer was perfused into the corresponding bath.
H+ flux has units of mM × min−1, and all values are reported as mean ± SD.
The basal bath Δ[HCO3]-induced pHi response in control Ringer was compared to the pHi response in the presence of the inhibitor/condition; P < 0.05 is considered significant by Student’s t test.
TABLE II.
Summary of basal bath Δ[HCO3]-induced TEP responses
| Inhibitor/conditiona | 2.62 mM basal bath [HCO3]-induced TEP response (mV)b | |||||
| Apical | Basal | Control | w/ inhibitor | Recovery | Pc | n |
| DIDS | 1.41 ± 0.69 | 0.42 ± 0.29 | 0.56 ± 0.25 | <0.05 | 5 | |
| Na-free | Na-free | 1.01 ± 0.21 | 0.04 ± 0.07 | 0.79 ± 0.38 | <0.05 | 3 |
| amiloride | 1.28 ± 0.58 | 1.24 ± 0.50 | 1.23 ± 0.40 | >0.05 | 5 | |
| bumetanide | 0.89 ± 0.28 | 0.80 ± 0.18 | 0.97 ± 0.29 | >0.05 | 6 | |
| ouabain | 1.26 ± 0.59 | 1.17 ± 0.49 | 1.19 ± 0.51 | >0.05 | 5 | |
| DIDS | 0.86 ± 0.16 | 0.49 ± 0.07 | 0.63 ± 0.15 | <0.05 | 6 | |
| DZA | 1.44 ± 0.80 | 0.98 ± 0.50 | 1.06 ± 0.55 | <0.05 | 9 | |
| 13% CO2 | 1.11 ± 0.67 | 1.35 ± 0.78 | 1.07 ± 0.67 | <0.05 | 9 | |
| 1% CO2 | 1.26 ± 0.74 | 0.37 ± 0.32 | 0.99 ± 0.59 | <0.05 | 5 | |
Blank cells indicate that control Ringer was perfused into the corresponding bath.
All values are reported as mean ± SD.
The basal bath Δ[HCO3]-induced TEP response in control Ringer was compared to the TEP response in the presence of the inhibitor/condition; P < 0.05 is considered significant by Student’s t test.
The Na dependence of the basolateral membrane HCO3 transporter was studied by reducing basal bath [HCO3] and measuring the resultant pHi and TEP responses in the presence and absence of Na in both solution baths (Fig. 9). In three experiments, Na removal reduced the basal bath Δ[HCO3]-induced pHi response by more than twofold (ΔpHi = 0.08 ± 0.02) compared with control (ΔpHi = 0.21 ± 0.04; P < 0.05). In addition, the basal bath Δ[HCO3]-induced TEP response (ΔTEP = 1.01 ± 0.21 mV) was essentially abolished in the absence of Na (ΔTEP = 0.04 ± 0.07 mV; P < 0.05), and this effect was reversible. This indicates that although reducing basal bath [HCO3] causes HCO3 efflux via both Cl/HCO3 exchanger and Na/nHCO3 cotransporter, the TEP response corresponds specifically to Na/nHCO3 cotransporter activity due to its electrogenicity and Na dependence. This allows one to distinguish the activity of the Na/nHCO3 cotransporter from that of the Cl/HCO3 exchanger.
Basolateral Na/nHCO3 cotransport: dependence on apical Na-linked transporters
We expected Na-linked transporters at the apical membrane (Fig. 1) to provide substrate that would help drive the outward transport of Na/nHCO3 at the basolateral membrane. To test this notion, we first inhibited the apical membrane Na/H exchanger with 1 mM amiloride and observed its effect on the pHi and TEP responses caused by a 10-fold reduction in basal bath [HCO3]. In five experiments, apical amiloride did not affect basal bath Δ[HCO3]-induced TEP response (ΔTEP = 1.28 ± 0.58 vs. 1.24 ± 0.50 mV; P > 0.05), indicating that the apical membrane Na/H exchanger does not provide substrate for basolateral Na/nHCO3 cotransport activity. On the other hand, the basal bath Δ[HCO3]-induced acidification and H+ flux was larger in the presence of apical amiloride (ΔpHi = 0.28 ± 0.05; H+ flux = 8.3 ± 1.6 mM × min−1) compared with control (ΔpHi = 0.22 ± 0.03; H+ flux = 7.1 ± 1.3 mM × min−1; n = 5; P < 0.05). This observation indicates that the Na/H exchanger normally acts to buffer cell acidification produced by HCO3 efflux from the basolateral membrane.
Next, we inhibited the Na/K/2Cl cotransporter with 200 µM of apical bumetanide, which did not affect the basal bath Δ[HCO3]-induced pHi response (ΔpHi = 0.20 ± 0.03 vs. 0.21 ± 0.03 ; n = 4; P > 0.05) and TEP response (ΔTEP = 0.89 ± 0.28 vs. 0.80 ± 0.18 mV; n = 6; P > 0.05). This lack of effect suggests that Na entry via the Na/K/2Cl cotransporter does not contribute significantly to basolateral Na/nHCO3 cotransport activity. We also evaluated the effect of Na extrusion by the apical membrane Na/K ATPase on the activity of the basolateral membrane Na/nHCO3 cotransporter. Adding 200 µM ouabain into the apical bath caused an acute TEP decrease (ΔTEP = 0.55 ± 0.47 mV; n = 5), as expected from inhibition of the Na/K ATPase. However, apical ouabain did not affect the basal bath Δ[HCO3]-induced pHi response (ΔpHi = 0.18 ± 0.02 vs. 0.20 ± 0.02; n = 3; P > 0.05) and TEP response (ΔTEP = 1.26 ± 0.59 vs. 1.17 ± 0.49 mV; n = 5; P > 0.05), indicating that Na extrusion by the Na/K ATPase does not reduce or limit basolateral Na/nHCO3 cotransport activity.
The basolateral membrane Na/nHCO3 cotransporter may be dependent on Na and HCO3 entry from the apical membrane via the electrogenic Na/2HCO3 cotransporter, as shown in Fig. 1. We tested the coupling between the apical and basolateral membrane Na/HCO3 cotransporters by decreasing basal bath [HCO3] in the presence of 0.5 mM of apical DIDS (Fig. 10). In seven experiments, the basal bath Δ[HCO3]-induced TEP response decreased from 0.86 ± 0.17 to 0.49 ± 0.06 mV (P < 0.05) in the presence of apical DIDS, suggesting that inhibiting apical HCO3 entry via the Na/2HCO3 cotransporter reduces the HCO3 supply that drives basolateral Na/nHCO3 cotransport. However, apical DIDS increased the basal bath Δ[HCO3]-induced acidification from 0.19 ± 0.03 to 0.23 ± 0.03 (P < 0.05; n = 7), and H+ flux from 5.0 ± 1.1 to 6.0 ± 1.1 mM × min−1 (P < 0.05; n = 7). This observation suggests that normally, apical HCO3 entry via the Na/2HCO3 cotransporter is a buffer that counteracts the acidification caused by HCO3 efflux from the basolateral membrane.
Apical CO2-induced changes in basolateral membrane Na/nHCO3 cotransporter activity
Optimal Na/nHCO3 cotransporter activity requires a steady supply of HCO3, and the inhibition of CA II with DZA should reduce Na/nHCO3 cotransport across the basolateral membrane. This notion was tested by reducing basal bath [HCO3] 10-fold in the presence of 250 µM DZA in the basal bath (Fig. 11). In a total of nine experiments, DZA reduced the basal bath Δ[HCO3]-induced TEP response by ≈30% (from ΔTEP = 1.44 ± 0.80 to 0.98 ± 0.50 mV; P < 0.01), suggesting that CA II inhibition reduces basolateral Na/nHCO3 cotransport activity. In contrast, DZA did not affect the basal bath Δ[HCO3]-induced acidification (ΔpHi = 0.18 ± 0.03) compared with control (ΔpHi = 0.17 ± 0.01; n = 4; P > 0.05). This lack of effect probably occurred because the DZA-induced reduction in basolateral membrane HCO3 efflux is counteracted by a concomitant reduction in intracellular CO2/HCO3 buffering capacity.
A 13% CO2 load applied to the apical membrane should increase basolateral membrane Na/nHCO3 cotransport activity by shifting intracellular CO2/HCO3 equilibrium toward the formation of HCO3 (facilitated by CA II activity). To test this hypothesis, we made a 10-fold reduction in basal bath [HCO3] and compared the resultant pHi and TEP responses in 5 versus 13% apical bath CO2 (Fig. 12 A). With 13% apical bath CO2, the basal bath Δ[HCO3]-induced TEP response (ΔTEP = 1.35 ± 0.78 mV) was ≈20% higher than control (ΔTEP = 1.11 ± 0.67 mV; n = 9; P < 0.05). However, there was no change in basal bath Δ[HCO3]-induced pHi response in the presence of 13% apical bath CO2 (H+ flux = 6.0 ± 1.3 mM × min−1) compared with control (H+ flux = 6.1 ± 2.3 mM × min−1; n = 9; P > 0.05). Presumably, 13% apical CO2 did not significantly alter H+ flux caused by basal bath Δ[HCO3] because the CO2-induced increase in HCO3 efflux via the Na/nHCO3 cotransporter was offset by concomitant inhibition of the pHi-sensitive Cl/HCO3 exchanger, thus producing no observable change in net H+ flux.
In similar experiments, we reduced basal bath [HCO3] in 1% apical bath CO2 (Fig. 12 B). This maneuver should reduce free HCO3 in the cell and subsequently decrease basolateral membrane Na/nHCO3 cotransport activity. With 1% apical bath CO2, the basal bath Δ[HCO3]-induced TEP response (ΔTEP = 0.37 ± 0.32 mV) was more than fivefold smaller than control (ΔTEP = 1.26 ± 0.74 mV; n = 5, P < 0.01). This result indicates that intracellular CO2 is a significant source of HCO3 supply for the basolateral membrane Na/nHCO3 cotransporter. 1% apical CO2 increased the basal bath Δ[HCO3]-induced equivalent H+ flux from 7.2 ± 1.8 to 10.7 ± 1.9 mM × min−1 (n = 5; P = 0.04). The H+ flux in the presence of 1% apical bath CO2 was larger probably because the resultant alkalinization activated the Cl/HCO3 exchanger more than the reduction in Na/nHCO3 cotransport activity.
We showed that 13% apical CO2 increased the basal bath Δ[HCO3]-induced TEP response (Fig. 12 A), suggesting that 13% apical CO2 activates the basolateral membrane Na/nHCO3 cotransporter, which should decrease [Na]i. However, 13% apical CO2 increased [Na]i from 15.7 ± 3.3 to 24.0 ± 5.3 mM (n = 6; P < 0.05). This suggests that one or more Na entry pathways are affected by 13% apical CO2. To test whether 13% apical CO2-induced acidification activated the Na/H exchanger, we compared the effect of 1 mM amiloride on the steady-state pHi of the RPE in control Ringer (5% CO2) to that in 13% CO2-equilibrated Ringer. In three experiments, adding 1 mM amiloride into the apical bath did not cause any change in steady-state pHi in 5 or 13% apical bath CO2. As an additional test, we compared the magnitude of the 13% apical CO2-induced acidification in the presence or absence of 1 mM amiloride in the apical bath. In four experiments, amiloride did not affect the 13% apical CO2-induced acidification (ΔpHi = 0.23 ± 0.01) compared with control (ΔpHi = 0.22 ± 0.02; P > 0.05). These experiments indicate that 13% apical CO2-induced acidification did not activate the Na/H exchanger.
CO2- and HCO3-mediated fluid absorption across RPE
We tested the role of the apical membrane Na/2HCO3 cotransporter in fluid transport by adding 0.5 mM DIDS into the apical bath and measuring the resultant change in JV. In four experiments, 0.5 mM of apical DIDS decreased JV by more than twofold (from 16.7 ± 4.8 to 7.7 ± 3.7 µl × cm−2 × hr−1; P < 0.05), suggesting that HCO3 transport mediates a major component of fluid absorption across the RPE apical membrane. At the basolateral membrane, HCO3 transporters and several Cl− channels are DIDS sensitive. Not surprisingly, the addition of 0.5 mM DIDS to the basal bath decreased JV from 20.3 ± 8.2 to 11.2 ± 6.0 µl × cm−2 × hr−1 (n = 9; P < 0.05).
The model in Fig. 1 predicts that 13% apical CO2 would increase net Na, Cl, and HCO3 absorption, producing an increase in JV across the RPE. Fig. 13 A shows that 13% CO2 increased JV from ≈5 to 9 µl × cm−2 × hr−1, and Fig. 13 B shows that 1% CO2 decreased JV from ≈7 to 2.5 µl × cm−2 × hr−1. In four experiments, increasing CO2 from 5 to 13% in both solution baths increased JV by more than twofold (from 2.8 ± 1.6 to 6.7 ± 2.3 µl × cm−2 × hr−1; n = 5; P < 0.05). In another set of experiments, decreasing CO2 from 5 to 1% in both solution baths decreased steady-state fluid absorption by ≈60% (from 8.8 ± 3.9 to 3.4 ± 1.1 µl × cm−2 × hr−1; n = 4; P < 0.05).
Figure 13.

CO2-induced changes in fluid absorption. 5% CO2 equilibrated Ringer was added to both solution baths, and JV was recorded with JV, TEP, and RT at steady state. The control Ringer was then replaced with either (A) 13% CO2 or (B) 1% CO2-equilibrated Ringer in both solution baths. JV, TEP, and RT values were recorded at steady state (15–30 min). Solid bars above the graphs represent solution changes from control Ringer as described in the legend to Fig. 2.
DISCUSSION
The retinal photoreceptors are among the most metabolically active cells in the body (Winkler et al., 2008). All of the oxygen used by the photoreceptors is supplied by the choroidal blood supply, as indicated by the steep decrease of PO2 from ≈70 mm Hg in the choriocapillaris to ≈0 mm Hg at the photoreceptor cilium, which forms the junction between inner and outer segments (Birol et al., 2007) and is the site of the most dense mitochondrial packing in the retina (Stone et al., 2008). Oxygen consumption at this location increases ≈1.5–3 times after dark adaptation, mainly from increased ATP consumption needed to maintain the photoreceptor dark current (Wangsa-Wirawan and Linsenmeier, 2003). The increase in retinal oxygen consumption leads to a proportionate increase in CO2 production and its release into the SRS.
This CO2 load would be mainly dissipated by the choroidal blood supply because it features a very high flow rate (Alm and Bill, 1987) and a relatively short diffusion path from the inner segments (Oyster, 1999). We perfuse 13% CO2-equilibrated Ringer to the hfRPE apical membrane to mimic our estimate of the in vivo increase in CO2 that occurs in the SRS after the transition from light to dark (from 5 to 10 ± 3%; see Appendix 1). The present results show that in hfRPE, CO2 is more effectively transported across the apical membrane compared with the basolateral membrane probably because of a difference in exposed surface area (Miller and Steinberg, 1977; Maminishkis et al., 2006). Increasing apical bath CO2 promotes CA II–dependent HCO3 formation in the cytosol that can be transported across the basolateral membrane by a Na/nHCO3 cotransporter. As previously shown in frog RPE, apical CO2-induced acidification inhibits the basolateral membrane Cl/HCO3 exchanger (Fig. 7 A), which can increase Cl recycling at the basolateral membrane, perhaps via CFTR or Ca2+-activated Cl channels. The combination of this effect and the CO2-induced increase in basolateral Na/nHCO3 cotransport are hypothesized to increase net Na, Cl, and HCO3 absorption, leading to the observed increase in steady-state fluid absorption across the RPE (Fig. 13).
Apical membrane CO2 and HCO3 transport
Earlier studies in frog and bovine RPE provide strong electrophysiological evidence for the electrogenic Na/2HCO3 cotransporter at the apical membrane (Hughes et al., 1989; Kenyon et al., 1997). In addition, pNBC1 has been immunolocalized to the apical membrane of rat RPE (Bok et al., 2001). In hfRPE, we demonstrate apical Na/2HCO3 cotransport activity with the following experimental observations: (1) Apical DIDS acidified the cell and decreased TEP, consistent with the inhibition of electrogenic Na/2HCO3 cotransport into the cell. In addition, these DIDS-induced responses were reversed in the presence of low HCO3 Ringer (10-fold) in the apical bath—apical DIDS alkalinized the cell and increased TEP. (2) Decreasing apical bath [HCO3] decreased TEP, consistent with Na/2HCO3 efflux across the apical membrane, and this response was essentially abolished by apical DIDS.
The presence of CA II and several apical membrane-bound CAs (e.g., CAs IV, IX, XII, and XIV) (Nagelhus et al., 2005) support the notion of HCO3-mediated CO2 transport from the SRS into the RPE via the electrogenic Na/2HCO3 cotransporter. However, the following experiments suggest that increasing apical bath CO2 does not stimulate apical Na/2HCO3 cotransport: (1) apical DIDS caused pHi and TEP responses in 5, 1, or 13% apical bath CO2 that were statistically indistinguishable, and (2) the magnitude of 13% apical CO2-induced acidification was unaffected by apical DIDS. This is probably because the fast CO2/HCO3 equilibration across the apical membrane prevented a change in the HCO3 gradient. Besides NBC1 (SLC4A4; Gene ID 8671), a DIDS-insensitive and electroneutral Na/HCO3 cotransporter, NBC3/NBCn1 (SLC4A7; Gene ID 9497) is also highly expressed at the apical membrane of human RPE (Wang, F.E., and S.S. Miller. 2007. Profiling MicroRNA (miRNA) Expression in Human Retina, Retinal Pigment Epithelium (RPE), and Choroid; Zhi, C.G., F.E. Wang, T. Banzon, S. Jalickee, R. Fariss, A. Maminishkis, and S.S. Miller. 2007. Membrane-Bound Carbonic Anhydrases in Human Fetal Retinal Pigment Epithelial Cells (hfRPE)). Our observation that apical DIDS had little effect on the apical bath Δ[HCO3]-induced acidification suggests that NBC3 is highly active in the RPE. However, this does not indicate that NBC1 has a lower activity than NBC3 because NBC1 is electrogenic and is therefore limited by both the membrane voltage and HCO3 gradient. In contrast, NBC3 is limited only by the HCO3 gradient. Thus, the relative activities of NBC1 and NBC3 cannot be accurately evaluated by comparing the apical bath Δ[HCO3]-induced pHi responses in the presence versus absence of apical DIDS.
Apical membrane processes increase the effective apical surface area of native frog RPE by ≈30-fold relative to the basolateral surface area (Miller and Steinberg, 1977). Electron micrography of hfRPE provides evidence for similar structures in hfRPE (Maminishkis et al., 2006) and supports the notion of a relatively larger apical surface area. This difference suggests a possible basis for the approximately eightfold difference in the ΔpHi produced by altering CO2 (from 5 to 13%) in the apical versus basal bath, which allowed us to calculate a 10-fold difference between the relative CO2 permeability of the apical and basolateral membranes of hfRPE cultures (see Appendix 1). However, in hfRPE cultures, CO2 entry from the basal bath may be hindered by the mesh support and transwell filter (attached to the basal membrane). The mesh was eliminated as a possible diffusion barrier by showing that the 13% basal bath CO2 produced the same ΔpHi with or without the mesh (unpublished data). To test the filter and its unstirred layer as a diffusion barrier, the hfRPE monolayer was uniformly damaged by mounting its apical membrane down on the mesh. This allows CO2 from the basal bath to diffuse through the damaged areas and across the apical membrane of the RPE. If the filter was a significant barrier to CO2, the difference between 13% apical and basal CO2-induced ΔpHi in a damaged hfRPE would be similar to that in an intact hfRPE (approximately eightfold). However, with the damaged hfRPE monolayer, the difference in CO2-induced ΔpHi was ≈2.5-fold (n = 5), and the calculated apparent relative CO2 permeability was 3.0 ± 1.5, suggesting that the basolateral membrane is relatively less permeable to CO2 than the apical membrane. Besides hfRPE cultures, significant differences between the 13% apical and basal bath induced pHi responses were also observed in native bovine and fetal human RPE choroid preparations, thus corroborating our conclusion.
As another test of the basolateral membrane CO2 permeability, basal bath CO2 was increased from 5 to 13% in the absence of apical flow. In this case, the 13% basal CO2-induced ΔpHi was approximately threefold greater than with continuous apical perfusion (n = 4), suggesting that stopped apical flow increases the thickness of the unstirred layer at the apical membrane surface, which limits CO2 diffusion out of the cell and causes a larger acidification. This result indicates that the basolateral membrane has some CO2 permeability. Alternatively, the paracellular pathway may allow small amounts of CO2 to enter the apical membrane from the basal bath. Tight junctions were disrupted by removing all Ca2+ and Mg2+ from both solution baths, but this maneuver did not increase the 13% basal CO2-induced acidification; therefore, we conclude that the basolateral membrane is the main pathway for CO2 entry from the basal bath.
A possible CO2 transport mechanism arises from the ability of aquaporin 1 (AQP1) to function as a CO2 channel (Cooper and Boron, 1998; Endeward et al., 2006). In cultured hfRPE cells, AQP1 mRNA is highly expressed in human RPE (Wang, F.E., and S.S. Miller. 2007. Profiling MicroRNA (miRNA) Expression in Human Retina, Retinal Pigment Epithelium (RPE), and Choroid). In addition, AQP1 was also detected exclusively at the apical membrane of hfRPE (unpublished data), corroborating an earlier study on rat RPE (Stamer et al., 2003). However, 1 mM pCMBS (nonspecific AQP1 inhibitor) did not block or inhibit CO2 transport across the hfRPE apical membrane (n = 3), inconsistent with the AQP1 hypothesis. CO2 barriers have been discovered at the apical membranes of gastric cells and colon epithelia (Waisbren et al., 1994; Endeward and Gros, 2005), and the RPE may possess a basolateral membrane with a unique lipid composition that limits CO2 flux. The influence of lipid composition and properties on gas permeability has been studied in lipid bilayers (Hill et al., 1999; Hill and Zeidel, 2000), a possibility that remains to be evaluated in RPE.
Basolateral membrane HCO3 transporters
The DIDS-sensitive Cl/HCO3 exchanger at the basolateral membrane of hfRPE was inhibited or activated under acidic (13% apical CO2) or basic (1% apical CO2) conditions, respectively, as in frog RPE (Lin and Miller, 1994). From our Affymetrix data, AE2 (SLC4A2; Gene ID 6522) is the only AE isoform detected in cultured fetal human RPE and in native adult and fetal human RPE. Because AE2 is known to be pH sensitive (Kurschat et al., 2006; Stewart et al., 2007), it is possibly the isoform located at the basolateral membrane of hfRPE. Because this exchanger was inhibited by 13% apical CO2, the RPE requires an alternate HCO3 efflux pathway at the basolateral membrane to mediate transepithelial HCO3 absorption. The following observations indicate the presence of an electrogenic Na/nHCO3 cotransporter at the basolateral membrane: (1) reducing [HCO3] at the basal bath increased TEP, consistent with a depolarization of the basolateral membrane; (2) this TEP increase was significantly inhibited (≈70%) in the presence of basal DIDS; and (3) this TEP increase was completely abolished in the absence of Na in both bathing solutions.
Our Affymetrix data on human RPE (native adult and fetal RPE, and cultured fetal RPE) (Wang, F.E., and S.S. Miller. 2007. Profiling MicroRNA (miRNA) Expression in Human Retina, Retinal Pigment Epithelium (RPE), and Choroid) show high mRNA expression levels for NBC1 (SLC4A4; Gene ID 8671) and NBC4/NBCe2 (SLC4A5; Gene ID 57835), both of which are candidates for the identity of the basolateral membrane Na/nHCO3 cotransporter in human RPE. Although this cotransporter’s identity is unknown, both NBC1 and NBC4 have been shown to transport Na:HCO3 with a stoichiometry of 1:2 (Gross et al., 2001; Virkki et al., 2002), suggesting inward Na/HCO3 cotransport from the basolateral membrane. However, NBC4 transports Na:HCO3 with a 1:3 stoichiometry at the apical membrane of the choroid plexus epithelium (CPE) (Millar and Brown, 2008). Because both the RPE and the CPE derive from the neural ectoderm and share many similarities in HCO3 transport mechanisms (Brown et al., 2004; Praetorius, 2007), it is possible that the RPE expresses NBC4 at the basolateral membrane and transports Na/nHCO3 with a 1:3 Na:HCO3 stoichiometry. In addition, our calculation of the reversal potential of the Na/nHCO3 cotransporter indicates that a 1:3 stoichiometry is required for Na/nHCO3 transport out of the cell; this calculation is based on our estimation of resting [Na]i and pHi in control Ringer (see Appendix 2).
The basolateral membrane Na/nHCO3 cotransporter is more dependent on HCO3 than Na as a substrate, as supported by the following experiments: (1) Reducing basal bath [HCO3] 10-fold caused a TEP response that was reduced in the presence of apical DIDS, suggesting that inhibiting NBC1 reduced basolateral Na/nHCO3 cotransport activity. (2) The basal bath Δ[HCO3]-induced TEP response was reduced in the presence of basal DZA, suggesting that CA inhibition reduces basolateral Na/nHCO3 cotransport. DZA reduces HCO3 transport in two ways. First, DZA slows CA-mediated hydration of CO2 to HCO3. Second, DZA inhibits the apical membrane Na/2HCO3 cotransporter, as indicated by the reduction of apical bath Δ[HCO3]-induced TEP response in the presence of apical DZA. (3) The basal bath Δ[HCO3]-induced TEP response was increased in 13% apical bath CO2 and decreased in 1% apical bath CO2. This suggests that apical CO2 entry and its subsequent conversion into HCO3 is an important source of HCO3 substrate for basolateral Na/nHCO3 cotransport activity.
In addition to showing that the basolateral membrane Na/nHCO3 cotransporter is dependent on apical HCO3 supply, we also eliminated Na as a limiting substrate for basolateral Na/nHCO3 cotransport by examining three Na transport proteins at the apical membrane of the RPE (Hughes et al., 1998): (1) bumetanide-sensitive Na/K/2Cl cotransporter, (2) amiloride-sensitive Na/H exchanger, and (3) ouabain-sensitive Na/K ATPase. In hfRPE, the presence of bumetanide, amiloride, or ouabain in the apical bath had no effect on the basal bath Δ[HCO3]-induced TEP responses, suggesting that these Na transport mechanisms are not linked to basolateral Na/nHCO3 cotransport activity. Collectively, our data indicate that the basolateral membrane Na/nHCO3 cotransporter is mainly driven by HCO3 supplied by NBC1-mediated Na/2HCO3 entry and CA II–mediated hydrolysis of CO2 to HCO3.
Apical Na entry pathways and CO2/HCO3-driven fluid transport
13% apical CO2 increased basolateral Na/nHCO3 cotransport, which should decrease [Na]i. However, Na imaging experiments showed that 13% apical CO2 increased [Na]i, suggesting that Na enters the RPE via apical membrane Na transport processes. Although the Na/H exchanger can be activated by intracellular acidification (Aronson et al., 1982; Dunham et al., 2004), the following experiments show that 13% apical CO2 does not activate the Na/H exchanger: (1) the magnitude of the 13% apical CO2-induced acidification was unaffected in the presence of apical amiloride, and (2) adding 1 mM amiloride into the apical bath did not affect the steady-state pHi in 5 or 13% apical bath CO2. These observations indicate that the Na/H exchanger could not have contributed to the CO2-induced [Na]i increase. This lack of participation might have occurred for three reasons: (1) the 13% CO2-induced acidification was too small; (2) there was no change in the proton gradient across the Na/H exchanger; and (3) the 13% CO2-equilibrated Ringer is acidic relative to control (pH 7.09 vs. 7.5), and the low extracellular pH may have inhibited the Na/H exchanger (Aronson et al., 1983). We ruled out the first possibility with a 10-mM NH4 prepulse that caused only ≈0.1 decrease in pHi (n = 4) but still showed the characteristic Na/H exchanger–mediated pHi recovery; in comparison, 13% apical CO2 acidified the cell by >0.2 pH units. In addition, we showed that reducing basal bath [HCO3] acidified the cell by only ≈0.2 but was able to activate the Na/H exchanger. Na/2HCO3 entry via NBC1 was eliminated as a possible cause of the 13% apical CO2-induced [Na]i increase because: (1) the apical DIDS-induced pHi and TEP responses were the same in 5 or 13% apical bath CO2, and (2) the magnitude of the 13% apical CO2-induced pHi response was unaltered in the presence of apical DIDS.
In alveolar epithelium, Na/K ATPase activity is reduced by CO2-induced acidification (Briva et al., 2007), suggesting the possibility of a similar effect in RPE. In frog RPE, 13% CO2-induced acidification activated the Na/K/2Cl cotransporter after inhibition of the basolateral membrane Cl/HCO3 exchanger and the subsequent reduction in intracellular [Cl] (Edelman et al., 1994). Both the 13% apical CO2-induced inhibition of the Na/K ATPase and activation of the Na/K/2Cl cotransporter can increase [Na]i, thus providing Na entry pathway across the apical membrane that can mediate solute-driven fluid absorption. But these mechanisms remain to be evaluated.
In bovine RPE, net active Cl absorption is mediated by the Na/K/2Cl cotransporter at the apical membrane (Edelman et al., 1994) and by Ca2+-activated and cAMP/PKA-dependent CFTR Cl channels at the basolateral membrane (Joseph and Miller, 1991; Bialek et al., 1995; Hughes et al., 1998). Evidence for the expression and basolateral membrane localization of CFTR in hfRPE has been presented (Blaug et al., 2003). The 13% apical CO2-induced activation of the Na/K/2Cl cotransporter and inhibition of the Cl/HCO3 exchanger would both increase net Cl absorption across the RPE.
HCO3 transport also plays a significant role in RPE fluid transport. Steady-state fluid absorption was decreased by ≈50% after the addition of apical DIDS, indicating that the DIDS-sensitive NBC1 mediates HCO3-driven fluid transport. The presence of NBC3 at the apical membrane suggests that it also contributes to HCO3-mediated fluid transport. In addition, DZA or acetazolamide decreases steady-state fluid absorption across hfRPE in vitro (Zhi, C.G., F.E. Wang, T. Banzon, S. Jalickee, R. Fariss, A. Maminishkis, and S.S. Miller. 2007. Membrane-Bound Carbonic Anhydrases in Human Fetal Retinal Pigment Epithelial Cells (hfRPE)). These observations are corroborated in the present experiments by the DZA-induced inhibition of NBC1 at the apical membrane and the Na/nHCO3 cotransporter at the basolateral membrane. Interestingly, animal models and clinical studies showed that systemically administered acetazolamide increases fluid absorption across the RPE (Wolfensberger, 1999). It has been proposed that acetazolamide increases RPE fluid absorption in vivo by affecting membrane-bound CAs at the basolateral membrane, but there are no known membrane-bound CAs at the basolateral membrane of native RPE (Zhi, C.G., F.E. Wang, T. Banzon, S. Jalickee, R. Fariss, A. Maminishkis, and S.S. Miller. 2007. Membrane-Bound Carbonic Anhydrases in Human Fetal Retinal Pigment Epithelial Cells (hfRPE)). In addition, acetazolamide readily permeates RPE basolateral membrane, which would reduce fluid absorption by inhibiting cytosolic CA II, as observed in vitro. Further experiments involving interactions between the distal retina, choroid, and RPE are required to reconcile the difference in the effect of CA inhibitors on RPE fluid transport in vivo and in vitro.
HCO3-mediated solute and fluid transport in the CPE
Both the RPE and the CPE develop from neural ectoderm; therefore, it is not surprising to find many similarities in the solute transport mechanisms of these two epithelia (Hughes et al., 1998; Brown et al., 2004; Praetorius, 2007). As demonstrated in this study, HCO3 transport mediates net solute and fluid absorption in human RPE. This is supported by experiments where acetazolamide or DZA reduced steady-state fluid absorption by ≈50% in hfRPE cultures (Zhi, C.G., F.E. Wang, T. Banzon, S. Jalickee, R. Fariss, A. Maminishkis, and S.S. Miller. 2007. Membrane-Bound Carbonic Anhydrases in Human Fetal Retinal Pigment Epithelial Cells (hfRPE)). Similarly in the CPE, HCO3 transport is an important mediator of cerebrospinal fluid (CSF) production (Saito and Wright, 1983, 1984); CSF secretion is inhibited by basal DIDS (Deng and Johanson, 1989). In addition, acetazolamide reduces CSF secretion by ≈40% (Vogh et al., 1987). Acetazolamide is used to prevent cerebral edema at high altitudes (Wright et al., 2008) and to reduce CSF pressure in children with hydrocephalus (Cowan and Whitelaw, 1991). The inhibitory effect of acetazolamide on CSF secretion led to the notion that CO2 entry into the CPE from the blood plasma and the subsequent hydration of CO2 into HCO3 stimulates NaHCO3 secretion across the apical membrane. This conclusion is supported by experiments in cat CPE, where ≈40% of Na secretion is attributed to CA II–mediated HCO3 formation from CO2 (Vogh and Maren, 1975). Perhaps not surprising, this mechanism of CO2-driven HCO3 transport is also found in the RPE.
Despite many similarities, the RPE normally absorbs Na (Cl + HCO3) and fluid, whereas the CPE secretes Na (Cl + HCO3) and fluid that helps form CSF. As in the RPE, the CPE expresses Na/HCO3 cotransporters at both the apical and basolateral membranes. However, the most striking difference is that both NBC1/NBCe1 and NBC3/NBCn1 in the RPE are expressed at the apical membrane (Zhi, C.G., F.E. Wang, T. Banzon, S. Jalickee, R. Fariss, A. Maminishkis, and S.S. Miller. 2007. Membrane-Bound Carbonic Anhydrases in Human Fetal Retinal Pigment Epithelial Cells (hfRPE)), whereas in the CPE, these two transporters are expressed at the basolateral membrane (Brown et al., 2004; Praetorius, 2007). This difference suggests that NBC4, which is found at the apical membrane of the CPE (Millar and Brown, 2008), may be the unidentified Na/nHCO3 cotransporter at the basolateral membrane of the RPE. We hypothesize that the difference in the membrane location of these HCO3 transporters (i.e., NBC1, NBC3, and NBC4) in the RPE and CPE is the basis for their difference in HCO3 and fluid transport direction.
If the CO2-permeability difference of the apical and basolateral membranes of the RPE also manifests in the CPE, what is its functional significance? In the central nervous system, metabolic CO2 produced by the brain is released into the CSF and subsequently neutralized by HCO3 secreted from the CPE. We hypothesize that the CPE has a relatively lower CO2 permeability at the apical membrane than at the basolateral membrane, and this property would promote CA II–mediated HCO3 secretion across the apical membrane. This possibility remains to be evaluated.
Physiological implications
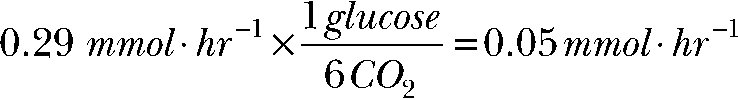
Upon dark adaptation, oxygen consumption in the retina increases (Kimble et al., 1980; Medrano and Fox, 1995; Cringle et al., 2002; Yu and Cringle, 2002), thus generating and depositing more CO2 and H2O into the SRS. Both CO2 and H2O generation can be estimated from the rate of oxygen consumption measured in situ in cat and nonhuman primate eyes (Wangsa-Wirawan and Linsenmeier, 2003). Our calculations (see Appendix 1) provide an estimate of CO2 production in adult human photoreceptors of ≈0.29 and 0.54 mmol × hr−1 in light and dark, respectively. Considering that SRS [CO2] is ≈2 mM, impaired CO2 transport across the RPE could cause significant SRS or RPE acidification resulting in photoreceptor or RPE cell death. In addition, oxidative phosphorylation in the adult retina produces water at a rate of ≈0.5 µl × cm−2 × hr−1 in light and 0.9 µl × cm−2 × hr−1 in dark adapted eyes. Because glycolysis in the retina accounts for ≈95% of its total glucose consumption (Winkler et al., 2008), the combined retinal water production by aerobic respiration and glycolysis is calculated to be 3.6 and 6.5 µl × cm−2 × hr−1 in the light and dark, respectively. The CO2-induced changes in ion transport in the RPE is one of many events that follows the transition from light to dark in vivo. Others include: (1) an increase in SRS [K+] from ≈3 to 5 mM, (2) the decrease in SRS [Ca2+], and (3) the decrease in SRS pH (Steinberg et al., 1983; Borgula et al., 1989; Livsey et al., 1990; Yamamoto et al., 1992; Gallemore et al., 1994). Dark adaptation decreases SRS volume in situ (Li et al., 1994a,b). In addition, in a rat model of retinal reattachment (Maminishkis et al., 2002), fluid clearance from the SRS was faster in the dark-adapted eye (Maminishkis, A., personal communication), suggesting that steady-state fluid absorption across the RPE is higher in the dark.
In the dark-adapted eye, the high oxidative metabolism in the inner segments of the photoreceptors generates CO2 and H2O that are deposited into the SRS. The RPE uses the limited CO2 diffusion at the basolateral membrane to drive Na, Cl, and HCO3 transport across the RPE, which increases solute-driven fluid transport. This mechanism not only prevents CO2 accumulation in the SRS, but it also removes water from the vicinity of the photoreceptors. This helps maintain the proper anatomical relationship between the photoreceptors and the RPE apical membrane, thus avoiding retinal detachment and photoreceptor degeneration (Stone et al., 1999; Wickham et al., 2006; Nakazawa et al., 2007).
APPENDIX 1
Relative CO2 permeability
 |
Differentiating the CO2/HCO3 equilibrium constant,
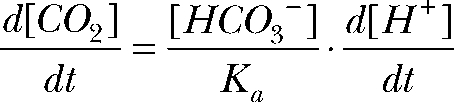 |
Combining the above equations gives
 |
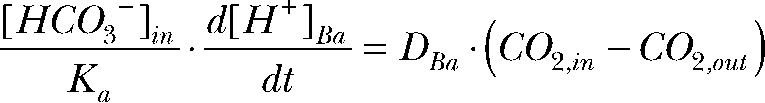 |
The relative permeability (P) of CO2 at the apical versus the basolateral membrane is
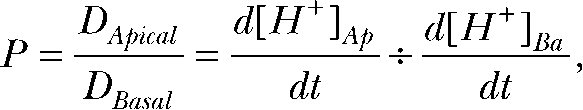 |
where D is the diffusion coefficient and  and
and  are the H+ fluxes caused by perfusing 13% CO2-equilibrated Ringer to the apical and basal bath, respectively. The H+ fluxes were obtained by multiplying the 13% CO2-induced dpHi/dt with the total buffering capacity of the hfRPE. Based on these considerations, the relative permeability of apical versus basolateral membrane of hfRPE to CO2 is 9.9 ± 4.4 (n = 7).
Retinal water production by aerobic respiration
In the dark, outer retina O2 consumption (Wangsa-Wirawan and Linsenmeier, 2003) is 4.2 ± 0.5 ml O2 × 100g−1 min−1. In the light, outer retina O2 consumption (Wangsa-Wirawan and Linsenmeier, 2003) is 2.3 ± 0.6 ml O2 × 100g−1 min−1. Wet weight of human retina (Bhosale and Bernstein, 2005) is 5.44 g. Oxygen consumption in the dark (density of oxygen at 36.9°C is 0.039 mmol/ml):
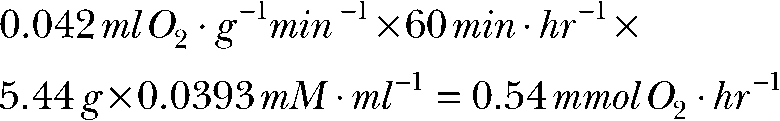 |
Oxygen consumption in the light:
 |
In aerobic respiration, one molecule of water is generated for every molecule of oxygen consumed. Therefore, water generated in the dark is:
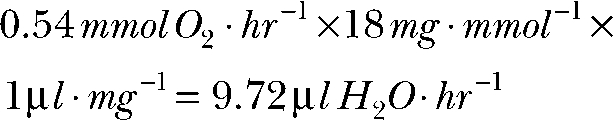 |
Water generated in the light is:
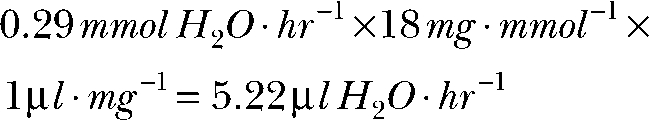 |
Assuming that the entire retina surface is 10.94 cm2 (http://webvision.med.utah.edu/), the total rate of fluid generated by the retina through aerobic respiration in the dark is:
 |
In the light:
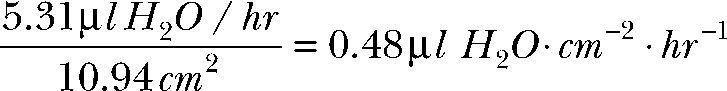 |
Total retinal water production in the light and dark
For every glucose molecule that undergoes aerobic respiration, six molecules of CO2 are produced. Therefore, glucose consumption by aerobic respiration in the dark is:
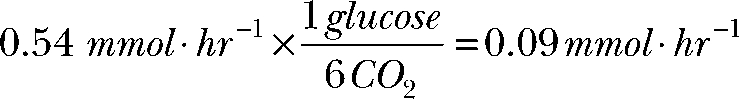 |
Glucose consumption by aerobic respiration in the light is:
 |
Assuming that glycolysis in the retina accounts for 95% of glucose consumption in the dark (Winkler et al., 2008), the rate of water generation by glycolysis in the dark is:
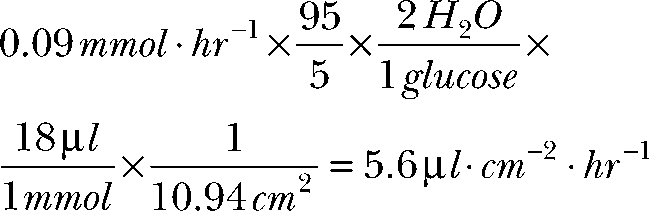 |
The rate of water generation by glycolysis in the light is:
 |
Total water produced by aerobic respiration and glycolysis in the dark is:
Total water produced by aerobic respiration and glycolysis in the light:
JV of human RPE in vivo has been estimated using B-scan ultrasonography to be ≈11 µl × cm−2 × hr−1 (Chihara and Nao-i, 1985), comparable to our in vitro measurements (Fig. 13).
CO2 production in the light and dark
CO2 production = O2 consumption. CO2 production in the dark is 4.2 ± 0.5 ml CO2 × 100 g−1 min−1, and in light is 2.3 ± 0.6 ml O2 × 100 g−1 min−1. Therefore, CO2 production increases by 1.4–2.6-fold after transitioning from light to dark. This increase in CO2 production translates to an increase in SRS CO2 concentration, from 5 to 10 ± 3%.
APPENDIX 2
Na/nHCO3 cotransporter reversal potential calculation
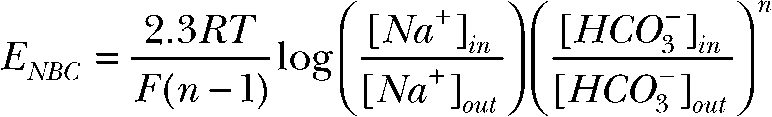 |
[Na+]in = 15.7 mM, [Na+]out = 143.7 mM, [HCO3−]in = 27.9 mM, and [HCO3−]out = 26.2 mM. n is the stoichiometry of the Na/nHCO3 cotransporter. We calculated the reversal potential of the Na/nHCO3 cotransporter NBC (ENBC) to be −55.7 mV for a Na:HCO3 transport stoichiometry of 1:2. In this case, ENBC is more hyperpolarized than the average basolateral membrane potential (VB = −49.8 ± 3.7 mV) (Maminishkis et al., 2006), and the Na/2HCO3 cotransporter transports Na and HCO3 into the cell. To transport Na/nHCO3 out of the cell against the strong inward Na gradient in control conditions, ENBC must be more depolarized than VB, and this condition is achieved for a Na:HCO3 transport stoichiometry of 1:3, where ENBC = −27.0 mV.
Acknowledgments
The authors thank Drs. Nancy Philp, Lawrence Rizzolo, Sarah Sohraby, Terry Machen, Bret Hughes, and Barry Winkler for reading early versions of the manuscript and providing critical feedback.
This work is supported by the NIH Intramural Research Program.
Edward N. Pugh Jr. served as editor.
Footnotes
Abbreviations used in this paper: AQP1, aquaporin 1; CA, carbonic anhydrase; CPE, choroid plexus epithelium; CSF, cerebrospinal fluid; DIDS, 4,4′-diisothiocyanostilbene-2,2′-disulfonic acid; DZA, dorzolamide; ENBC, reversal potential of NBC; hfRPE, human fetal retinal pigment epithelium; JV, steady-state fluid absorption rate; pHi, intracellular pH; RPE, retinal pigment epithelium; RT, total tissue resistance; SRS, subretinal space; TEP, transepithelial potential.
References
- Alm A., Bill A. 1987. Ocular circulation. Adler’s Physiology of the Eye. 8th ed Moses R.A., Hart W.M., Mosby, St. Louis, MO. 183–203 [Google Scholar]
- Aronson P.S., Nee J., Suhm M.A. 1982. Modifier role of internal H+ in activating the Na+-H+ exchanger in renal microvillus membrane vesicles.Nature. 299:161–163 [DOI] [PubMed] [Google Scholar]
- Aronson P.S., Suhm M.A., Nee J. 1983. Interaction of external H+ with the Na+-H+ exchanger in renal microvillus membrane vesicles.J. Biol. Chem. 258:6767–6771 [PubMed] [Google Scholar]
- Bevensee M.O., Schwiening C.J., Boron W.F. 1995. Use of BCECF and propidium iodide to assess membrane integrity of acutely isolated CA1 neurons from rat hippocampus.J. Neurosci. Methods. 58:61–75 [DOI] [PubMed] [Google Scholar]
- Bhosale P., Bernstein P.S. 2005. Quantitative measurement of 3′-oxolutein from human retina by normal-phase high-performance liquid chromatography coupled to atmospheric pressure chemical ionization mass spectrometry.Anal. Biochem. 345:296–301 [DOI] [PubMed] [Google Scholar]
- Bialek S., Joseph D.P., Miller S.S. 1995. The delayed basolateral membrane hyperpolarization of the bovine retinal pigment epithelium: mechanism of generation.J. Physiol. 484:53–67 [DOI] [PMC free article] [PubMed] [Google Scholar]
- Birol G., Wang S., Budzynski E., Wangsa-Wirawan N.D., Linsenmeier R.A. 2007. Oxygen distribution and consumption in the macaque retina.Am. J. Physiol. Heart Circ. Physiol. 293:H1696–H1704 [DOI] [PubMed] [Google Scholar]
- Blaug S., Quinn R., Quong J., Jalickee S., Miller S.S. 2003. Retinal pigment epithelial function: a role for CFTR? Doc. Ophthalmol. 106:43–50 [DOI] [PubMed] [Google Scholar]
- Bok D., Schibler M.J., Pushkin A., Sassani P., Abuladze N., Naser Z., Kurtz I. 2001. Immunolocalization of electrogenic sodium-bicarbonate cotransporters pNBC1 and kNBC1 in the rat eye.Am. J. Physiol. 281:F920–F935 [DOI] [PubMed] [Google Scholar]
- Borgula G.A., Karwoski C.J., Steinberg R.H. 1989. Light-evoked changes in extracellular pH in frog retina.Vision Res. 29:1069–1077 [DOI] [PubMed] [Google Scholar]
- Briva A., Vadasz I., Lecuona E., Welch L.C., Chen J., Dada L.A., Trejo H.E., Dumasius V., Azzam Z.S., Myrianthefs P.M., et al. 2007. High CO2 levels impair alveolar epithelial function independently of pH.PLoS One. 2:e1238. [DOI] [PMC free article] [PubMed] [Google Scholar]
- Brown P.D., Davies S.L., Speake T., Millar I.D. 2004. Molecular mechanisms of cerebrospinal fluid production.Neuroscience. 129:957–970 [DOI] [PMC free article] [PubMed] [Google Scholar]
- Casey J.R. 2006. Why bicarbonate? Biochem. Cell Biol. 84:930–939 [DOI] [PubMed] [Google Scholar]
- Chihara E., Nao-i N. 1985. Resorption of subretinal fluid by transepithelial flow of the retinal pigment epithelium.Albrecht Von Graefes Arch. Klin. Exp. Ophthalmol. 223:202–204 [DOI] [PubMed] [Google Scholar]
- Cooper G.J., Boron W.F. 1998. Effect of PCMBS on CO2 permeability of Xenopus oocytes expressing aquaporin 1 or its C189S mutant.Am. J. Physiol. 275:C1481–C1486 [DOI] [PubMed] [Google Scholar]
- Cowan F., Whitelaw A. 1991. Acute effects of acetazolamide on cerebral blood flow velocity and pCO2 in the newborn infant.Acta Paediatr. Scand. 80:22–27 [DOI] [PubMed] [Google Scholar]
- Cox S.N., Hay E., Bird A.C. 1988. Treatment of chronic macular edema with acetazolamide.Arch. Ophthalmol. 106:1190–1195 [DOI] [PubMed] [Google Scholar]
- Cringle S.J., Yu D.Y., Yu P.K., Su E.N. 2002. Intraretinal oxygen consumption in the rat in vivo.Invest. Ophthalmol. Vis. Sci. 43:1922–1927 [PubMed] [Google Scholar]
- Deng Q.S., Johanson C.E. 1989. Stilbenes inhibit exchange of chloride between blood, choroid plexus and cerebrospinal fluid.Brain Res. 501:183–187 [DOI] [PubMed] [Google Scholar]
- Dunham P.B., Kelley S.J., Logue P.J. 2004. Extracellular Na+ inhibits Na+/H+ exchange: cell shrinkage reduces the inhibition.Am. J. Physiol. Cell Physiol. 287:C336–C344 [DOI] [PubMed] [Google Scholar]
- Edelman J.L., Lin H., Miller S.S. 1994. Acidification stimulates chloride and fluid absorption across frog retinal pigment epithelium.Am. J. Physiol. 266:C946–C956 [DOI] [PubMed] [Google Scholar]
- Endeward V., Gros G. 2005. Low carbon dioxide permeability of the apical epithelial membrane of guinea-pig colon.J. Physiol. 567:253–265 [DOI] [PMC free article] [PubMed] [Google Scholar]
- Endeward V., Musa-Aziz R., Cooper G.J., Chen L.M., Pelletier M.F., Virkki L.V., Supuran C.T., King L.S., Boron W.F., Gros G. 2006. Evidence that aquaporin 1 is a major pathway for CO2 transport across the human erythrocyte membrane.FASEB J. 20:1974–1981 [DOI] [PubMed] [Google Scholar]
- Fisher S.K., Lewis G.P., Linberg K.A., Verardo M.R. 2005. Cellular remodeling in mammalian retina: results from studies of experimental retinal detachment.Prog. Retin. Eye Res. 24:395–431 [DOI] [PubMed] [Google Scholar]
- Fishman G.A., Gilbert L.D., Fiscella R.G., Kimura A.E., Jampol L.M. 1989. Acetazolamide for treatment of chronic macular edema in retinitis pigmentosa.Arch. Ophthalmol. 107:1445–1452 [DOI] [PubMed] [Google Scholar]
- Furia T.E. 1972. Sequestrants in foods. CRC Handbook of Food Additives. Vol. 1 Furia T.E., editor CRC Press, Boca Raton, FL. 276 [Google Scholar]
- Gallemore R.P., Li J.D., Govardovskii V.I., Steinberg R.H. 1994. Calcium gradients and light-evoked calcium changes outside rods in the intact cat retina.Vis. Neurosci. 11:753–761 [DOI] [PubMed] [Google Scholar]
- Gross E., Abuladze N., Pushkin A., Kurtz I., Cotton C.U. 2001. The stoichiometry of the electrogenic sodium bicarbonate cotransporter pNBC1 in mouse pancreatic duct cells is 2 HCO(3)(-):1 Na(+).J. Physiol. 531:375–382 [DOI] [PMC free article] [PubMed] [Google Scholar]
- Harootunian A.T., Kao J.P., Eckert B.K., Tsien R.Y. 1989. Fluorescence ratio imaging of cytosolic free Na+ in individual fibroblasts and lymphocytes.J. Biol. Chem. 264:19458–19467 [PubMed] [Google Scholar]
- Hill W.G., Zeidel M.L. 2000. Reconstituting the barrier properties of a water-tight epithelial membrane by design of leaflet-specific liposomes.J. Biol. Chem. 275:30176–30185 [DOI] [PubMed] [Google Scholar]
- Hill W.G., Rivers R.L., Zeidel M.L. 1999. Role of leaflet asymmetry in the permeability of model biological membranes to protons, solutes, and gases.J. Gen. Physiol. 114:405–414 [DOI] [PMC free article] [PubMed] [Google Scholar]
- Hughes B.A., Miller S.S., Machen T.E. 1984. Effects of cyclic AMP on fluid absorption and ion transport across frog retinal pigment epithelium. Measurements in the open-circuit state.J. Gen. Physiol. 83:875–899 [DOI] [PMC free article] [PubMed] [Google Scholar]
- Hughes B.A., Adorante J.S., Miller S.S., Lin H. 1989. Apical electrogenic NaHCO3 cotransport. A mechanism for HCO3 absorption across the retinal pigment epithelium.J. Gen. Physiol. 94:125–150 [DOI] [PMC free article] [PubMed] [Google Scholar]
- Hughes B.A., Gallemore R.P., Miller S.S. 1998. Transport mechanisms in the retinal pigment epithelium. The Retinal Pigment Epithelium. Marmor M.F., Wolfensberger T.J., Oxford University Press, New York: 103–134 [Google Scholar]
- Joseph D.P., Miller S.S. 1991. Apical and basal membrane ion transport mechanisms in bovine retinal pigment epithelium.J. Physiol. 435:439–463 [DOI] [PMC free article] [PubMed] [Google Scholar]
- Kenyon E., Maminishkis A., Joseph D.P., Miller S.S. 1997. Apical and basolateral membrane mechanisms that regulate pHi in bovine retinal pigment epithelium.Am. J. Physiol. 273:C456–C472 [DOI] [PubMed] [Google Scholar]
- Kimble E.A., Svoboda R.A., Ostroy S.E. 1980. Oxygen consumption and ATP changes of the vertebrate photoreceptor.Exp. Eye Res. 31:271–288 [DOI] [PubMed] [Google Scholar]
- Kita M., Marmor M.F. 1992. Retinal adhesive force in living rabbit, cat, and monkey eyes. Normative data and enhancement by mannitol and acetazolamide.Invest. Ophthalmol. Vis. Sci. 33:1879–1882 [PubMed] [Google Scholar]
- Kurschat C.E., Shmukler B.E., Jiang L., Wilhelm S., Kim E.H., Chernova M.N., Kinne R.K., Stewart A.K., Alper S.L. 2006. Alkaline-shifted pHo sensitivity of AE2c1-mediated anion exchange reveals novel regulatory determinants in the AE2 N-terminal cytoplasmic domain.J. Biol. Chem. 281:1885–1896 [DOI] [PubMed] [Google Scholar]
- Li J.D., Gallemore R.P., Dmitriev A., Steinberg R.H. 1994a. Light-dependent hydration of the space surrounding photoreceptors in chick retina.Invest. Ophthalmol. Vis. Sci. 35:2700–2711 [PubMed] [Google Scholar]
- Li J.D., Govardovskii V.I., Steinberg R.H. 1994b. Light-dependent hydration of the space surrounding photoreceptors in the cat retina.Vis. Neurosci. 11:743–752 [DOI] [PubMed] [Google Scholar]
- Lin H., Miller S.S. 1994. pHi-dependent Cl-HCO3 exchange at the basolateral membrane of frog retinal pigment epithelium.Am. J. Physiol. 266:C935–C945 [DOI] [PubMed] [Google Scholar]
- Livsey C.T., Huang B., Xu J., Karwoski C.J. 1990. Light-evoked changes in extracellular calcium concentration in frog retina.Vision Res. 30:853–861 [DOI] [PubMed] [Google Scholar]
- Maminishkis A., Jalickee S., Blaug S.A., Rymer J., Yerxa B.R., Peterson W.M., Miller S.S. 2002. The P2Y(2) receptor agonist INS37217 stimulates RPE fluid transport in vitro and retinal reattachment in rat.Invest. Ophthalmol. Vis. Sci. 43:3555–3566 [PubMed] [Google Scholar]
- Maminishkis A., Chen S., Jalickee S., Banzon T., Shi G., Wang F.E., Ehalt T., Hammer J.A., Miller S.S. 2006. Confluent monolayers of cultured human fetal retinal pigment epithelium exhibit morphology and physiology of native tissue.Invest. Ophthalmol. Vis. Sci. 47:3612–3624 [DOI] [PMC free article] [PubMed] [Google Scholar]
- Medrano C.J., Fox D.A. 1995. Oxygen consumption in the rat outer and inner retina: light- and pharmacologically-induced inhibition.Exp. Eye Res. 61:273–284 [DOI] [PubMed] [Google Scholar]
- Meyertholen E.P., Wilson M.J., Ostroy S.E. 1986. The effects of hepes, bicarbonate and calcium on the cGMP content of vertebrate rod photoreceptors and the isolated electrophysiological effects of cGMP and calcium.Vision Res. 26:521–533 [DOI] [PubMed] [Google Scholar]
- Millar I.D., Brown P.D. 2008. NBCe2 exhibits a 3 HCO3(-):1 Na+ stoichiometry in mouse choroid plexus epithelial cells.Biochem. Biophys. Res. Commun. 373:550–554 [DOI] [PubMed] [Google Scholar]
- Miller S.S., Steinberg R.H. 1977. Passive ionic properties of frog retinal pigment epithelium.J. Membr. Biol. 36:337–372 [DOI] [PubMed] [Google Scholar]
- Nagelhus E.A., Mathiisen T.M., Bateman A.C., Haug F.M., Ottersen O.P., Grubb J.H., Waheed A., Sly W.S. 2005. Carbonic anhydrase XIV is enriched in specific membrane domains of retinal pigment epithelium, Muller cells, and astrocytes.Proc. Natl. Acad. Sci. USA. 102:8030–8035 [DOI] [PMC free article] [PubMed] [Google Scholar]
- Nakazawa T., Hisatomi T., Nakazawa C., Noda K., Maruyama K., She H., Matsubara A., Miyahara S., Nakao S., Yin Y., et al. 2007. Monocyte chemoattractant protein 1 mediates retinal detachment-induced photoreceptor apoptosis.Proc. Natl. Acad. Sci. USA. 104:2425–2430 [DOI] [PMC free article] [PubMed] [Google Scholar]
- Oyster C.W. 1999. The Human Eye: Structure and Function. Sinauer Associates, Inc., Sunderland, MA: 766 pp [Google Scholar]
- Praetorius J. 2007. Water and solute secretion by the choroid plexus.Pflugers Arch. 454:1–18 [DOI] [PubMed] [Google Scholar]
- Purkerson J.M., Schwartz G.J. 2007. The role of carbonic anhydrases in renal physiology.Kidney Int. 71:103–115 [DOI] [PubMed] [Google Scholar]
- Saito Y., Wright E.M. 1983. Bicarbonate transport across the frog choroid plexus and its control by cyclic nucleotides.J. Physiol. 336:635–648 [DOI] [PMC free article] [PubMed] [Google Scholar]
- Saito Y., Wright E.M. 1984. Regulation of bicarbonate transport across the brush border membrane of the bull-frog choroid plexus.J. Physiol. 350:327–342 [DOI] [PMC free article] [PubMed] [Google Scholar]
- Sillman A.J., Owen W.G., Fernandez H.R. 1972. The generation of the late receptor potential: an excitation-inhibition phenomenon.Vision Res. 12:1519–1531 [DOI] [PubMed] [Google Scholar]
- Stamer W.D., Bok D., Hu J., Jaffe G.J., McKay B.S. 2003. Aquaporin-1 channels in human retinal pigment epithelium: role in transepithelial water movement.Invest. Ophthalmol. Vis. Sci. 44:2803–2808 [DOI] [PubMed] [Google Scholar]
- Steinberg R.H., Linsenmeier R.A., Griff E.R. 1983. Three light-evoked responses of the retinal pigment epithelium.Vision Res. 23:1315–1323 [DOI] [PubMed] [Google Scholar]
- Stewart A.K., Kurschat C.E., Alper S.L. 2007. Role of nonconserved charged residues of the AE2 transmembrane domain in regulation of anion exchange by pH.Pflugers Arch. 454:373–384 [DOI] [PubMed] [Google Scholar]
- Stone J., Maslim J., Valter-Kocsi K., Mervin K., Bowers F., Chu Y., Barnett N., Provis J., Lewis G., Fisher S.K., et al. 1999. Mechanisms of photoreceptor death and survival in mammalian retina.Prog. Retin. Eye Res. 18:689–735 [DOI] [PubMed] [Google Scholar]
- Stone J., van Driel D., Valter K., Rees S., Provis J. 2008. The locations of mitochondria in mammalian photoreceptors: relation to retinal vasculature.Brain Res. 1189:58–69 [DOI] [PubMed] [Google Scholar]
- Takahashi K., Dixon D.B., Copenhagen D.R. 1993. Modulation of a sustained calcium current by intracellular pH in horizontal cells of fish retina.J. Gen. Physiol. 101:695–714 [DOI] [PMC free article] [PubMed] [Google Scholar]
- Virkki L.V., Wilson D.A., Vaughan-Jones R.D., Boron W.F. 2002. Functional characterization of human NBC4 as an electrogenic Na+-HCO cotransporter (NBCe2).Am. J. Physiol. 282:C1278–C1289 [DOI] [PubMed] [Google Scholar]
- Vogh B.P., Maren T.H. 1975. Sodium, chloride, and bicarbonate movement from plasma to cerebrospinal fluid in cats.Am. J. Physiol. 228:673–683 [DOI] [PubMed] [Google Scholar]
- Vogh B.P., Godman D.R., Maren T.H. 1987. Effect of AlCl3 and other acids on cerebrospinal fluid production: a correction.J. Pharmacol. Exp. Ther. 243:35–39 [PubMed] [Google Scholar]
- Waisbren S.J., Geibel J.P., Modlin I.M., Boron W.F. 1994. Unusual permeability properties of gastric gland cells.Nature. 368:332–335 [DOI] [PubMed] [Google Scholar]
- Wangsa-Wirawan N.D., Linsenmeier R.A. 2003. Retinal oxygen: fundamental and clinical aspects.Arch. Ophthalmol. 121:547–557 [DOI] [PubMed] [Google Scholar]
- Weintraub W.H., Machen T.E. 1989. pH regulation in hepatoma cells: roles for Na-H exchange, Cl-HCO3 exchange, and Na-HCO3 cotransport.Am. J. Physiol. 257:G317–G327 [DOI] [PubMed] [Google Scholar]
- Wickham L., Sethi C.S., Lewis G.P., Fisher S.K., McLeod D.C., Charteris D.G. 2006. Glial and neural response in short-term human retinal detachment.Arch. Ophthalmol. 124:1779–1782 [DOI] [PubMed] [Google Scholar]
- Winkler B.S., Starnes C.A., Twardy B.S., Brault D., Taylor R.C. 2008. Nuclear magnetic resonance and biochemical measurements of glucose utilization in the cone-dominant ground squirrel retina.Invest. Ophthalmol. Vis. Sci. 49:4613–4619 [DOI] [PubMed] [Google Scholar]
- Wolfensberger T.J. 1999. The role of carbonic anhydrase inhibitors in the management of macular edema.Doc. Ophthalmol. 97:387–397 [DOI] [PubMed] [Google Scholar]
- Wolfensberger T.J., Chiang R.K., Takeuchi A., Marmor M.F. 2000. Inhibition of membrane-bound carbonic anhydrase enhances subretinal fluid absorption and retinal adhesiveness.Albrecht Von Graefes Arch. Klin. Exp. Ophthalmol. 238:76–80 [DOI] [PubMed] [Google Scholar]
- Wright A., Brearey S., Imray C. 2008. High hopes at high altitudes: pharmacotherapy for acute mountain sickness and high-altitude cerebral and pulmonary oedema.Expert Opin. Pharmacother. 9:119–127 [DOI] [PubMed] [Google Scholar]
- Yamamoto F., Borgula G.A., Steinberg R.H. 1992. Effects of light and darkness on pH outside rod photoreceptors in the cat retina.Exp. Eye Res. 54:685–697 [DOI] [PubMed] [Google Scholar]
- Yu D.Y., Cringle S.J. 2002. Outer retinal anoxia during dark adaptation is not a general property of mammalian retinas.Comp. Biochem. Physiol. 132:47–52 [DOI] [PubMed] [Google Scholar]