

Abstract
The two published crystal structures of CYP2C9, complexed with (S)-warfarin or flurbiprofen, implicate a cluster of three active-site phenylalanine residues (F100, F114, F476) in ligand binding. However, these three residues appear to interact differently with these two ligands based on the static crystal structures. To elucidate the importance of CYP2C9’s active site phenylalanines on substrate binding, orientation and catalytic turnover, a series of leucine and tryptophan mutants was constructed and their interactions with (S)-warfarin and (S)-flurbiprofen examined. The F100→L mutation had minor effects on substrate binding and metabolism of each substrate. In contrast, the F114L and F476L mutants exhibited substantially reduced (S)-warfarin metabolism and altered hydroxy metabolite profiles, but only modestly decreased NSAID turnover, while maintaining product regioselectivity. The F114→W and F476→W mutations also had opposing effects on (S)-warfarin versus NSAID turnover. Notably, the F476W mutant increased the efficiency of (S)-warfarin metabolism 5-fold, yet decreased the efficiency of (S)-flurbiprofen turnover 20-fold. 1H-NMR T1 relaxation studies suggested a slightly closer positioning of (S)-warfarin to the heme in the F476W mutant relative to the wild-type enzyme, and stoichiometry studies indicated enhanced coupling of reducing equivalents to product formation for (S)-warfarin, again in contrast to effects observed with (S)-flurbiprofen. These data demonstrate that F114 and F476, but not F100, influence (S)-warfarin’s catalytic orientation. Differential interactions of F476 mutants with the two substrates suggest that their catalytically productive binding modes are not superimposable.
Cytochrome P450 2C9 (CYP2C9) is a major human form of hepatic P450, recognized for its preferential metabolism of weakly acidic substrates such as warfarin, phenytoin, and numerous non-steroidal anti-inflammatory drugs (NSAIDs), including flurbiprofen and diclofenac (1). The enzyme also exists in a variety of polymorphic forms, with some 30 point mutations identified, several of which alter the catalytic activity of the enzyme (http://www.cypalleles.ki.se/cyp2c9.htm). Subtle primary sequence changes in CYP2C9 (e.g. the I359L polymorphism) can have dramatic effects on therapeutic response and drug-related toxicity (2). Therefore, understanding the structure-function relationships of this versatile drug-metabolizing enzyme is not only a fundamentally interesting goal, but one with added significance at the clinical level.
In recent years, two X-ray crystal structures of CYP2C9 complexed with either flurbiprofen (Protein Data Bank code 1R9O) (3) or (S)-warfarin (Protein Data Bank code 1OG5) (4) have become available. However, these structures place the two ligands in very different positions within the active site. Whereas flurbiprofen’s hydroxylation site was located only 4.9Å from the heme iron (3), (S)-warfarin was positioned remotely, ~10Å above the heme, in most likely a non-catalytic orientation (4) (Figure 1). In the 1OG5 structure, the CYP2C9 active site cavity runs along the heme and helix I, then extends up and away from helix I, and is encapsulated by the B′ helix, and the B–C and F–G loops (4). Of particular importance are three phenylalanine residues, F100, F114 (both located in the B–C loop), and F476 (β4 turn), which directly interact with (S)-warfarin (Figure 1A), although the exact nature of the F100–(S)-warfarin contact has been debated. Complicating interpretation of the (S)-warfarin binding representation are numerous F–G loop mutations present in the 1OG5 structure that were introduced to improve crystallization properties. This has prompted the suggestion that the 1R9O structure may be a more ‘native’ representation of CYP2C9 (5). These three residues still partly define the active site cavity in the 1R9O structure, although only F114 directly interacts with the flurbiprofen molecule. In addition, F114 and F100 are repositioned by several angstroms between the 1R9O and 1OG5 structures, whereas the location of F476 remains relatively unchanged (3) (Figure 1B).
Figure 1.

(S)-Warfarin and flurbiprofen bound in crystal structures 1OG5 (Panel A) and 1R9O (Panel B), respectively. View is looking down the access channel to the heme (red). Bound ligands are shown in green. For clarity, the F and G helices (and F–G loop) have been removed, but for reference should appear at the top of each picture, closest to the viewer, with the F–G loop on the left hand side. Phenylalanine side-chains are depicted for F100 in yellow, F114 in blue and F476 in purple. Distances from the sites of oxidation to the heme iron are shown by dotted lines.
Many questions remain about the positioning of these ligands during catalytic turnover, especially since crystallization of (S)-warfarin bound to CYP2C9 possessing a native F–G loop region has yet to be achieved. For both flurbiprofen and (S)-warfarin, only the F114L mutant has been previously characterized (6, 7). Therefore, the current study was undertaken to evaluate the importance of F100, F114 and F476 in ligand binding, metabolism and orientation within the CYP2C9 active site. Phenylalanine residues were mutated singly and doubly, to leucine or tryptophan, to modulate steric bulk and aromaticity, respectively, in order to investigate the effects on spectral binding, steady-state turnover kinetics and metabolite profiles. These studies indicate that the F476 residue, in particular, interacts differentially with (S)-warfarin and (S)-flurbiprofen. 1H-NMR T1 relaxation and stoichiometry studies were performed in order to evaluate the mechanism of the gain of function observed for (S)-warfarin metabolism by the F476W mutant.
MATERIALS and METHODS
Materials
The following chemicals were purchased from Sigma-Aldrich Chemical Co. (St. Louis, MO): L-α-dilauroyl phosphatidylcholine (DLPC), dithiothreitol, diclofenac sodium, (S)-flurbiprofen, 4-biphenylacetic acid, β-NADPH, isopropyl β-D-thiogalactopyranoside (IPTG), δ-aminolevulinic acid (δ-ALA), ampicillin, and a protease inhibitor cocktail. Platinum Pfx DNA polymerase, T4 DNA ligase, and MAX efficiency® DH5αF′IQ™ competent cells were purchased from Invitrogen (Carlsbad, CA). Restriction enzymes were obtained from New England Biolabs (Beverly, MA). Glacial acetic acid, formic acid, and ammonium hydroxide, all ACS grade, and acetonitrile, Optima® grade, were purchased from Fisher Scientific Co. (Fair Lawn, NJ). (S)-Warfarin was obtained by fractional crystallization, and the deuterated hydroxylated internal standards were synthesized as described previously (8). 4′-Hydroxyflurbiprofen was a gift from the former Pharmacia, Inc. (Kalamazoo, MI). The metabolites 3′-, 4′-, and 5-hydroxydiclofenac and the internal standard 4′-hydroxy-5-chlorodiclofenac were obtained from Novartis (Basel).
Mutagenesis and protein expression
The eight CYP2C9 enzyme variants used in this study were produced by either a single polymerase chain reaction (wild-type, F114L/F476L and F114W/F476W), or overlap extension PCR (F100L, F114L, F476L, F114W, and F476W). The forward mutagenic oligonucleotides consisted of the following sequences (the altered nucleotides are in bold italics): F100L, 5′-GAG GCA TTT TGC CAC TGG C-3′; F114L, 5′-GAG GAT TTG GAA TTG TTC TCA GCA ATG GAA AGA AAT GG-3′; F476L and F114L/F476L, 5′-CCA GTT GTC AAT GGT CTT GCC TCT GTG CCG C-3′; F114W, 5′-GAG GAT TTG GAA TTG TTT GGA GCA ATG GAA AGA AAT GG-3′; F476W and F114W/F476W, 5′-CCA GTT GTC AAT GGT TGG GCC TCT GTG CCG C-3′. For overlap extension the following N-terminal forward or C-terminal reverse primers were used: forward, 5′-CCA TCG ATC ATA TGG CTC TGT TAT TAG CAG TTT TTC TCT GTC TCT CAT GTT TGC TTC TCC TTT C-3′; reverse, 5′-TCT GTC GAC ACA GGA ATG AAG CAC AGC TGG TAG AAG-3′. NdeI and SalI restriction sites were engineered into the forward and reverse primers, respectively, to facilitate downstream subcloning. The forward primer also encoded the MALLLAVFL N-terminal sequence of recombinant bovine P450 17α(9) to enhance expression in Escherichia coli. The template for the wild-type CYP2C9 gene was the native CYP2C9 gene in the baculovirus transfer vector pUC19 (6). The single mutants were engineered using wild-type CYP2C9 as a template. The double mutants were based on either F114L (F114L/F476L) or F114W (F114W/F476W). The constructs were then cloned into the NdeI and SalI restriction sites of histidine-tagged pCWori+ (10) and transformed into DH5α cells for large-scale overexpression in E. coli. All plasmids had their integrity verified by DNA sequencing. Proteins were purified via nickel and hydroxyapatite affinity columns. as described previously, without the inclusion of stabilizing ligands (11). Protein concentration was measured by the Lowry method and spectral P450 contents were measured on an Agilent 8453E UV-visible spectroscopy system according to published methods (12).
Liquid chromatography/mass spectrometry analysis
Intact protein masses (monoisotopic MH+) for each of the CYP2C9 mutants were obtained using a Shimadzu LC-10AD system (Shimadzu Scientific Instruments, Inc., Columbia, MD) coupled to a triple quadrupole Quattro II (Micromass, Cary, NC), operated in the positive ion electrospray mode with MassLynx 3.2 scanning from m/z 500–2200 in continuum mode. Separation was achieved using a POROS2 (150 × 2.1 mm) column and mobile phase of 0.5% trifluoroacetic acid (TFA) in water : 0.5% TFA in acetonitrile [70:30].
Spectral binding
All spectra were recorded using an Aminco DW2 double beam spectrophotometer modified by Olis (Bogart, GA). Purified 3 enzyme (0.5 μM) was reconstituted in 0.75 μg of DLPC extruded through a 0.2-μm filter (Avanti Polar Lipids, Inc., Alabaster, AL), and 50 mM potassium phosphate buffer (pH 7.4 with 20% glycerol) was added to total 2 mL. Aliquots of 900 μL were placed in separate 1.4 mL black-walled cuvettes and allowed to equilibrate to 37 °C. Ligands were added to the sample cuvette, while corresponding volumes of organic solvent were added to the reference cuvette. The total organic added was less than 2% of the total volume, and difference spectra were obtained over the range of 0–100 μM (S)-flurbiprofen or 0–150 μM or 0–300 μM (S)-warfarin, depending on the mutant.
General enzyme assay conditions
Incubation buffers contained 25 mM potassium phosphate buffer, pH 7.4, 0.02 pmol DLPC per pmol P450 extruded through a 0.2-μm filter, and 200 μM dithiothreitol. Reconstituted P450 enzyme, P450 reductase and cytochrome b5, in a ratio of 1:2:1, were added to the buffer. Reactions were initiated by addition of 0.5 mM NADPH and conducted at 37 °C.
LC-MS analysis of hydroxywarfarin metabolites
Warfarin incubations were performed in 0.5 mL reaction volumes for 20 minutes with either triplicate samples of 50 pmol of P450 and 500 μM (S)-warfarin or quadruplicate samples of 20 or 50 pmol P450, depending on the rate of turnover, and 2–200 μM (S)-warfarin. After quenching with 10 μL of perchloric acid, 100 ng of each internal standard (d4-4′-, d5-6-, d5-7-, and d5-8-hydroxywarfarin) was added, and the samples were centrifuged at 13,500 rpm for 4 min. Hydroxywarfarin concentrations were measured by liquid chromatography-mass spectrometry (LC-MS) using a Hewlett Packard series 1100 MSD (Palo Alto, CA) system operating in the positive ion electrospray mode with selected ion monitoring and equipped with HP Chemstation data analysis software. The mobile phase consisted of A: 1.5% ammonium acetate, pH 4.7, and B: acetonitrile with gradient elution at 0.25 mL/min. Gradient elution steps were as follows: 0–4 minutes 35%B, 4–7 minutes linear gradient to 55%B, 7–8 minutes linear gradient to 80%B, 8–9 minutes linear gradient to 35%B. Analyte separation was achieved through an Inertsil ODS-3 5 μm column (150 × 2.1 mm) (Alltech, Deerfield, IL), and the injection volume was 10 μL. Hydroxywarfarin metabolites were monitored at m/z 325, and the deuterated internal standards at m/z 329 and m/z 330.
Fluorescence analysis of 4′-hydroxyflurbiprofen
(S)-Flurbiprofen incubations were performed in 0.2 mL reaction volumes with 1 or 5 pmol of P450 for 20 minutes. Incubations were in triplicate with 300 or 600 μM, or in quadruplicate from 5–300 μM or 5–600 μM, depending on the mutant. After quenching with 5 μL perchloric acid, 200 μL of acetonitrile containing 180 ng/mL of the internal standard 4-biphenylacetic acid was added, the samples were centrifuged at 13,500 rpm for 4 min, and 20 μL was injected into the HPLC system. 4′-Hydroxyflurbiprofen concentrations were measured using a Hewlett Packard 1050 LC (Palo Alto, CA) with fluorescence detection (excitation at 260 nm, emission at 320 nm). Separation was achieved using an Econosphere C18 (150 × 4.6 mm) column (Alltech, Deerfield, IL) with 20 mM K2HPO4, pH 3.0/acetonitrile [60:40] at 1.0 mL/min.
UV detection of 4′-hydroxydiclofenac
Diclofenac incubations were performed in triplicate in 1 mL volumes for 15 minutes with 10 pmol P450 and 200 or 500 μM diclofenac, depending on the mutant. After quenching with 10 μL of 0.1% formic acid, 190 μL of acetonitrile, and 0.75 ng of the internal standard 4′-hydroxy-5-chlorodiclofenac was added and the mixture was centrifuged at 13,500 rpm for 5 minutes. 150 μL was then injected onto a Shimadzu LC-10AD system with SPD-M10AVP photodiode array detector (Shimadzu Scientific Instruments, Inc., Columbia, MD) monitoring at 267 nm. Separation was achieved using a Synergi Max-RP (150 × 4.6 mm) column (Phenomenex, Torrance, CA). The mobile phase consisted of A: 0.1% formic acid, and B: acetonitrile. Gradient elution steps were as follows: 0–5 minutes 35%B, 5–15 minutes linear gradient to 90%B, 15–18 minutes linear gradient to 35%B, and 18–20 re-equilibration at 35%B, all at 1 mL/min. This method achieved baseline separation of 3′-, 4′-, and 5-hydroxydiclofenac.
Binding and kinetic data analysis
The absorbance differences between peaks (390 nm) and troughs (420 nm) in the Type I binding spectra were fit according to a one site saturation model using SigmaPlot 8.0 (Systat Software, Point Richmond, CA). Enzyme kinetics were fitted to either the Michaelis-Menton model or the two binding site – one substrate model (13) using SigmaPlot.
NMR T1 relaxation
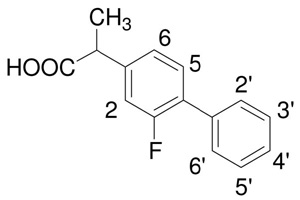
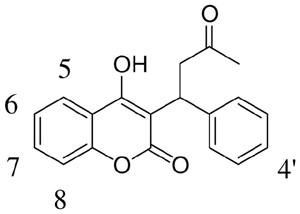
NMR experiments were performed as described previously (14). In short, samples were prepared in 50 mM potassium phosphate buffer in D2O. Wild-type CYP2C9 or F476W were diluted to 1/1000 their respective warfarin Ks values, and warfarin or d5-warfarin was added to 10× Ks. A Varian Inova 600 MHz Spectrometer operated at 600.5 MHz and 298 K. The Varian inversion-recovery sequence (d1-180-d2-90) was used, acquiring spectra for 12 τ(d2) values ranging from 0.0125 to 25.6 s with a period of 10 T1 between pulses (d1) to determine the paramagnetic influence of the heme iron on the warfarin protons. The samples were then removed from the NMR tubes, sodium dithionite was added and carbon monoxide gas was bubbled through the samples before being replaced into the NMR tubes. The inversion-recovery sequence was again run to determine the diamagnetic contribution of the protein to the T1 relaxation values. The Varian software was used to determine the T1 times used for distance calculations. Estimates for distances of protons from the heme iron were calculated using the following equation: , (15) where r is the distance, T1p = T1obs(Fe3+)−1 − T1obs(Fe2+)−1, αm = [P450]/(Ks + [substrate]) under conditions of fast exchange (16), and τc= 2 × 10⁻¹⁰ s−1 as determined previously (17). S(S+1) = 8.75fHS = 0.75fLS where fHS and fLS refer to the fraction of the high spin and low spin iron, respectively (15). Ks values used were those determined by visible spectroscopy, and the fraction high spin values are as follows: WT+(S)-warfarin 0.09; F476W+(S)-warfarin 0.12; WT+(S)-flurbiprofen 0.16; F476W+(S)-flurbiprofen 0.06. T1 relaxation measurements were also made with and without carbon monoxide at 283, 298, and 310 K to determine if the protons were in fast exchange with the enzyme. The warfarin NMR chemical shifts were as follows (in reference to H2O at 4.67 ppm): H5 (dd, 7.81 ppm, J = 1.8, 7.8 Hz); H6 (t, 7.222 ppm, J = 7.8 Hz); H7 (dt, 7.46 ppm, J = 1.8, 7.8 Hz); H8 (d, 7.219 ppm, J = 7.8 Hz); H2′/6′ (d, 7.27 ppm, J = 7.8 Hz); H3′/5′ (t, 7.19 ppm, J = 7.8 Hz); H4′ (t, 7.11 ppm, J = 7.8 Hz); CH3 (s, 2.09 ppm). The peaks for the methylene protons attached to C10 and the methine proton attached to C9 were masked by the residual glycerol in solution, and so their chemical shifts and T1 relaxation values were not reported.
Stoichiometry determination
Dissolved oxygen measurements were conducted in a fully enclosed, water jacketed Clark-type electrode (model OX1LP, Qubit Systems, Kingston, Ontario) operated at 37°C. Incubations were run in 0.6 mL reaction volumes with 100 (WT) or 200 (F476W) pmol of CYP2C9, 200 or 400 pmol CPR, and 25 μg DLPC in 25 mM potassium phosphate buffer, pH 7.4 to optimize sensitivity and accuracy. Samples were preincubated for 3 min before initiation with NADPH (final concentration 0.5 mM) and dissolved oxygen depletion recorded for 15 min using Logger Pro 3.2 (Vernier Software & Technology, Beaverton, OR). Control incubations without substrate were performed for both proteins to account for background oxygen consumption. NADPH consumption was monitored using optical absorption on an Aminco DW2 double beam spectrophotometer modified by Olis (Bogart, GA) and extinction coefficient of 6.22 mM−1cm−1 at 340 nm. Incubations were run as described for the dissolved oxygen measurements, except that 50 pmol of CYP2C9 protein were used. Samples were equilibrated and initiated as described above, and after 15 min quenched by addition of 50 μL of acetonitrile. Aliquots (50 μL) were then added to 450μL of PeroXOquant reagent (2.5 mM ammonium ferrous (II) sulfate, 0.25 M H2SO4, 100 mM sorbitol, and 125 μM xylenol orange in water) for analysis of hydrogen peroxide formation. After incubation for 60 min at room temperature, the sample absorbance was measured at 560 nm and compared to similarly prepared PeroXOquant standards of known hydrogen peroxide concentrations. Excess water formation was determined based on the methods of Gorsky et al. (18) according to the equation H2O min−1 = O2 min−1 – (H2O2 min−1 + metabolite min−1).
RESULTS
Construct selection and protein characterization
To facilitate expression in the E. coli system, the first eight residues of the native CYP2C9 sequence were replaced by the Barnes sequence, MALLLAVFL (9, 11), and this construct is referred to here as wild-type CYP2C9. This wild-type construct was used as the template for all mutant enzymes. Based upon its location relative to the ligands in the two available CYP2C9 crystal structures, as well as previous functional studies (3, 4, 19), we engineered F100L expecting it to serve as a control enzyme for mutagenesis in the CYP2C9 active site. To probe the importance of aromaticity and steric factors, the F→L and F→W mutations were constructed at residues 114 and/or 476. CYP2C9 constructs were expressed in E. coli, and all proteins expressed at levels of 200–400 nmol/liter. The P450 specific contents were 11–14 nmol/mg and mass analysis of the apo-enzymes determined by liquid chromatography-mass spectrometry returned molecular weight values that agreed within ≤0.01% of the calculated molecular weights (Table 1). SDS-polyacrylamide gel electrophoresis analysis also indicated similarly high levels of purity (data not shown).
Table 1.
Specific heme content and accurate mass analysis of CYP2C9 mutants
| Enzyme Concentrations |
Molecular Mass |
|||
|---|---|---|---|---|
| Specific content nmol/mg | Expected | Observed Da | Δ | |
| Wild-type | 14 | 56669 | 56672 | +3 |
| F100L | 11 | 56635 | 56631 | −4 |
| F114L | 11 | 56635 | 56633 | −2 |
| F476L | 11 | 56635 | 56630 | −5 |
| F114W | 13 | 56708 | 56703 | −5 |
| F476W | 12 | 56708 | 56705 | −3 |
| F114L/F476L | 13 | 56601 | 56594 | −7 |
| F114W/F476W | 13 | 56747 | 56741 | −6 |
Functional activity of CYP2C9 mutants
A major focus of this study was to evaluate (S)-warfarin binding and metabolism. However, to better frame the (S)-warfarin data, we simultaneously studied the well-characterized CYP2C9 substrate, (S)-flurbiprofen. Additionally, in some studies, we included diclofenac, an NSAID with high turnover similar to (S)-flurbiprofen, but also one that is capable of forming multiple products on different aromatic rings, similar to (S)-warfarin (20). Figure 2 contrasts metabolism of the three substrate probes by CYP2C9 mutants at saturating concentrations for each enzyme. Both (S)-flurbiprofen and diclofenac were converted solely to their 4′-hydroxy metabolites, by each of the eight enzyme variants. In addition, the ‘fingerprint’ of functional effects provided by these seven mutations was quite similar for these two substrates (compare Figure 2A, B), which would be expected if the two catalytic orientations of these two similarly-structured NSAIDs were (near) superimposable. In contrast, the fingerprint obtained with (S)-warfarin as the substrate differed substantially from the NSAID profiles, with a greater reduction in warfarin hydroxylase activity observed for the F114L and F476L mutants and a surprising 4-fold gain of function for the F476W mutant relative to the wild-type enzyme (Figure 2C). Steady-state kinetic studies confirmed that the relative catalytic efficiencies of these three mutants for the two ligands differed considerably (Table 2). Moreover, unlike the two NSAIDs, (S)-warfarin metabolism by several of the mutants displayed altered regiochemistry (Figure 3).
Figure 2.

CYP2C9 metabolic turnover at saturating concentrations of (A) flurbiprofen, (B) diclofenac, and (C) (S)-warfarin. In (C), bars represent sum of 4′-, 6-, 7-, and 8-hydroxywarfarin. Values are represented as the percentage of wild-type turnover (A: 4′-hydroxyflurbiprofen formation = 8.0 ± 0.2 pmol/min/pmol P450; B: 4′-hydroxydiclofenac formation = 16 ± 0.2 pmol/min/pmol P450; C: total warfarin formation = 0.39 ± 0.04 pmol/min/pmol P450). Error bars indicate standard deviation of triplicate incubations. W/W: F114W/F476W. L/L: F114L/F476L. Insets: chemical structures. Solid arrows indicate major sites of metabolism for wild-type CYP2C9; dotted arrows indicate minor sites.
Table 2.
Kinetic parameter estimates for hydroxylation of (S)-warfarin and flurbiprofen.
| (S)-warfarin | Flurbiprofen | |||||
|---|---|---|---|---|---|---|
| KmμM | kcatmin−1 | kcat/Kmbmin−1 μM−1 | KmμM | kcatmin−1 | kcat/Kmbmin−1 μM−1 | |
| WT | 4.1 ± 0.3 | 0.25 ± 0.004 | 0.06 (100) | 22.9 ± 3.7 | 9.0 ± 0.4 | 0.4 (100) |
| F100L | 4.5 ± 0.5 | 0.35 ± 0.01 | 0.08 (133) | 34.8 ± 7.0 | 12.3 ± 0.7 | 0.4 (100) |
| F114L | 23.9 ± 4.5a | 0.028 ± 0.002 | 0.001 (2) | 42.8 ± 4.3 | 4.8 ± 0.1 | 0.1 (28) |
| F476L | 21.0 ± 2.7a | 0.022 ± 0.001 | 0.001 (2) | 39.2 ± 8.3 | 4.5 ± 0.2 | 0.1 (29) |
| F114W | 1.5 ± 0.1 | 0.078 ± 0.001 | 0.05 (83) | 19.5 ± 3.2 | 9.2 ± 0.4 | 0.5 (120) |
| F476W | 3.9 ± 0.6 | 1.08 ± 0.04 | 0.3 (500) | 104.9 ± 3.9 | 1.6 ± 0.2 | 0.02 (5) |
| F114L/F476L | 66.0 ± 12.3a | 0.015 ± 0.001 | 0.0002 (0.4) | 218.6 ± 24.2 | 3.0 ± 0.1 | 0.01 (3) |
| F114W/F476W | 2.9 ± 0.3 | 0.283 ± 0.005 | 0.1 (167) | 237.4 ± 11.8 | 3.1 ± 0.08 | 0.01 (3) |
Major metabolite formed is 4′-hydroxywarfarin, not 7-hydroxywarfarin. Metabolite formation appears to demonstrate biphasic kinetics, and the values listed are Km1, kcat1, and kcat1/Km1, respectively.
Bold number in parentheses refers to percent of wild-type kcat/Km
Figure 3.

Regioselectivity of (S)-warfarin hydroxylation by CYP2C9 mutants. (S)-warfarin (0.5 mM) was incubated with CYP2C9 variants as described in the Materials and Methods. All incubations were performed in triplicate, and error bars indicate standard deviation. (A) Variants with major metabolite on the coumarin nucleus. W/W: F114W/F476W. (B) Variants with major metabolite on the C9 phenyl ring. L/L: F114L/F476L.
Regiochemistry of (S)-Warfarin Hydroxylation by CYP2C9 mutants
(S)-warfarin is a useful probe for evaluating the catalytic orientation of CYP2C9 because 7-hydroxwarfarin and 6-hydroxywarfarin are by far the major products, and formed in a fixed ratio of ~3.5:1 (21) (Figure 3A). Of the mutants studied here, only F100L recapitulated the wild-type metabolite profile. In accordance with a previous study using insect cell-expressed enzyme (6), the E. coli-expressed F114L mutant resulted in reduced (S)-warfarin hydroxylase activity and percentage of 7-hydroxywarfarin relative to the other metabolites, and in fact, altered the metabolite profile such that 4′-hydroxywarfarin is the dominant metabolite. A similar metabolite profile was observed for the other two leucine mutants, F476L and the F114L/F476L double mutant. 4′-Hydroxylation was also a more prominent (S)-warfarin metabolite, but formed to a much lesser degree, from the F114W, F476W and F114W/F476W mutants (Figure 3B). Of greater interest was the observation that the two W476-containing mutants formed 7- and 6-hydroxy warfarin in a 7:1 ratio (Figure 3A). These functional data show that mutations at both the F114 and F476 positions alter the catalytic orientation of (S)-warfarin in the CYP2C9 active site.
Steady-State Kinetics of Substrate Metabolism by CYP2C9 Mutants
To better characterize the difference in behavior of the CYP2C9 mutants towards (S)-warfarin and (S)-flurbiprofen, steady-state kinetic experiments were performed to obtain measures of catalytic efficiency (Table 2). kcat/Km values for both substrates confirmed the observations made from single-point estimates provided in Figure 2, and better defined the ‘control’ nature of the F100L mutant (100–133% of wild-type efficiency) and the maintenance of catalytic efficiency towards both substrates for the F114W mutant (83–120% of wild-type activity). The loss of function mutants, F114L and F476L, exhibited deleterious changes in both kcat and Km for each substrate, with the F114L/F476L double mutant demonstrating increased (additive) effects on Km, kcat and catalytic efficiency compared to the separate mutations (Table 2). The gain of function observed for (S)-warfarin metabolism by the F476W mutant could be attributed solely to a 4-fold increase in kcat, whereas this mutant’s loss of activity with (S)-flurbiprofen as substrate was due to a combination of increased Km and reduced kcat. Again, the functional effects observed for the F114W/F476W double mutant were additive relative to the single mutations.
Substrate Binding to CYP2C9 Mutants
Spectral binding behavior of the mutants is summarized in Table 3. While the Type I binding spectrum of (S)-flurbiprofen to CYP2C9 (Figure 4A) has been well documented (22, 23), the characteristics of (S)-warfarin binding to the enzyme has not been reported. Like the NSAIDs, (S)-warfarin is a type I ligand for CYP2C9, exhibiting an absorbance maximum at ~390 nm, and minimum at ~420 nm (Figure 4B). All mutants exhibited saturable binding, and Ks was estimated using the one-site saturation model in SigmaPlot (Table 2). The Scatchard plots (Fig. 4 bottom insets) were linear, indicating that there was no observable secondary binding event. Both substrates bound to wild-type CYP2C9 with Ks values around 5 μM, however, the magnitude of the spectral change (ΔAmax) was substantially greater with (S)-flurbiprofen. Mutant Ks values generally increased for enzyme-ligand pairs that displayed diminished catalytic function, with the greatest impairment of binding evident for F476W mutant and (S)-flurbiprofen. In contrast, no decrease in binding affinity was observed for the interaction between F476W and (S)-warfarin. Catalytic efficiencies of the CYP2C9 variants correlated reasonably well with changes in Ks, for the relatively high turnover substrate, (S)-flurbiprofen (r2 = −0.75), but poorly for (S)-warfarin (r2 = −0.43). Interestingly, binding of low concentrations of (S)-flurbiprofen to F476W exhibited unusual spectral characteristics (data not shown), not observed with any of the other enzymes studied.
Table 3.
Spectral binding parameter estimates for (S)-warfarin and flurbiprofen.
| (S)-warfarin | Flurbiprofen | |||||
|---|---|---|---|---|---|---|
| KsaμM | ΔAmaxa ×10−3 | ΔA/KbμM−1 × 10−3 | KsaμM | ΔAmaxa ×10−3 | ΔA/KbμM−1 × 10−3 | |
| Wild-type | 8.9 ± 0.8 | 5.3 ± 0.1 | 0.6 (100) | 3.4 ± 0.4 | 18 ± 0.5 | 5.3 (100) |
| F100L | 4.2 ± 0.2 | 6.5 ± 0.06 | 1.5 (262) | 2.2 ± 0.2 | 16 ± 0.3 | 7.3 (137) |
| F114L | 12.2 ± 0.3 | 10 ± 0.07 | 0.8 (139) | 4.1 ± 0.6 | 10 ± 0.4 | 2.4 (46) |
| F476L | 16.3 ± 1.0 | 11 ± 0.2 | 0.7 (114) | 9.1 ± 1.0 | 11 ± 0.4 | 1.2 (23) |
| F114W | 3.2 ± 0.3 | 12 ± 0.3 | 3.8 (636) | 4.0 ± 0.2 | 34 ± 0.4 | 8.5 (160) |
| F476W | 7.0 ± 0.4 | 9.3 ± 0.1 | 1.3 (225) | 18.3 ± 1.9 | 4.7 ± 0.1c | 0.3 (5) |
| F114L/F476L | 34.1 ± 2.4 | 15 ± 0.3 | 0.4 (75) | 9.9 ± 1.3 | 4.4 ± 0.2 | 0.4 (8) |
| F114W/F476W | 6.7 ± 0.5 | 12 ± 0.2 | 1.8 (303) | 22.3 ± 4.1 | 7.3 ± 0.4 | 0.3 (6) |
Ks and ΔAmax refer to the dissociation constant and the maximum observed difference (390–420 nm), respectively, as determined by fitting to a one site saturation ligand binding model
Bold number in parentheses refers to percent of wild-type ΔA/K
Low concentrations demonstrated unusual binding properties, therefore Ks was determined from 5–100 μM, which showed typical type I binding spectra
Figure 4.

Binding spectra of (A) (S)-flurbiprofen or (B) (S)-warfarin to wild-type CYP2C9. Top insert: Hyperbolic saturation curve of the observed difference between 390 and 420 nm versus ligand concentration as fitted to the one site saturation model. Bottom insert: Scatchard plot of the saturation curve.
Ligand Distance Estimates from NMR T1 Relaxation Rates
Functional differences in CYP2C9 mutant behavior towards (S)-warfarin and (S)-flurbiprofen were most extreme for the F476W mutant. Therefore, additional studies were performed to examine the basis for increased (S)-warfarin hydroxylation by this mutant. First, NMR was utilized to determine if the Trp mutation repositioned the (S)-warfarin molecule closer to the heme iron. In order for this approach to be valid, ligand protons must be in fast exchange between the bound and unbound forms (17). To test this, 1H-NMR experiments were conducted in the presence and absence of CO/dithionite at 283, 298, and 310 K, and the plots of 1/T1p (equal to 1/T1,2C9 minus 1/T1,2C9+CO) found to have positive slopes, indicating fast exchange conditions (data not shown). For comparison, the wild-type and F476W proteins were studied with both (S)-warfarin and (S)-flurbiprofen. Table 4 shows distance data obtained for (S)-flurbiprofen. Data for the wild-type enzyme were in agreement with values previously reported (14, 23). Distance values for the F476W mutant were not significantly changed relative to the wild-type enzyme, with the possible exception of the methyl group which appeared to have moved closer to the heme iron in the F476W mutant. As was the case for (S)-flurbiprofen, the protons on the two aromatic rings of (S)-warfarin appeared to lie equidistant from the heme iron, the exception being the side-chain methyl of the acetonyl group which was located a further 3Å away (Table 5). In the F476W mutant, the methyl group and phenyl ring protons were shifted ~0.3Å closer, while the coumarin ring protons (H5, H6, H7 and H8) moved 0.4–1.3Å closer to the heme.
Table 4.
T1 relaxation rate-estimated distances of (S)-flurbiprofen protons from the heme irona
 | ||||||
|---|---|---|---|---|---|---|
| WT | F476W | |||||
| Proton resonance | 2C9b | 2C9 + CO | rc | 2C9 | 2C9 + CO | r |
| H2 | 2.44 (0.10) | 2.79 (0.14) | 5.95 (0.11) | 2.56 (0.15) | 2.34 (0.14) | 6.58 (0.28) |
| H5 | 2.17 (0.07) | 2.26 (0.10) | 6.27 (0.16) | 2.11 (0.10) | 2.24 (0.18) | 6.47 (0.24) |
| H6 | 1.79 (0.05) | 2.04 (0.10) | 7.30 (0.19) | 1.78 (0.08) | 1.85 (0.08) | 6.79 (0.22) |
| H2′/6′ | 2.38 (0.07) | 2.77 (0.07) | 6.02 (0.37) | 2.38 (0.06) | 2.54 (0.07) | 7.15 (0.13) |
| H3′/5′ | 2.42 (0.08) | 2.70 (0.11) | 5.82 (0.15) | 2.39 (0.08) | 2.39 (0.16) | 6.49 (0.20) |
| H4′ | 3.44 (0.26) | 4.25 (0.44) | 6.11 (0.19) | 2.88 (0.14) | 2.55 (0.16) | 6.40 (0.32) |
| CH3 | 0.68 (0.01) | 0.68 (0.01) | 7.82 (0.09) | 0.67 (0.01) | 0.65 (0.03) | 5.62 (0.25) |
Errors for measurements or calculations are shown in parentheses.
T1 values are in seconds.
Values are calculated using the equation as described in Materials and Methods and are expressed in angstroms.
Table 5.
T1 relaxation rate-estimated distances of (S)-warfarin protons from the heme irona
 | ||||||
|---|---|---|---|---|---|---|
| WT | F476W | |||||
| Proton resonanceb | 2C9c | 2C9+CO | rd | 2C9 | 2C9+CO | r |
| H5 | 3.07 (0.10) | 3.41 (0.23) | 6.66 (0.25) | 3.30 (0.11) | 3.89 (0.16) | 6.26 (0.18) |
| H6 | 2.36 (0.04) | 2.48 (0.03) | 7.19 (0.08) | 1.93 (0.03) | 2.22 (0.04) | 5.85 (0.07) |
| H7 | 2.02 (0.09) | 2.20 (0.15) | 6.42 (0.26) | 1.90 (0.09) | 2.22 (0.13) | 5.78 (0.22) |
| H8 | 3.52 (0.03) | 4.17 (0.16) | 6.32 (0.11) | 2.82 (0.06) | 3.52 (0.06) | 5.84 (0.22) |
| H2′/6′ | 2.09 (0.03) | 2.29 (0.06) | 6.40 (0.09) | 2.09 (0.04) | 2.34 (0.04) | 6.13 (0.08) |
| H3′/5′ | 2.94 (0.07) | 3.35 (0.10) | 6.39 (0.12) | 2.32 (0.02) | 2.65 (0.03) | 6.10 (0.05) |
| H4′ | 3.52 (0.10) | 4.28 (0.36) | 6.18 (0.26) | 3.46 (0.16) | 4.50 (0.24) | 5.88 (0.22) |
| CH3 | 1.99 (0.06) | 2.00 (0.12) | 9.76 (0.31) | 1.99 (0.05) | 2.00 (0.06) | 9.39 (0.19) |
Errors for measurements or calculations are shown in parentheses. Values reported are combined data from experiments using d5-warfarin (H5, H6, H7, H8) or warfarin (H2′/6′, H3′/5′, H4′, CH3) due to the overlapping peaks around 7.2 ppm.
The resonances for the [-CH2-CH-] protons could not be accurately determined due to interference from residual glycerol.
T1 values are in seconds.
Values are calculated using the equation as described in Materials and Methods and are expressed in angstroms.
Stoichiometry Determinations
The reaction stoichiometry was measured and P450 cycle coupling efficiency evaluated for the wild-type and F476W mutants with both substrates (Table 6). (S)-flurbiprofen 4′-hydroxylation was ~20% coupled to NADPH consumption, with substantial uncoupling to both hydrogen peroxide and excess water, similar to a previous report (22). The F476W mutant (which for flurbiprofen resulted in an increased Ks and Km and decreased kcat) further uncoupled metabolite formation from NADPH consumption and exhibited increased formation of both hydrogen peroxide (minor) and excess water (major). (S)-warfarin hydroxylation by wild-type CYP2C9 was even more uncoupled (~4% coupled to NADPH consumption) than (S)-flurbiprofen metabolism, with the vast majority of reducing equivalents used unproductively in forming excess water. The F476W mutant (which exhibited a gain in function for metabolism of this substrate) improved the low coupling efficiency of NADPH to metabolite formation by ~3-fold, and reduced both hydrogen peroxide and excess water formation by ~25%.
Table 6.
Stoichiometry rates and coupling efficiency for wild-type and F476W proteins with (S)-warfarin and (S)-flurbiprofen.a
| Consumption |
Formation |
||||||||
|---|---|---|---|---|---|---|---|---|---|
| NADPH | O2 | Metaboliteb | H2O2 | Excess H2O | Metabolite/NADPH | H2O2/O2 | H2O/Metabolite | ||
| (S)-flurbiprofen | WT | 38.0 ± 3.9 | 24.1 ± 2.4 | 8.0 ± 0.3 | 10.4 ± 0.4 | 5.7 | 0.21 | 0.43 | 0.7 |
| F476W | 13.0 ± 1.4 | 7.3 ± 0.7 | 0.8 ± 0.008 | 5.2 ± 0.5 | 1.3 | 0.06 | 0.71 | 1.6 | |
| (S)-Warfarin | WT | 8.2 ± 0.3 | 4.9 ± 0.1 | 0.3 ± 0.03 | 3.6 ± 0.06 | 1.0 | 0.04 | 0.73 | 3.3 |
| F476W | 8.0 ± 0.5 | 6.9 ± 0.2 | 0.9 ± 0.01 | 3.6 ± 0.4 | 2.4 | 0.11 | 0.52 | 2.7 | |
Units for rates of consumption and formation are pmol/min/pmol P450. All values are reported after subtraction of control (no ligand) values for each measurement.
Total hydroxywarfarin products or 4′-hydroxyflurbiprofen.
DISCUSSION
Recent advances in protein engineering and the crystallization of membrane proteins have made it possible to obtain moderate-high resolution structural information for numerous human cytochromes P450, including CYP2C9 (3, 4, 24–26). To date, two structures are available for CYP2C9 bound with (S)-warfarin or flurbiprofen. However, they implicate different active site phenylalanine residues in binding of these ligands, and the enzymes used for crystallization differ in the critical F–G loop region. Consequently, the relevance of the (S)-warfarin structure, in particular, to binding and metabolism of this important drug molecule to CYP2C9 in its native state is unclear. Therefore, our main goal was to define the role of the three active site phenylalanine residues (F100, F114 and F476) in ligand binding, orientation and catalysis of (S)-warfarin and (S)-flurbiprofen by using site-directed mutagenesis with alternative amino acids designed to preserve aromaticity and/or steric bulk at each position. Effects of the individual mutations are discussed below.
F100
Binding and metabolism studies show clearly that the F100→L mutation is ‘silent’ with respect to binding and metabolism of (S)-warfarin and (S)-flurbiprofen. This could be expected for flurbiprofen, based on the distant location from F100 in the 1R9O crystal structure, but not necessarily for (S)-warfarin, based on the 1OG5 structure, if the ensemble of aromatic residues visualized therein acted in concert to provide an early docking scaffold for (S)-warfarin. However, the current data provide no support for any critical function of F100 in (S)-warfarin or NSAID turnover, in accord with previous alanine-scanning mutagenesis of the B–C loop region that reported no effect of the F100A mutant on diclofenac metabolism (19). Therefore, no additional mutants at this position were constructed for these studies.
F114/F476 interactions
The F114L/F476L and F114W/F476W double mutants displayed Km, kcat and Ks values that were additive with respect to the same parameters for the component single mutants for both substrates. This is important because it indicates that the amino acids at positions 114 and 476 that were studied here, (i.e. F114, L114, W114, and F476, L476, W476) do not interact with each other, at least with respect to altering ligand binding or metabolism parameters. This removes a potential complication of discussing the effects of single mutations at these two important sites.
F114
Of the mutants studied here, only the F114L mutant has been analyzed previously with (S)-warfarin and flurbiprofen (6, 7). The earlier (S)-warfarin study found that the insect cell-expressed F114L mutant caused a large decrease in catalytic efficiency as a consequence of an increased Km and a reduced kcat, and altered product regioselectivity in the direction of enhanced 4′-hydroxylation on the C9 phenyl ring. These features were recapitulated here for the E. coli-expressed enzyme, demonstrating that mutant catalysis is independent of the N-terminal mutations introduced to facilitate bacterial expression. The F114→L mutation had similarly altered kinetic parameters for (S)-flurbiprofen metabolism; this is in accordance with the previous study that found insect cell-expressed F114L dramatically increased the Km of flurbiprofen turnover (7), and complements a study with the F114I mutant that found the mutation essentially abolished diclofenac and tienilic acid metabolism (20). Importantly, the F114→W mutation substantively restored wild-type kinetic behavior for both ligands, as well as the preference for metabolism on the coumarin ring of (S)-warfarin. These data imply that aromatic interactions between F114 and both (S)-flurbiprofen and (S)-warfarin are critical to the normal catalytic processing of these substrates by CYP2C9, in good agreement with the available crystal structures.
F476
The F476→L mutation decreased the efficiency of (S)-flurbiprofen metabolism by 70%, but rather than being rescued by a tryptophan substitution, the additional steric bulk caused a further diminution of catalytic activity. The F476W mutant also demonstrated substantially reduced binding affinity of (S)-flurbiprofen as indicated by the greatly increased Ks (and Km) values relative to the wild-type and F476L mutant proteins. The F476L mutant was compromised in terms of (S)-warfarin metabolism to an even greater extent than (S)-flurbiprofen and, like F114L, promoted hydroxylation on the phenyl, rather than the coumarin, ring. However, metabolic activity and preferential coumarin ring hydroxylation were more than restored in the F476W mutant, with a 5-fold enhancement in turnover relative to the wild-type enzyme. Therefore, when considered in light of the F114 mutant data, catalytically productive (S)-warfarin binding to CYP2C9 appears to require aromatic groups on both sides of the active site in order for the substrate to be properly aligned for coumarin ring hydroxylation.
Collectively, the spectral binding and metabolism data suggest that F476 interacts differently with (S)-warfarin and (S)-flurbiprofen. Such effects would not necessarily be predicted from the 1R9O structure, where F476 appears to be too remotely located for a direct interaction between substrates and this residue. Possibly the large decrease in (S)-flurbiprofen turnover by the F476W mutant might be due to the Trp residue blocking access of this NSAID to the heme, or possibly interfering with an access channel, which in CYP2C9 is located near β-sheet 4 (5). It was especially interesting that the F476W mutant was a more efficient (S)-warfarin hydroxylase, because P450 mutagenesis generally results in decreased catalytic efficiency. A simple hypothesis is that the F476W mutant positions the coumarin ring closer to the heme, thereby increasing productive interactions with the active oxygen. Consequently, 1H-NMR T1 relaxation and stoichiometry studies were undertaken.
1H-NMR studies of CYP2C9 with (S)-flurbiprofen (14, 15, 23) and diclofenac (17) have been conducted previously, in order to obtain information on ligand distances from the heme. Due to paramagnetism of the iron atom, it is possible to measure proton T1 relaxation rates in the presence of ferric iron, and then compare these values to the proton T1 relaxation rates in the presence of the diamagnetic ferrous iron (reduced by the addition of CO and dithionite), and calculate a radius between the iron and ligand protons (27). As with previous studies (14, 17, 23), the substrates examined here had their substrate protons located essentially equidistant from the heme iron. This distance equitability for (S)-flurbiprofen has been rationalized in terms of two dominant binding modes, wherein either the 2-methyl proton or the 4′-proton approach the heme most closely (14). Substrate “tumbling” of this relatively small, linear molecule within an accommodating active site possibly explains the roughly equal distances found for most substrate protons. For the bulkier (S)-warfarin molecule, 1H-NMR data again indicated roughly equal distances to all ring protons in the wild-type protein (6–7Å), but a more distant location for the acetonyl methyl group (~9Å). If only the faces containing aromatic rings approach the heme, as suggested by the metabolite profile, this may reflect less ability of (S)-warfarin to “tumble” within the active site. All (S)-warfarin protons moved closer to the heme in the F476W mutant, although for several of the sites the standard deviations overlap. Generally, the coumarin ring protons were shifted more than the phenyl ring protons and overall there is qualitative, although not quantitative, agreement with the functional data. These 1H-NMR data provide some support for the concept that the F476W mutation positions (S)-warfarin closer to the perferryl oxygen.
Prior studies have reported correlations between proximity to the heme and metabolic coupling efficiency (14, 22, 28), and therefore stoichiometry studies were performed to determine if F476W-dependent (S)-warfarin metabolism was more highly coupled than the wild-type. This did appear to be the case with F476W and (S)-warfarin, although most of the increase in metabolic efficiency was evident at the level of increased efficiency in coupling of reducing equivalents to product formation, rather than decreased reactive oxygen species formation. This is in contrast to the compromised turnover of F476W with (S)-flurbiprofen, which showed decreased coupling efficiency at all steps of the P450 cycle that were measured here. Therefore, it is possible that the increase in (S)-warfarin product formation for the F476W mutant is due, in part, to a repositioning of the (S)-warfarin molecule within the CYP2C9 active site that facilitates better coupling of reducing equivalents to product formation. The stoichiometry data also speak further to the very low basal efficiency of wild-type CYP2C9 for (S)-warfarin metabolism which, in part, explains the long half-life and low clearance of the drug in vivo. In the area of ‘directed evolution’ it is usually easier to achieve a significant gain of enzyme function when the original base-line activity is low. Within this general framework, the data obtained for F476W with (S)-warfarin, but not the higher activity substrate flurbiprofen, are less surprising.
In summary, the mutagenesis studies demonstrate that aromatic interactions with both F114 and F476, but not F100, are important to the catalytic binding and turnover of flurbiprofen and (S)-warfarin. The similarity in the effects of the F100L, F114L, F114W and F476L mutants on catalytic efficiency towards (S)-warfarin and (S)-flurbiprofen indicate that these two ligands share several of the same binding determinants during catalytic turnover. However, the opposing effects of the F476W mutant on (S)-warfarin and (S)-flurbiprofen turnover suggest that their binding modes are not completely superimposable. These observations provide some structural context for a recent report that (S)-warfarin, flurbiprofen and diclofenac are not interchangeable as probes for CYP2C9 inhibition (29), findings which also infer ligand-dependent active site interactions.
Acknowledgments
The authors thank Drs. William Trager (University of Washington) and Peter Gannett (West Virginia University) for their assistance with the warfarin proton assignments. They would also like to thank Beverly Ostrowski and Andrew Borgert at the University of Minnesota NMR facility for their assistance and patience with the use of the instruments.
ABBREVIATIONS
- CYP
cytochrome P450
- DLPC
dilaurylphosphatidylcholine
- HPLC
high-performance liquid chromatography
- LC-MS
liquid chromatography-mass spectrometry
- NMR
nuclear magnetic resonance
- NSAID
non-steroidal anti-inflammatory drug
Footnotes
This investigation was supported by NIH grants GM32165, GM07750, and GM63215.
References
- 1.Rettie AE, Jones JP. Clinical and toxicological relevance of CYP2C9: drug-drug interactions and pharmacogenetics. Annu Rev Pharmacol Toxicol. 2005;45:477–494. doi: 10.1146/annurev.pharmtox.45.120403.095821. [DOI] [PubMed] [Google Scholar]
- 2.Kirchheiner J, Brockmoller J. Clinical consequences of cytochrome P450 2C9 polymorphisms. Clin Pharmacol Ther. 2005;77:1–16. doi: 10.1016/j.clpt.2004.08.009. [DOI] [PubMed] [Google Scholar]
- 3.Wester MR, Yano JK, Schoch GA, Yang C, Griffin KJ, Stout CD, Johnson EF. The Structure of Human Cytochrome P450 2C9 Complexed with Flurbiprofen at 2.0-Å Resolution. J Biol Chem. 2004;279:35630–35637. doi: 10.1074/jbc.M405427200. [DOI] [PubMed] [Google Scholar]
- 4.Williams PA, Cosme J, Ward A, Angove HC, Matak Vinković D, Jhoti H. Crystal structure of human cytochrome P450 2C9 with bound warfarin. Nature. 2003;424:464–468. doi: 10.1038/nature01862. [DOI] [PubMed] [Google Scholar]
- 5.Johnson EF, Stout CD. Structural diversity of human xenobiotic-metabolizing cytochrome P450 monooxygenases. Biochem Biophys Res Commun. 2005;338:331–336. doi: 10.1016/j.bbrc.2005.08.190. [DOI] [PubMed] [Google Scholar]
- 6.Haining RL, Jones JP, Henne KR, Fisher MB, Koop DR, Trager WF, Rettie AE. Enzymatic determinants of the substrate specificity of CYP2C9: Role of B′-C loop residues in providing the π-stacking anchor site for warfarin binding. Biochemistry. 1999;38:3285–3292. doi: 10.1021/bi982161+. [DOI] [PubMed] [Google Scholar]
- 7.Tracy TS, Hutzler JM, Haining RL, Rettie AE, Hummel MA, Dickmann LJ. Polymorphic variants (CYP2C9*3 and CYP2C9*5) and the F114L active site mutation of CYP2C9: Effect on atypical kinetic metabolism profiles. Drug Metab Dispos. 2002;30:385–390. doi: 10.1124/dmd.30.4.385. [DOI] [PubMed] [Google Scholar]
- 8.Bush ED, Low LK, Trager WF. A sensitive and specific stable isotope assay for warfarin and its metabolites. Biomed Mass Spectrom. 1983;10:395–398. doi: 10.1002/bms.1200100702. [DOI] [PubMed] [Google Scholar]
- 9.Barnes HJ, Arlotto MP, Waterman MR. Expression and enzymatic activity of recombinant cytochrome P450 17α-hydroxylase in Escherichia coli. Proc Natl Acad Sci U S A. 1991;88:5597–5601. doi: 10.1073/pnas.88.13.5597. [DOI] [PMC free article] [PubMed] [Google Scholar]
- 10.Guryev OL, Gilep AA, Usanov SA, Estabrook RW. Interaction of apo-cytochrome b5 with cytochromes P4503A4 and P45017A: Relevance of heme transfer reactions. Biochemistry. 2001;40:5018–5031. doi: 10.1021/bi002305w. [DOI] [PubMed] [Google Scholar]
- 11.Cheesman MJ, Baer BR, Zheng YM, Gillam EMJ, Rettie AE. Rabbit CYP4B1 Engineered for High-Level Expression in Escherichia coli: Ligand Stabilization and Processing of the N-Terminus and Heme Prosthetic Group. Arch Biochem Biophys. 2003;416:17–24. doi: 10.1016/s0003-9861(03)00278-9. [DOI] [PubMed] [Google Scholar]
- 12.Estabrook RW, Werringloer J. The measurement of difference spectra: application to the cytochromes of microsomes. Methods Enzymol. 1978;52:212–220. doi: 10.1016/s0076-6879(78)52024-7. [DOI] [PubMed] [Google Scholar]
- 13.Korzekwa KR, Krishnamachary N, Shou M, Ogai A, Parise RA, Rettie AE, Gonzalez FJ, Tracy TS. Evaluation of atypical cytochrome P450 kinetics with two-substrate models: Evidence that multiple substrates can simultaneously bind to cytochrome P450 active sites. Biochemistry. 1998;37:4137–4147. doi: 10.1021/bi9715627. [DOI] [PubMed] [Google Scholar]
- 14.Hummel MA, Gannett PM, Aguilar JS, Tracy TS. Effector-mediated alteration of substrate orientation in cytochrome P450 2C9. Biochemistry. 2004;43:7207–7214. doi: 10.1021/bi036158o. [DOI] [PubMed] [Google Scholar]
- 15.Hummel MA, Gannett PM, Aguilar J, Tracy TS. Substrate proton to heme distances in CYP2C9 allelic variants and alterations by the heterotropic activator, dapsone. Arch Biochem Biophys. 2008;475:175–183. doi: 10.1016/j.abb.2008.04.034. [DOI] [PMC free article] [PubMed] [Google Scholar]
- 16.Regal KA, Nelson SD. Orientation of caffeine within the active site of human cytochrome P450 1A2 based on NMR longitudinal (T1) relaxation measurements. Arch Biochem Biophys. 2000;384:47–58. doi: 10.1006/abbi.2000.2073. [DOI] [PubMed] [Google Scholar]
- 17.Poli-Scaife S, Attias R, Dansette PM, Mansuy D. The substrate binding site of human liver cytochrome P450 2C9: An NMR study. Biochemistry. 1997;36:12672–12682. doi: 10.1021/bi970527x. [DOI] [PubMed] [Google Scholar]
- 18.Gorsky LD, Koop DR, Coon MJ. On the stoichiometry of the oxidase and monooxygenase reactions catalyzed by liver microsomal cytochrome P-450. Products of oxygen reduction. J Biol Chem. 1984;259:6812–6817. [PubMed] [Google Scholar]
- 19.Ridderström M, Masimirembwa C, Trump-Kallmeyer S, Ahlefelt M, Otter C, Andersson TB. Arginines 97 and 108 in CYP2C9 are important determinants of the catalytic function. Biochem Biophys Res Commun. 2000;270:983–987. doi: 10.1006/bbrc.2000.2538. [DOI] [PubMed] [Google Scholar]
- 20.Melet A, Assrir N, Jean P, Lopez-Garcia MP, Marques-Soares C, Jaouen M, Dansette PM, Sari MA, Mansuy D. Substrate selectivity of human cytochrome P450 2C9: importance of residues 476, 365, and 114 in recognition of diclofenac and sulfaphenazole and in mechanism-based inactivation by tienilic acid. Arch Biochem Biophys. 2003;409:80–91. doi: 10.1016/s0003-9861(02)00548-9. [DOI] [PubMed] [Google Scholar]
- 21.Rettie AE, Korzekwa KR, Kunze KL, Lawrence RF, Eddy AC, Aoyama T, Gelboin HV, Gonzalez FJ, Trager WF. Hydroxylation of warfarin by human cDNA-expressed cytochrome P-450: a role for P-4502C9 in the etiology of (S)-warfarin-drug interactions. Chem Res Toxicol. 1992;5:54–59. doi: 10.1021/tx00025a009. [DOI] [PubMed] [Google Scholar]
- 22.Hutzler JM, Wienkers LC, Wahlstrom JL, Carlson TJ, Tracy TS. Activation of cytochrome P450 2C9-mediated metabolism: mechanistic evidence in support of kinetic observations. Arch Biochem Biophys. 2003;410:16–24. doi: 10.1016/s0003-9861(02)00665-3. [DOI] [PubMed] [Google Scholar]
- 23.Hummel MA, Locuson CW, Gannett PM, Rock DA, Mosher CM, Rettie AE, Tracy TS. CYP2C9 genotype-dependent effects on in vitro drug-drug interactions: switching of benzbromarone effect from inhibition to activation in the CYP2C9.3 variant. Mol Pharmacol. 2005;68:644–651. doi: 10.1124/mol.105.013763. [DOI] [PubMed] [Google Scholar]
- 24.Yano JK, Hsu MH, Griffin KJ, Stout CD, Johnson EF. Structures of human microsomal cytochrome P450 2A6 complexed with coumarin and methoxsalen. Nat Struct Mol Biol. 2005;12:822–823. doi: 10.1038/nsmb971. [DOI] [PubMed] [Google Scholar]
- 25.Rowland P, Blaney FE, Smyth MG, Jones JJ, Leydon VR, Oxbrow AK, Lewis CJ, Tennant MG, Modi S, Eggleston DS, Chenery RJ, Bridges AM. Crystal structure of human cytochrome P450 2D6. J Biol Chem. 2006;281:7614–7622. doi: 10.1074/jbc.M511232200. [DOI] [PubMed] [Google Scholar]
- 26.Schoch GA, Yano JK, Wester MR, Griffin KJ, Stout CD, Johnson EF. Structure of human microsomal cytochrome P450 2C8. Evidence for a peripheral fatty acid binding site. J Biol Chem. 2004;279:9497–9503. doi: 10.1074/jbc.M312516200. [DOI] [PubMed] [Google Scholar]
- 27.Mildvan AS, Gupta RK. Nuclear relaxation measurements of the geometry of enzyme-bound substrates and analogs. Methods Enzymol. 1978;49:322–359. doi: 10.1016/s0076-6879(78)49017-2. [DOI] [PubMed] [Google Scholar]
- 28.Loida PJ, Sligar SG. Molecular recognition in cytochrome P-450: mechanism for the control of uncoupling reactions. Biochemistry. 1993;32:11530–11538. doi: 10.1021/bi00094a009. [DOI] [PubMed] [Google Scholar]
- 29.Kumar V, Wahlstrom JL, Rock DA, Warren CJ, Gorman LA, Tracy TS. CYP2C9 inhibition: impact of probe selection and pharmacogenetics on in vitro inhibition profiles. Drug Metab Dispos. 2006;34:1966–1975. doi: 10.1124/dmd.106.010926. [DOI] [PubMed] [Google Scholar]