

Abstract
Stimulus-triggered averaging (StTA) of electromyographic (EMG) activity is a form of intracortical microstimulation that enables documentation in awake animals of the sign, magnitude, latency, and distribution of output effects from cortical and brainstem areas to motoneurons of different muscles. In this study, we show that the properties of effects in StTAs are stable and mostly independent of task conditions. StTAs of EMG activity from 24 forelimb muscles were collected from two male rhesus monkeys while they performed three tasks: (1) an isometric step tracking wrist task, (2) an isometric whole-arm push–pull task, and (3) a reach-to-grasp task. Layer V sites in primary motor cortex were identified and microstimuli were applied (15 μA) at a low rate (15 Hz). Our results show that the sign of effects (facilitation or suppression) in StTAs of EMG activity are remarkably stable in the presence of joint angle position changes (96% stable), whole-arm posture changes (97% stable), and across fundamentally different types of tasks such as arm push–pull versus reach-to-grasp (81% stable). Furthermore, comparing effects across different phases of a task also yielded remarkable stability (range, 84–96%). At different shoulder, elbow, and wrist angles, the magnitudes of effects in individual muscles were highly correlated. Our results demonstrate that M1 output effects obtained with StTA of EMG activity are highly stable across widely varying joint angles and motor tasks. This study further validates the use of StTA for mapping and other studies of cortical motor output.
Keywords: cortex, microstimulation, EMG, motor, muscle, monkey
Introduction
Stimulus-triggered averaging (StTA) of electromyographic (EMG) activity involves applying microstimuli at a low rate to the brain or spinal cord in the presence of background EMG activity (Cheney and Fetz, 1985; Kasser and Cheney, 1985; Cheney, 2002; Park et al., 2004). Both excitatory and inhibitory events can be detected and rigorously quantified (Kasser and Cheney, 1985). StTA has been widely used to characterize output from primary motor cortex (M1), premotor areas, somatosensory cortex, and various brainstem descending nuclei to muscles of the limbs and to map the distribution of M1 output to forelimb muscles (Cheney and Fetz, 1985; Cheney et al., 1985, 1991; Palmer and Fetz, 1985; Hummelsheim et al., 1986; Widener and Cheney, 1997; Baker and Lemon, 1998; Belhaj-Saïf et al., 1998; Perlmutter et al., 1998; Schieber, 2001; Davidson and Buford, 2004, 2006; Graziano et al., 2004; Park et al., 2001, 2004; Bretzner and Drew, 2005a,b; Boudrias et al., 2006, 2007; Davidson et al., 2007a; Moritz et al., 2007). These studies have revealed important new features of motor cortex functional organization.
Because StTA is being widely applied to identify and map the output from various motor areas to motoneurons of different muscles in awake monkeys, the question of stability of poststimulus effects becomes important. Finding that effects change substantially with changing task conditions would call into question the reliability of results obtained in numerous previous studies using StTA to map and quantify cortical output. Graziano et al. (2004) reported that the magnitude of facilitation in StTAs of EMG activity varied systematically as a function of elbow joint angle. Recording EMGs from triceps and biceps of the elbow, they found that the output from a cortical site obtained with StTA or with long trains of high-frequency stimulation could switch from activating predominately or only the triceps to activating predominately or only the biceps as the elbow joint was moved from a flexed position to an extended position. Additionally, some effects in StTAs switched from facilitation to suppression depending on joint angle. Based on this finding, an interesting hypothesis was proposed in which proprioceptive input might form the basis for a rapid cortical remapping process that would explain how the same cortical site could activate flexors or extensors depending on the starting position of the joint. However, their data were obtained in ketamine-anesthetized monkeys in which proprioceptive feedback, either at the spinal or cortical level, might play a more dominant role in modulating cortical output than in an awake monkey performing an active movement task.
Therefore, the primary goal of this study was to determine whether the robust joint position dependence of cortical output demonstrated by Graziano et al. (2004) in anesthetized monkeys is also present in awake monkeys performing voluntary movements. To answer this question, we applied microstimuli to sites in M1 cortex and collected StTA of EMG activity in monkeys performing a variety of active movement tasks. Our results show that output effects in StTAs from M1 cortex are remarkably stable under a wide variety of task conditions.
Materials and Methods
Behavioral tasks.
Data were collected from two male rhesus monkeys (Macaca mulatta; ∼10 kg; 9 years of age) trained to perform three tasks: (1) an isometric step tracking wrist task with up to three different fixed wrist positions (see Fig. 1A), (2) an isometric whole-arm push–pull task with up to nine different shoulder and elbow positions (see Fig. 1B), and (3) a reach-to-grasp task (see Fig. 1C). During each data collection session, the monkey was seated in a custom-built primate chair inside a sound-attenuating chamber. The left forearm was restrained during task performance. All tasks were performed with the right arm.
Figure 1.

Illustrations depicting the three tasks used for this analysis. A, Isometric wrist task. B, Isometric push–pull task. The lettered circles depict the push–pull handle positions listed in Table 1. The second two illustrations depict how the joint angles were measured for the vertical shoulder angle (SHv), vertical elbow angle (Ev), horizontal shoulder angle (SHh), and horizontal elbow angle (Eh). C, Reach-to-grasp task.
For the isometric wrist task (see Fig. 1A), the monkey's lower and upper arm was restrained. The hand, with digits extended, was placed in a padded manipulandum that rotated about the wrist. The wrist was aligned with the axis of rotation of the torque wheel to which the manipulandum was attached. The manipulandum was locked in place at three different wrist positions including 30° in flexion, 30° in extension, and 0° (wrist and digits aligned with the forearm). The monkey was required to generate ramp and hold trajectories of wrist torque alternately between flexion and extension target zones. The inner and outer boundaries of the torque window were 0.025 and 0.05 N · m, respectively, for flexion, and 0.008 and 0.025 N · m, respectively, for extension. Delivery of an applesauce reward was contingent on the monkey holding within each zone for 1 s.
For the isometric whole-arm push–pull task (see Fig. 1B), the monkeys were required to grip a handle fixed to a force transducer (Grass Medical Instruments) on a linear XYZ positioning system. The handle was locked into place at up to nine different positions within the monkey's work space (see Fig. 1Ba). Each axis had a calibrated scale that ensured accurate replication of handle positions between recording sessions. Monkeys were required to generate ramp and hold trajectories of torque alternately between push (extension force) and pull (flexion force) target zones. The inner and outer boundaries of the torque window were 1 and 2 N, respectively. Delivery of an applesauce reward was contingent on the monkey holding within each zone for 1 s. Shoulder and elbow angles for each handle position are listed in Table 1. Joint angles were measured using photographs of the monkey's arm at each of the handle positions. Digital images were processed in ImageJ using the shoulder, rib cage, elbow, and wrist joints as base points on the body. Final angle measurements are an average from several sessions. Figure 1B illustrates how the shoulder and elbow measurements were made in both the vertical (b) and horizontal (c) plane.
Table 1.
Joint angles achieved in the isometric push–pull task
| Push–pull handle position | Joint | Angle |
|---|---|---|
| A | Shoulder | 50° Horizontal plane |
| 115° Vertical plane | ||
| Elbow | 105° Horizontal plane | |
| B | Shoulder | 50° Horizontal plane |
| 125° Vertical plane | ||
| Elbow | 115° Horizontal plane | |
| C | Shoulder | 90° Horizontal plane |
| 125° Vertical plane | ||
| Elbow | 120° Horizontal plane | |
| D | Shoulder | 110° Horizontal plane |
| 125° Vertical plane | ||
| Elbow | 135° Vertical plane | |
| E | Shoulder | 110° Horizontal plane |
| 115° Vertical plane | ||
| Elbow | 120° Vertical plane | |
| F | Shoulder | 90° Horizontal plane |
| 115° Vertical plane | ||
| Elbow | 120° Vertical plane | |
| G | Shoulder | 110° Horizontal plane |
| 160° Vertical plane | ||
| Elbow | 70° Vertical plane | |
| H | Shoulder | 50° Horizontal plane |
| 140° Vertical plane | ||
| Elbow | 65° Vertical plane | |
| I | Shoulder | 50° Horizontal plane |
| 120° Vertical plane | ||
| Elbow | 70° Vertical plane |
Angles were estimated to the nearest 5°. See Figure 1 for identification of handle positions.
Each monkey was also trained to perform a reach-to-grasp task (see Fig. 1C) as described previously (Belhaj-Saïf et al., 1998; McKiernan et al., 1998). The task was initiated when the monkey placed its right hand, palm down, on a pressure detecting plate (home plate). The home plate was located at waist level in front and to the right of the monkey. Holding the plate down for a preprogrammed length of time (2–3 s) triggered the release of a food reward into a cylindrical well at arms length from the monkey. The monkey then grasped and brought the food reward to its mouth. The task was completed by returning the hand to the pressure plate.
Surgical procedures.
After training, a 30 mm inside diameter titanium chamber was stereotaxically centered over the forelimb area of M1 on the left hemisphere of each monkey and anchored to the skull with 12 titanium screws (Stryker Leibinger) and dental acrylic (Lux-it). Threaded titanium nuts (Titanium Unlimited) were also attached over the occipital aspect of the skull using 12 additional titanium screws and dental acrylic. These nuts provided a point of attachment for a flexible head restraint system during data collection sessions. The chambers were centered at anterior, 16 mm, and lateral, 18 mm (monkey V), and anterior, 16 mm, and lateral, 22 mm (monkey A), at a 30° angle to the midsagittal plane.
EMG activity was recorded from 24 muscles of the contralateral forelimb with pairs of insulated, multistranded stainless-steel wires (Cooner Wire) implanted during an aseptic surgical procedure (Park et al., 2000). Pairs of wires for each muscle were tunneled subcutaneously from an opening above the elbow to their target muscles. The wires of each pair were bared of insulation for ∼2–3 mm at the tip and inserted into the muscle belly with a separation of ∼5 mm. Implant locations were confirmed by stimulation through the wire pair and observation of appropriate muscle twitches. EMG connector terminals (ITT Cannon) were affixed to the upper arm using medical adhesive tape. After surgery, the monkeys wore Kevlar jackets (Lomir Biomedical) reinforced with fine stainless-steel mesh (Sperian Protection Americas) to protect the implants. EMG activity was recorded from five shoulder muscles: pectoralis major (PEC), anterior deltoid (ADE), posterior deltoid (PDE), teres major (TMAJ), and latissimus dorsi (LAT); seven elbow muscles: biceps short head (BIS), biceps long head (BIL), brachialis (BRA), brachioradialis (BR), triceps long head (TLON), triceps lateral head (TLAT), and dorso-epitrochlearis (DE); five wrist muscles: extensor carpi radialis (ECR), extensor carpi ulnaris (ECU), flexor carpi radialis (FCR), flexor carpi ulnaris (FCU), and palmaris longus (PL); five digit muscles: extensor digitorum communis (EDC), extensor digitorum 2 and 3 (ED2,3), extensor digitorum 4 and 5 (ED4,5), flexor digitorum superficialis (FDS), and flexor digitorum profundus (FDP); and two intrinsic hand muscles: abductor pollicis brevis (APB) and first dorsal interosseus (FDI).
All surgeries were performed under deep general anesthesia and aseptic conditions. Postoperatively, monkeys were given an analgesic (buprenorphine; 0.5 mg/kg every 12 h for 3–4 d) and antibiotics (penicillin G, benzathaine/procaine combination; 40,000 IU/kg every 3 d). All procedures were in accordance with the Association for Assessment and Accreditation of Laboratory Animal Care and the Guide for the Care and Use of Laboratory Animals, published by the U.S. Department of Health and Human Services and the National Institutes of Health.
Data collection.
Sites in M1 were stimulated using glass and mylar insulated platinum–iridium electrodes with impedances ranging from 0.5 to 1.5 MΩ (Frederick Haer). The electrode was positioned within the chamber using an X–Y coordinate manipulator and was advanced at approximately a right angle into the cortex with a manual hydraulic microdrive (Frederick Haer). Rigid support for the electrode was provided by a 22 gauge cannula (Small Parts) inside of a 25-mm-long, 3-mm-diameter stainless-steel post, which served to guide the electrode to the surface of the dura.
StTA of EMG activity was used to map the cortical representation of 24 simultaneously recorded forelimb muscles. While the monkeys performed the isometric wrist task and the reach-to-grasp task, stimuli (15 μA at 15 Hz) were applied through the electrode and served as triggers for computing StTAs (Park et al., 2001). StTA and spike-triggered averaging (SpTA) are similar procedures in that averages of EMG activity are constructed using similar parameters. In the case of SpTA, action potentials of a single neuron are used as triggers, whereas with StTA microstimuli delivered at a low frequency are used as the triggers. Postspike effects in averages of EMG activity reflect the underlying EPSPs and IPSPs produced in motoneurons by single premotoneuronal cells (e.g., cortical, rubral, reticular neurons). Accordingly, these effects reveal the most elemental unit of motor output organization, namely, that of a single neuron. In contrast, poststimulus effects in averages of EMG activity reflect the summed EPSPs and IPSPs of all the neurons activated by the stimulus.
Electrode track penetrations were made systematically in precentral cortex at 1 mm grid intervals. In tracks down the bank of the precentral gyrus, StTAs were collected at 0.5 mm intervals. First cortical unit activity was noted and the electrode was lowered 1.5 mm below this point to layer V. To distinguish layer V from more superficial layers, particularly in the bank of the precentral gyrus, neuronal activity was evaluated for the presence of large action potentials that were often modulated with the task and StTAs for robust effects at 15 μA. Because our magnetic resonance imaging (MRI) data were collected in register with the cortical chamber coordinates, images of sections taken at particular electrode positions were also helpful in localizing electrode tracks relative to cortical anatomy.
If no poststimulus effects (PStEs) were detected at 15 μA, averages were computed at 30 μA. These sites were not included in the unfolded muscle maps because they generally were from electrode positions located outside (dorsal and ventral premotor cortex) the M1 forelimb region. When no PStEs were detected at 30 μA, repetitive intracortical microstimulation (ICMS) was applied to determine whether a motor output representation could be identified for that site. Repetitive ICMS allowed the identification of M1 regions representing muscles not implanted with EMG electrodes (face and trunk). Repetitive ICMS consisted of a train of 10 symmetrical biphasic stimulus pulses of 30 μA at 330 Hz (Asanuma and Rosén, 1972). White matter was identified by a sharp decrease or loss of unit activity and in some cases by the presence of small, short-duration, positive–negative spikes typical of fibers. Sensory cortex was identified by the presence of distinctive spike activity and characteristic receptive fields (Widener and Cheney, 1997).
Because it is known that an electrode penetration through the dura mater will cause dimpling of the cortical surface and potential hysteresis on reversal of electrode direction, steps were taken to ensure the electrode was not “drifting” from the original site of StTA collection. To ensure that electrode position remained stable in the cortex between changes in task position and for the collection of multiple averages, the first task position was typically repeated at the end of each set of StTAs. For example, if the first set of StTAs was collected with the wrist at 30° of flexion, the second at 30° of extension, and the third at 0°, a fourth set would be collected by repeating the 30° flexion position. The first and the last set of averages (both collected with the wrist at 30° of flexion) were compared and expected to match for the series of StTAs to be considered valid. No cortical sites had to be eliminated based on this criterion. When possible, electrode drift was also monitored by tracking a task-related neuron near the electrode. If a task-related neuron was present at the site of stimulation, it was monitored between task position changes and used to ensure a constant electrode position.
Individual stimuli were symmetrical biphasic pulses: a 0.2 ms negative pulse followed by a 0.2 ms positive pulse. EMG activity was generally filtered from 30 Hz to 1 kHz, digitized at a rate of 4 kHz and full-wave rectified. Averages were compiled over a 60 ms epoch, including 20 ms before the trigger to 40 ms after the trigger. Stimuli were applied throughout all phases of the tasks and were used to construct stimulus-triggered averages of EMG activity. EMG segments associated with each stimulus were accepted as valid only if the mean of all EMG data points over the entire 60 ms epoch was ≥5% of full-scale signal input. This criterion prevented averaging segments in which EMG activity might be absent. Because the method detects changes in the firing probability of motor units, EMG segments lacking activity are invalid (McKiernan et al., 1998). Applying this criterion yielded different numbers of trigger events for different muscles. Because stimulus-triggered averaging is based on enhancement of subthreshold synaptic events, averages with an insufficient number of trigger events will be an inadequate test of the presence of an effect. Although it is difficult to determine what the minimum number of trigger events should be, based on previous work (Park et al., 2001), we excluded StTAs with <500 trigger events. The number of muscles that then formed the basis of evaluating changes in output effects with task conditions was equal to the number of recorded muscles (24), minus the number of muscles that did not meet the 500 trigger event criterion, multiplied by the number of cortical sites tested.
EMG recordings were tested for cross talk by computing EMG-triggered averages (Cheney and Fetz, 1980). This procedure involved using the EMG peaks from one muscle as triggers for compiling averages of rectified EMG activity from that muscle and all other muscles. Most muscles showed no evidence of cross-talk. However, in muscles that did have cross-talk peaks, we still accepted the effect as valid if the ratio of poststimulus facilitation (PStF) between the test and trigger muscles exceeded the ratio of their cross-talk peaks by a factor of 2 or more (Buys et al., 1986). Based on this criterion, none of the effects obtained in this study needed to be eliminated.
Data analysis.
At each stimulation site, averages were obtained for all 24 muscles. All StTAs with a minimum of 500 triggers were evaluated for PStEs. The range of trigger events was 500–2200. PStF and poststimulus suppression (PStS) effects were computer-measured as described in detail by Mewes and Cheney (1991, 1994). Nonstationary, ramping baseline activity was subtracted from StTAs using custom analysis software (Windows Averager software; Larry Shupe, University of Washington, Seattle, WA). Mean baseline activity and the SD of baseline EMG activity was measured from the pretrigger period typically consisting of the first 12.5 ms of each average. StTAs were considered to have a significant poststimulus effect (PStF or PStS) if the points of the record crossed a level equivalent to 2 SD of the mean of the baseline EMG for a period ≥0.75 ms (3 points) or more (Park et al., 2001). Note that an effect with a width of 0.75 ms at the peak would typically have a much longer duration at the baseline in the range of 3–4 ms. The magnitude of PStF and PStS was expressed as the percentage increase (+ppi) or decrease (−ppi) in EMG activity above (PStF) or below (PStS) baseline EMG activity (Cheney and Fetz, 1985; Kasser and Cheney, 1985; Cheney et al., 1991).
Response averages.
Response averages consisting of EMG activity for each of 24 implanted forelimb muscles and the task signal, either the torque record (isometric tasks) or the home plate signal and food well signal (reach-to-grasp task), were aligned to segments of the task: flexion and extension or exiting the target food well. Response averages were based on 40–50 trials and were 2 s in duration. EMG activity was rectified and low-pass filtered. The sampling rate was 4 kHz.
Imaging.
Structural MRIs were obtained from a 3 tesla Siemens Allegra system. Images were obtained with the monkey's head mounted in an MRI-compatible stereotaxic apparatus so the orientation and location of the cortical recording chamber and electrode track penetrations could be determined. A three-dimensional rendering of each monkey's brain (see Fig. 2A,B) was obtained using CARET software (Computerized Anatomical Reconstruction and Editing Tool Kit) and surface visualization (Van Essen et al., 2001). A two-dimensional rendering of cortical layer V was constructed for each monkey. The method for flattening and unfolding cortical layer V in the anterior bank of the central sulcus has been previously described in detail (Park et al., 2001). Briefly, the cortex was unfolded and the location of StTAs were mapped onto a two dimensional cortical sheet based on the depth of the electrode and X–Y coordinate, known architectural landmarks, MRI images, and observations noted during the cortical implant surgeries.
Figure 2.

A, B, Three-dimensional reconstructions of the left hemispheres of monkeys V and A, respectively, based on MRI analysis. The circles represent the area under the cortical recording chambers. An enlarged view shows the central sulcus (CS), arcuate sulcus (AS), and the precentral dimple (PcD). C, D, Muscle maps of M1 for monkeys V and A, respectively, represented in two-dimensional coordinates after unfolding the precentral gyrus. The black dots represent the location of stimulation sites in layer V based on chamber coordinates in register with MRIs of each monkey's brain.
Statistical data analysis.
Effects of joint position changes within tasks and changes between tasks were compared using the Student's t test, the Mann–Whitney rank sum test, Pearson's correlation, and linear regression. In all tests, statistical significance was based on a value of p ≤ 0.05.
Results
Data were obtained from the left M1 cortex in two rhesus monkeys. StTAs (15 μA at 15 Hz) were collected at a total of 253 M1 layer V sites while the monkeys performed one or more of the three tasks (Fig. 1). This included 132 sites in monkey V and 121 sites in monkey A. Figure 2 illustrates the three-dimensional reconstruction of each monkey's left hemisphere with placement of the cortical recording chamber marked as well as an enlarged view of the M1 forelimb region (Fig. 2A,B). Figure 2, C and D, shows unfolded maps of the precentral cortex. The grid of black dots indicates cortical stimulation sites in layer V, which were collected while the monkeys performed the reach-to-grasp task. These sites were used in combination with effects elicited while the monkeys performed the isometric wrist task to map the intraareal muscle representation of forelimb M1. Layer V sites showing PStEs in only the distal muscles are color coded in blue (distal-only muscle representation), sites showing PStEs in both proximal and distal muscles are color coded in purple (proximal–distal representation), and sites showing PStEs in only the proximal muscles are color coded in red (proximal-only muscle representation).
The maps confirm the intraareal organization of the proximal and distal muscle representation described by Park et al. (2001). These maps also allowed the selection of specific sites for additional testing in this study. Sites located in the distal-only muscle representation and sites in the proximal–distal representation were tested for stability of PStEs using the isometric wrist task (Fig. 3A,B, white dots). Sites located in the proximal-only representation and sites in the proximal–distal muscle representation were used to test the stability of PStEs using the isometric push–pull task (Fig. 3B, pink dots) and the reach-to-grasp task (Fig. 3B, pink dots with black centers).
Figure 3.
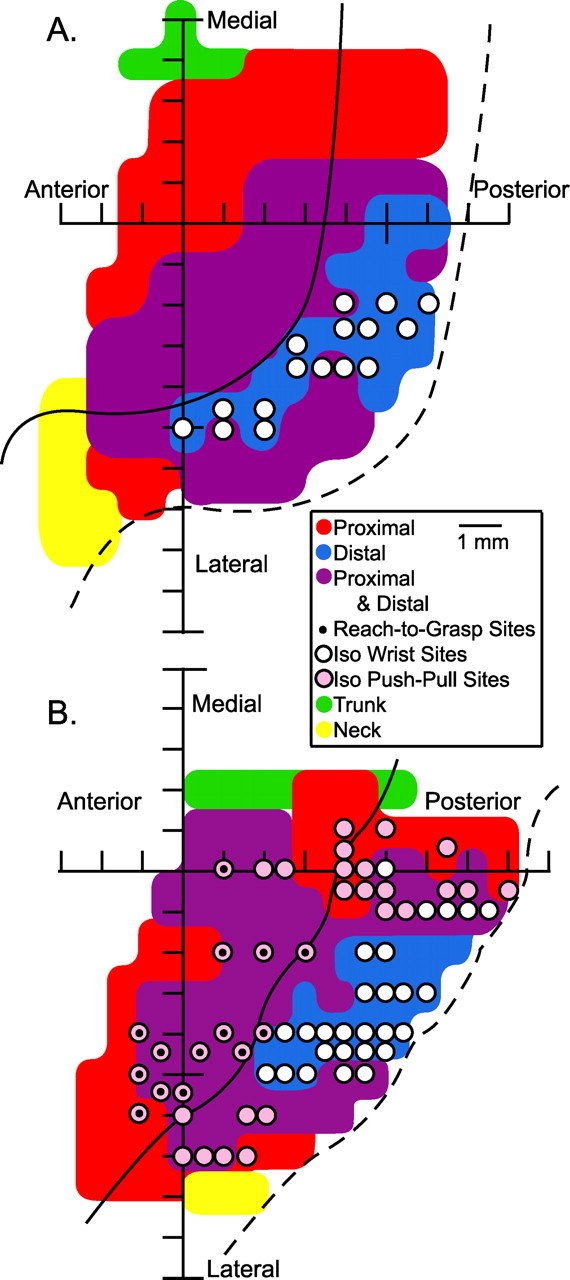
A, B, Sites used to test the stability of effects in StTAs of EMG activity at different postures for the isometric wrist task (white dots) and (B) the isometric push–pull task (pink dots). B, Sites used to test the stability of effects in StTA of EMG activity across the push–pull and reach-to-grasp task are represented by pink dots with black dot insets. Sites are represented in two-dimensional coordinates after unfolding the precentral gyrus and are overlaid on the monkey's respective muscle map.
Stability of PStE sign and magnitude across different wrist positions
Wrist angle changes are most likely to have an influence on the synaptic efficacy of M1 projections to the motoneuron pools of the distal muscles. We therefore chose to focus on the distal-only muscle representation to test the stability of StTAs across wrist angles, although some sites in the proximal–distal representation were also tested using the isometric wrist task. Low-intensity StTAs (15 μA) were collected at 43 sites, in the distal-only and proximal–distal representations of M1, and were evaluated for stability at different wrist positions while the monkeys performed the isometric wrist task. StTAs were collected at two different wrist positions (30° in flexion, 30° in extension) for all 43 layer V sites. The patterns of EMG activity for all the recorded muscles at the 30° flexion and 30° extension positions are illustrated in Figure 4, A and B. In addition to strong modulation of distal muscle activity, the elbow and shoulder muscles also showed significant modulation. Proximal muscle activation is consistent with our observation that this monkey involved the whole arm in performing the isometric wrist task. Modulation followed a simple reciprocal pattern for most muscles. At different wrist positions, the pattern of EMG activity for a particular muscle remained relatively constant; what varied modestly was the level of EMG activation.
Figure 4.
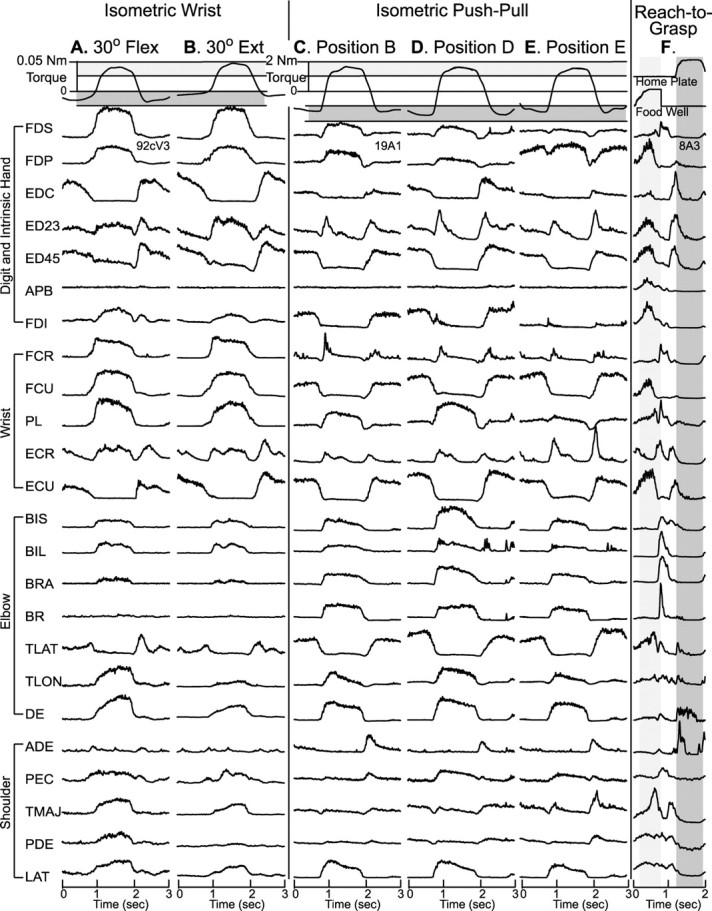
A–F, Response averages for all 24 muscles for the isometric wrist task (A, B), the push–pull task (C–E), and the reach-to-grasp task (F). Response averages for the reach-to-grasp task were aligned with exiting the target food well. For the wrist and push–pull tasks, response averages aligned with both flexion and extension were collected and spliced together. Averages from the same muscle within a task are displayed at the same gain. Response averages were based on 40–50 trials. Light shaded zone in A, B is flexion; light shaded zone in C–E is pull.
We quantified the stability of StTAs by comparing the sign of effect (facilitation and suppression) across the two wrist positions. If the sign of the effect was the same for both wrist positions, it was categorized as a stable effect. Effects were considered unstable if PStF became PStS, or vice versa, or if there was no effect under one of the task conditions. A total of 897 muscles met the criterion of 500 or more trigger events and were evaluated. Four hundred fifty-one muscles had no poststimulus effect in either wrist position and were eliminated from calculations of stability. Table 2, row 2, summarizes these results. Stable effects were present in 96% (428 of 446) of StTAs.
Table 2.
Stability of poststimulus effects across different task conditions (15 μA)
| Task | Stablea/total | Stablea/total(specific muscle groups) |
|---|---|---|
| Isometric wrist | 428/446 (96%) | Distal muscles onlyb: 356/370 (96%) |
| Isometric push–pull | 270/279 (97%) | Proximal muscles only: 143/150 (95%) |
| Isometric push–pull vs reach-to-grasp | 96/118 (81%) | N.A. |
N.A., Not applicable.
a Same qualitative effect (PStF or PStS).
b Excluding intrinsic hand muscles.
Figure 5 illustrates an example of a typical layer V site showing highly stable effects in StTAs for all recorded muscles at the two wrist positions. The left (30° flexion) and right (30° extension) panels in this figure show averages arranged in a mirror image pattern. PStF effects are color coded red, PStS are blue, and no effect is black. All 11 PStEs (11 of 11; 100%) matched across the two wrist positions. Seventy-four percent of the 43 sites tested yielded 100% PStE stability in sign across the two wrist positions. Even at the site with the greatest instability, 77% (10 of 13) of the effects matched. At this site, 22 muscles were evaluated (APB and TLAT were not evaluated because of trigger numbers <500), nine muscles had no effect at either wrist position, and in three muscles the effect changed. FDI and BIL showed PStF, and FDP showed PStS when the monkey performed the task with the wrist flexed 30°, but no effect was present in FDI or BIL and FDP was facilitated with the wrist at 30° in extension.
Figure 5.

A typical layer V site with stable effects in all muscles at both the flexion 30° and extension 30° wrist positions of the isometric wrist task. PStF effects were present in both proximal (BIL) and distal (ED23) forelimb muscles (proximal–distal site). PStS effects were present in distal (FDI, FDS, FDP, EDC, ED45, FCR, FCU, PL, ECU) forelimb muscles. Stimulus intensity was 15 μA. StTAs are based on 500–2200 trigger events.
All 43 sites tested with the isometric wrist task exhibited PStF in the distal muscles. Sites in the proximal–distal representation also showed PStF in proximal muscles. Twenty-two sites exhibited PStS in the distal muscles. We initially analyzed all muscles because it has been reported that changes in position at one joint can affect responses in muscles at other joints (Ginanneschi et al., 2005). However, because the proximal muscles would have shown no or minimal length change (shoulder and elbow joints were restrained) during the isometric wrist task, we also reanalyzed these 43 sites using only forearm muscles (FDS, FDP, FCR, FCU, PL, EDC, ED2,3, ED4,5, ECR, and ECU). Limiting the analysis to forearm muscles alone still yielded high levels of stability. Combining data from all sites, 430 muscles met the N ≥ 500 criterion but 60 muscles had no effect at either wrist position and were eliminated from the calculation. Ninety-six percent of the remaining 370 PStF and PStS effects remained stable across wrist positions (Table 2, column 3).
At 13 of the 43 sites tested, StTAs were also collected at a wrist position of 0°. For sites at which StTAs were collected with the wrist in all three positions, the 0° position was evaluated to ensure that StTAs at a neutral position of the wrist were not different from the two more extreme positions. There were no cases in which a PStE at the 0° wrist position did not match one of the other two wrist positions.
Effects also remained stable at higher stimulus intensities. At 19 sites, StTAs were collected at a range of stimulus intensities including 30, 60, and 120 μA. Stable effects were present (PStF or PStS) for 93% (179 of 192) of StTAs collected at 30 μA, 95% (220 of 231) of StTAs collected at 60 μA, and 94% (228 of 242) of StTAs collected at 120 μA.
The analysis thus far has focused on stability in terms of the sign of effects (facilitation or suppression). Another aspect of stability concerns the magnitude of effects. To assess magnitude stability, we compared the magnitude, measured as peak-percentage increase from baseline (ppi), of each PStF and PStS effect obtained with the wrist at the 30° flexion to the corresponding magnitude obtained with the wrist at 30° extension. For this comparison, we used only forearm muscle effects that were present at both wrist positions (356 effects). If the magnitudes were identical at both wrist positions, plotting magnitude at wrist flexion against the magnitude at wrist extension should yield a correlation coefficient of 1 and a regression line with a slope of 1. Figure 6A shows the scatterplot generated from the magnitudes of forearm muscle StTAs at the two wrist positions obtained from 43 cortical sites. The magnitude of effects in forearm muscles at the two wrist positions were highly correlated (r = 0.87; p < 0.001). The black line represents the linear regression of the points, and the gray line is the unity regression line (slope of 1). The regression slope was close to 1 (slope, 1.04). The wrist flexor effects are color coded dark gray, and the extensors are light gray. Plotting the flexor and extensor muscles separately yields a stronger correlation for flexor muscles (r = 0.92; p < 0.001) than extensor muscles (r = 0.83; p < 0.001). The regression line slopes in both cases were very close to 1 (flexors: slope, 0.93; extensors: slope, 1.04). Also, both PStF and PStS effects fell close to the unity line.
Figure 6.
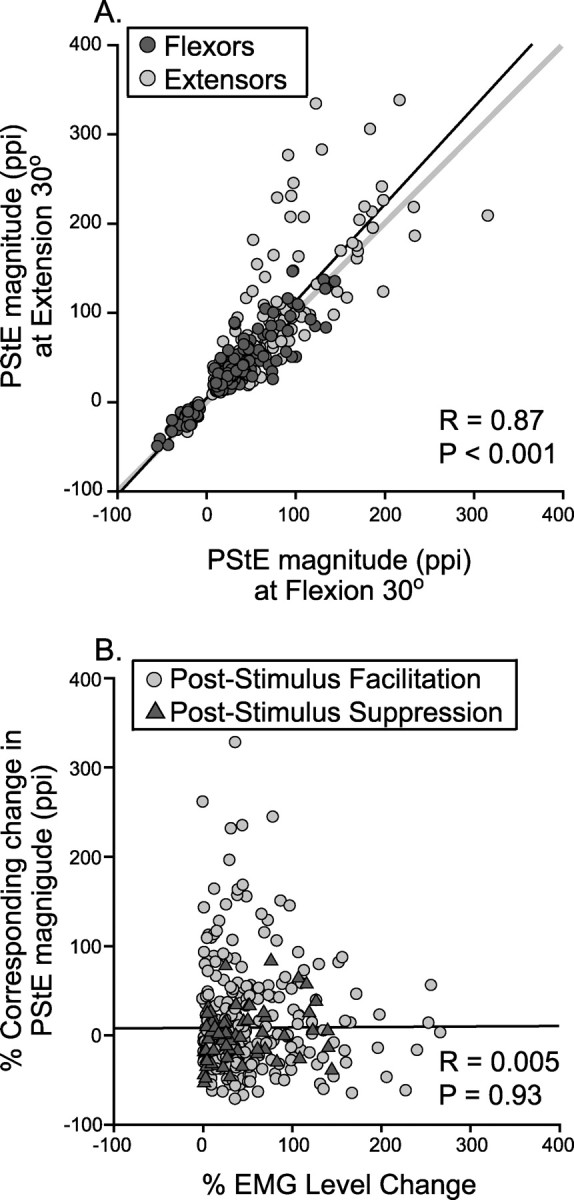
A, Relationship between the magnitudes of PStEs (ppi) at the two most extreme wrist positions. Only PStF (positive ppi) and PStS (negative ppi) effects that were stable across the two wrist positions are included. The dark gray dots represent forearm flexors, and the light gray dots represent forearm extensors. The gray line represents a line with slope of 1. B, Role of baseline EMG changes. Relationship between the EMG level change (from low-level EMG to high-level EMG expressed as a percentage) and the corresponding change in magnitude of PStE (expressed as a percentage) measured in the two most extreme wrist positions. The light gray dots represent PStF, and the dark gray triangles represent PStS. The line starting near zero is the linear regression line.
Role of changes in background EMG level
Although the magnitude of effects obtained at 30° flexion and 30° extension were highly correlated, individual cortical site–muscle combinations could show substantial deviations from unity (Fig. 6A). This was especially true of extensor muscles that tended to show higher magnitudes in the wrist extended position than the flexed position. This raises the question of whether changes in the magnitude of PStEs could be related to changes in the level of EMG activation at the two joint positions. In fact, forearm muscle EMG activation levels were significantly different at the two wrist positions (p < 0.05, Mann–Whitney) and changed in a way that was consistent with the length–tension properties of the muscles. For example, the flexors showed significantly higher levels of EMG activity when they were shorter (30° flexion wrist position) compared with when they were longer (30° extension wrist position). Similarly, the extensors showed significantly higher levels of EMG activity at 30° extension compared with the 30° flexion wrist position. However, changes in EMG activation level showed no consistent relationship to the observed changes in magnitude of PStEs. In Figure 6B, the percentage change in EMG level of forearm muscles, going from the position with the low EMG to the position with the higher EMG, was plotted against the corresponding change in the magnitude of PStF and PStS. Overall, changes in the strength of PStEs measured as ppi were unrelated to changes in the level of EMG activity. Increases in EMG level could be associated with substantial increases in PStE magnitude, decreases in magnitude, or no change in magnitude. However, if PStF magnitude is measured in absolute terms as the peak increase over baseline, then a relationship with EMG level does exist (r = 0.57; p < 0.001). Computing magnitude as ppi involves dividing by baseline EMG level, which essentially normalizes for the level of EMG activity. Bennett and Lemon (1994) reported similar results for the dependence of postspike facilitation magnitude on background EMG level. Because the objective of our study was to detect changes in the magnitude of PStEs dependent on joint position or limb posture, if they exist, we wanted to exclude changes that might simply be related to changes in background EMG level. Quantifying the magnitude of PStEs as a percentage change relative to baseline (ppi) achieves this.
Unstable effects
Eighteen PStEs were classified as unstable based on the fact that the sign of the effect (PStF or PStS) changed between the two wrist positions. Eight were cases in which the effects switched between facilitation and suppression, and 10 were cases in which effects were present at one wrist position and absent at another. Fifty percent of unstable effects were observed in the forearm flexors and the other 50% were divided between the intrinsic hand muscles (5%), forearm extensors (22.5%), and proximal muscles (22.5%). Figure 7 shows the PStEs for each of these 18 cases, categorized by type and the changes in EMG activation level for each pair. Eight were cases in which a PStF effect was present in one wrist position (either 30° flexion or 30° extension) and a PStS was present at the other wrist position. Interestingly, most of these (five of eight) involved the same muscle (FDP). Also, in some cases, the effect was biphasic and the facilitation component was lost. Seven were cases in which a PStF effect was present in one position and no effect was present at the other wrist position. What might underlie these qualitative changes in output effects? First, it is important to note that all unstable effects had weak magnitudes [based on criteria described by Park et al. (2004)]. Weak effects might be more unstable because cortical neurons producing these effects are on the fringe of the activation sphere associated with the stimulus making them more vulnerable to biasing synaptic inputs. Do changes observed in unstable effects correlate with either change in EMG activation level or direction of wrist position changes? Figure 7 shows that the EMG activation level differences between the two wrist positions did not show a consistent relationship with the direction of changes in PStEs. For example, effects that changed, from PStF to PStS or vice versa, were not consistently associated with either an increase or decrease in the level of EMG activation. The EMG activation level differences, between the two wrist positions, were not statistically different for any of the unstable effects that switched sign, either for PStF going to no effect or PStS going to no effect.
Figure 7.
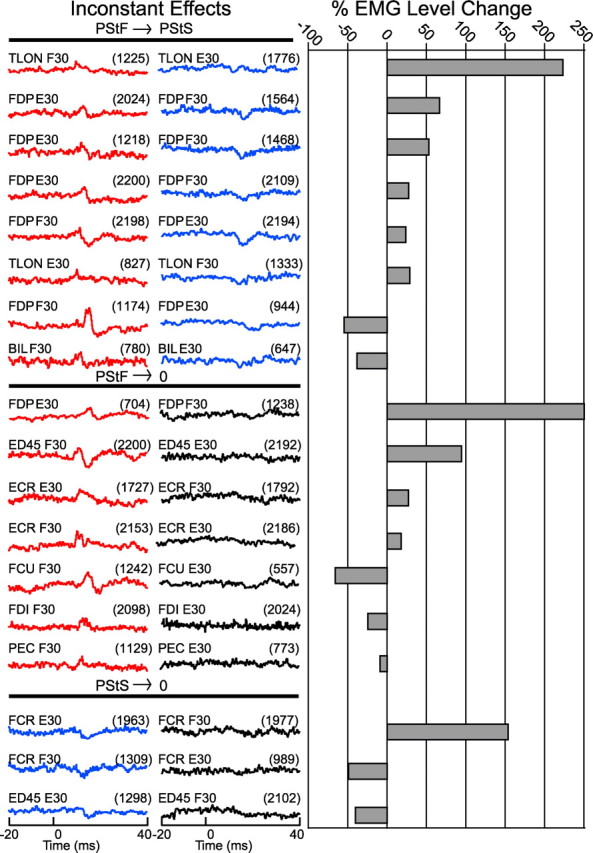
All 18 inconsistent effects observed during performance of the isometric wrist task and the corresponding percentage change in EMG activity level going from the task condition used for the left-column stimulus-triggered averages to right-column averages. The number of trigger events is given in parentheses.
Stability of PStE sign and magnitude across different arm postures
We focused on electrode track penetrations in the proximal-only and the proximal–distal representation of M1 to test the stability of StTAs at different proximal joint angles (Fig. 3B, pink dots). StTAs were collected at 26 layer V sites in M1 while the monkey performed the isometric push–pull task at different elbow and shoulder positions. Several of the nine possible push–pull handle positions were tested (Fig. 1B), each of which produced substantial changes in elbow and shoulder angles (Table 1). Because of the many degrees of freedom available for positioning the isometric push–pull handle around the monkey's work space, positions were typically chosen to maximize the change in angle of the joint most represented in the PStEs obtained at that site. For example, at a site that facilitated one or more shoulder muscles, push–pull positions A, B, D, and E were chosen. In the case of a site that facilitated only elbow muscles, push–pull positions G, B, and D were chosen. Because one of the goals of this study was to assess the stability of StTAs at different shoulder and elbow angles, the aforementioned push–pull handle sites (A, B, D, E, and G) were most commonly used. Push–pull handle positions H and I proved difficult for the monkey to perform and were therefore only tested rarely. Push–pull handle positions C and F were considered to be closer to a neutral shoulder and elbow angle and therefore were also rarely used.
The patterns of EMG activity associated with the push–pull task at positions B, D, and E are illustrated in Figure 4C–E. Most proximal and distal muscles show modulation with this task. As with the isometric wrist task, the modulation follows a relatively simple reciprocal pattern in most cases. At different arm positions, the pattern of EMG activity for a particular muscle remained relatively constant; what varied was the magnitude of EMG activation.
StTAs were collected at two push–pull positions for eight cortical sites, three push–pull positions for seven sites, four push–pull positions for eight sites, five push–pull positions for two sites, and six push–pull positions for one site, yielding a total of 601 cortical site–muscle combinations tested. Table 2, row 3, summarizes the number of muscles showing stable PStEs at all handle positions tested for each of the 26 cortical sites. If the sign (facilitation or suppression) of the PStE was the same for all push–pull handle positions tested, it was considered a stable effect. As was the case with the wrist task, StTAs collected at different push–pull handle positions were highly stable. Overall, 270 of 279 total effects (97%) remained stable at all handle positions tested (Table 2, column 2). A total of 601 muscles were evaluated (N > 500 triggers), 322 had no poststimulus effect at any handle position. An example of a typical layer V site illustrating the stability of effects in StTAs for all recorded muscles at four different push–pull handle positions is illustrated in Figure 8. PStEs were the same at all handle positions and thus showed 100% stability. Because 100% stability required each muscle to show the same qualitative effect at all handle positions tested, the one site that was tested at six different push–pull handle positions had the greatest opportunity for inconsistencies. However, even at that site, only one muscle (DE) showed inconsistent effects (PStF at handle positions B, D, E, and F; PStS at positions A and C). This site, therefore, yielded 10 of 11 matching PStEs at the six handle positions tested (91% stability).
Figure 8.
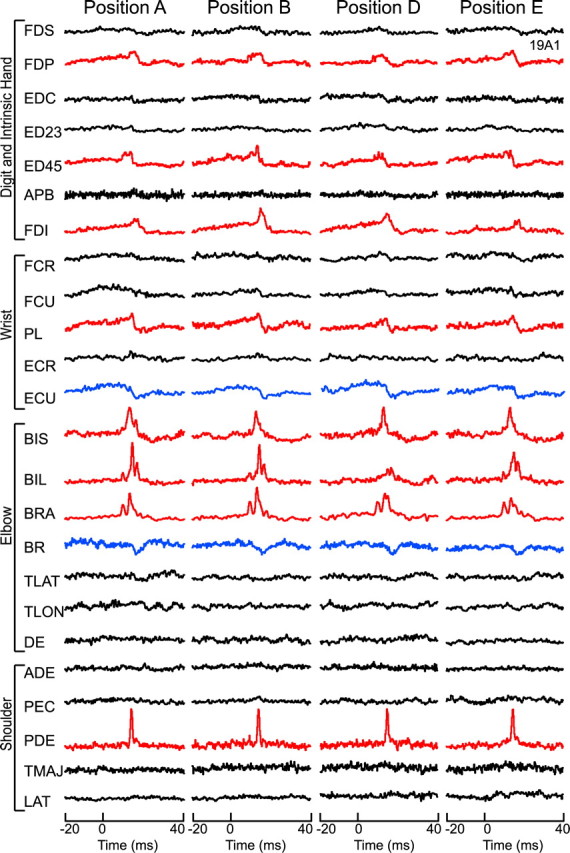
A typical layer V site in the proximal–distal representation with stable effects in all muscles observed during performance of the push–pull task at four different positions. PStF effects were present in both proximal (BIS, BIL, BRA, PDE) and distal (FDP, ED45, FDI, PL) forelimb muscles. PStS effects were also present in proximal (BR) and distal (ECU) forelimb muscles. StTAs are based on 500–2200 trigger events.
For PStF and PStS effects that remained qualitatively stable across push–pull handle positions, we also compared the magnitudes of the effects focusing on the most extreme elbow positions (G and D) and the most extreme shoulder positions (horizontal plane, B and D; vertical plane, E and D). The magnitude of the effects at the extreme elbow angles were highly correlated (r = 0.85; p < 0.001), as were the magnitudes measured at the extreme shoulder angles in the horizontal and vertical planes, respectively (r = 0.95, r = 0.94; p < 0.001). The slopes of the regression lines relating the magnitude of PStEs in one position to magnitude in the most extreme other position were all close to 1 (elbow positions: slope, 0.98; horizontal shoulder positions: slope, 1.03; and vertical shoulder positions: slope, 0.94). Furthermore, the median PStF and PStS magnitudes were not significantly different across any of the elbow or shoulder angles for any muscle group. As was the case for the isometric wrist task, the differences in magnitude of PStEs that did occur could not be explained by differences in the level of EMG activity.
Figure 9 shows polar plots illustrating the stability of both the sign of output effects (PStF, PStS) and their magnitude at a cortical site at which five different push–pull handle positions were tested (site 7dA4). The top, left polar plot contains the legend that shows the color coding for each muscle. The heavy black circle represents no effect (ppi = 0). Wedges extending beyond this line were facilitation effects plotted as positive ppi magnitude; shorter wedges falling inside the line were suppression effects plotted as negative ppi. At this site, all 24 muscles were evaluated and four of five showed matching PStEs at all handle positions (A, E, B, D, and G). DE was the only muscle with an inconsistent PStE; it shows PStF (ppi range, 10–32) at four handle positions and a PStS (ppi = −30) at one.
Figure 9.

Polar plots of the magnitude distributions of poststimulus effects for each of 24 muscles at five different workspace locations. Magnitudes are expressed as changes in the peak of PStF or trough of PStS as a percentage of baseline (ppi). The top left polar plot represents the muscle legend. The letters represent each handle position tested. Individual ppi values are given for each poststimulus effect.
We also limited the analysis at these 26 cortical sites to shoulder and elbow muscles only (ADE, PEC, TMAJ, PDE, LAT, BIS, BIL, BRA, BR, TLAT, TLON, and DE), in which joint angle changes with different handle positions were the greatest. This still yielded a high level of stability (143 of 150; 95%). A total of 312 muscles were evaluated (N > 500 triggers), and 162 had no PStE at any handle position. For this subset of 143 proximal muscle effects that remained qualitatively stable across elbow and shoulder angles, we compared the magnitude of the effects. Elbow muscle PStE magnitudes measured at the two most extreme elbow positions (G and D) were highly correlated (r = 0.88; p < 0.001) and the slope of the regression line was very close to 1 (1.04). Shoulder muscle PStE magnitudes measured at the two most extreme horizontal (B and D) and vertical (E and D) shoulder positions were also highly correlated (r = 0.90, r = 0.91; p < 0.001) and the slopes of the regression lines were also close to 1 (1.05 and 0.95, respectively).
Overall, nine of 150 PStEs were classified as unstable based on the fact that the sign of the effect (PStF or PStS) was not the same at all the push–pull handle positions tested. Four were cases in which the effects switched between facilitation and suppression, and five were cases in which a PStE was present in one or more push–pull handle positions and no effect was present at one or more of the other push–pull handle positions. Four of these were PStF effects, and one was PStS. Fifty-five percent of inconsistent effects were in the shoulder abductors (DE, LAT, and PDE) and the other 45% were divided between the elbow flexors (22.5%) and distal muscles (22.5%). All unstable effects had weak magnitudes.
Stability of the sign and magnitude of PStEs across different movement tasks
To maximize the opportunity for PStEs to show instability under different task conditions, we compared PStEs obtained from stimulation of the same cortical sites during performance of two tasks that differed fundamentally in terms of basic characteristics, the isometric push–pull task and the reach-to-grasp task. The EMG patterns for these tasks are illustrated in Figure 4. As noted previously, the isometric push–pull task produces robust activation of both distal and proximal muscles that for most muscles follows a simple reciprocal modulation pattern (Fig. 4C–E). The reach-to-grasp task, however, yields much more complex patterns of activation in which many muscles have multiple sharp peaks of activity (Fig. 4F). Fourteen layer V sites, in the proximal-only or proximal–distal representation of M1 (Fig. 3B, pink dots with black dot inset) were evaluated for stability of PStEs across the two tasks. Table 2, row 4, summarizes the results. Stability was calculated for each site by comparing the sign of the effect present in the StTAs for both the push–pull task and the reach-to-grasp task. If the PStE was qualitatively the same (PStF or PStS) for both tasks, it was considered a stable effect.
A total of 307 muscles were evaluated (N > 500 triggers); 189 had no PStE, leaving 118. Eighty-one percent (96 of 118) of PStEs were stable across tasks (Table 2, column 2). For the subset of 96 muscles with stable PStEs, the magnitudes of effects obtained from the two tasks were highly correlated (r = 0.76; p < 0.001) and the slope of the regression line was very close to 1 (1.03). Median PStF and PStS magnitudes for the two tasks and the mean level of EMG activity were not significantly different for any muscle group.
Overall, 22 of 118 PStEs (19%) were classified as unstable based on the fact that the sign of the effect (PStF or PStS) changed between the two tasks. Five were cases in which the effects switched between facilitation and suppression, and 17 were cases in which effects were present during performance of one task and absent during the other. Fourteen of these were PStF effects, and three were PStS effects. Seventy-five percent of inconsistent effects were in the distal muscles (40% extensors and 35% flexors), and the other 25% were divided between the shoulder muscles (10%) and elbow muscles (15%). Inconsistent effects were mostly weak in magnitude (18 of 22), although 4 of 22 had moderately strong magnitudes based on the classification scheme of Park et al. (2004).
Stability of PStEs across different phases of the same task
The final way in which we tested for possible task-dependent instability involved evaluating PStEs generated from stimuli applied during different phases of the same task. Data from 15 cortical sites for the isometric wrist task, 12 cortical sites for the isometric push–pull task, and 7 cortical sites for the reach-to-grasp task were analyzed. To ensure a range of PStE magnitudes, we selected all cortical sites that yielded at least one muscle with a strong PStF effect. Table 3 summarizes the stability of StTAs (sign of effect) after selecting stimulus triggers occurring in different phases of the tasks (column 2). For the isometric wrist task, we compared effects generated by stimuli applied during flexion force versus extension force, and for the push–pull task, we compared push (extension force) versus pull (flexion force). For the reach-to-grasp task, we compared PStEs from stimuli applied during the time from leaving home plate to exiting the target food well with effects from stimuli applied during the time from exiting the target food well to leaving home plate. Comparisons of the dynamic and hold phases of movement were not possible because the time periods for these comparisons were too short (e.g., dynamic phase of the wrist and push–pull tasks) to generate the criterion 500 trigger events. Nevertheless, what is most evident from the data in Table 3 is, again, the relatively high level of stability for most task comparisons. The one exception was the push versus pull phase of the isometric push–pull task in which the number of stable effects dipped to 84%. Fourteen percent (4 of 29) of the unstable effects involved switching between facilitation and suppression. These effects could not be explained by differences in baseline EMG activity.
Table 3.
Stability of poststimulus effects (15 μA) across different task phases
| Task | Trigger selection | Stablea/total |
|---|---|---|
| Isometric wrist | Flexion vs extension | 82/90 (91%) |
| Isometric push–pull | Push vs pull | 95/113 (84%) |
| Reach-to-grasp | LHPb–exit FWc vs exit FWc–LHPb | 77/80 (96%) |
aSame qualitative effect (PStF or PStS).
bHand leaving home plate.
cDigits exiting the target food well.
Discussion
Our results show that the sign of effects (facilitation or suppression) in StTAs of EMG activity are remarkably stable in the presence of joint angle position changes (96% stable), whole-arm posture changes (97% stable), and across fundamentally different types of tasks such as arm push–pull versus reach-to-grasp (81% stable). Although the magnitude of some individual effects obtained under different task conditions showed sizable differences, the correlation coefficients between magnitudes of PStEs under one condition compared with another condition were highly significant with a slope near 1. Stability in sign and magnitude remained high even when comparisons were limited to muscles whose length was most affected by the change in task conditions. We attribute this stability to the fact that most poststimulus effects are probably mediated by relatively direct (monosynaptic or disynaptic) corticospinal linkages to motoneurons.
PStEs remained stable (same sign) despite the presence of changes in background EMG level associated with changes in task conditions. The magnitude of PStEs was not correlated with the level of baseline EMG activity when effects were expressed as a percentage of baseline (Fig. 6B). However, when magnitude was expressed as the absolute increase or decrease from baseline (without dividing by baseline), a clear dependence on the level of baseline EMG activity was evident. Bennett and Lemon (1994) reported similar results for effects in spike-triggered averages of EMG activity.
Our results are directly relevant to a report by Graziano et al. (2004) showing that poststimulus output effects vary consistently as a function of elbow joint angle and can even change sign. In ketamine-anesthetized monkeys, they found that the magnitude of triceps PStF increased as elbow angle was moved toward flexion (stretching triceps) and biceps PStF decreased, whereas the opposite pattern was obtained as elbow angle was moved toward extension. Effects became stronger as the elbow joint was moved in a direction that lengthened the muscle. The mechanism of these changes is unclear, although the fact that nearly all of them followed a pattern closely linked to muscle length suggests that muscle spindle afferent input might be an important contributing factor. In awake monkeys producing active motor responses, we did not find evidence for a consistent relationship between joint angle (muscle length) changes and corresponding changes in either the sign or magnitude of PStEs. In fact, PStEs were highly stable in both magnitude and sign in the presence of large changes in joint angle, arm posture, and even across disparate types of tasks. Moreover, the changes that did occur were not related in any consistent way to joint angle or to the level of EMG activity. An important difference between the approaches in our two studies is that Graziano and colleagues collected their stimulus-triggered averaging data with the monkey under ketamine anesthesia while our monkeys were awake and performing trained motor tasks. It is feasible that with the monkey anesthetized and the limb being moved passively, motoneuron excitability might have become heavily dominated by changes in spindle afferent input associated with joint angle changes.
There are two important implications of our finding that PStEs are highly stable when tested during active voluntary movements. First, it means that stimulus-triggered averaging of EMG activity can be relied on to deliver highly consistent results in terms of the nature and magnitude of output effects from cortical and other brain areas, regardless of the specific behavioral task conditions. Second, this result is inconsistent with the hypothesis that joint position-related changes in proprioceptive input might bring about corresponding changes in cortical output efficacy that could form the basis of a rapid remapping process explaining how the same cortical site could activate flexors or extensors depending on the starting position of the joint (Graziano et al., 2004). Our results suggest that this is not a mechanism that applies to muscle activation patterns during normal voluntary movements.
Given the fact that a vast majority of poststimulus effects remained the same despite changes in task conditions, we have emphasized the stability of these effects. However, it is also reasonable to focus on the effects that did change and ask what mechanism might explain these changes. The changes consisted of switching sign (PStF vs PStS) depending on task conditions or switching between an effect (PStF or PStS) and no effect. The large majority of instances in which this type of switching occurred involved relatively weak PStEs, although some were stronger effects. What might explain these changes? Possible mechanisms include task-related changes in the excitability of the cortical network and/or task-related changes in multisynaptic pathways to motoneurons including spinal networks. Changing levels of EMG activity (motoneuron excitability) does not adequately explain the results, because switching from facilitation to suppression occurred with both increases and decreases in the level of EMG activity. It is difficult to explain loss of one effect and appearance of the opposite effect in the presence of an increase in EMG activity, which was the most common circumstance (Fig. 7). Both effects should be present at the higher level of EMG activity. Facilitation or suppression going to no effect might be explained by a decrease in the level of EMG activity if the affected motor units were no longer active. However, this would only explain one-half of these types of changes observed with the wrist task (Fig. 7). It seems most likely that these unstable effects are best explained by changes in excitability of cortical networks related to task conditions. Transsynaptic activation of corticospinal neurons would make this mechanism even more likely (Jankowska et al., 1975). Most of the unstable effects were weaker in magnitude; therefore, relatively small shifts in the map of cortical excitability brought about by changing afferent inputs might significantly alter the cluster of stimulus-activated cells.
The largest fraction of unstable effects occurred for the comparison that also yielded the most different patterns of EMG activation (push–pull task vs reach-to-grasp). The greater fractionation of muscle synergies associated with reach-to-grasp might also be expected to produce the most fractionation of the cortical excitability map resulting in greater instability of PStEs. In addition to differences in muscle activation patterns, fundamental differences in the behavioral aspects of the task, for example unrestrained arm movement versus restrained, might bring about a different pattern of excitability in the cortical network that could dramatically alter cortical output to muscles on a large scale. We did not observe such large-scale alterations; however, we cannot rule out that such changes might occur under specific conditions that at this point remain untested. We can conclude that differences in the level of EMG activity between tasks does not explain unstable effects or changes in magnitude because we found no relationship between EMG level and PStE magnitude measured as ppi and no evidence for switching between facilitation and suppression as a function of EMG level.
Alterations in the descending signal reaching motoneurons might also occur through non-monosynaptic linkages in the pathway. This might include spinal interneurons, rubrospinal neurons, and/or reticulospinal neurons. Because corticospinal terminations on motoneurons are not subject to presynaptic inhibition, this seems unlikely as a mechanism for unstable effects (Jackson et al., 2006). Recently, Davidson et al. (2007b) reported that some postspike facilitation and postspike suppression effects in spike-triggered averages of EMG activity were present under some task conditions and absent under other task conditions. In ∼10% of these cases, neither changes in cortical excitability, changes in motoneuronal excitability, nor changes in synchrony could explain the result. They speculated that relatively rapid changes in the efficacy of corticomotoneuronal synapses occurring over a period of minutes might offer the best explanation of these changes. Rapid changes in dendrite morphology are known to occur (Ikegaya et al., 2001). Persistent inward currents might also contribute to changes in the magnitude of postspike facilitation under different conditions (Heckman et al., 2008). These same mechanisms could also be involved in the amplitude changes we observed in stimulus-triggered averages.
We conclude that PStEs in stimulus-triggered averages of EMG activity remain highly stable under a wide variety of task conditions involving large changes in the position of different individual joints, as well as changes in global arm posture. Overall, the magnitudes of PStEs for the same cortical site–muscle combination obtained under different task conditions were highly correlated with regression slopes close to 1. Stimulus-triggered averaging of EMG activity has been used extensively to quantify output effects from cortical and subcortical descending systems to motoneurons and for mapping cortical output (Hummelsheim et al., 1986; Baker and Lemon, 1998; Perlmutter et al., 1998; Park et al., 2001, 2004; Schieber, 2001; Boudrias et al., 2006; Davidson and Buford, 2006; Moritz et al., 2007). Our results further validate the use of stimulus-triggered averaging of EMG activity as a powerful and effective method for studying the organization and function of cortical and subcortical motor areas.
Footnotes
This work was supported by National Institutes of Health (NIH) Grant NS051825, NIH Center Grant HD02528, and University of Kansas Medical Center Biomedical Research Training Program. We thank Ian Edwards for technical assistance.
References
- Asanuma H, Rosén I. Topographical organization of cortical efferent zones projecting to distal forelimb muscles in the monkey. Exp Brain Res. 1972;14:243–256. doi: 10.1007/BF00816161. [DOI] [PubMed] [Google Scholar]
- Baker SN, Lemon RN. Computer simulation of post-spike facilitation in spike-triggered averages of rectified EMG. J Neurophysiol. 1998;80:1391–1406. doi: 10.1152/jn.1998.80.3.1391. [DOI] [PubMed] [Google Scholar]
- Belhaj-Saïf A, Karrer JH, Cheney PD. Distribution and characteristics of post-stimulus effects in proximal and distal forelimb muscles from red nucleus in the monkey. J Neurophysiol. 1998;79:1777–1789. doi: 10.1152/jn.1998.79.4.1777. [DOI] [PubMed] [Google Scholar]
- Bennett KM, Lemon RN. The influence of single monkey cortico-motoneuronal cells at different levels of activity in target muscles. J Physiol. 1994;477:291–307. doi: 10.1113/jphysiol.1994.sp020191. [DOI] [PMC free article] [PubMed] [Google Scholar]
- Boudrias MH, Belhaj-Saïf A, Park MC, Cheney PD. Contrasting properties of motor output from the supplementary motor area and primary motor cortex in rhesus macaques. Cereb Cortex. 2006;16:632–638. doi: 10.1093/cercor/bhj009. [DOI] [PubMed] [Google Scholar]
- Boudrias MH, McPherson RL, Cheney PD. Contrasting output properties of rostral and caudal parts of the primary motor cortex (M1) in rhesus macaques. Soc Neurosci Abstr. 2007;33:292–17. [Google Scholar]
- Bretzner F, Drew T. Contribution of the motor cortex to the structure and the timing of hindlimb locomotion in the cat: a microstimulation study. J Neurophysiol. 2005a;94:657–672. doi: 10.1152/jn.01245.2004. [DOI] [PubMed] [Google Scholar]
- Bretzner F, Drew T. Changes in corticospinal efficacy contribute to the locomotor plasticity observed after unilateral cutaneous denervation of the hindpaw in the cat. J Neurophysiol. 2005b;94:2911–2927. doi: 10.1152/jn.00254.2005. [DOI] [PubMed] [Google Scholar]
- Buys EJ, Lemon RN, Mantel GW, Muir RB. Selective facilitation of different hand muscles by single corticospinal neurons in the conscious monkey. J Physiol. 1986;381:529–549. doi: 10.1113/jphysiol.1986.sp016342. [DOI] [PMC free article] [PubMed] [Google Scholar]
- Cheney PD. Electrophysiological methods for mapping brain motor and sensory circuits. In: Toga AW, Mazziotta JC, editors. Brain mapping: the methods. Ed 2. New York: Academic; 2002. pp. 189–226. [Google Scholar]
- Cheney PD, Fetz EE. Functional classes of primate corticomotoneuronal cells and their relation to active force. J Neurophysiol. 1980;44:773–791. doi: 10.1152/jn.1980.44.4.773. [DOI] [PubMed] [Google Scholar]
- Cheney PD, Fetz EE. Comparable patterns of muscle facilitation evoked by individual corticomotoneuronal (CM) cells and by single intracortical microstimuli in primates: evidence for functional groups of CM cells. J Neurophysiol. 1985;53:786–804. doi: 10.1152/jn.1985.53.3.786. [DOI] [PubMed] [Google Scholar]
- Cheney PD, Fetz EE, Palmer SS. Patterns of facilitation and suppression of antagonist forelimb muscles from motor cortex sites in the awake monkey. J Neurophysiol. 1985;53:805–820. doi: 10.1152/jn.1985.53.3.805. [DOI] [PubMed] [Google Scholar]
- Cheney PD, Mewes K, Widener G. Effects on wrist and digit muscle activity from microstimuli applied at the sites of rubromotoneuronal cells in primates. J Neurophysiol. 1991;66:1978–1992. doi: 10.1152/jn.1991.66.6.1978. [DOI] [PubMed] [Google Scholar]
- Davidson AG, Buford JA. Motor outputs from the primate reticular formation to shoulder muscles as revealed by stimulus-triggered averaging. J Neurophysiol. 2004;92:83–95. doi: 10.1152/jn.00083.2003. [DOI] [PMC free article] [PubMed] [Google Scholar]
- Davidson AG, Buford JA. Bilateral actions of the reticulospinal tract on arm and shoulder muscles in the monkey: stimulus triggered averaging. Exp Brain Res. 2006;173:25–39. doi: 10.1007/s00221-006-0374-1. [DOI] [PubMed] [Google Scholar]
- Davidson AG, Schieber MH, Buford JA. Bilateral spike-triggered average effects in arm and shoulder muscles from the monkey pontomedullary reticular formation. J Neurosci. 2007a;27:8053–8058. doi: 10.1523/JNEUROSCI.0040-07.2007. [DOI] [PMC free article] [PubMed] [Google Scholar]
- Davidson AG, Chan V, O'Dell R, Schieber MH. Rapid changes in throughput from single motor cortex neurons to muscle activity. Science. 2007b;318:1934–1937. doi: 10.1126/science.1149774. [DOI] [PubMed] [Google Scholar]
- Ginanneschi F, Del Santo F, Dominici F, Gelli F, Mazzocchio R, Rossi A. Changes in corticomotor excitability of hand muscles in relation to static shoulder positions. Exp Brain Res. 2005;161:374–382. doi: 10.1007/s00221-004-2084-x. [DOI] [PubMed] [Google Scholar]
- Graziano MS, Patel KT, Taylor CS. Mapping from motor cortex to biceps and triceps altered by elbow angle. J Neurophysiol. 2004;92:395–407. doi: 10.1152/jn.01241.2003. [DOI] [PubMed] [Google Scholar]
- Heckman CJ, Johnson M, Mottram C, Schuster J. Persistent inward currents in spinal motoneurons and their influence on human motoneuron firing patterns. Neuroscientist. 2008;14:264–275. doi: 10.1177/1073858408314986. [DOI] [PMC free article] [PubMed] [Google Scholar]
- Hummelsheim H, Wiesendanger M, Bianchetti M, Wiesendanger R, Macpherson J. Further investigations of the efferent linkage of the supplementary motor area (SMA) with the spinal cord in the monkey. Exp Brain Res. 1986;65:75–82. doi: 10.1007/BF00243831. [DOI] [PubMed] [Google Scholar]
- Ikegaya Y, Kim JA, Baba M, Iwatsubo T, Nishiyama N, Matsuki N. Rapid and reversible changes in dendrite morphology and synaptic efficacy following NMDA receptor activation: implication for a cellular defense against excitotoxicity. J Cell Sci. 2001;114:4083–4093. doi: 10.1242/jcs.114.22.4083. [DOI] [PubMed] [Google Scholar]
- Jackson A, Baker SN, Fetz EE. Tests for presynaptic modulation of corticospinal terminals from peripheral afferents and pyramidal tract in the macaque. J Physiol. 2006;573:107–120. doi: 10.1113/jphysiol.2005.100537. [DOI] [PMC free article] [PubMed] [Google Scholar]
- Jankowska E, Padel Y, Tanaka R. The mode of activation of pyramidal tract cells by intracortical stimuli. J Physiol. 1975;249:617–636. doi: 10.1113/jphysiol.1975.sp011034. [DOI] [PMC free article] [PubMed] [Google Scholar]
- Kasser RJ, Cheney PD. Characteristics of corticomotoneuronal postspike facilitation and reciprocal suppression of EMG activity in the monkey. J Neurophysiol. 1985;53:959–978. doi: 10.1152/jn.1985.53.4.959. [DOI] [PubMed] [Google Scholar]
- McKiernan BJ, Marcario JK, Karrer JH, Cheney PD. Corticomotoneuronal postspike effects in shoulder, elbow, wrist, digit, and intrinsic hand muscles during a reach and prehension task. J Neurophysiol. 1998;80:1961–1980. doi: 10.1152/jn.1998.80.4.1961. [DOI] [PubMed] [Google Scholar]
- Mewes K, Cheney PD. Facilitation and suppression of wrist and digit muscles from single rubromotoneuronal cells in the awake monkey. J Neurophysiol. 1991;66:1965–1977. doi: 10.1152/jn.1991.66.6.1965. [DOI] [PubMed] [Google Scholar]
- Mewes K, Cheney PD. Primate rubromotoneuronal cells: parametric relations and contribution to wrist movement. J Neurophysiol. 1994;72:14–30. doi: 10.1152/jn.1994.72.1.14. [DOI] [PubMed] [Google Scholar]
- Moritz CT, Lucas TH, Perlmutter SI, Fetz EE. Forelimb movements and muscle responses evoked by microstimulation of cervical spinal cord in sedated monkeys. J Neurophysiol. 2007;97:110–120. doi: 10.1152/jn.00414.2006. [DOI] [PubMed] [Google Scholar]
- Palmer SS, Fetz EE. Effects of single intracortical microstimuli in motor cortex on activity of identified forearm motor units in behaving monkeys. J Neurophysiol. 1985;54:1194–1212. doi: 10.1152/jn.1985.54.5.1194. [DOI] [PubMed] [Google Scholar]
- Park MC, Belhaj-Saïf A, Cheney PD. Chronic recording of EMG activity from large numbers of forelimb muscles in awake macaque monkeys. J Neurosci Methods. 2000;96:153–160. doi: 10.1016/s0165-0270(00)00155-2. [DOI] [PubMed] [Google Scholar]
- Park MC, Belhaj-Saïf A, Gordon M, Cheney PD. Consistent features in the forelimb representation of primary motor cortex in rhesus macaques. J Neurosci. 2001;21:2784–2792. doi: 10.1523/JNEUROSCI.21-08-02784.2001. [DOI] [PMC free article] [PubMed] [Google Scholar]
- Park MC, Belhaj-Saïf A, Cheney PD. Properties of primary motor cortex output to forelimb muscles in rhesus macaques. J Neurophysiol. 2004;92:2968–2984. doi: 10.1152/jn.00649.2003. [DOI] [PubMed] [Google Scholar]
- Perlmutter SI, Iwamoto Y, Baker JF, Peterson BW. Interdependence of spatial properties and projection patterns of medial vestibulospinal tract neurons in the cat. J Neurophysiol. 1998;79:270–284. doi: 10.1152/jn.1998.79.1.270. [DOI] [PubMed] [Google Scholar]
- Schieber MH. Constraints on somatotopic organization in the primary motor cortex. J Neurophysiol. 2001;86:2125–2143. doi: 10.1152/jn.2001.86.5.2125. [DOI] [PubMed] [Google Scholar]
- Van Essen DC, Drury HA, Dickson J, Harwell J, Hanlon D, Anderson CH. An integrated software suite for surface-based analyses of cerebral cortex. J Am Med Inform Assoc. 2001;8:443–459. doi: 10.1136/jamia.2001.0080443. [DOI] [PMC free article] [PubMed] [Google Scholar]
- Widener GL, Cheney PD. Effects on muscle activity from microstimuli applied to somatosensory and motor cortex during voluntary movement in the monkey. J Neurophysiol. 1997;77:2446–2465. doi: 10.1152/jn.1997.77.5.2446. [DOI] [PubMed] [Google Scholar]