Abstract
Neuronal cell polarization (i.e., establishment of an axon) and axon guidance are mediated and controlled by mechanical and chemical signals from the environment. Unfortunately, an integrated approach to study cell–substrate interactions in a unified framework incorporating structural and chemical effects of the substrate has been lacking. In this paper, we present a new model combining experimental and computational methods to better understand the distinct behavior of E18 hippocampal neurons in response to topographical vs. immobilized chemical cues. We present results from our coarse-grain physiological computational model that correctly describes previously observed phenomena and predicts behavior that was subsequently tested through new experiments. The model differentiates topographical from chemical cues via a difference in cue spacing in these two substrates. Using the feature size spacing for topographical cues and a minimum step size, governed by the physics of filopodia protrusion, for chemical cues, the model successfully mimics the trend observed in experimental polarization probability for four different topographical feature sizes and constant chemical cue spacing. Our results not only show good agreement with experiments, but also provide novel suggestions for development of substrates for finer control of neuronal cell polarization.
Keywords: Monte Carlo, Topography, Immobilized NGF, Hippocampal Neurons
INTRODUCTION
Extracellular signaling regulates neuronal behavior in differentiated and undifferentiated systems. 11,14,26,32,37,47 In embryological neural development, each newborn neuron first migrates to a specific location before extending an axon and dendrites.23,30,31 After neurons migrate, they follow a process of polarization, during which cells extend neurite processes equally in all directions. An axon typically forms after a neurite has extended 15 μm farther than other neurites.20 This process of formation of an axon is called axogenesis or polarization. In vitro neuron growth studies on polarization suggest a definitive role of extracellular cues in this process. In these experiments, the neurite that finds a more favorable substrate transforms into an axon, while other processes become dendrites.14 After the axon is clearly established, the combination of signals at the growth cone determines the specific pathway by which axons travel toward their target cells and establish connectivity.40,50,51 In addition, a similar scenario arises in peripheral nerve injuries, where the regenerating axons sprout growth cones that migrate along the surrounding substrate, guiding axon extension. For these last two processes, it is the integration at the growth cone of soluble chemo-attractants and chemo-repellants,44 as well as insoluble signals located on other cells or in the extracellular matrix (e.g., laminin) which dictates axon migration speed and direction.3,5
Numerous environmental stimuli, including substrate topography,45 growth factors,27 chemical and structural components of the extracellular matrix (ECM),7 conducting materials,29 and support cells,36 have been investigated with the purpose of inducing axogenesis and axon guidance in neurons. Although some progress has been made in investigating neuronal behavior in response to competitive stimuli,17 the cellular mechanisms that underlie the observed neuronal behavior have yet to be fully understood. Furthermore, even though topographical control of cells has been well documented,10 there exists little information on the mechanisms for why topography is typically more dominant than immobilized chemical cues for stimulating neuronal polarization.17,18 Moreover, axon decision making in the presence of competitive cues has not been fully investigated. This problem is further complicated because most direct competition schemes used to investigate the distinct behavior between chemical cues and topographical cues present the chemical cue in an immobilized fashion (haptotactic) rather than the more favorable soluble form (chemotactic). 18,19 Although there is a proposed metabolic pathway for immobilized chemical factors, such as neurotrophins, it is difficult to isolate the effect of immobilized chemical cues vs. topographical cues because almost all topographical cues, at some scale, present chemical cues and vice versa. This is problematic, as without a complete understanding of how competitive cues affect axon decision making, it will be difficult to fabricate an optimized engineered neural scaffold.
Neurotrophins are a group of growth factors that have been extensively used in investigating neuron development and behavior to extracellular stimuli. 12,15,39 Neurotrophins promote different effects on neurons, in particular trophic effects (i.e., neurite growth), chemotatic effects (i.e., neurite orientation), cell survival, and differentiation. Nerve growth factor (NGF) is the most studied and characterized neurotrophin and has been reported to play a role both in polarizing cells and on the guidance of individual growth cones. Hippocampal cells that have been exposed to NGF polarize faster; it has been proposed that this effect depends on ceramide based cascades produced through the binding of the p75NTR receptor. 4,52 On the other hand, NGF action on individual growth cones has been extensively investigated and related to increases of GTPases Rac1 and Cdc42, mediators of actin polymerization in neurites.1 In addition to trophic effects, NGF has a chemotactic effect on neurons, in which neurites sense gradients of growth factor and extend up the gradient toward higher concentrations.32 The advantage of using or studying NGF over other chemical cues is that NGF retains its biological activity when immobilized.26,27 This allows the researcher, through surface functionalization techniques, to develop novel substrates that can be used to directly compare biologically active chemical cues (i.e., surface receptor-mediated cues) to other adhesive chemical cues (i.e., integrin-mediated cues).17 Results from such studies can provide insight into the differences between surface-receptor mediated biological pathways and mechanosensory pathways that involve cytoskeletal machinery such as laminin, known to induce axogenesis.14,31
Recent studies have demonstrated that physical structure and topography have significant effects on cellular behavior such as the spreading of fibroblasts. 6,8,9 Specifically for neurons, micron scale topography can promote contact guidance, which is observed in natural physical cues provided by glial cells.23,42,49 In an attempt to mimic the topographical features found in the body, artificial substrata have been designed with microstructures using lithographic techniques.18 It is hypothesized that topography induces neuronal polarization as a result of local differences in tension that the growth cone experiences. The exact mechanism by which this occurs is not well understood. Therefore modeling and the use of computer simulations to understand complex natural phenomena may be useful to explain how neurons interact with external cues.
Current physiological models of neuronal polarization have focused primarily on a specific component of the neuron rather than the entire neuron. Several models involve solving a system of ordinary differential equations (ODEs) or partial differential equations (PDEs) that describe a simplified compartment to model a sub-cellular feature of the neuron. Examples of this are the models that describe the diffusion of a key protein from its fabrication site at the cell soma to the growing end of the neurite.21,22,24,28 These models have addressed a number of interesting issues such as neurite initiation, elongation, and branching. Other models have also addressed issues related to cytoskeletal mechanics in the growth cone or neurite outgrowth.43
In spite of these efforts, a cellular-level understanding of how substrate topography and chemical cues influence neurite extension and axon formation has been elusive. In this paper, we address this issue by developing a novel model to describe neuronal behavior to competitive stimuli as well as to individual cues. Our model captures all three of the major neurite processes observed in vitro and believed to also occur in vivo, namely, initiation, polarization, and axon path-finding. In addition, the model is inherently stochastic and is governed by the distance between adhesion sites. Finally, the model explains neuronal behavior on a specific biomaterial surface and shows excellent agreement with published experimental results. The model also outlines numerous avenues for further experiments to develop a comprehensive and systems level understanding of neuron–substrate interactions.
MATERIALS AND METHODS
Our model is based on both theoretical and experimental results. The main focus is to develop an integrated model that will distinguish between neuron–substrate interactions that are purely chemical in nature and interactions that have a topological and a chemical component. In addition, our goal is to develop a model that is not only able to capture results of existing studies but is also capable of predicting results in future experiments.
Development of Algorithm
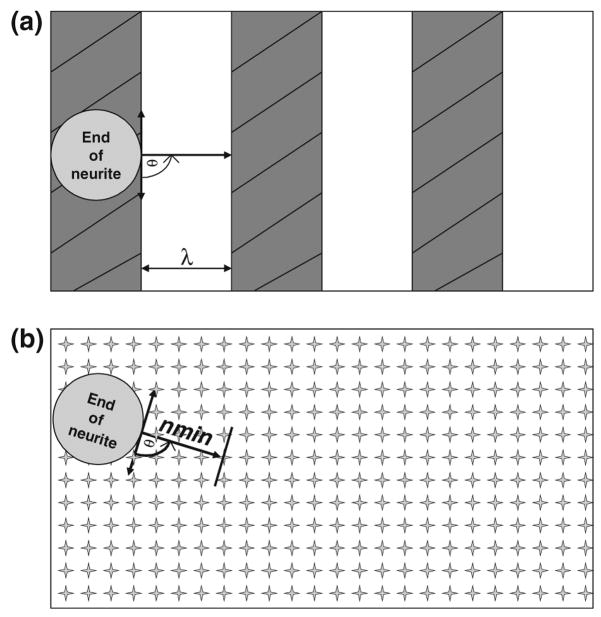
Our model is based on the assumption that the distance between distinct cues (i.e., “cue-to-cue” distance) is the key parameter in describing and predicting neuronal cell behavior to different extracellular cues. Mogniler et al.38 have shown that the minimum filopodia length both experimentally measured and theoretically predicted is between 0.5 and 1.5 μm. We utilize an intermediate value of 1 μm within this range as the minimum step size, nmin, to model a surface coated homogeneously with NGF. For topography, the cue distance was assumed to be equal to twice the feature size (i.e., the width of a ridge or microchannel). This was used since it was assumed that on average a growing neurite will span from ridge to adjacent ridge, and that the intrinsic stiffness of the neurite inhibits the transition from perpendicular migration across the ridge to parallel neurite outgrowth along the length of the ridge. The intrinsic stiffness of the neurite originates, in part, from the high persistence lengths of the actin and microtubule cytoskeletal components; as a result, the neurite cannot bend at sharp angles between ridges. As mentioned previously, this distance between adjacent ridges or microchannels (i.e., “cue-to-cue” spacing for topographical features) by definition is twice that of the feature size (i.e., the width of each individual ridge and/or valley). Figure 1 illustrates schematically how the extracellular topographical and chemical cues were treated in the computational algorithm.
FIGURE 1.
Individual neurite migration as captured by the computational model on topographical and chemical substrates. (a) This figure shows the topographical system in question with characteristic feature size λ and the growing end of one neurite. In the figure, the circle represents the j − 1 position of a single neurite i with excluded area equaling 3 μm (figure not drawn to scale). The gray striped rectangles represent the ridges while the white rectangles represent the valleys. Before each move, a coordinate system is defined and an angle ranging between 0 to 180 is randomly selected and a new coordinate for the center of the next circle in the chain is defined based on that angle and twice the feature size λ. (b) Shows the system as defined by the computational model for the chemical substrate. Everything in (b) is analogous to what is shown in (a) except that the star shapes in the background represent immobilized nerve growth factor (NGF). Since the nerve growth factor’s individual spacing (~0.02 μm) is so small in comparison with the neurite it can be considered as a continuum. As such, it was argued that the minimum step size is dependent on the minimum size of filopodia on each growing neurite (nmin) rather than the cue-to-cue spacing for immobilized NGF.
We used this scheme to differentiate between substrates with topographical and chemical cues and to select a trial configuration for the system. The initial configuration starts by defining the initial number of neurites and randomly distributing them on the periphery of the cell soma. The initial number of neurites was set to 10 because this is within an order of magnitude of the experimentally observed average number of neurites in hippocampal neurons, as first reported by Banker and Cowen.2 The excluded area of the cell soma is modeled as a circle with a diameter of 15 μm. Moreover, the excluded area for each neurite is defined as a rectangle with a width of 3 μm. Both the excluded areas of the cell soma and neurites are within the experimentally determined dimensions for hippocampal neurons. Before each move of a neurite, the model assesses whether the lattice coordinate is free or is excluded by either the cell soma or of one of the growing neurites. For a given time step “j”, each growing neurite on both topography and chemical substrates moves to a new set of coordinates as defined by the following set of equations:
| (1) |
In Eq. (1), xi,j, yi,j are the x and y coordinates for the ith neurite at the jth time step for the topographical substrate scenario, whereas xci,j, yci,j are the equivalent values for the chemical substrate scenario. The angle θ is the angle chosen by the neurite for the subsequent step. For example, an angle of 90 degrees would imply that the neurite chooses to move in the same direction as the previous step, whereas an angle of 0 or 180 degrees would imply a move that is perpendicular to the previous step. In Eq. (1), b and c are constants equaling −1 or 1 depending on the angle chosen, whereas z is twice the feature size, λ, for the topographical scenario. The angle θ can vary from 0 to 180 degrees.
Before the new coordinates are accepted, they are tested against both an excluded volume criterion and an acceptance probability. An acceptance probability is introduced to model the intuitive fact that as a given feature size or cue-to-cue distance increases, the probability that a growing neurite will be able to span that distance will decrease. The acceptance probability functionality is modeled as an exponential and is defined as:
| (2) |
where Δr is the displacement vector of the ith neurite for the jth time step, and l* is the effective characteristic length of the growing neurite. It should be noted that the acceptance probability functionality, as defined in Eq. (2), is chosen to describe the neuronal behavior to these cues as previously observed by Gomez et al.18 It thus has no direct relation to the transition probability as defined by the Canonical Ensemble formulation. Furthermore the acceptance probability of the reverse move is assumed to be zero. This is a reasonable assumption since the reverse move of a neurite within a single step is energetically prohibited because of the high persistence of actin filaments and microtubules.
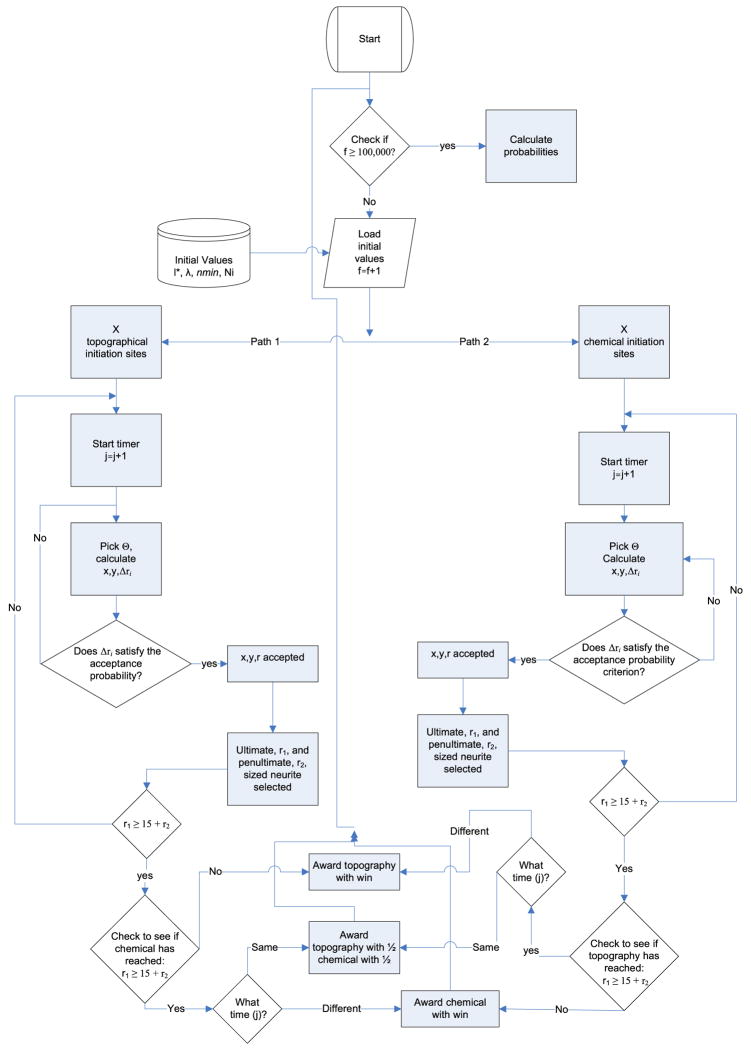
Simulations of the topography and chemical scenarios were performed in parallel, and results were compared after each simulation to assess whether either had reached the polarization criteria. A neuron is defined as being polarized when one of its neurites becomes at least 15 μm longer than all other neurites. This criterion is based on previous experimental observations as first reported by Goslin et al.20 Each simulation was repeated 10,000 times to ensure ergodicity and independence on initial conditions. A complete state diagram for the algorithm used in our simulations is found in Fig. 2.
FIGURE 2.
State diagram. The above state diagram shows the logic tree for the algorithm used in our computational model. Briefly, the computation starts a timer, inputs initial conditions (l*, λ, nmin), and goes through two parallel paths. Path 1 leads to the topographical domain whereas path 2 leads to the chemical one. In each path, a random angle is chosen for each migrating neurite and new x, y coordinates are either accepted or rejected through an acceptance probability.
Feature sizes for the topographical scenario are varied from small (1 μm) to large (1000 μm) to capture the effect of feature size on polarization. In these cases all other variables (i.e., minimum step size, nmin; number of neurites, n; characteristic length, l*) were maintained constant. We also investigated the effects of characteristic length, l*, on polarization by varying the characteristic length (10, 17.7, 50, 110 μm). Finally, to test the dependence of our model on the minimum step size, nmin, the algorithm was implemented for three different step sizes (0.5, 1, 1.5 μm). Table 1 lists the parameters used in the simulations to obtain the results below.
TABLE 1.
Model variables.
| Symbol | Definition | Range of values (μm) |
|---|---|---|
| l* | Characteristic length | 10, 17.7, 50, 110 |
| α | Acceptance probability | – |
| λ | Feature size | 1–1000 |
| ri,j | Displacement vector of the ith neurite for the jth time step | – |
| nmin | The minimum step size a growth cone can make equal to chemical step size | 0.5–1.5 |
| Ni | The number of initial neurite processes | 10 |
Experimental Methods
To ensure that our model is able to capture and predict novel features of neuron–substrate interactions, we not only compared our results to existing experimental data but also carried out several novel experiments to test and validate our theoretical calculations. The following sections briefly describe our experimental methods.
Microfabrication of Physical Cues
Microchannels (i.e., ridges) of 1, 2, 5, and 10 μm in width and 400 nm in depth were created on polydimethylsiloxane (PDMS) using standard soft lithography techniques. Microfabrication of these devices consists of three steps.17 First, electron beam (E-beam) lithography was used to make a silicon mask with the desired ridge patterns (i.e., topographical cue spacing). Second, standard etching and microfabrication techniques were used to make a silicon master with the final microchannel dimensions from the silicon mask. Finally, soft lithography was used to make a replica mold of the master from PDMS. The detailed procedures are described below.
Silicon wafers, with a SiO2 layer, were first spin-coated with 4% poly(methyl methacrylate) PMMA resist in chlorobenzene (Microchem, Newton, MA). An E-beam lithographic tool (Raith-50 and XL-30 SEM, LaB6 source) with an area dose of 220 μAs/cm2 and beam current of 0.215 nA was subsequently used to create microchannels of 1, 2, 5, and 10 μm spacing on the PMMA resist.
Following the resist development, a thermal evaporator (Denton) was used to deposit a 100 nm chromium (R.D. Mathis, Long Beach, CA) film and this was subsequently followed by a lift-off with acetone. After this step, a reactive ion etcher (Plasma Technology) was used to etch off 400 nm of the SiO2 layer with a mixture of CHF3 and O2. Before the master could be used for replica molding of PDMS (Sylgard 184, Dow Corning, Midland, MI), the master was silanized with tridecaflouro-1,1,2,2-(tetrahydrooctyl)trichlorosilane (Gelest, Philadelphia, PA).
Soft lithography was employed to make PDMS substrates. To make PDMS, a 10:1 w/w mixture of base to curing agent was mixed rapidly and degassed for 30 min before being poured into a 10 cm Petri dish containing the master. The thickness of the PDMS film was controlled at 3 ± 0.01 mm and allowed to cure under vacuum for 24 h. All PDMS substrates with microchannels were sonicated in 70% ethanol for 15 min, UV-sterilized for 3 h, and placed in a 3 cm diameter 6 well multiwell tissue culture dish. Substrates were then coated by incubation with a solution of polyallylamine in water (7 mg/mL) overnight and washed twice with distilled-deionized (DDI) water.
Immobilization of NGF
We performed NGF photochemical fixation using a phenyl-azido group. The method used was developed by Matsuda et al.34 and modified by Ito and colleagues for immobilization of growth factors.25–27 Briefly, the method begins with the synthesis of N-4-(azido-benzoyloxy) succinimide through the addition of dicyclohexylcarbodiimide (Sigma–Aldrich, St. Louis, MO) (6.7 g) in tetrahydrofuran (75 mL) to a solution of N-hydroxysuccinimide (Sigma–Aldrich) (3.7 g) and 4-azidobenzoic acid (TCI America, Portland, OR) (4.8 g) in tetrahydrofuran (75 mL). Separation of urea side products from the target product, azido-NHS, was then performed through filtration and crystallization with isopropyl alcohol/diisopropyl ether (Sigma–Aldrich). Next, a solution of 15 mg of polyallylamine (Aldrich) in 10 mL of phosphate buffered saline (PBS, pH 7.4) was added to a solution of 13 mg of the azido-NHS in 5 mL of N,N-dimethylformamide and stirred for 24 h at 4 °C. The solution was then treated to three cycles of ultrafiltration (10,000 Da NMWL; Millipore, Billerica, MA) followed by washes with 10 mL of distilled-deionized (DDI) water. After the final purification step a volume of ~300 μL of photosensitive polyallylamine (PAA-azido) was obtained.
The PAA-azido conjugate was diluted in DDI water to obtain a final volume of 1.2 mL (1:4). A total of 50 μL of this solution was then cast on a PDMS substrate (1 cm2), air dried in a vertical flow hood, and exposed to UV radiation with a UV lamp (Blak-Ray, 22 mW/cm2, λmax = 365 nm) for 15 s. This was followed by three washes with 0.05 M HCl and two washes with PBS. A second layer of the photosensitive polyallylamine (50 μL) was then cast on the substrate and processed as described above. Finally, a layer of NGF was cast and immobilized on the substrate using the UV lamp conditions mentioned above, except no washes with HCl were performed. This yielded a final surface concentration of NGF of 0.11 ng/mm2 as previously determined by Gomez et al.18 For controls, in the final step PBS only was added instead of NGF solution.
E18 Hippocampal Cell Culture
E18 hippocampal neurons were used for the cell studies. They are ideal in investigating polarization because they only form one axon.17,20 For cell culture, treated PDMS substrates were transferred to sterile glass slides, washed twice with sterile water, air dried, and stored at 4 °C. Before cell culture, sterile PDMS wells (1.25 × 1.25 × 1.5 cm) were placed such that they encased the treated PDMS substrates. Next, embryonic rat hippocampal cells (E18) were isolated from commercially obtained hippocampus tissue (Brainbits, Springfield, IL). The isolation involved dissolving the extracellular matrix of the brain in papain (Worthington, Lakewood, NJ) in Hibernate E medium (BrainBits) (4 mg/mL) at 30 °C for 25 min, followed by physical trituration with a fire-polished Pasteur pipette. Further isolation was accomplished through centrifugation (Sorvall Legend RT) of the resulting solution for 2 min at 200g. The cell pellet was then dissolved in 1 mL of culture medium, counted, and plated on substrates (1.0 × 10³ cells/cm2) with culture medium. Culture medium consisted of Neuro-basal Medium (Invitrogen, Carlsbad, CA) supplemented with 2% B-27 (Invitrogen), L-glutamine (Fisher, Waltham, MA, 0.5 mM), L-glutamic acid (Sigma–Aldrich, 25 μM), and 1% antibiotic–antimycotic (Sigma–Aldrich, 10,000 units/mL of penicillin, 10 mg/mL of streptomycin, and 25 μg/mL of amphotericin). For negative controls, PDMS substrates were coated only with PAA-azido.
Polarization Analysis and Time Study
Cells were cultured at 37 °C, 5% CO2 in a Forma Series II incubator for four different time periods (3, 12, 20, and 48 h) to determine whether, given sufficient time, all cells did indeed polarize on both types of substrates. After each time point both the PDMS substrates containing topographical and chemical features were fixed with 4% paraformaldehyde (Sigma–Aldrich), 4% sucrose (Fisher) in PBS for 20 min. This was followed by permeabilization with 0.1% Triton-X100 (Sigma–Aldrich) in 3% goat serum (Sigma–Aldrich) in PBS for 20 min, and blocking for 1 h at 37 °C with 3% goat serum-PBS.
Samples were incubated with antibodies for tau-1 (axonal marker) (Chemicon, Temecula, CA, 1:200) in 3% goat serum overnight at 4 °C, followed by incubation with fluorescently labeled secondary antibodies (Alexa 546-conjugated, Molecular Probes) for 6 h at 4 °C. DAPI staining was then used to distinguish cells from debris. Samples were then mounted with a 1:1 glycerol:PBS solution, inverted, and imaged using an Olympus IX70 fluorescence microscope. To determine whether the criteria defining polarization was met, cells were imaged first using DAPI, then in phase contrast (to determine number of neurites and neurite lengths), and finally were imaged using the anti-tau-1 antibody.
Based on published criteria, a hippocampal cell is defined as being polarized (stage 3) when one of its neurites stains positively for tau-111,20,35,41,48 and is at least 15 μm greater than all of the remaining neurites. For each substrate, five random images were obtained and the number of polarized cells and total number of cells were counted.
Statistics and Error Propagation
For statistical and error purposes five randomly selected images were acquired for each substrate and time point. Statistics for both the total number of cells and polarized cells were calculated. This includes the averages and standard deviations for each of these populations. Error for fraction of polarized cells was determined using error propagation. For this case, the error for fraction of polarized cells, σF.P, was determined by:
| (3) |
In Eq. (3), σp, σn, p, and n are the standard deviation for the polarized cell population, standard deviation for the total number of cells, the average number of polarized cells, and the average total number of neural cells, respectively.
RESULTS AND DISCUSSION
Computational Results
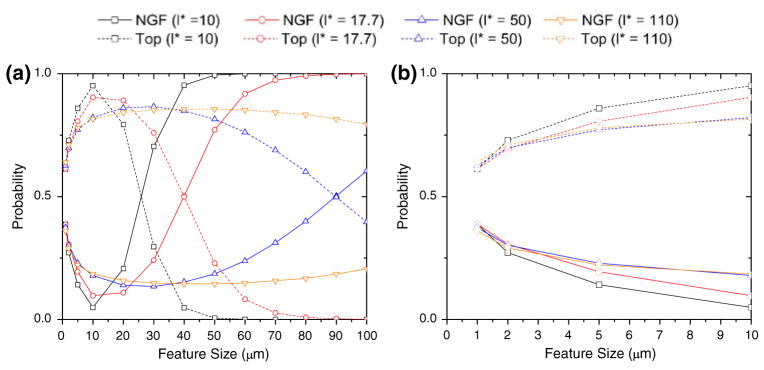
Our computational results show that for a given chemical concentration as the topographical feature size increases, the probability of observing polarization on the topographical substrate increases up to a critical point. Above this critical point, which is marked by the effective characteristic length l* of the neurites, the neuron perceives the topographical substrate as a planar surface (Fig. 3). This is indicated by the behavior of the system at several characteristic lengths, l*, as shown in Fig. 3. We observed that the maximum polarization occurred at the feature size equal to the individual neurite’s characteristic length, suggesting that the characteristic length provides a measure of the effective sensing radius of each individual neurite.
FIGURE 3.
Computer simulation of neuron polarization on substrates with experimentally relevant feature sizes. (a) Shows the predicted probability of polarization for E18 hippocampal neurons cultured on a PDMS substrate containing topography (Top) vs. that predicted for those cells cultured on a substrate containing immobilized nerve growth factor (NGF). The figure shows the entire range of topographical features investigated (1–100 μm) in this simulation for four characteristic lengths of interest (10, 17.7, 50, 110 μm). (b) Demonstrates the same plot as in (a) at a smaller x-axis scale for direct comparison with experiments performed.
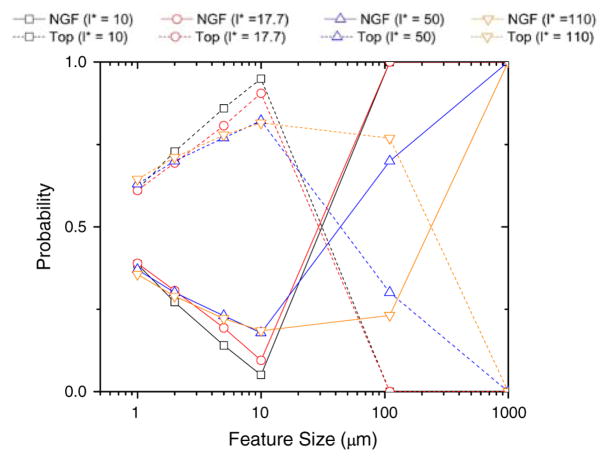
Figure 4 depicts the effect of larger topographical feature sizes (i.e., ridge-to-ridge distance) on the overall behavior of the system. Again the functionality dependence of the axogenesis probability was investigated for different neurite characteristic lengths. Figure 4 shows that as feature sizes reach their asymptotic values the neuron effectively can no longer “sense” the topographical environment and thus chemical cues are predicted to induce axogenesis first. That is, as topographical feature size increases, so does the probability of axogenesis up to the given persistence length of the individual neurites. Beyond that persistence length chemical cues begin to dominate. This is quite interesting since there is no inherent bias in the simulation between chemical cues and topographical cues other than the cue-to-cue spacing in each scenario.
FIGURE 4.
Computer simulation of neuron polarization at large feature size asymptote. This figure shows what our model would predict, for the four characteristic lengths investigated, at very large feature sizes. As feature size tends to relative infinity we would logically predict that chemical cues should start to win out. This hypothesis is corroborated by our model.
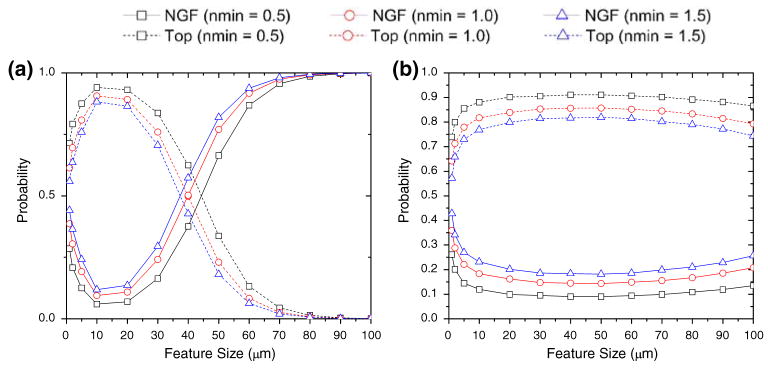
Another interesting result of our simulation is that it models the dependence of polarization on the minimum filopodial step size, nmin. To capture this effect, we studied three distinct nmin values. These values were within the linear domain of filopodia lengths that are limited by buckling rather than by membrane resistance and diffusion.38 The three nmin values were: the inflection point occurring between the “limited by membrane resistance” and “limited by buckling” domains (0.5 μm), the average value for the “limited by buckling” domain (1.0 μm), and the inflection point located between the “limited by buckling” and “limited by diffusion” domain (1.5 μm). Mogilner et al. found that the optimal actin bundle for filopodia protrusion occurred at this inflection point (1.5 μm). Figure 5 shows the results of our simulations at these three nmin values for two characteristic lengths, l* = 17.7 and l* = 110 μm. Our results demonstrate that at the larger nmin values, chemical and topographical cues become equally probable to induce polarization first. In accordance with previous simulations, the inflection point was observed around the values of the characteristic lengths for Fig. 5. It is important to note that in all our simulations the probability that either topography or chemical cues wins always equals one. This is because our model assumes that at long times either topography or chemical cues will cause all neurons to undergo axogenesis. This is actually consistent with our own earlier observations that neurons were able to polarize after long times (~3 days) irrespective of the nature of the substrate.
FIGURE 5.
Computer simulations dependence on minimum step size (nmin) for two possible characteristic lengths. (a) The characteristic length, l*, used was equal to the persistence length of a single actin filament (17.5 μm). (b) The characteristic length, l*, used was equal to the persistence length of a single microtubule (110 μm).
Experimental Results
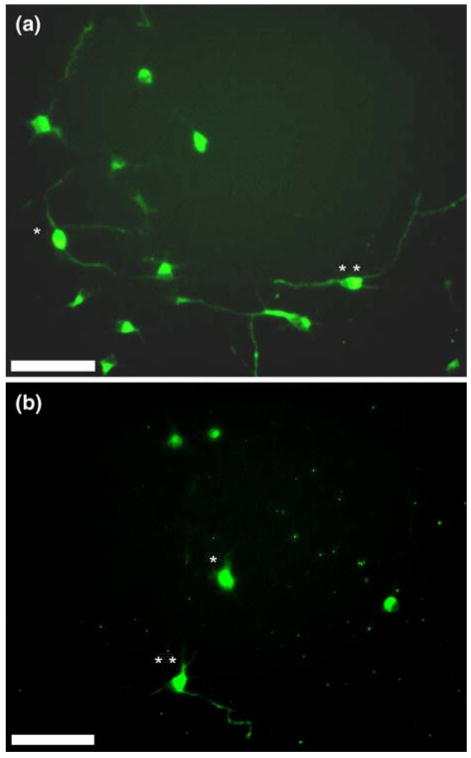
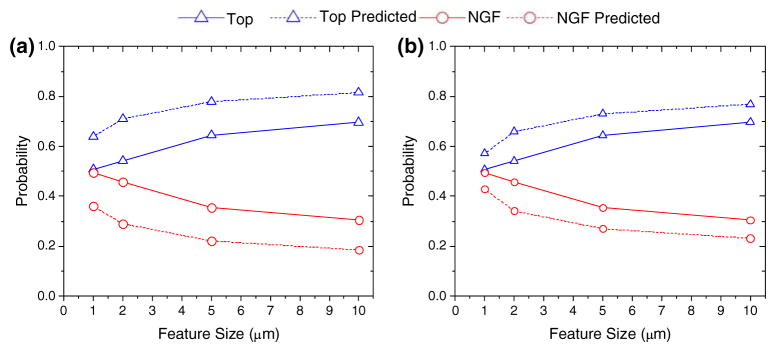
Experiments were performed to test the results of our simulations. Representative images of cells observed on the topographical (a) and immobilized NGF (b) substrates are provided in Fig. 6. Figure 7 shows the fraction of polarized cells observed on topographical substrates containing a given feature size. The fraction of polarized cells for a given feature size was calculated by counting the relative number, vs. control, of polarized E18 hippocampal cells observed on a given feature size and dividing that number by the relative total number of cells polarized, vs. control, on both the feature size and NGF-immobilized substrates. The NGF-immobilized substrate was prepared such that the surface concentration of NGF was equal to 0.11 ng/mm2. For the probability of polarization calculations cells were cultured for 20 h and control was just a PDMS substrate with PAA-azido coated surface. Results shown in Fig. 7 are qualitatively very similar to the computational results given in Fig. 3. A direct comparison is shown for the two best simulations in Fig. 7. At the initial nmin value of 1.0 μm, we discovered that the best correlation with experiments was for l* = 110 μm. This nmin value was found by Mogilner et al. to be the average length of filopodia whose lengths were limited by buckling rather than by membrane resistance or diffusion. For nmin = 1.5, we found a better correlation with experiments for l* = 110 μm.
FIGURE 6.
Effect of individual stimuli on axogenesis. (A–B) Hippocampal neurons, seeded at ~50,000 cells/cm2 and cultured for 20 h, exhibit different levels of polarization depending on the type of cue present. Fluorescent images (Tau-1 labeled) are shown above for 1 μm topographical features (a), and 0.11 ng/mm2 of immobilized nerve growth factor (NGF) (b). Double and single asterisks denote examples of hippocampal neurons that have and have not undergone polarization. Scale bar = 50 μm.
FIGURE 7.
Neuron polarization probability increases as a function of topographical feature size in comparison to a constant chemical surface concentration. Here (a) and (b) shows the best two possible fits of our model to experimentally derived results. (a) The minimum step size allowed was 1.0 μm. From those simulations we found that l* = 110 μm gave the best fit to experiments. (b) At the asymptotic nmin value of 1.5 μm we found that our computational model yielded better agreement with experiments. Again from this simulation we found that l* = 110 μm gave the best fit to experiments.
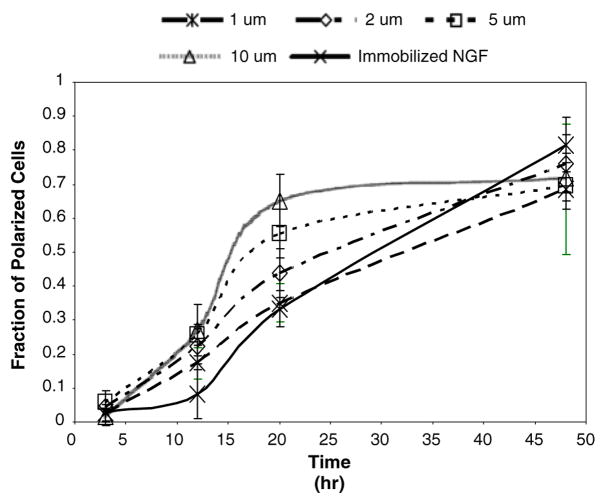
We also performed a time-course experiment to determine whether both chemical and topographical cues result in 100% polarization of neurons at equilibrium. The data from this experiment were plotted as the fraction of polarized cells, defined as the average number of polarized cells in each sample view divided by the total number cells on any given substrate, against the incubation time, Fig. 8. Figure 8 shows agreement with previous studies and also validates our hypothesis that all substrates asymptotically reach 100% polarization at equilibrium.
FIGURE 8.
At equilibrium all substrates, both chemical and topographical, tend to have the same extent of polarization. Here a constant concentration (0.11 ng/mm2) of immobilized nerve growth factor (NGF) was used to compare extent of polarization vs. different feature sizes as a function of time. This result corroborates our assumption that at equilibrium both chemical and topographical cues cause the same extent of polarization.
The results of our computational model provide a novel plausible basis for the topographical bias in neuronal polarization observed in previous studies17,18 and in our own recent experiments, Fig. 7. Our simulations demonstrate good agreement with previous and new experiments and support the hypothesis that topographical microchannels (i.e., ridges) in the substrate regulate neuron polarization.
Although our model is able to mathematically match experimental data, our model has a couple of limitations. First, our model is focused on the cellular length-scale and is unable to capture molecular level mechanical or signaling events. A multi-scale modeling approach, incorporating our model with molecular events, is currently under development. Second, mechanical effects of the substrate are also beyond the scope of our model. Mechanical properties of substrates have been known to influence processes such as differentiation, growth rate, and development.13,16,33,46 These effects, through various mechanotransduction channels, will influence overall behavior and provide novel insights into neuron-matrix interactions. However, despite this assumption, our model provides a reasonable first order approximation to experiments showing that mechanical properties of the substrate are a second order effect in determining axogenesis in response to substrates having both topographical and immobilized chemical ligands.
Base on our results, experiments can be proposed that provide a more detailed and quantitative picture of cell–substrate interactions. First, larger topographical features need to be designed such that we can explore our hypothesis that at a sufficiently large feature size we will observe a maximum beyond which the probability for enhanced polarization in response to topographical features compared to chemical features will decrease. Detailed characterization of the surface to capture the homogeneity of chemical cues is also critical in developing more accurate models. It is our hope that by expanding this model and incorporating migration and signaling, we will not only improve the connection with experiments but also hope to identify novel targets for designing multi-functional substrates for rapid and efficient polarization of neurites.
CONCLUSION
Our computational model, rooted in recent developments in neural engineering and biomaterials, successfully describes experimentally observed trends in the interaction of neurons with functionalized substrates. Our model is not only able to reproduce existing experimental results, but it also successfully predicts results for novel experiments. The tight correlation between the computational model and experiments suggests that cue spacing is the major determinant for axon polarization. Additionally, we predict that the role of topographical spacing will peak around the characteristic length of the neurite and beyond this critical distance chemical cues will be as effective as topography. We hope that models such as ours will provide both experimentalists and theoreticians with new ideas to develop integrated and multi-scale approaches to quantify the complex interactions between neurons and substrates in an effort to develop new biomaterials.
Acknowledgments
The authors would like to thank the assistance of Tianyi Yang, Natalia Gomez, and members of the Schmidt and Zaman labs for numerous enlightening discussions. The resources of the NST and MRC at the University of Texas at Austin are gratefully acknowledged. This work was supported by faculty development startup funds from the Cockrell School of Engineering to MHZ and by an NIH Grant (R21 EB003416) to CES.
References
- 1.Aoki K, Nakamura T, Matsuda M. Spatio-temporal regulation of Rac1 and Cdc42 activity during nerve growth factor-induced neurite outgrowth in PC12 cells. J Biol Chem. 2004;279:713–719. doi: 10.1074/jbc.M306382200. [DOI] [PubMed] [Google Scholar]
- 2.Banker GA, Cowan MW. Rat hippocampal neurons in dispersed cell culture. Brain Res. 1977;126:397–342. doi: 10.1016/0006-8993(77)90594-7. [DOI] [PubMed] [Google Scholar]
- 3.Bentley D, O’Connor TP. Cytoskeletal events in growth cone steering. Curr Opin Neurobiol. 1994;4:43–48. doi: 10.1016/0959-4388(94)90030-2. [DOI] [PubMed] [Google Scholar]
- 4.Brann AB, Scott R, Neuberger Y, Abulafia D, Boldin S, Fainzilber M, Futerman HA. Ceramide signaling downstream of the p75 neurotrophin receptor mediates the effects of nerve growth factor on outgrowth of cultured hippocampal neurons. J Neurosci. 1999;19:8199–8206. doi: 10.1523/JNEUROSCI.19-19-08199.1999. [DOI] [PMC free article] [PubMed] [Google Scholar]
- 5.Bray D, Hollenbeck JP. Growth cone motility and guidance. Annu Rev Cell Biol. 1988;4:43–61. doi: 10.1146/annurev.cb.04.110188.000355. [DOI] [PubMed] [Google Scholar]
- 6.Britland S, Clark P, Connolly P, Moores G. Micropatterned substratum adhesiveness: a model for morphogenetic cues controlling cell behavior. Exp Cell Res. 1992;198:124–129. doi: 10.1016/0014-4827(92)90157-4. [DOI] [PubMed] [Google Scholar]
- 7.Clark P, Britland S, Connolly P. Growth cone guidance and neuron morphology on micropatterned laminin surfaces. J Cell Sci. 1993;105(Pt 1):203–212. doi: 10.1242/jcs.105.1.203. [DOI] [PubMed] [Google Scholar]
- 8.Clark P, Connolly P, Curtis SA, Dow AJ, Wilkinson DC. Topographical control of cell behaviour. I. Simple step cues. Development. 1987;99:439–448. doi: 10.1242/dev.99.3.439. [DOI] [PubMed] [Google Scholar]
- 9.Clark P, Connolly P, Curtis SA, Dow AJ, Wilkinson DC. Topographical control of cell behaviour: II. Multiple grooved substrata. Development. 1990;108:635–644. doi: 10.1242/dev.108.4.635. [DOI] [PubMed] [Google Scholar]
- 10.Curtis A, Wilkinson C. Topographical control of cells. Biomaterials. 1997;18:1573–1583. doi: 10.1016/s0142-9612(97)00144-0. [DOI] [PubMed] [Google Scholar]
- 11.Dotti CG, Sullivan AC, Banker AG. The establishment of polarity by hippocampal neurons in culture. J Neurosci. 1988;8:1454–1468. doi: 10.1523/JNEUROSCI.08-04-01454.1988. [DOI] [PMC free article] [PubMed] [Google Scholar]
- 12.Ebadi M, Bashir MR, Heidrick LM, Hamada MF, Refaey EH, Hamed A, Helal G, Baxi DM, Cerutis RD, Lassi KN. Neurotrophins and their receptors in nerve injury and repair. Neurochem Int. 1997;30:347–374. doi: 10.1016/s0197-0186(96)00071-x. [DOI] [PubMed] [Google Scholar]
- 13.Engler AJ, Sen S, Sweeney LH, Discher ED. Matrix elasticity directs stem cell lineage specification. Cell. 2006;126:677–689. doi: 10.1016/j.cell.2006.06.044. [DOI] [PubMed] [Google Scholar]
- 14.Esch T, Lemmon V, Banker G. Local presentation of substrate molecules directs axon specification by cultured hippocampal neurons. J Neurosci. 1999;19:6417–6426. doi: 10.1523/JNEUROSCI.19-15-06417.1999. [DOI] [PMC free article] [PubMed] [Google Scholar]
- 15.Gallo G, Letourneau CP. Localized sources of neurotrophins initiate axon collateral sprouting. J Neurosci. 1998;18:5403–5414. doi: 10.1523/JNEUROSCI.18-14-05403.1998. [DOI] [PMC free article] [PubMed] [Google Scholar]
- 16.Georges PC, Miller JW, Meaney FD, Sawyer SE, Janmey AP. Matrices with compliance comparable to that of brain tissue select neuronal over glial growth in mixed cortical cultures. Biophys J. 2006;90:3012–3018. doi: 10.1529/biophysj.105.073114. [DOI] [PMC free article] [PubMed] [Google Scholar]
- 17.Gomez N, Chen S, Schmidt EC. Polarization of hippocampal neurons with competitive surface stimuli: contact guidance cues are preferred over chemical ligands. J R Soc Interface. 2007;4:223–233. doi: 10.1098/rsif.2006.0171. [DOI] [PMC free article] [PubMed] [Google Scholar]
- 18.Gomez N, Lu Y, Chen S, Schmidt EC. Immobilized nerve growth factor and microtopography have distinct effects on polarization versus axon elongation in hippocampal cells in culture. Biomaterials. 2007;28:271–284. doi: 10.1016/j.biomaterials.2006.07.043. [DOI] [PubMed] [Google Scholar]
- 19.Gomez N, Schmidt EC. Nerve growth factor-immobilized polypyrrole: bioactive electrically conducting polymer for enhanced neurite extension. J Biomed Mater Res A. 2007;81:135–149. doi: 10.1002/jbm.a.31047. [DOI] [PMC free article] [PubMed] [Google Scholar]
- 20.Goslin K, Banker G. Experimental observations on the development of polarity by hippocampal neurons in culture. J Cell Biol. 1989;108:1507–1516. doi: 10.1083/jcb.108.4.1507. [DOI] [PMC free article] [PubMed] [Google Scholar]
- 21.Graham BP, van Ooyen A. Compartmental models of growing neurites. Neurocomputing. 2001;38–40:31–36. [Google Scholar]
- 22.Graham BP, van Ooyen A. Mathematical modelling and numerical simulation of the morphological development of neurons. BMC Neurosci. 2006;7(Suppl 1):S9. doi: 10.1186/1471-2202-7-S1-S9. [DOI] [PMC free article] [PubMed] [Google Scholar]
- 23.Hatten ME. Central nervous system neuronal migration. Annu Rev Neurosci. 1999;22:511–539. doi: 10.1146/annurev.neuro.22.1.511. [DOI] [PubMed] [Google Scholar]
- 24.Hely TA, Graham B, van Ooyen A. A computational model of dendrite elongation and branching based on MAP2 phosphorylation. J Theor Biol. 2001;210:375–384. doi: 10.1006/jtbi.2001.2314. [DOI] [PubMed] [Google Scholar]
- 25.Ito Y, Chen G, Imanishi Y. Micropatterned immobilization of epidermal growth factor to regulate cell function. Bioconjug Chem. 1998;9:277–282. doi: 10.1021/bc970190b. [DOI] [PubMed] [Google Scholar]
- 26.Kapur TA, Shoichet SM. Chemically-bound nerve growth factor for neural tissue engineering applications. J Biomater Sci Polym Ed. 2003;14:383–394. doi: 10.1163/156856203321478883. [DOI] [PubMed] [Google Scholar]
- 27.Kapur TA, Shoichet SM. Immobilized concentration gradients of nerve growth factor guide neurite outgrowth. J Biomed Mater Res A. 2004;68:235–243. doi: 10.1002/jbm.a.10168. [DOI] [PubMed] [Google Scholar]
- 28.Kiddie G, McLean D, van Ooyen A, Graham B. Biologically plausible models of neurite outgrowth. Prog Brain Res. 2005;147:67–80. doi: 10.1016/S0079-6123(04)47006-X. [DOI] [PubMed] [Google Scholar]
- 29.Kotwal A, Schmidt EC. Electrical stimulation alters protein adsorption and nerve cell interactions with electrically conducting biomaterials. Biomaterials. 2001;22:1055–1064. doi: 10.1016/s0142-9612(00)00344-6. [DOI] [PubMed] [Google Scholar]
- 30.Lambert de Rouvroit C, Goffinet MA. Neuronal migration. Mech Dev. 2001;105:47–56. doi: 10.1016/s0925-4773(01)00396-3. [DOI] [PubMed] [Google Scholar]
- 31.Lein PJ, Banker AG, Higgins D. Laminin selectively enhances axonal growth and accelerates the development of polarity by hippocampal neurons in culture. Brain Res Dev Brain Res. 1992;69:191–197. doi: 10.1016/0165-3806(92)90159-t. [DOI] [PubMed] [Google Scholar]
- 32.Letourneau PC. Chemotactic response of nerve fiber elongation to nerve growth factor. Dev Biol. 1978;66:183–196. doi: 10.1016/0012-1606(78)90283-x. [DOI] [PubMed] [Google Scholar]
- 33.Lu YB, Franze K, Seifert G, Steinhäuser C, Kirchhoff F, Wolburg H, Guck J, Janmey P, Wei EQ, Käs J, Reichenbach A. Viscoelastic properties of individual glial cells and neurons in the CNS. Proc Natl Acad Sci. 2006;103:17759–17764. doi: 10.1073/pnas.0606150103. [DOI] [PMC free article] [PubMed] [Google Scholar]
- 34.Matsuda T, Sugawara T. Development of surface photochemical modification method for micropatterning of cultured cells. J Biomed Mater Res. 1995;29:749–756. doi: 10.1002/jbm.820290611. [DOI] [PubMed] [Google Scholar]
- 35.Menager C, Arimura N, Fukata Y, Kaibuchi K. PIP3 is involved in neuronal polarization and axon formation. J Neurochem. 2004;89:109–118. doi: 10.1046/j.1471-4159.2004.02302.x. [DOI] [PubMed] [Google Scholar]
- 36.Miller C, Jeftinija S, Mallapragada S. Micropatterned Schwann cell-seeded biodegradable polymer substrates significantly enhance neurite alignment and outgrowth. Tissue Eng. 2001;7:705–715. doi: 10.1089/107632701753337663. [DOI] [PubMed] [Google Scholar]
- 37.Ming GL, Wong TS, Henley J, Yuan BX, Song JH, Spitzer CN, Poo MM. Adaptation in the chemotactic guidance of nerve growth cones. Nature. 2002;417:411–418. doi: 10.1038/nature745. [DOI] [PubMed] [Google Scholar]
- 38.Mogilner A, Rubinstein B. The physics of filopodial protrusion. Biophys J. 2005;89:782–795. doi: 10.1529/biophysj.104.056515. [DOI] [PMC free article] [PubMed] [Google Scholar]
- 39.Moore K, MacSween M, Shoichet M. Immobilized concentration gradients of neurotrophic factors guide neurite outgrowth of primary neurons in macroporous scaffolds. Tissue Eng. 2006;12:267–278. doi: 10.1089/ten.2006.12.267. [DOI] [PubMed] [Google Scholar]
- 40.Mueller BK. Growth cone guidance: first steps towards a deeper understanding. Annu Rev Neurosci. 1999;22:351–388. doi: 10.1146/annurev.neuro.22.1.351. [DOI] [PubMed] [Google Scholar]
- 41.Nishimura T, Kato K, Yamaguchi T, Fukata Y, Ohno S, Kaibuchi K. Role of the PAR-3-KIF3 complex in the establishment of neuronal polarity. Nat Cell Biol. 2004;6:328–334. doi: 10.1038/ncb1118. [DOI] [PubMed] [Google Scholar]
- 42.Norris CR, Kalil K. Guidance of callosal axons by radial glia in the developing cerebral cortex. J Neurosci. 1991;11:3481–3492. doi: 10.1523/JNEUROSCI.11-11-03481.1991. [DOI] [PMC free article] [PubMed] [Google Scholar]
- 43.Odde DJ, Tanaka ME, Hawkins SS, Buettner MH. Stochastic dynamics of the nerve growth cone and its microtubules during neurite outgrowth. Biotechnol Bioeng. 1996;50:452–461. doi: 10.1002/(SICI)1097-0290(19960520)50:4<452::AID-BIT13>3.0.CO;2-L. [DOI] [PubMed] [Google Scholar]
- 44.Pini A. Axon guidance. Growth cones say no. Curr Biol. 1994;4:131–133. doi: 10.1016/s0960-9822(94)00029-1. [DOI] [PubMed] [Google Scholar]
- 45.Rajnicek A, Britland S, McCaig C. Contact guidance of CNS neurites on grooved quartz: influence of groove dimensions, neuronal age and cell type. J Cell Sci. 1997;110(Pt 23):2905–2913. doi: 10.1242/jcs.110.23.2905. [DOI] [PubMed] [Google Scholar]
- 46.Rehfeldt F, Engler JA, Eckhardt A, Ahmed F, Discher ED. Cell responses to the mechanochemical microenvironment–Implications for regenerative medicine and drug delivery. Adv Drug Deliv Rev. 2007;59:1329–1339. doi: 10.1016/j.addr.2007.08.007. [DOI] [PMC free article] [PubMed] [Google Scholar]
- 47.Rogers SL, Letourneau CP, Palm LS, McCarthy J, Furcht TL. Neurite extension by peripheral and central nervous system neurons in response to substratum-bound fibronectin and laminin. Dev Biol. 1983;98:212–220. doi: 10.1016/0012-1606(83)90350-0. [DOI] [PubMed] [Google Scholar]
- 48.Schwamborn JC, Puschel WA. The sequential activity of the GTPases Rap1B and Cdc42 determines neuronal polarity. Nat Neurosci. 2004;7:923–929. doi: 10.1038/nn1295. [DOI] [PubMed] [Google Scholar]
- 49.Singer M, Nordlander HR, Egar M. Axonal guidance during embryogenesis and regeneration in the spinal cord of the newt: the blueprint hypothesis of neuronal pathway patterning. J Comp Neurol. 1979;185:1–21. doi: 10.1002/cne.901850102. [DOI] [PubMed] [Google Scholar]
- 50.Stoeckli ET, Landmesser TL. Axon guidance at choice points. Curr Opin Neurobiol. 1998;8:73–79. doi: 10.1016/s0959-4388(98)80010-x. [DOI] [PubMed] [Google Scholar]
- 51.Tessier-Lavigne M, Goodman SC. The molecular biology of axon guidance. Science. 1996;274:1123–1133. doi: 10.1126/science.274.5290.1123. [DOI] [PubMed] [Google Scholar]
- 52.Yamashita T, Tohyama M. The p75 receptor acts as a displacement factor that releases Rho from Rho-GDI. Nat Neurosci. 2003;6:461–467. doi: 10.1038/nn1045. [DOI] [PubMed] [Google Scholar]


