

Abstract
The measurement of nucleic acid polymerase elongation rates is often done via a lengthy experimental process involving radiolabeled substrates, quenched elongation experiments, electrophoretic product separation, and band quantitation. In this work we describe an alternative real-time stopped-flow assay for obtaining kinetic parameters for elongation of extended sequences. The assay builds on our earlier PETE assay designed for high-throughput screening purposes (Anal. Biochem. 365, 194-200) and relies of measuring how long it takes a polymerase to reach the end of a defined length template. Using poliovirus polymerase and self-priming hairpin RNA substrates with 6 to 26 nucleotide long templating regions, we demonstrate that the assay can be used to determine Vmax rates for elongation and apparent Km values for NTP utilization. Modeling the reaction kinetics as a series of irreversible steps allows us to numerically fit the entire time-based dataset by properly accounting for the temporal distribution of intermediate species. This enables us to determine average elongation rates over heterogeneous templating regions that mimic viral genome substrates. The assay is easily extendable to other RNA and DNA polymerases, can accommodate secondary structures in the template, and can in principle be used for any enzyme traversing along an extended substrate.
Keywords: polymerase, activity assay, fluorescence polarization, poliovirus, nucleic acid
Introduction
The replication of nucleic acids by polymerases is generally a multi-step process involving a nucleic acid binding event followed by several conformational changes that culminate in the formation of a processive elongation complex. The study of these reactions encompasses a multitude of experimental approaches, including rapid quench methods that follow primer utilization and product formation [1] and spectroscopic techniques to monitor kinetics of transcription complex formation, initiation, and elongation [2]. For example, the base analog 2-aminopurine is a fluorescence and circular dichroism probe that has been used to study elongation complex formation and transcription bubble structure via its sensitivity to base pairing and base stacking [3]. Elongation rates are often measured by product formation assays looking at extension of radiolabeled primers or bulk incorporation of radiolabeled nucleotides into products. Last, indirect methods of measuring elongation rates include the measurements of pyrophosphate release via colormetric product adducts [4; 5] or coupled enzymatic assays [4; 6].
Spectroscopic measurements of polymerase reactions involving low affinity complexes that do not recognize specific promoter sequences, such as those formed by many viral RNA-dependent RNA polymerases (RdRPs), are more challenging. In these cases, high concentrations of polymerase and/or nucleic acid are needed to drive formation of competent complexes. This in turn increases background absorption effects, particularly in the ultraviolet region of the spectrum where nucleic acid absorbance is high, compromising the utility of many assays. Measurements of viral RdRP elongation activity are thus often done by detecting 32P radiolabel incorporation using hetero or homopolymeric templates such as polyA RNA [7], or via the accumulation of full-length viral genome products as seen on gels [8]. Alternatively, highly detailed information about enzymatic mechanism and substrate dependencies can be obtained using short 32P labeled primers in quench experiments where reaction products are separated and quantified with single nucleotide resolution [9]. However, neither method is ideal for accurately measuring polymerase elongation rates on templates that reflect the heterogeneity and secondary structures naturally encountered by viral polymerases. Genome length template experiments lack single nucleotide resolution on gels and instead show a migrating smear of elongation products, while experiments using short radiolabeled primers suffer from quantitation issues due to weak bands arising from the ever increasing distribution species as the reaction proceeds to longer and longer products.
We previously demonstrated that short RNA hairpins labeled with a 5′ fluorescein molecule can be used as fluorescence anisotropy probes to detect RNA binding to poliovirus polymerase [10], thus providing a rapid assay for measuring this interaction in solution. We showed that the anisotropy signal was also sensitive to polymerase elongation activity because the fluorophore became immobilized when the 5′ end of the template strand came in contact with the polymerase surface. These observations lead to the development of the high-throughput screening compatible “PETE assay”, named for its use of self-priming hairpin “polymerase elongation template element” RNAs where changes in anisotropy signal could be used to identify small molecule inhibitors of both polymerase RNA binding and elongation activities [10].
In this work we further expand on these observations by using stopped flow methods to provide real-time detection of polymerase elongation activity on extended RNA templates. Curve fitting coupled with mathematical modeling of the multi-step reaction to account for the proper temporal distribution of species provides a fast, flexible, and accurate method for measuring polymerase elongation activity on a variety of substrates. The assay can be used to study reactions where the polymerase is provided in vast excess over the substrate RNA in order to drive the RNA binding equilibrium. Importantly, it is a single turnover experiment as far as the RNA template is concerned and the observed changes in signal only arise from actively elongating complexes. This eliminates quantitation artifacts from RNA molecules that were not elongated due to lack of binding, dissociation, or polymerase inactivation. Using poliovirus polymerase, we demonstrate that this method can be used to determine elongation rates and apparent Km values for NTPs over a wide range of temperatures and solution conditions.
Materials & Methods
Protein Expression & Purification
Poliovirus polymerase containing a C-terminal GSSS-6xHis tag was cloned into the pET26b-Ub-3D plasmid kindly supplied by Dr. Craig E. Cameron. The resulting plasmid, pET26b-UbDH, was transformed into E. coli strain BL21 PCG1 for expression where 3Dpol was initially produced as an ubiquitin fusion protein that was cleaved in vivo by a co-expressed ubiquitin-specific carboxyl terminal protease Ubp1 to produce full length polymerase with the native N-terminal glycine residue [11]. Proper proteolytic processing of the N-terminus is required to generate active enzyme [12]. Expression and purification were modified from protocols described previously for picornaviral polymerases [7; 11]. Cells were grown overnight in NZCYM medium with 25 ug/ml kanamycin, 20 ug/ml chloramphenicol, and 0.4% (w/v) d-glucose at room temperature to reach an OD600 of ≈1.0. 10 ml of the overnight culture was then used to inoculate 1 liter of NZCYM medium with 25 ug/ml kanamycin and 20 ug/ml chloramphenicol. The cells were grown at 37 °C to an OD600 of 0.6-0.8 and then cooled to room temperature, IPTG was added to a final concentration of 0.5 mM, and the cells were grown for an additional 12-18 hours. The cells were resuspended at 0.1 g/ml wet weight in a lysis buffer of 10 mM imidazole, 50 mM Tris, pH 8.0, 300 mM NaCl, 20% (v/v) glycerol, and 0.02% (w/v) NaN3 and lysed by passage through a M110-L microfludizer using a H10Z reaction chamber at 18,000 psi (Microfluidics Cort, Newton, MA). NP-40 was then added to a final concentration of 0.1% (v/v), and polyethylenimine (PEI) was then added slowly to 0.25% (v/v) over a 20-minute period to precipitate nucleic acid. The lysate was slowly stirred at 4 °C for additional 15 minutes and centrifuged for 40 minutes at 17,000 rpm in a Sorvall SS-34 rotor. The clarified lysate was loaded onto a nickel charged Chelating Sepharose Fast-Flow column (GE Healthcare), followed by step elution with 350 mM imidazole in 50 mM Tris, pH 8.0, 300 mM NaCl, 20% (v/v) glycerol, and 0.02% (w/v) NaN3. Fractions containing the polymerase were pooled and diluted to reduce the NaCl concentration to ∼0.11 M prior to loading onto a HiTrap Q HP column (GE Healthcare) and eluting with a linear gradient to 1 M NaCl in 25 mM Tris, pH 8.5, 20% (v/v) glycerol, 0.02% (w/v) NaN3. The pooled fractions were concentrated to ∼0.8 ml and run over a Superdex 200 gel filtration column (GE Healthcare) equilibrated in 200 mM NaCl, 20% (v/v) glycerol, 5 mM Tris, pH 7.5, 0.02% (w/v) NaN3. Pooled fractions were supplemented with TCEP to a final concentration of 5 mM, concentrated to ∼400 μM, flash frozen with liquid nitrogen, and stored at -80 °C in 10-20 μl aliquots. The extinction coefficient of 75875 M-1cm-1 was calculated based on the sequence using the ExPASy ProtParam program (http://www.expasy.ch/tools/protparam.html). Typical yield is 15-30 mg of pure protein per liter of bacterial culture.
RNA Oligonucleotides
5′ fluorescein labeled PETE (polymerase template elongation element) RNA oligonucleotides were obtained from Integrated DNA Technologies (www.idtdna.com), resuspended at 100 μM concentration in TE buffer (1 mM EDTA, 10 mM Tris, pH 8.0), and heated to 95°C for 5 minutes prior to snap cooling on ice to form the intramolecular hairpin structure (Figure 1). For experiments involving the use of infrared fluorescent dyes to image elongation products on gels, the RNA was synthesized with an amino group at the end of a six carbon linker attached to a deoxythymidine residue at the variable N position of the GNRA-type RNA tetraloop (i.e. GdTAA). The oligonucleotides were labeled with IRdye 800RS NHS ester (LI-COR Biosciences) in a buffer containing 200 mM Na2CO3/NaHCO3, pH 9.5, 12.5 mM EDTA for 2 hours at room temperature or overnight at 4°C. The RNA was then ethanol precipitated, resuspended in TE buffer, and any remaining unreacted label was removed via Biospin P6 columns (Bio-Rad). The labeling efficiency was determined by the the ratio of absorbances at 260 and 767 nm. Imaging of 15% polyacrylamide/7M urea gels containing these RNAs was done on a LI-COR Odyssey Infrared Imager 9120 instrument.
Fig. 1.
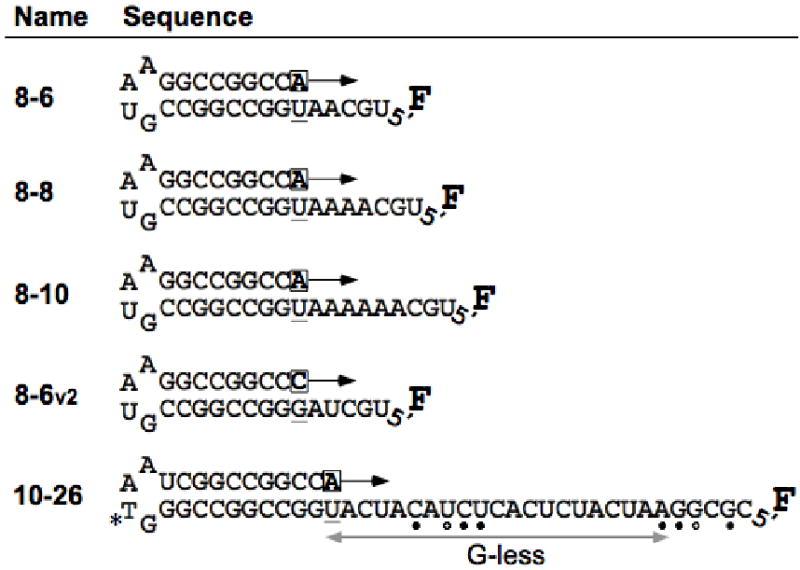
Schematic illustration of the hairpin RNA molecules used in this study. The PETE (polymerase elongation template element) oligonucleotides are named with an x-y convention where x is the length of the duplex stem and y is the length of the templating single stranded 5′ extension. All RNA molecules are labeled at their 5′ ends with fluorescein (F) attached to the terminal phosphate via a six carbon linker. Prior to the stopped-flow experiments, stalled elongation complexes are pre-assembled by incubating the RNA-polymerase complex with the first nucleotide tri-phosphate (boxed), i.e. the original RNA molecules have a 3′ cytosine. The 10-26 PETE is predicted to have a weak secondary structure due to a fold-back of the 5′ end that is stabilized by three canonical (●) and one G-U (○) base pair. Some experiments utilize 10-26 PETE synthesized with an amino linker modified deoxythymidine (*) base in the tetraloop that is then labeled with an infrared fluorescent dye.
Mass spectrometry analysis of oligonucleotide elongation products was done on a Bruker Ultraflex MALDI-TOF/TOF instrument. Elongation reactions containing 15 μM RNA, 20 μM 3Dpol, and 400 μM of each NTP and were quenched by addition of 5 mM EDTA, 3% acetonitrile, and 0.1% triethylammonium acetate. RNA from the mixture was isolated using C18 ZipTips per Millipore's standard nucleic acid purification protocol and the resulting samples were mixed with an equal volume of MALDI matrix solution (10 mg/ml 3-hydroxypicolinic acid, 1 mg/ml diammonium citrate), spotted onto target plates, and analyzed in negative ion mode.
Stopped Flow Experiments
Elongation reactions were carried out in an Applied Photophysics SX-20 Stopped Flow instrument where equal volumes of pre-formed 3Dpol-RNA elongation complex and NTP solutions were mixed to initiate the reaction. Fluorescence excitation was at 492 nm from a monochrometer source with bandwidth set to 9.3 nm and emission from fluorescein was detected using 515 nm high pass filters on both parallel and perpendicular polarizer channels. Total fluorescent (TF) and fluorescence anisotropy (FA) signals were calculated from the parallel and perpendicular polarization signals after background and G-factor correction, as per standard fluorescence methods [13]. In this paper we report anisotropy data instead of polarization data, as was done in our earlier paper on the microplate format PETE assay [10], because anisotropy is independent of total fluorescence.
Stable elongation complexes were assembled prior to the elongation reaction by pre-incubating 3Dpol with RNA and the first NTP for ∼30 min at room temperature to allow incorporation of the first nucleotide. This results in a complex whose slow dissociation rate constant of ∼8 hours [14] ensures that it could be diluted 10-20 fold to the working concentration of the stopped flow experiment and used over the course of a few hours without significant loss of elongation signal. The pre-incubation reactions were done at 22.5°C using 1 μM RNA, 16 μM polymerase, and 20 μM of the first NTP (usually ATP) in a reaction buffer of 75 mM NaCl, 50 mM HEPES, pH 6.5 (unless otherwise indicated), 1.5 mM MgCl2, and 5 mM TCEP. The pre-incubated mixture was diluted 20-fold in reaction buffer and stored on ice until it was loaded into the stopped flow instrument and allowed to temperature equilibrate for at least five minutes prior to data collection. The final solution measured in the stopped flow experiment after rapid mixing contains 25 nM RNA, 400 nM polymerase and 5–120 μM NTP in reaction buffer (plus an additional 500 nM ATP that is inherited from the dilution of the pre-incubation process). Experiments were done at 22.5°C unless otherwise indicated.
Steady state fluorescence data shown in Figure 7C&D were obtained on an Aviv ATF-105 fluorometer using identical buffer conditions to those in the stopped flow experiments. For sensitivity reasons, the pre-assembled elongation complexes were only diluted to a final concentration of 400 nM RNA, rather than the 25 nM used in the stopped flow experiments. Emission spectra were obtained using excitation at 492 nm, excitation spectra were obtained using emission at 515 nm, bandwidths were set to 1 nm on both channels, and spectra were background corrected by subtraction of a buffer spectrum. Partially elongated complexes were generated by adding 10 uM NTPs, which does not results in significant RNA dissociation over the timescale of these experiments, and full elongation was triggered by adding 400 uM NTPs and confirming that a stable end-point was reached after a few minutes of incubation.
Fig. 7.

pH and temperature dependencies observed in the kinetic PETE assay with 10-26 RNA and 120 μM each NTP. (A) Total fluorescence data showing a ≈2-fold reduction in signal amplitude at pH 7.5 as compared to pH 6.5 while the fluorescence anisotropy data (panel B) is not greatly affected. In the time dimension the shorter lag phase indicates that the elongation rate almost triples as a function of pH. (C,D) Steady state fluorescence excitation and emission spectra of stalled (solid), partially (grey), and fully (dashed) elongated complexes at pH 6.5 and 7.5. Data are from identical sample concentrations and intensities can be directly compared, demonstrating that while the absolute signal is higher at pH 7.5, there is a larger elongation-dependent change in the signal at pH 6.5. (E) Elongation rates as a function of incubation time of the stalled elongation complex at temperatures of 22.5, 30, and 37 °C. These data are summarized in Table 2. (F) Amplitudes of signal changes associated with terminal nucleotide additions for the same data as in panel E. The grey lines in panels E and F are simple linear curve fits to the data and the slopes (δ) shown in panel F corresponding to the loss of elongation signal as a function of incubation time. Panel F datasets were normalized to a Y-intercept of 1.0 and offset by 0.25 units each along the Y-axis for clarity.
Data Modeling and Fitting
Two different data analysis strategies were used to determine 3Dpol elongation rates on 10-26 PETE RNA. First, Kaleidagraph (Synergy Software) was use to fit only the increase in signal observed at the end of the elongation reaction to a simple inverted single exponential curve. The time of the intercept of this exponential with the lag-phase signal was then taken as a measure of the time needed to elongate through the single stranded region (Figure 5A). An average elongation rate, in nucleotide per second, was calculated by considering the length of the templating region and subtracting the five terminal nucleotides that do not contribute to the lag phase. However, there are two main problems with this approach. First, the initial concave upward portion of the signal increase must be omitted from the fitting because it displays a non-exponential curvature. This is due to the broad distribution of molecular species present at the end of the multi-step elongation reactions constituting the lag phase. Second, the terminal signal increase has significant contributions from two or three elongation steps (see below) and modeling part of it as a pure single exponential is therefore an approximation. Nonetheless, this simple interpretation procedure resulted in rates comparable to those obtained by the more detailed sequential reaction modeling described below.
Fig. 5.

Analysis of stopped flow data to determine elongation rates. (A) Simple analysis showing two independent single exponential curve fits to the initial signal decrease, attributed to secondary structure in 10-26 PETE, and the final signal increase due to terminal nucleotide addition. Elongation rate is determined by dividing the time of the curve intercept (circled) by the 21 nucleotides incorporated during the lag phase. (B) Full kinetic analysis by curve fitting an entire stopped flow dataset using the Berkeley Madonna software package. Experimental data is shown by the grey line and the curve fit to Eq. [1] is shown by the solid line. (C) Full kinetic analysis of data obtained at 37°C showing the loss of the initial signal decrease at higher temperature. The lower curves show the calculated temporal distribution of select elongation intermediates during the reaction, demonstrating the broadening of the distribution during the lag phase. The reaction is initiated with the stalled +1 complex and increase in the observed fluorescence signal corresponds to the accumulation of the +22 species, i.e. addition of the 5th nucleotide from the end of the template.
A more complete modeling of the data was carried out using the differential equation solver Berkeley Madonna (http://www.berkeleymadonna.com) [15]. We generated a model for the elongation phase as a series of sequential non-reversible reaction steps where each step corresponds to a single nucleotide incorporation cycle that is treated as an irreversible reaction. The same average elongation rate was used for all the elongation steps constituting the lag phase, while the rates for addition of the five terminal nucleotides were allowed to vary individually with their signal amplitudes fixed according to the data shown in Figure 4 and Table 1. The fluorescence signal was then fitted according to equation 1:
Fig. 4.

Stopped flow data showing relative amplitude changes of terminal nucleotide additions. (A) The 8-6_v2 PETE was elongated stepwise by mixing it with the appropriate nucleotide triphosphates as indicated in the figure. The relative values of the endpoint amplitudes were calculated for both total fluorescence and fluorescence anisotropy traces (not shown) and are listed in Table 1. The left panel is an expansion of the first five seconds of the data showing the similar initial curve behavior for all the reactions. Data were obtained with 10 μM each NTP at pH 7.0 in dual timebase mode with a higher sampling frequency during the first ten seconds of acquisition, and baseline corrected to a starting value of zero by subtracting the initial signal value. (B) Comparison of 8-6 PETE elongation data obtained in the presence of 100 μM and 400 μM each NTP showing the signal decrease observed at higher NTP concentrations. (C) Extended timecourse data showing the slow reduction in both total fluorescence and fluorescence anisotropy signals observed at high NTP concentrations.
Table 1. Relative Signals from Nucleotide Additions.
Final amplitudes of the post nucleotide incorporation signals associated with addition of the terminal nucleotides to the PETE templates. Values were obtained by averaging the end-point values of the data shown in Figure 4, were normalized to 1.0 for extension to the penultimate nucleotide, and were calculated for both the total fluorescence (TF) and fluorescence anisotropy (FA) data. Values after addition of 1st nucleotide from the end, i.e. run-off elongation, are approximate because the process is quite slow at low NTP concentrations.
| Position from 5′ end | TF Amp | FA Amp |
|---|---|---|
| 6th | 0.0 | 0.0 |
| 5th | 0.27 | 0.16 |
| 4th | 0.62 | 0.26 |
| 3rd | 1.04 | 0.41 |
| 2nd | 1.00 | 1.00 |
| 1st | ≈0.25 | ≈0.25 |
| [Eq. 1] |
where fi represents the fraction of each species i at each point in the elongation reaction, ai corresponds to the fractional signal amplitude associated with that particular species, and the A0 scaled exponential term accounts for a temperature dependent initial decrease in the signal that we observed for the 10-26 PETE. In practice, the amplitudes of all the species prior to the 5th nucleotide from the end of the template strand are set to zero such that the baseline value reflects the lag phase signal and the amplitudes associated with addition of each of the five terminal nucleotides were fixed at the values derived from the data in Figure 4A and listed in Table 1. Note that this is an approximation because the terminal nucleotides of 10-26 PETE differ from those of 8-6v2 PETE used to determine the amplitudes. However, in practice we do not see a significant effect on the lag phase elongation rate as a result of slight variations (±10% of total amplitude change) in the amplitudes associated with the individual terminal nucleotide additions.
Kinetic Parameter Determination
To determine the polymerase maximal elongation rate, Vmax (in units of nucleotides per second), and apparent Km values for NTP utilization we plotted the observed elongation rates as a function for NTP concentration and fit the data to a Michaelis-Menten type dependence of
| [Eq. 2] |
The use of apparent Km nomenclature reflects that this is not derived from a true steady-state experiment, although it is a multiple turnover experiment with respect to NTP utilization by the polymerase. Unless otherwise indicated, all NTPs were present in equimolar amounts at the stated concentration for each NTP. The total NTP concentration is thus up to four times higher depending on which nucleotides are included in a particular reaction.
Results
Template length dependent lag phase
To demonstrate the template length dependence of the assay we used a series of PETE molecules whose template lengths increase from 6 to 8 to 10 nucleotides via the insertion of multiple adenosines while the sequence of the 5′ terminal nucleotides is unchanged (Figure 1). The elongation traces from the 8-6, 8-8, and 8-10 PETEs show a RNA length dependent lag phase followed by a length independent signal increase (Figure 2). We interpret the lag phase as reflecting the time needed for elongation through the initial part of the templating region and the final signal increase as being associated with the polymerase reaching the end of the template strand. Because the 3Dpol-RNA complexes were pre-incubated with the first NTP to form the stalled +1 elongation complexes prior to the stopped flow experiment, these data reflect elongation starting with the 5th, 7th, and 9th nucleotide from the end of the template. The immediate increase in the total fluorescence (TF) signal from the 8-6 PETE (Figure 2A) indicates that the change in fluorescence begins with incorporation of a base opposite the 5th nucleotide from the end of the template strand. Interestingly, fluorescence anisotropy (FA) data, collected simultaneously, shows only a small immediate change, with most of the FA change resulting from the addition of later nucleotides (Figure 2B). The coincident increases of the TF and FA signals with micro-steps of distinct amplitudes indicate that both signals report on the same elongation steps with different sensitivities, as discussed in more detail below.
Fig. 2.

Stopped flow elongation data for the 8-6, 8-8, and 8-10 PETE constructs showing the template length dependent lag phase prior to the signal increase associated with terminal nucleotide additions. Data were obtained at pH 7.0 and 20 μM each NTP. (A) Total fluorescence (TF) data and (B) fluorescence anisotropy (FA) data that both show the effect but with different curve shapes. (C) Direct comparison of the TF and FA data for the 8-6 and 8-8 PETEs showing how the TF signal change runs slightly ahead of the change in the FA signal. For all panels, the data for each trace were normalized to a total amplitude change of 1.0 and the individual traces were offset along the Y-axis for clarity.
Elongation of longer RNA molecules was examined using extended “G-less” templating sequences that did not contain guanosine in order to minimize the potential for secondary structure formation. Data from 10-26 PETE showed an extended lag phase as compared to the 8-n series of templates and this lag is again followed by a final signal increase (Figure 3A). The timescale and amplitude of this final increase are similar to those seen with the shorter RNAs. The 10-26 PETE contains a “GGCGC” sequence at the 5′ end of the template that allows us to stall the elongation complex by simply omitting CTP from the reaction. The data in Figure 3A shows that the signal increase is indeed dependent on the addition of the five terminal nucleotides and does not occur in the absence of CTP. The proper pausing of the polymerase was verified by examining the products of the elongation reaction by polyacrylamide gel electrophoresis and by mass spectrometry (Figure 3B-C). For these experiments, the 10-26 PETE was also labeled with an infrared dye (LI-COR IRdye 800RS) attached at the variable N position of the GNRA tetraloop. Staining the gel for RNA using Stains-All dye showed two bands corresponding to unlabeled and IRDye labeled RNA, reflecting ≈40% labeling efficiency. Imaging the gel by infrared fluorescence showed a single band that was elongated upon addition of ATP, GTP, and UTP, and a shift of this band to a faster migrating species upon addition of CTP to fully elongate the RNA (Figure 3B). The extent of elongation in the absence and presence of CTP was verified by mass spectrometry showing the expected mass peaks (Figure 3C), indicating that the faster migrating band does indeed correspond to fully elongated RNA. We attribute the faster gel migration of this band to increased stability of the fully elongated duplex that is not completely denatured in the 7M urea gel.
Fig. 3.
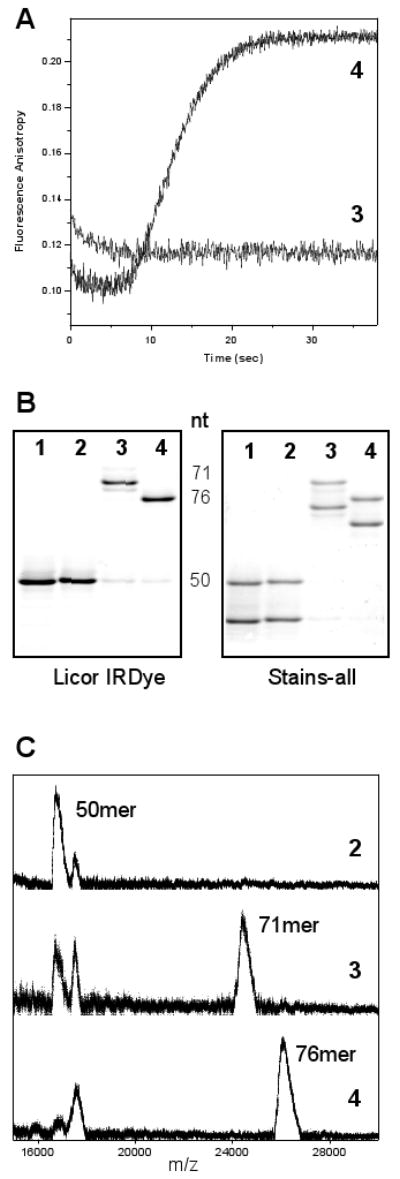
Verification that the observed fluorescence increase is associated with terminal nucleotide addition. Samples are from the following four reactions: 1:RNA only 2:RNA + polymerase 3: RNA + polymerase + ATP/UTP/GTP 4: RNA + polymerase + all four NTPs. (A) Stopped flow data from 10-26 PETE in the absence (3) and presence (4) of CTP, which is required to elongate to the end of the template (see Figure 1). (B) Electrophoresis analysis of the RNA in reactions 1-4 showing that the fully elongated RNA (4) migrates faster than the RNA missing the terminal five bases (3). The image of the same gel treated with Stains-all dye shows two bands reflecting the ≈40% IRdye labeling efficiency. (C) Mass spectrometry data verifying the molecular weights of the RNAs in reactions 2-4. The doublet in the starting material reflects the added mass of the IRdye and we consistently failed to see significant MALDI-TOF signals from the elongated form of the IRdye labeled RNA.
Both the IRdye labeled and unlabeled 10-26 PETE substrates were efficiently elongated by 3Dpol as shown by the Stains-All treated gel, indicating that the presence of the IRdye in the tetraloop does not interfere with substrate utilization. Similarly, 3Dpol rate determination experiments showed that the elongation rate is not affected by the introduction of the dT-C6 substitution in the tetraloop or by labeling this site with the IRdye (data not shown). Notably, using tetraloop labeling with the sensitive IRdye allows us to in the future carry out parallel electrophoresis and gel imaging analysis of elongation products from the stopped flow (or alternatively quenched flow) reaction mixtures without using radioactivity.
The fluorescein detected elongation of the 10-26 PETE was accompanied by a small signal decrease during the initial portion of the lag phase that was not seen with the shorter 8-6, 8-8, and 8-10 PETEs, as seen by comparing the data in Figures 2A and 3A. In our data analysis we could effectively model this decrease with a single exponential term (Eq. 1) and the rate of this exponential was observed to increase with increasing NTP concentrations in proportion to the measured changes in polymerase elongation rates. The amplitude of the initial signal change is also diminished in 10-26 PETE data collected at higher temperatures (Figure 5A & B and Table 2, see below). We attribute this initial decrease to disruption of a weak secondary structure interaction in the 10-26 PETE whereby the “AGG” sequence at the 5′ end of the RNA folds back on the single stranded template to basepair with the “UCU” sequence that is 7-9 nucleotides downstream of the priming site (see Figure 1).
Table 2. Elongation Rate Temperature Dependence.
| Parameter | 22.5°C | 30°C | 37°C |
|---|---|---|---|
| Exponentials analysis (Figure 5A) | |||
| Lag phase (nt/sec) | 9.2 ±0.1 | 25.3 ±0.1 | 55.2 ±0.5 |
| Terminal phase (k,sec-1) | 1.32 ±0.04 | 2.8 ±0.1 | 5.8 ±0.3 |
| Kinetic Modeling Analysis (Figures 5B & 7C) | |||
| Lag phase (nt/sec) | 9.0 ±0.2 | 23.9 ±0.4 | 51.5 ±0.9 |
| 5th from end (nt/sec) | 1.8 ±0.3 | 4.2 ±0.8 | 8.5 ±0.9 |
| 4th from end (nt/sec) | 2.0 ±0.4 | 4.2 ±0.7 | 11 ±3 |
| 3rd from end (nt/sec) | 2.5 ±0.3 | 5.2 ±0.4 | 16 ±5 |
| Lag:Avg_terminal a | 4.3 ±0.4 | 5.3 ±0.5 | 4.4 ±0.7 |
| Initial exponential signal decrease | |||
| Amplitude (% total ΔTF) | 29 ±2% | 22 ±3% | 8 ±4% |
| Rate_constant (k, sec-1) | 1.4 ±0.3 | 5.3 ±2.5 | 6.7 ±2.7 |
| Lag:Rate_constant ratio b | 6.4 ±1.4 | 4.5 ±2.1 | 7.7 ±3.1 |
Data are from experiment summarized in Figure 7C & D.
Ratio of lag phase rate to average rate for adding the 5th, 4th, and 3rd terminal nucleotides
Ratio of lag phase elongation rate to the rate constant of the exponential decrease
Amplitudes associated with terminal additions
The elongation dependent signal increase can be seen in both the fluorescence anisotropy (FA) and total fluorescence (TF) data traces, but with slightly different time dependencies such that the change in the TF signal runs slightly ahead of that in the FA signal (Figure 2C). The TF signal change from 8-6 PETE (pre-incubated with ATP, the first nucleotide) exhibits fairly normal exponential characteristics without a lag phase, indicating that the majority of the TF change occurs upon addition of the first one or two nucleotides. The FA signal, on the other hand, is obviously not a single exponential and instead exhibits bi- or tri-phasic behavior indicating that multiple elongation steps contribute to the signal increase.
To further define the amplitudes associated with the different elongation steps, the NTPs involved in the elongation reaction were added stepwise to the 8-6v2 PETE and the final signal plateau values associated with the individual elongation steps were determined (Figure 4, Table 1). These data show that the majority of the total fluorescence change is associated with the addition of the 5th, 4th, and 3rd nucleotides from the 5′ end of the template. The anisotropy change, on the other hand, is more sensitive to the addition of the 4th, 3rd, and 2nd nucleotides from the end. At NTP concentrations of 100 μM or less we observe a stable end-point value following NTP addition, suggesting that the addition of the terminal nucleotides is quite slow and that the polymerase does not fully elongate the RNA and run off the end of the template (Figure 4A & B). However, at nucleotide concentrations above ≈200 μM we consistently observe a final decrease in both the FA and TF signals that is likely due to dissociation of the complex as a result of run-off elongation (Figure 4B & C).
Lag Time Determination
The presence of the template length dependent lag phase allows us to determine a polymerase elongation rate by determining how much time is needed for the elongation reaction. The simplest method whereby we analyzed the data was to fit the post-lag signal increase to an inverted single exponential with an added linear component. In this curve fit, the early portion of the exponential was omitted because it has the incorrect curvature. By fixing the starting Y-value of the exponential at the lag phase signal level, we could numerically curve fit the data to obtain the starting time of the exponential as the time of the intercept with the lag phase (Figure 5A). To determine the polymerase elongation rate in nucleotides per second, the fitted lag time was simply divided by the number of nucleotides constituting the lag phase of the RNA. While this approach is clearly an approximation of the elongation reaction signal that at times did not ideally fit the data, it nonetheless proved to be quite useful and fairly reliable because of the limited number of parameters involved in the fitting routine. The rates determined by this simple method were within ≈5% of those determined by the more explicit modeling method described below (Table 2).
Modeling of Elongation Data
A more thorough analysis of the data was done using the program Berkeley Madonna [15] to model the entire elongation reaction dataset as a series of non-reversible steps (Figure 5B). For example, elongation of the 10-26 PETE involves pre-assembly of the +1 complex (i.e. first NTP added) prior to data collection, and then the stopped-flow data were fitted to a model where the first 20 steps after the first NTP addition (i.e. formation of +2→+21 species) resulted in no signal change during the lag phase, while the next four steps (+22→+25) yielded fluorescence anisotropy increases corresponding to 16, 26, 41, and 100% of the observed overall signal change (Table 1). The final elongation step to the +26 product was generally very slow and only observed at the highest NTP concentrations (Figure 4B). It was accompanied by an anisotropy signal decrease to a fitted final value that is ≈25% of the overall signal increase and we attribute this to dissociation of the 3Dpol-RNA complex (Figure 4C).
Modeling the full multi-step kinetic pathway of the elongation reaction has the advantage of allowing us to calculate the full temporal distribution of intermediate species as the reaction proceeds. Combined with knowledge of the signal amplitudes associated with each of the intermediate species, this allows us to calculate the total signal observed at any time during the elongation reaction. The data for the initial concave upwards (i.e. convex) portion of the signal increase could now be included in the analysis, resulting in a better determination of the lag phase elongation rate. This curvature is directly related to the temporal distribution of the +22 species corresponding to the first elongation intermediate that produces an observable signal change.
Elongation experiments were carried out over a range of NTP concentrations (Figure 6A) and the polymerase elongation rates were determined by directly fitting the data with Berkeley Madonna, as per Figure 5B. These data show Michaelis-Menten type dependence for the elongation rate and were analyzed to determine enzyme kinetics parameters (Figure 6B), resulting in an apparent Km value of 21±2 μM and a Vmax of 3.0±0.1 nucleotides per second at 22.5°C and pH 6.5. Elevating the temperature to 25°C increases the Vmax to 4.4±0.1 nt/sec without much of an effect on the Km,app (19±2 μM).
Fig. 6.

Determination of Michaelis-Menten parameters for polymerase elongation. (A) Stopped flow data traces from 10-26 PETE obtained at 22.5°C, pH 6.5, with NTP concentrations of 5, 10, 15, 30, 50, 80, and 120 μM each. (B) Michaelis-Menten plot of the elongation rates obtained from the Berkeley Madonna analysis vs. NTP concentration. The lag phase data is of the single average elongation rate obtained from the fit and the terminal nucleotide rates are the average of the 5th, 4th, and 3rd nucleotide additions from the end of the template. Vmax and apparent Km values from fitting data obtained at different temperatures are listed in the text and Table 2.
The results of this fitting also show that the rates of addition of the terminal nucleotides are ≈5 fold slower than the average rate observed for the lag phase elongation events (Figure 6B, Table 2). Consistent with this, the total time needed for the terminal signal increase that involves the addition of only five nucleotides is roughly the same as the time needed for the 20 additions that take place during the lag phase. This effect is possibly due to the presence of the 5′ terminal fluorescein label and its six-carbon long linker that may perturb 3Dpol-RNA interactions as the polymerase approaches the 5′ end of the template strand. However, it is also possible that there is an end-effect whereby the elongation rate is reduced due to loss of 3Dpol-RNA contacts. Regardless of origin, this slowing of the polymerase is quite useful for the PETE assay because it leads to an accumulation of elongation intermediates at the +22 step, resulting in better measurements of the elongation rate based on the temporal distribution of species at the end of the lag phase (Figure 5B).
pH and Temperature Dependence
Changing the reaction pH has two effects on the kinetic PETE assay data. First, the elongation rate of 3Dpol is pH sensitive, increasing ≈4-fold from 3 to 12 nt/sec when increasing the pH from 6.5 to 7.5. Second, the magnitude of the total fluorescence signal change is reduced ≈2-fold at higher pH values, while the fluorescence anisotropy change is relative unchanged (Figure 7A&B). The steady state fluorescence spectra obtained from pre-incubated, partially elongated (10 uM NTP), and fully elongated (400 uM NTP) complexes show higher initial fluorescence intensity at pH 7.5, but larger elongation-dependent intensity changes at pH 6.5 (Figure 7 C&D). Based on these observations, we attribute the elongation dependent increase in the total fluorescence signal to a deprotonation of the fluorescein label as it approaches the positively charged surface of the polymerase. At the higher pH values a larger portion of the fluorescein molecules are already deprotonated, reducing the signal change associated with elongation dependent deprotonation. The anisotropy signal change, on the other hand, is primarily due to restricted molecular motion as the end of the RNA comes in contact with the polymerase, which is not significantly affected by a change in pH. Finally, complete elongation of the template using high NTP concentrations results in a signal decrease at both pH values. This likely due to run-off elongation followed by quenching resulting from the fluorescein molecule stacking on the end of the now blunt-ended RNA duplex and/or interacting with the newly added 3′ terminal guanosine residue [16; 17; 18].
The previously described experiments were all carried out at 22.5°C in order to minimize thermal inactivation of the polymerase [14] and maximize the stability of the stalled +1 elongation complex that was pre-assembled prior to the stopped flow experiments. To demonstrate the stability and reproducibility of the assay at elevated temperatures, we carried out a series of reactions where elongation from the same +1 elongation complex mixture was triggered every minute over a ≈20 minute time span spent at elevated reaction temperatures. As shown by the pH 7.5 data in Figure 7E, we observe consistent elongation rates at 22.5°C, 30°C, and 37°C that do not show any systematic time dependent decrease in activity. However, there is a steady time dependent decrease in the amplitude of the observed signal change that is more notable at the higher temperatures, as judged by a linear extrapolation of the data (Figure 7F). We attribute this signal loss to decreased stability of the elongation complex at higher temperatures, resulting in fewer RNA molecules being elongated after longer incubation times and thus reducing the amplitude of the fluorescence signal change. We do not see the full exponential behavior of the signal loss in this 20-minute window because the poliovirus 3Dpol elongation complex is very stable with a half-life on the order of several hours [14]. Importantly, the measured elongation rates arise only from complexes that remain active and they are not affected by the loss of competent elongation complexes due to thermal inactivation.
Discussion
Studies of RNA dependent RNA polymerase elongation rates generally fall into one of two categories. The first involves the addition of one or a few nucleotides to a short primer strand using rapid quench flow experiments followed by band separation and quantification via gel electrophoresis methods [9]. These experiments are typically highly quantitative and can provide significant insight into the catalytic mechanism and the rates of different steps within one cycle of nucleotide incorporation. At the other end of the spectrum, studies focus on the time needed to generate full-length viral RNA genomes, a process that involves the synthesis of 7,500-12,000 base pairs [8]. These experiments provide more biologically relevant data about how a given wildtype or mutant polymerase replicates a complete viral genome, including any secondary structures or other control elements that may be present therein.
In this work, we have devised an assay that bridges the gap between these two methods by providing quantitative biochemical information about polymerase elongation rates on extended RNA substrates. The assay relies on measuring the time needed for the polymerase to reach the very end of the templating strand, giving us complete freedom to change the sequence and secondary structure of the template without affecting the utility of the assay. Importantly, it is a real time assay that provides a direct measure of enzyme translocation time and the primary data are analyzed without the need for quenching of samples and subsequent product separation and analysis by other means. It is also solution based with a visible spectrum fluorophore label, allowing us to vary temperature, buffer composition, and other biochemical conditions with minimal concerns about background absorbance effects that could interfere with the assay.
Using the PETE assay, we have been able to measure poliovirus 3Dpol elongation rates at multiple temperatures and pH values. The kinetic parameters obtained via the PETE assay for active elongation complexes reflect an elongation rate of ≈50 nucleotides per second at 37°C based on data obtained at 120 μM each NTP (Figure 7E). Intracellular NTP concentrations vary by NTP and cellular milieu, but have been estimated at 200-500 μM or more [19], which would result in predicted elongation rates of 70-80 nt/sec based on a ≈20 μM Km for NTP utilization. Consequently, the full length 7500 nucleotide poliovirus genome could be replicated in less than 100 seconds, which is similar to the estimate made based on single nucleotide incorporations studies [14]. The ≈20 μM apparent Km values obtained using the PETE assay are also consistent with the 15-45 μM values obtained for poliovirus 3Dpol on various homopolymeric templates [20].
The interpretation of the elongation data from the kinetic PETE assay is very straightforward since only active elongation complexes contribute to the observed signal increase. During the actual the stopped flow elongation time the protein and RNA are present at fairly low concentrations of 400 and 25 nM, respectively, and in 75 mM salt there is then not sufficient time for any unbound RNA to form new 3Dpol complexes. Furthermore, any pre-existing 3Dpol-RNA complexes that had not yet pre-incorporated the first nucleotide and adopted the fully active elongation complex conformation will not significantly affect the data because incorporation of the first nucleotide is very slow [14]. The elongation rates measured in this PETE assay are also not affected by thermal inactivation of the polymerase (Figure 7E), which is problematic for single nucleotide incorporation studies [14].
The kinetic PETE assay provides an excellent method for studying elongation of longer heterogeneous templates that can mimic natural substrates by measuring an average elongation rate over the template sequence up to the 5th nucleotide from the 5′ end of the template. However, the measurement of an average rate means the assay is inherently not suitable for high precision single nucleotide incorporation studies. While it may be tempting to use the assay to measure single nucleotide addition rates based on the different signal amplitudes associated with incorporation of the terminal nucleotides, as per Figures 1 & 4 and Table 1, the rates of these events are ≈5-fold slower than the lag phase extension rates. We do not yet definitively know the source of this slowdown, which could be due to non-native interactions between the polymerases and the fluorescein label or be an inherent feature of the polymerase due to a loss of polymerase-RNA interactions (direct or electrostatic) as the enzyme nears the end of the template. This should be addressed with future quench-flow studies and product analysis prior to making functional interpretations of the rates associated with the terminal nucleotide additions obtained by this kinetic PETE assay.
The PETE elongation experiments are a combination of single-turnover experiments for the RNA and a multiple-turnover experiment for the nucleotide incorporation activity of the polymerase. The length of the lag phase and rate of the terminal signal increase are both dependent on polymerase elongation rate, and thus NTP concentration. The overall amplitude of the signal increase, on the other hand, merely reflects the number of RNA molecules that were elongated, i.e. the concentration of active elongation complexes, and is not affected by rate. Any inactive elongation complexes or any unbound RNA will produce a constant signal during the elongation phase that contributes to the observed baseline value of the lag phase, but this does not affect the timing of the signal increase associated with terminal nucleotide addition. The timing of that increase is dependent on incorporation of the 5th nucleotide from the 5′ end of the template, as shown using the 10-26 PETE (Figure 3A). Stalling the elongation complex just prior to adding the 5th nucleotide from the end by omitting CTP results in no fluorescence increase, but adding all four NTPs to fully elongate the RNA does yield a signal increase.
Significant changes are seen in both fluorescence anisotropy and total fluorescence signals, and either dataset can be used to numerically fit the elongation time course provided the proper amplitude factors are used (Figure 4, Table 1). A further analysis of the signal amplitudes associated with stepwise additions of individual nucleotides near the 5′ end shows that the change in total fluorescence precedes the change in fluorescence anisotropy by about one nucleotide (Figure 2C). Most of the TF change is due to addition of the 4th and 3rd nucleotides from the end that together provide ≈77% of the total amplitude change, while the change in FA is most sensitive to the 3rd and 2nd nucleotides that account for ≈74% of the signal. The amplitude of the TF signal is quite pH dependent and decreases with higher pH (Figure 7A), while the FA signal is largely unaffected by pH (Figure 7B). Fluorescein emission is pH dependent due its exocyclic hydroxyl group (pK ≈6.4) whose deprotonation results in a significant fluorescence increase [13], as observed for our stalled elongation complexes (Figure 7C&D). In the PETE assay, the increased TF signal associated with the terminal nucleotide additions is likely due to the stabilization of the negatively charged deprotonated state by proximity to the positively charged polymerase surface. This effect would be diminished at higher pH values because a larger portion of the fluorescein is already deprotonated in solution, consistent with our observations of smaller elongation dependent changes in steady state fluorescence at the higher pH (Figure 7C&D). The fluorescence anisotropy signal, on the other hand, is primarily sensitive to restricted molecular motion as the elongating polymerase approaches and immobilizes the end of the template strand, which should not be significantly affected by pH because the protein structure is not dramatically changed. There will be some minor effect on the anisotropy arising from the change in fluorescence lifetime between the two protonation states [13], consistent with the small difference observed for the FA amplitude change.
At high NTP concentrations where we see complete elongation of the RNA by gel and mass spectrometry analysis, we also observe a decrease in both total fluorescence and fluorescence anisotropy signals. The likely source of these signal decreases is stacking and quenching interactions between the fluorescein dye and the newly generated blunt ended RNA duplex [17; 18] following run-off elongation that results in dissociation of the RNA from the polymerase. The estimated run-off rate constant based on the data in Figure 4C is 0.008 sec-1 at 400 uM NTPs, which is similar to the 0.001 sec-1 value previously observed for 3Dpol at 200 uM NTPs [14].
In this work we intentionally used templates designed to be single stranded by virtue of omitting guanosine nucleotides to limit base pairing potential, but this is by no means a limitation of the assay. In designing the 10-26 PETE that could be paused at the 6th nucleotide from the end of the template by omitting CTP, we inadvertently generated a weak secondary structure potential involving the 5′ end folding back on the template strand (Figure 1). This resulted in the data showing an immediate initial signal decrease as the polymerase disrupted this structure early in the elongation reaction. Building on this idea, PETE templates could be designed to include specific sections of secondary structure such that the mobility of the 5′ end is initially restricted at the end of a duplex helix, becomes more flexible as the polymerase disrupts this duplex and makes the 5′ end single stranded, and then finally becomes less flexible as the polymerase reaches the 5′ end itself. This would result in a data trace showing a lag phase followed by a signal decrease that is in turn followed by the terminal signal increase, providing multiple inflection points that can be used to numerically fit multiple elongation rates. Importantly, elongation through all these template sections could be observed and measured in a single experiment, allowing for very precise measurements of polymerase elongation rates through specific nucleotide sequence motifs or RNA secondary structures.
Finally, the methodology behind the PETE assay is not limited to RNA-dependent RNA polymerases, but can also be applied to any polymerization reaction where a macromolecule approaches and inhibits the motional flexibility at the end of a defined length template. It can easily be adapted to DNA polymerase or reactions primed with a bimolecular primer/template duplex rather than the unimolecular hairpin structures used in our experiments. The assay does require the pre-formation of a poised or stalled elongation complex such that there is a synchronous initiation of elongation from a defined start site. Having a prior slow step in the stopped-flow experiment itself (e.g. RNA binding) would not be compatible with the assay, although it may in some cases be possible to model such events if the relative reaction rates have comparable time scales and/or are associated with distinct changes in signal.
In closing, we have herein presented a kinetic format for the PETE assay that was initially characterized as a high-throughput screening assay for viral polymerases [10]. The kinetic PETE assay provides a rapid and accurate method for evaluating polymerase elongation activity on a variety of templates and under a variety of experimental conditions and is readily extensible to other polymerase systems.
Acknowledgments
This work was supported by National Institutes of Health grant R01-AI059130 to O.B.P.
References
- 1.Johnson KA. Rapid quench kinetic analysis of polymerases, adenosinetriphosphatases, and enzyme intermediates. Methods Enzymol. 1995;249:38–61. doi: 10.1016/0076-6879(95)49030-2. [DOI] [PubMed] [Google Scholar]
- 2.Patel SS, Bandwar RP. Fluorescence methods for studying the kinetics and thermodynamics of transcription initiation. Methods Enzymol. 2003;370:668–86. doi: 10.1016/S0076-6879(03)70055-X. [DOI] [PubMed] [Google Scholar]
- 3.Datta K, Johnson NP, von Hippel PH. Mapping the conformation of the nucleic acid framework of the T7 RNA polymerase elongation complex in solution using low-energy CD and fluorescence spectroscopy. J Mol Biol. 2006;360:800–13. doi: 10.1016/j.jmb.2006.05.053. [DOI] [PubMed] [Google Scholar]
- 4.Johnson RS, Strausbauch M, Cooper R, Register JK. Rapid kinetic analysis of transcription elongation by Escherichia coli RNA polymerase. J Mol Biol. 2008;381:1106–13. doi: 10.1016/j.jmb.2008.06.089. [DOI] [PubMed] [Google Scholar]
- 5.Upson RH, Haugland RP, Malekzadeh MN, Haugland RP. A spectrophotometric method to measure enzymatic activity in reactions that generate inorganic pyrophosphate. Anal Biochem. 1996;243:41–5. doi: 10.1006/abio.1996.0479. [DOI] [PubMed] [Google Scholar]
- 6.Barnett RE. Effect of monovalent cations on the ouabain iniibition of the sodium and potassium ion activated adenosine triphosphatase. Biochemistry. 1970;9:4644–8. doi: 10.1021/bi00826a004. [DOI] [PubMed] [Google Scholar]
- 7.Campagnola G, Weygandt M, Scoggin K, Peersen O. Crystal structure of coxsackievirus B3 3Dpol highlights the functional importance of residue 5 in picornavirus polymerases. J Virol. 2008;82:9458–64. doi: 10.1128/JVI.00647-08. [DOI] [PMC free article] [PubMed] [Google Scholar]
- 8.Barton DJ, Flanegan JB. Synchronous replication of poliovirus RNA: initiation of negative-strand RNA synthesis requires the guanidine-inhibited activity of protein 2C. J Virol. 1997;71:8482–9. doi: 10.1128/jvi.71.11.8482-8489.1997. [DOI] [PMC free article] [PubMed] [Google Scholar]
- 9.Arnold JJ, Cameron CE. Poliovirus RNA-dependent RNA polymerase (3Dpol): pre-steady-state kinetic analysis of ribonucleotide incorporation in the presence of Mg2+ Biochemistry. 2004;43:5126–37. doi: 10.1021/bi035212y. [DOI] [PMC free article] [PubMed] [Google Scholar]
- 10.Mestas SP, Sholders AJ, Peersen OB. A fluorescence polarization-based screening assay for nucleic acid polymerase elongation activity. Anal Biochem. 2007;365:194–200. doi: 10.1016/j.ab.2007.03.039. [DOI] [PMC free article] [PubMed] [Google Scholar]
- 11.Gohara DW, Ha CS, Kumar S, Ghosh B, Arnold JJ, Wisniewski TJ, Cameron CE. Production of “authentic” poliovirus RNA-dependent RNA polymerase (3D(pol)) by ubiquitin-protease-mediated cleavage in Escherichia coli. Protein Expr Purif. 1999;17:128–38. doi: 10.1006/prep.1999.1100. [DOI] [PubMed] [Google Scholar]
- 12.Thompson AA, Peersen OB. Structural basis for proteolysis-dependent activation of the poliovirus RNA-dependent RNA polymerase. Embo J. 2004;23:3462–71. doi: 10.1038/sj.emboj.7600357. [DOI] [PMC free article] [PubMed] [Google Scholar]
- 13.Lakowicz JR. Principles of Fluorescence Spectroscopy. Springer Science+Business Media, LLC; 2006. [Google Scholar]
- 14.Arnold JJ, Cameron CE. Poliovirus RNA-dependent RNA polymerase (3D(pol)). Assembly of stable, elongation-competent complexes by using a symmetrical primer-template substrate (sym/sub) J Biol Chem. 2000;275:5329–36. doi: 10.1074/jbc.275.8.5329. [DOI] [PubMed] [Google Scholar]
- 15.Macey R, Oster G, Zahnley T. Berkeley Madonna User's Guide. University of California; 2000. http://www.berkeleymadonna.com. [Google Scholar]
- 16.Nazarenko I, Pires R, Lowe B, Obaidy M, Rashtchian A. Effect of primary and secondary structure of oligodeoxyribonucleotides on the fluorescent properties of conjugated dyes. Nucleic Acids Res. 2002;30:2089–195. doi: 10.1093/nar/30.9.2089. [DOI] [PMC free article] [PubMed] [Google Scholar]
- 17.Walter NG, Burke JM. Real-time monitoring of hairpin ribozyme kinetics through base-specific quenching of fluorescein-labeled substrates. Rna. 1997;3:392–404. [PMC free article] [PubMed] [Google Scholar]
- 18.Unruh JR, Gokulrangan G, Lushington GH, Johnson CK, Wilson GS. Orientational dynamics and dye-DNA interactions in a dye-labeled DNA aptamer. Biophys J. 2005;88:3455–65. doi: 10.1529/biophysj.104.054148. [DOI] [PMC free article] [PubMed] [Google Scholar]
- 19.Traut TW. Physiological concentrations of purines and pyrimidines. Mol Cell Biochem. 1994;140:1–22. doi: 10.1007/BF00928361. [DOI] [PubMed] [Google Scholar]
- 20.Arnold JJ, Cameron CE. Poliovirus RNA-dependent RNA polymerase (3Dpol) is sufficient for template switching in vitro. J Biol Chem. 1999;274:2706–16. doi: 10.1074/jbc.274.5.2706. [DOI] [PubMed] [Google Scholar]