

Abstract
Large-conductance, voltage- and Ca2+-activated K+ channels (MaxiK) are broadly expressed ion channels minimally assembled by four pore-forming α-subunits (MaxiKα) and typically observed as plasma membrane proteins in various cell types. In murine astrocyte primary cultures, we show that MaxiKα is predominantly confined to the microtubule network. Distinct microtubule distribution of MaxiKα was visualized by three independent labeling approaches: 1) MaxiKα-specific antibodies, 2) expressed EGFP-labeled MaxiKα, and 3) fluorophore-conjugated iberiotoxin, a specific MaxiK pore-blocker. This MaxiKα association with microtubules was further confirmed by in-vitro His-tag pulldown, co-immunoprecipitation from brain lysates, and microtubule depolymerization experiments. Changes in intracellular Ca2+ elicited by general pharmacological agents, caffeine or thapsigargin, resulted in increased MaxiKα labeling at the plasma membrane. More notably U46619, an analog of thromboxane A2 (TXA2) which triggers Ca2+-release pathways and whose levels increase during cerebral hemorrhage/trauma, also elicits a similar increase in MaxiKα surface labeling. Whole-cell patch clamp recordings of U46619 stimulated cells develop a ~3-fold increase in current amplitude indicating that TXA2 stimulation results in the recruitment of additional, functional MaxiK channels to the surface membrane. While microtubules are largely absent in mature astrocytes, immunohistochemistry results in brain slices show that cortical astrocytes in the newborn mouse (P1) exhibit a robust expression of microtubules that significantly colocalize with MaxiKα. The results of this study provide the novel insight that suggests Ca2+ released from intracellular stores, may play a key role in regulating the traffic of intracellular, microtubule-associated MaxiKα stores to the plasma membrane of developing murine astrocytes.
Keywords: Traffic and targeting, microtubules, potassium channel, thromboxane A2, BK channel
Introduction
Astrocytes, the most prevalent glial cells in the central nervous system were originally thought to provide passive support functions such as maintaining brain architecture, scavenging excess neurotransmitters and debris, and constituting the blood brain barrier. However, recent studies have suggested that astrocytes serve a more active, functional role in the brain (Fields et al., 2002;He et al., 2007;Saloheimo et al., 2005). One of such roles is the astrocytic mediation of neuronal activity-dependent cerebrovascular tone, a function termed neurovascular coupling (Zonta et al., 2003a;Filosa et al., 2004;Straub et al., 2006). Perivascular astrocytes, which contain endfeet projections terminating on nearby cerebral blood vessels, are stimulated by neurotransmitter release from active adjacent neurons. This stimulation by neighboring neurons evokes glial Ca2+ increases which can subsequently affect vascular tone by the release of various vasoactive substances such as arachidonic acid metabolites (Zonta et al., 2003b;Mulligan et al., 2004;Li et al., 2003), prostacyclins, epoxyeicosatrienoic acids (Medhora et al., 2001), glutamate, adenosine, and ATP (Anderson et al., 2004). An additional manner of mediating vascular tone by astrocytes during neurovascular coupling is the release of K+ from perivascular astrocytic endfeet resulting in vasodilation (Paulson et al., 1987;Hamel, 2006;Iadecola, 2004), a mechanism termed K+ siphoning.
Astrocytes from either primary culture or brain slices express a wide variety of potassium channels (Oh Y, 1997;Barres et al., 1990;Hansson et al., 1994), much of which have yet to be well characterized. One class of K+ channels, large-conductance, voltage- and Ca2+-activated K+ channels (MaxiK, BK), are ubiquitously expressed proteins found in a variety of tissues which are responsible for a broad spectrum of physiological roles such as blood flow, uresis, and neurotransmission (Lu et al., 2006). Recently, MaxiK channels have been identified as responsible for local K+ efflux into the perivascular space coupling neuronal activity to arteriolar diameter. Astrocytic Ca2+ has a key role in this coupling as its increase promotes the Ca2+-dependent activation of astrocytic MaxiK channels and K+ efflux-mediated vasodilatation (Filosa et al., 2006). In line with the role of MaxiK channels in astrocytic function, MaxiK channels have been previously detected in cultured rat astrocytes by electrophysiological methods (Bychkov et al., 2001;Gebremedhin et al., 2003) and observed in the perivascular endfeet of rat astrocytes in brain slices (Price et al., 2002). However, there is virtually no data concerning the detailed subcellular localization of MaxiK channels and the factors regulating their expression in astrocytes. In our studies, we show that in cultured murine astrocytes, MaxiK channels are predominantly distributed intracellularly and associated with the microtubule network. In addition, a mechanism influencing MaxiK channel surface expression is an increase in intracellular Ca2+. Furthermore, we show that thromboxane A2 mimics the Ca2+-induced MaxiK surface expression, thereby providing a possible protective mechanism during pathological conditions of elevated thromboxane A2 levels such as cerebral hemorrhage.
Materials and Methods
Antibodies
Monoclonal α-tubulin antibody and anti-glial fibrillary acidic protein (GFAP) were from Sigma. Polyclonal MaxiK α-subunit antibody (MaxiKα) was from Alomone Labs [Lot # AN-05]. MaxiKα antibody was extensively characterized by immunoblotting using lysates from expression systems and smooth muscle where it labeled proteins of the appropriate molecular size (125 kDa monomer, 250 kDa dimer). Antibody specificity in immunoblots and immunocytochemistry was confirmed by antigen block. Secondary antibodies were from Molecular Probes (Invitrogen).
Astrocyte cultures
Primary astrocyte cultures were prepared from postnatal day 1 (P1) C57/BL6 mice (McCarthy et al., 1980). Briefly, cortices were dissociated (20 min, 37°C) with 0.25% Trypsin (Invitrogen) and centrifuged (208 × g, 5 min, 4°C). Cells were resuspended in DMEM containing 10% fetal bovine serum, 1.4 mM L-glutamine, 1% penicillin/streptomycin, plated into 25-cm2 tissue culture flasks, and incubated at 37°C/5% CO2. Upon confluency (7-10 days), glial cultures were shaken overnight (250 rpm, 37°C) to dislodge microglia and oligodendrocytes. Astrocytes were then detached with 0.05% Trypsin/EDTA and seeded onto poly-L-lysine (0.01%) coated coverslips for immunostaining or electrophysiology. Astrocyte identity was confirmed by positive GFAP immunolabeling (not shown).
Immunolabeling
Astrocytes or 10 μm cryopreserved coronal brain slices were fixed with pre-warmed 4% paraformaldehyde for 20 min, washed, and permeabilized in PBS + 0.2% Triton-X-100, pH 7.4 (3×10min). Non-specific labeling was blocked in PBS + 0.2% Triton-X-100 + 10% normal goat serum (1 hr, room temperature). Cells were double labeled (overnight, 4°C) with monoclonal α-tubulin (1 μg/ml) and polyclonal MaxiKα antibodies (1.6 μg/ml), or AlexaFluor-594 conjugated iberiotoxin (1 nM) diluted in PBS + 0.2% Triton-X-100 + 1% normal goat serum. Secondary antibodies AlexaFluor-488 and AlexaFluor-568 (2 μg/ml) were incubated for 1 hr at room temperature. Cells were subsequently washed 3 × 10 minutes in PBS and mounted using Prolong Gold anti-fade reagent (Invitrogen) for imaging.
Imaging and colocalization analysis
High-resolution laser confocal sections were acquired using an Olympus Fluoview FV5-PSU (60X objective lens; NA= 1.42). Image stacks were taken every 0.1 μm through the entire Z-plane of cells (dual fluorophore signals were sequentially acquired) and 3D blind deconvolved (Autodeblur & Autovisualize, Autoquant Imaging). Quantitative colocalization analysis was carried out by applying a grid delimiting 2×2 μm squares over each separate confocal plane. Squares with pixel intensity values larger than 0.25 of the maximum pixel intensity value of the whole image plane were selected and correlation coefficients (CC) of individual squares were calculated. The Protein Proximity Index (PPI) was calculated as (NCC>0, P<0.05/Nt) where, NCC>0, P<0.05 is the number of squares with CC>0 and Psign test value<0.05, and Nt is the total number of squares (Ropero et al., 2006).
Intensity analysis
Three cytosolic 10 μm diameter regions in each cell were randomly selected to measure average intensities using Metamorph software (Molecular Devices).
MaxiKα adenoviral vector
N-terminal c-Myc epitope tagged MaxiKα was fused at its C-terminus to enhanced green fluorescent protein (EGFP) (MaxiKα-EGFP) and expressed using AdEasy Adenoviral Vector System (Stratagene). Astrocytes were infected (multiplicity of infection=30) for 48 hrs prior to fixation and analysis.
Protein Extraction
Freshly isolated brains from newborn mice were lysed by homogenization and sonication (3 × 10 seconds) in 1% NP-40 alternative, 1% Na-deoxycholate, 10% glycerol, 150 mM NaCl, 50 mM Tris, and protease inhibitors (lysis buffer) followed by incubation on ice (30 min). Cellular debris was removed by centrifugation (850 × g, 10 minutes). Protein concentration was determined by Lowry method.
His-tag pulldown assay
A MaxiKα carboxyl-terminus domain “tail” (Wei et al., 1994) (amino acids 679-1113, GenBank Accession #U11058, MaxiKα679-1113) was subcloned into the bacterial expression vector pET-28a (Novagen) to express six N-terminal histidine fusion protein (His-MaxiKα679-1113). His-MaxiKα679-1113 was expressed in E. coli BL21-Gold (DE3) cells (Stratagene), extracted under native conditions, and purified using Ni-NTA agarose beads (Qiagen). His-MaxiKα679-1113 bound to Ni-NTA agarose beads (bait) was incubated with whole brain lysates in binding buffer (20 mM Tris-HCl, pH 8.0,10 mM Imidazole, 300 mM NaCl, 10% glycerol). Non-specific binding was washed off with excess binding buffer containing 50 mM imidazole, and His- MaxiKα679-1113 bound proteins were eluted with 20 mM Tris-HCl, pH 8.0, 300 mM Imidazole, 300 mM NaCl, 10% glycerol. Elution fractions were subsequently analyzed by Western blot. Negative control consisted of incubating Ni-NTA agarose beads with bacterial lysates not expressing His-MaxiKα679-1113 prior to bead incubation with whole brain lysates.
Co-immunoprecipitation
Monoclonal anti-α-tubulin antibody (10μg) was bound to 40 μl protein A/G agarose beads (6 hrs, 4°C) followed by washing with lysis buffer (see above). The antibody-bead complex or beads alone (control) were incubated with newborn brain lysate (2 mg protein). After overnight incubation (4°C), samples were washed 3 times with lysis buffer and extracted in SDS sample buffer for Western blot analysis.
Western blot analysis
Samples were mixed with equal volumes of SDS loading buffer and dithiothreitol to a final concentration of 62.5 mM Tris-HCl, 2% SDS, 10% glycerol, 0.01% bromophenol blue, and 42 mM dithiothreitol. Samples were separated on 10% SDS gels by polyacrylamide gel electrophoresis (SDS-PAGE) and electro-transferred to nitrocellulose membranes together with prestained molecular weight standards (Li-Cor). Membranes were blocked (1 hr, room temperature) with 5% nonfat dried milk in Tris-buffered saline (TBS; 50 mM Tris-HCl, 150 mM NaCl, pH 7.4). Membranes were double labeled with antibodies against MaxiKα (0.8 μg/ml) and α-tubulin (1 μg/ml) in 1% nonfat milk/TBS containing 0.5% Triton X-100 and 0.1% Tween overnight at 4 °C, washed (TBS 3×10 min), and incubated with secondary antibodies Alexa Fluor 680 goat anti-rabbit IgG (0.133 μg/ml) or IRDyeTM 800 goat anti-mouse (0.066 μg/ml) (Rockland) for 1 h. Blots were washed (3 times, 10 min) and visualized by infrared fluorescence (Odyssey™, Li-Cor).
Electrophysiology
Whole-cell MaxiK currents were recorded with an Axopatch 5200A amplifier at room temperature using patch pipettes of ~2-3 MΩ. All currents were recorded from type I astrocytes as identified by morphological observation (flat, polygonal epithelial shape). Bath solution was (in mM): 135 Na-methanesulfonic acid (Mes), 5 K-Mes, 0.1 CaCl2, 2 MgCl2, 10 HEPES, and 5 Glucose (pH 7.4). Pipette solution was (in mM): 140 K-Mes, 0.1 CaCl2, 2 MgCl2, 0.1 Na-ATP, 0.1 Na-GTP, 0.145 EGTA, and 10 HEPES (pH 7.4) (pCa 6.35). To inactivate other voltage-activated currents, the holding potential (Vh) was set to 0 mV. Test pulses were from -70 to 160 mV in 10 mV increments. For time course recordings, Vh was −70 mV and 120 mV test pulses were given every 3 seconds. Whole-cell currents were normalized to cell capacitance (calculated from 10 mV pulses) to obtain current density. To subtract capacity transients from total current traces, recordings were scale subtracted off-line using currents elicited by pulses to -70 mV that showed no time-dependent ionic currents.
Statistics
Data is presented as mean ± SE. Statistical comparisons among groups were made using ANOVA followed by Student-Newman-Keuls test. A P-value < 0.05 was considered statistically significant and is marked with (*).
Results
MaxiK whole-cell currents are blocked by iberiotoxin and paxilline
Previous electrophysiological studies in rat astrocyte primary cultures have reported the conflicting information of macroscopic K+ currents both sensitive to iberiotoxin (IbTx) block in striatal astrocytes (Bychkov et al., 2001) as well as IbTx insensitivity in cortical and hippocampal astrocytes (Gebremedhin et al., 2003). Additionally, paxilline (Pax), another well characterized MaxiK-specific inhibitor (Knaus et al., 1994), has been previously shown to block MaxiK currents in astrocyte derived glioma cells (Weaver et al., 2006) and in primary cultured rat hippocampal astrocytes (Yamaura et al., 2006). As no previous electrophysiological data exist detailing IbTx and Pax sensitivity in primary cultures isolated from murine cortical astrocytes, we investigated macroscopic K+ current sensitivity to IbTx and Pax block. With IbTx added to the external bath solution and at a holding potential (Vh) of 0 mV to inactivate other voltage-sensitive channels, K+ currents elicited by step depolarizations from -70 mV to +160 mV were not significantly blocked by 100 nM IbTx during the first 20 minutes of application (data not shown). A moderate but significant macroscopic K+ sensitivity to IbTx was observed when a 5 μM concentration was applied after 5 minutes (Fig. 1A, upper right). In contrast, K+ currents were instantaneously inhibited upon application of 2 μM Pax (Fig. 1A, lower right). The corresponding average current-voltage (IV) plot (Fig. 1B) and bar plot (Fig. 1C) of normalized current amplitude (to +120 mV) in response to pharmacological treatment indicate that 5 μM IbTx results in ~40% block of outward current (gray bar) while 2 μM Pax application results in a significantly greater ~80% outward current decrease.
Figure 1.
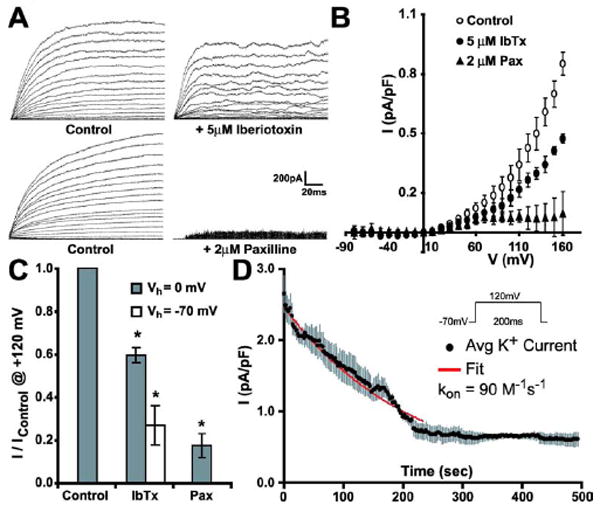
Pharmacological identification of MaxiK currents in cultured cortical astrocytes. (A, upper and lower left) Control outward K+ currents elicited by -70 to +160 mV pulses; Vh = 0 mV. K+ currents after application of MaxiK inhibitors (A, upper right) iberiotoxin (IbTx, 5 μM) or (A, lower right) paxilline (Pax, 2 μM). (B) Average current density-voltage curves before (control) and after application of 5 μM IbTx or 2 μM Pax; Vh = 0 mV (n = 3 for each group). (C) Mean current amplitude reduction in response to IbTx or Pax application. IbTx blockade is shown at Vh of -70 mV and 0 mV. (D) Average time course of 5 μM IbTx-induced MaxiK current blockade (n=3) from Vh = -70 mV. Red line is the fit to a first order bimolecular blocking reaction scheme (Meera et al., 2000).
Previous studies have found that dissociation rates of pore-blocking peptides with the MaxiK channel may vary dependent upon the channel’s voltage state being slower at negative potentials (Anderson et al., 1988). In agreement with this concept, 5 μM IbTx results in a larger ~70% outward current block when currents to +120 mV are recorded from a Vh of -70 mV (Fig. 1C, D) than from a Vh of 0 mV (~40% block) (Fig. 1C) as the toxin would have more difficulty in dissociating from the channel at -70 mV, enhancing its blocking capacity. The resistance of MaxiK channels to IbTx block up to μM concentrations has been attributed to the expression of the MaxiK β4 auxiliary subunit which greatly slows down IbTx association with the channel (Meera et al., 2000). Thus, our findings of astrocyte macroscopic K+ current apparent insensitivity up to μM IbTx concentrations argue in favor of the presence of the MaxiK α+β4 subunit complex in these cells. In further support of the presence of MaxiKβ4 in cultured murine astrocytes, the on-rate time constant for IbTx block in cultured murine astrocytes (Fig. 1D, kon = 90 M-1s-1) was ~4 orders of magnitude slower than for Maxi α subunit alone and ~1 order of magnitude slower than for MaxiK α+β4 subunits ectopically expressed in Xenopus laevis oocytes (Meera et al., 2000).
Immunolabeling of MaxiKα colocalizes to the microtubule network
MaxiK α-subunit specific antibodies were used to determine MaxiKα distribution in newborn murine cortical astrocytes in primary culture. Immunostaining of MaxiKα reveals the surprising finding that the typically surface membrane bound ion channel is predominantly distributed intracellularly in a punctated manner (Fig. 2A). Double labeling of MaxiKα with the microtubule marker, α-tubulin (Fig. 2B), revealed a high degree of overlap between channel labeling and the cytoskeletal architecture (Fig. 2C). To quantify the level of co-localization between the two fluorophores, a 2×2 μm2 grid of the images in Figs. 2A and 2B were analyzed as described in Methods. Figs. 2D and 2E show the correlation coefficient (CC) histogram of the total # of observations and the Psign test vs. CC relationship plot, respectively. Red bars in the histogram mark observations with positive correlation (CC>0), which are the large majority. The highlighted portion below the dotted line in the Psign test vs. CC plot depicts regions with a positive CC and with P < 0.05. Also, the vast majority of discrete regions with positive CC have P<0.05, which divided by the total # of observations result in a PPI of 0.87. To validate that the high degree of colocalization between MaxiK and α-tubulin was not due to overlay coincidence of a random expression pattern, PPI values were measured as a function of pixel shift in the x-axis. PPI was reduced from 0.87 to a baseline of 0.2 after 0.5 μm pixel shift of the x-axis (Fig. 2F), thus confirming that the high degree of colocalization between MaxiKα and the astrocytic microtubule network is not due to arbitrary fluorophore coincidence. The baseline PPI of 0.2 can be explained by a high signal density that precludes further PPI reduction by pixel shift.
Figure 2.
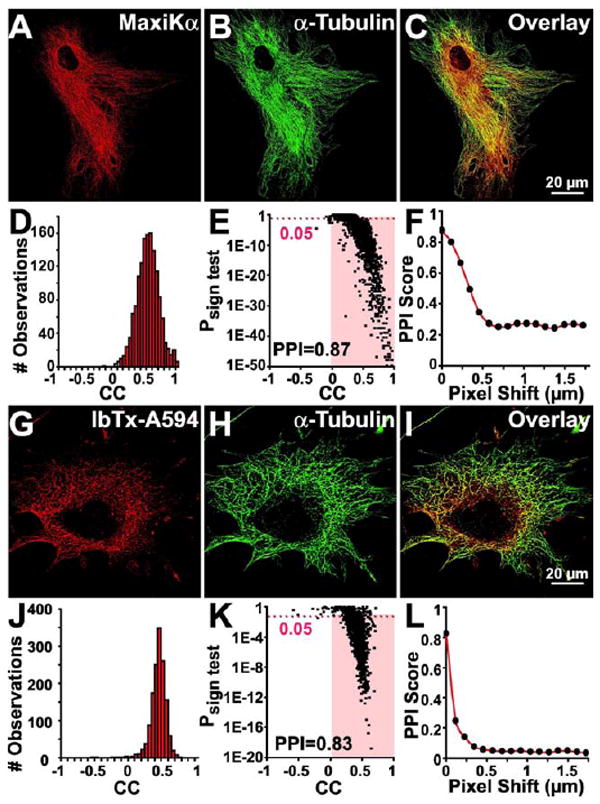
Quantification of the subcellular localization of MaxiKα to the microtubule network of cultured astrocytes. Double labeled astrocytes with anti-MaxiKα (A, red) and anti-α-tubulin (B, green) or with IbTx-A594 (G, red) and anti-α-tubulin (H, green). Concurrent dual fluorophore labeling (yellow) in overlays (C, I) indicates co-localization of MaxiKα and IbTx-A594 with α-tubulin. Colocalization analysis of MaxiKα with α-tubulin (D-F) and IbTx-A594 with α-tubulin (J-L). Correlation coefficient (CC) frequency distribution histograms for MaxiKα→α-tubulin (D) and IbTx-A594→α-tubulin (J). Columns in red have CC>0. Corresponding Psign test–CC plots (E, K); highlighted area are squares with CC>0 and a P<0.05. PPI as a function of pixel shift in the x-axis of one plane for MaxiKα→α-tubulin (F) and Ibtx-A594→α-tubulin (L). In this and following figures, images are single confocal planes.
Immunolocalization of IbTx-AlexaFluor594 colocalizes to astrocyte microtubules
Iberiotoxin, isolated from the venom of the scorpion Buthus tamulus, has been previously established as a MaxiK channel blocker that binds distinctly to the tetrameric pore (Galvez et al., 1990). To investigate whether the microtubule associated MaxiKα in cultured murine astrocytes is in its tetrameric conformation, we labeled primary astrocyte cultures with IbTx conjugated to AlexaFluor-594 (IbTx-A594). Analogous to MaxiKα and α-tubulin double labeling (Fig. 2A-C), IbTx-A594 revealed a similar punctated, intracellular expression pattern (Fig. 2G) that colocalizes to the microtubules (Fig. 2H) with a high degree of overlap (Fig. 2I). PPI analysis of IbTx-A594 colocalization with α-tubulin shows a PPI = 0.83 (Figs. 2J, K) similar to the PPI values between antibodies directed against MaxiKα and microtubules. Pixel shift analysis of images from Figs. 2G, H indicates a reduction of PPI value from 0.83 to 0.03 after 0.5 μm pixel shift in the x-axis (Fig. 2L). These results further confirm the association of astrocytic MaxiKα to the microtubule network. In addition, due to the proclivity of Ibtx binding to the fully formed pore of the MaxiK channel, these findings suggest that the intracellular MaxiKα subunit is arranged in a tetrameric conformation.
Expression of MaxiK-EGFP in cultured murine astrocytes shows similar association with the microtubule network
To determine if exogenously expressed MaxiKα would follow a similar distribution pattern of predominant intracellular labeling along the microtubules as seen with native MaxiKα in cultured murine astrocytes, we infected primary astrocyte cultures with an adenoviral vector that would generate MaxiKα protein conjugated to EGFP for visualization purposes (Fig. 3A). To confirm the identity of the expressed EGFP labeled protein, transformed cultures were double labeled with MaxiKα specific antibodies (Fig. 3B). The nearly perfect colocalization value, PPI = 0.98 (Figs. 3D, E), of the overlay between MaxiKα-EGFP and MaxiKα antibody labeling observed in Fig. 3C indicates that the adenoviral expressed protein is indeed MaxiKα protein. Additionally, the extremely high PPI value of the double labeling also provides a reciprocal validation of the specificity of MaxiKα antibody used. Pixel shift analysis shows a PPI reduction of 0.98 to 0.2 after 0.5 μm pixel shift in the x-axis (Fig. 3F), thus confirming that the near-perfect colocalization between MaxiK antibody and MaxiK-EGFP is not arbitrary.
Figure 3.
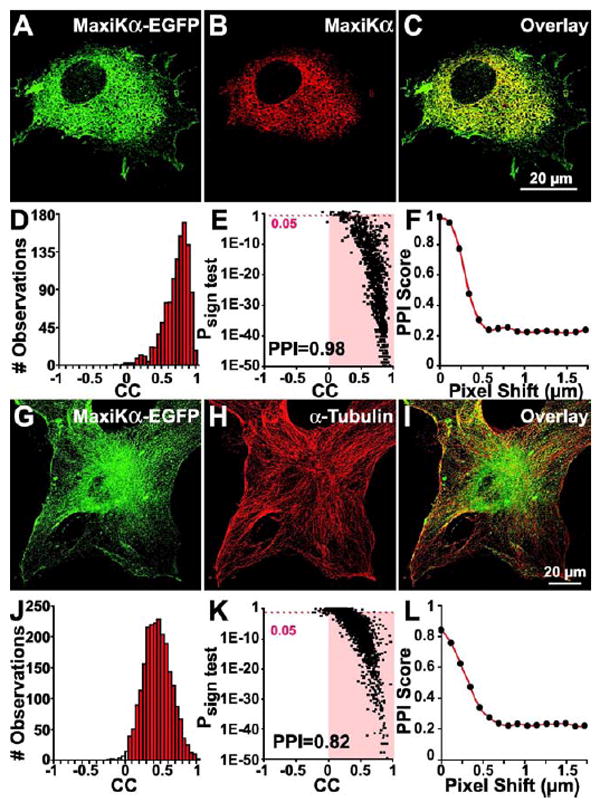
Expressed MaxiKα-EGFP localizes to the microtubule network in cultured astrocytes. Astrocytes were infected with MaxiKα-EGFP recombinant adenovirus (A, G in green) and co-labeled with anti-MaxiKα (B, red) or anti-α-tubulin (H, red) antibodies. Concurrent dual fluorophore labeling (yellow) in overlays (C, I) indicates colocalization. Colocalization analysis of anti-MaxiKα antibody with MaxiKα-EGFP signals (D-F) and anti-α-tubulin antibody with MaxiKα-EGFP signals (J-L) show a high protein proximity index (PPI). Correlation coefficient (CC) frequency distribution histograms are for anti-MaxiKα→MaxiKα-EGFP (D) and for anti-α-tubulin→MaxiKα-EGFP (J) signals. Columns in red have CC>0. Corresponding Psign test–CC plots (E, K); highlighted area are squares with CC>0 and a P<0.05. PPI as a function of pixel shift in the x-axis of one plane for anti-MaxiKα→MaxiKα-EGFP (F) and anti-α-tubulin→MaxiKα-EGFP (L).
When MaxiK-EGFP expressing astrocytes (Fig. 3G) are double labeled against α-tubulin (Fig. 3H), the intracellularly punctated MaxiK-EGFP distribution shares a significant degree of colocalization to the microtubule architecture (Fig. 3I). The PPI value between MaxiK-EGFP and α-tubulin is 0.82 (Figs. 3J, K), with a pixel-shift PPI reduction from 0.82 to 0.2 after 0.5μm pixel shift in the x-axis (Fig. 3L). The results of MaxiK-EGFP expression colocalized to the microtubule network mirror the findings found by MaxiK antibody and IbTx-A594 distribution. All three independent visualization strategies show MaxiK colocalization to α-tubulin have comparably high PPI values as seen in the bar plot comparison (see Fig. 4M, n = 10 for each group).
Figure 4.
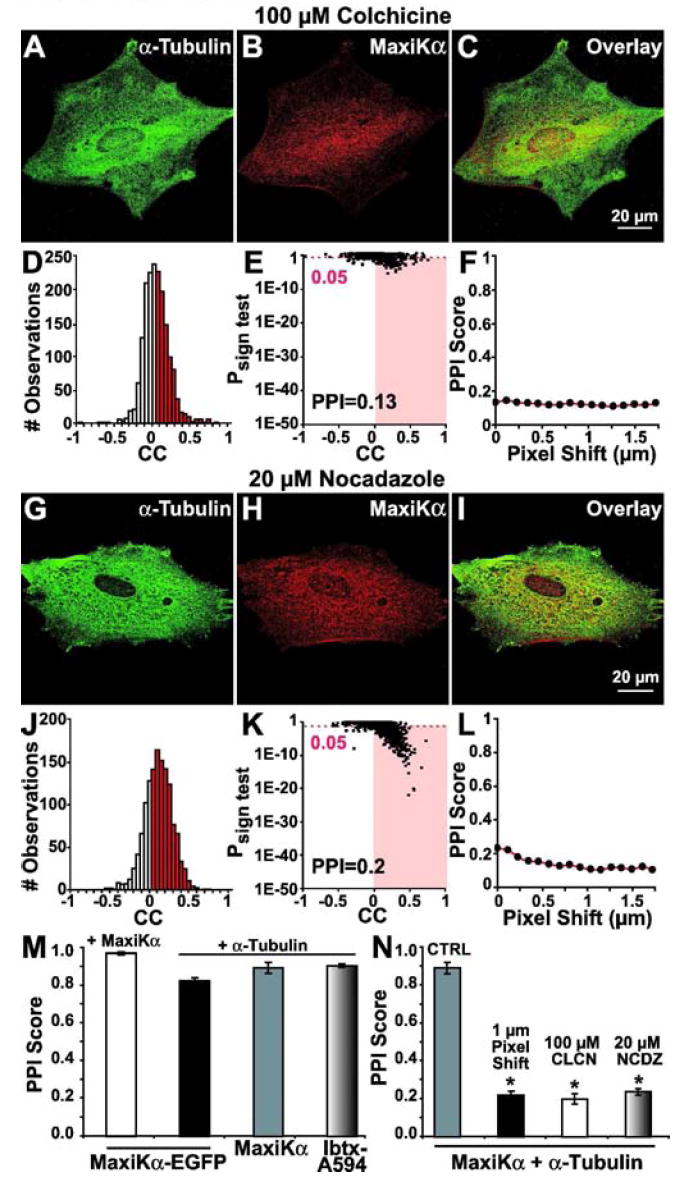
Microtubule depolymerization disrupts MaxiKα colocalization with α-tubulin. Cultured astrocytes were incubated (3 hours @ 37°C) with 100 μM colchicine (A-C) or 20 μM nocodazole (G-I) and double labeled with anti-α-tubulin (A, G in green) and anti-MaxiKα (B, H in red) antibodies. Reduction of yellow labeling in overlays (C, I) (versus Figs. 2-3) indicates disruption of colocalization. Analysis shows a low PPI of MaxiKα and α-tubulin after colchicine (D-F) and nocodazole (J-L) treatments. (M) Mean PPI scores of independent MaxiKα labeling methods (black bar = MaxiKα-EGFP; gray bar = MaxiKα antibody; shaded bar = IbTx-A594) with α-tubulin and between MaxiKα antibody signals with those of MaxiKα-EGFP (open bar). (N) Mean PPI scores after microtubule depolymerization by colchicine (CLCN, open bar) and nocodazole (NCDZ, shaded bar) versus untreated astrocytes (CTRL, gray bar) show a significant reduction in PPI similar to that of 1 μm x-axis pixel shift (black bar). n=10 cells per condition.
Microtubule depolymerization disrupts MaxiKα co-localization with the microtubule network
To investigate whether microtubule structural integrity has a bearing on the distribution of MaxiKα in cultured murine astrocytes, we examined MaxiKα → α-tubulin colocalization in response to microtubule depolymerization. Primary astrocyte cultures were treated with colchicine (100 μM), a well-characterized microtubule-depolymerizing agent, for 3 hours at 37°C. Colchicine treatment resulted in a diffuse labeling of α-tubulin, with filamentous polymerized microtubules no longer present (Fig. 4A). Double labeling of MaxiKα in colchicine treated astrocytes revealed a diffuse, punctated distribution of the channel (Fig. 4B) that no longer shares a high degree of colocalization with α-tubulin (Fig. 4C). PPI analysis of MaxiKα colocalization with α-tubulin in the colchicine treated cell in images Figs. 4A,B indicate a PPI = 0.13 (Figs. 4D,E). Pixel shift analysis (0-2 μm in the x-axis) of images from Figs. 4A, B show negligible change in the low PPI value (Fig. 4F) signifying arbitrary co-localization of MaxiKα with α-tubulin after colchicine treatment.
To further substantiate our findings, we treated primary astrocyte cultures with a different, well-characterized microtubule-depolymerizing agent, nocodazole. Nocodazole treatment (20 μM, 3 hours at 37°C) resulted in a similar diffuse labeling of α-tubulin with the notable absence of a filamentous microtubule network (Fig. 4G). In parallel with the colchicine treatment colocalization findings, double labeling with MaxiKα in nocodazole treated astrocytes (Fig. 4H) resulted in an insubstantial colocalization with α-tubulin (Fig. 4I). Quantification of co-localization between MaxiKα and α-tubulin in the nocodazole treated astrocyte from Fig. 4G-H exhibits a low PPI value (PPI = 0.2, Figs. 4J, K). Similar to the results found by pixel shift analysis of colchicine treated astrocytes, pixel shift of images from nocodazole treatment in Figs. 4G, H result in minimal PPI change (Fig. 4 L) indicating arbitrary co-localization of MaxiKα with α-tubulin after nocodazole induced microtubule depolymerization.
Bar plot summary of microtubule depolymerization experiments (Fig. 4N, n= 10 for each group) indicate that treatment with either colchicine or nocodazole causes a ~4-fold reduction in PPI values in comparison to untreated controls. PPI = ~0.2 for colchicine/nocodazole treatment groups (white and shaded bars) is comparable to 1 μm pixel-shifted images (black bar) indicating an arbitrary, baseline non-colocalization.
MaxiKα C-terminus “tail” interacts with microtubules in vitro
While the association between MaxiKα and α-tubulin observed in primary cultured astrocytes was demonstrated by high-resolution immunolocalization studies, we sought biochemical confirmation of this interaction in mouse whole brain lysates by means of His-tag pulldown assays. Histidine-tagged MaxiKα C-terminus “tail” protein (MaxiKα679-1113) was bound to Ni-NTA agarose beads and incubated with whole brain lysates extracted from newborn mice. As shown by immunoblots in Fig. 5A, elution fractions containing His-MaxiKα679-1113 “tail” bait protein (Fig. 5A, top row) were able to interact with endogenous α-tubulin (Fig. 5A, 2nd row). Ni-NTA agarose beads incubated with negative control bacterial lysates not containing the His-MaxiKα679-1113 “tail” fusion protein (to ensure the specificity of Ni-NTA agarose bead binding) prior to incubation with mouse whole brain lysates revealed, as expected, no MaxiKα679-1113 “tail” signals (Fig. 5A, 3rd row) and no α-tubulin pulldown (Fig. 5A, bottom row). His-pulldown experiments were repeated in triplicate yielding similar results indicating that MaxiKα interacts with α-tubulin in vitro and that the MaxiKα “tail” domain is sufficient for this interaction.
Figure 5.
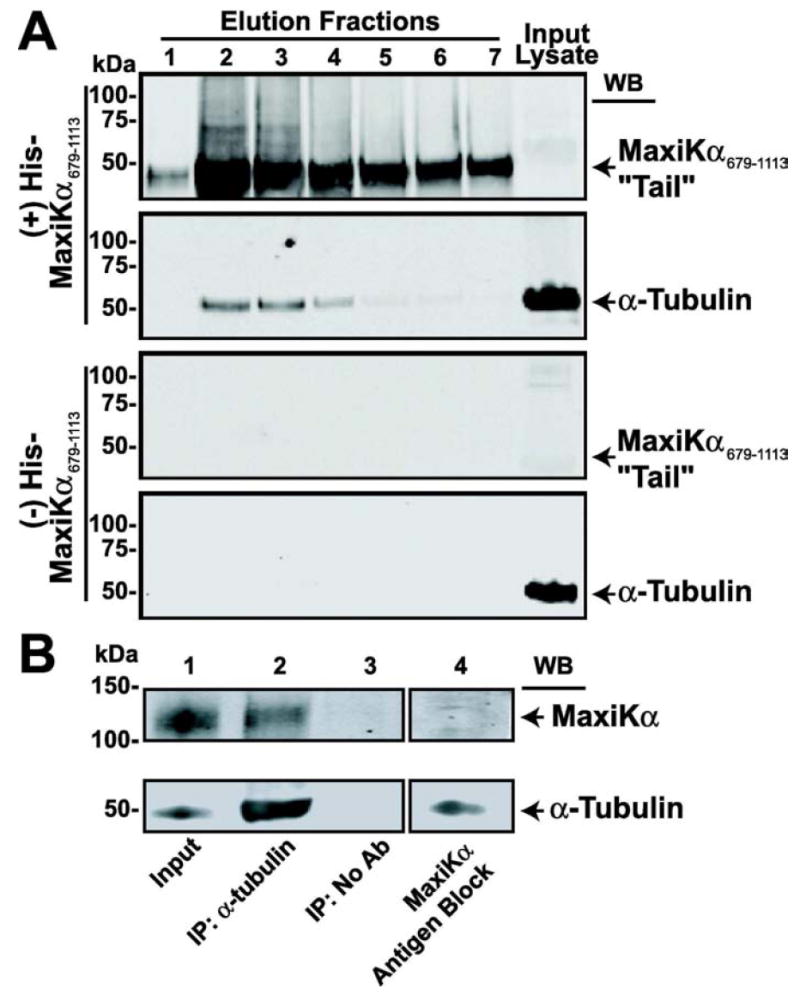
MaxiKα interacts with α-tubulin. (A) Western blot analysis of pull-down assay. His-MaxiKα679-1113 “tail” in elution fractions 1-7 (A, top row) pulls down α-tubulin (A, 2nd row). Without His-MaxiKα679-1113 “tail” bait protein (A, 3rd row), α-tubulin is not pulled down (A, last row). Proteins in input lysates are also shown. (B) MaxiKα co-IP by α-tubulin in newborn brain lysates. Immunoprecipitated proteins were immunoblotted with polyclonal MaxiKα (B, upper row) and monoclonal α-tubulin antibodies (B, lower row). Lane 1, immunoblots of cell extracts (input) used for IP. Lane 2, immunoprecipitated proteins by α-tubulin antibody probed with anti-MaxiKα and anti-α-tubulin antibodies. Lane 3, control reactions in the absence of anti-α-tubulin antibodies (No Ab). Lane 4, lysate immunoblotted with anti-MaxiKα antibodies preincubated with antigenic peptide (antigen block, control). Experiments were repeated in triplicate yielding similar results.
Native brain MaxiKα co-immunoprecipitates with α-tubulin
Having determined that the MaxiKα679-1113 “tail” interacts with α-tubulin in vitro, we next performed co-immunoprecipitation studies in newborn (P1) brain lysates (Fig. 5B) to investigate whether full-length native MaxiKα also interacts with α-tubulin in brain tissue. As evidenced by Western blot analysis in the input brain lysates (Fig. 5B, Lane 1), both native MaxiKα and α-tubulin are prominently expressed. Newborn brain lysates were subjected to immunoprecipitation with anti-α-tubulin monoclonal antibody (IP: α-tubulin) or without antibody as a negative control (IP: No Ab). As shown in Fig. 5B, α-tubulin was efficiently immunoprecipitated in lysates derived from newborn brain tissue (Lane 2 lower) along with MaxiKα (Lane 2 upper) indicating an interaction between the two proteins in native tissue. As expected for specific interactions, using beads alone resulted in no immunoprecipitated α-tubulin, nor MaxiKα signals (Fig. 5B, Lane 3). To ensure MaxiKα antibody specificity in our immunoblots, MaxiKα polyclonal antibody was preincubated with its antigenic peptide (5:1 ratio of antigenic peptide to antibody) prior to immunoblotting cell lysates. MaxiKα Ab antigen block resulted in the inability of the Ab to label MaxiKα in newborn brain cell lysates (Fig. 5B, Lane 4 upper) while this treatment did not affect binding specificity of anti-α-tubulin (Fig. 5B, Lane 4 lower).
Increased MaxiK surface expression in response to caffeine/thapsigargin application
Previous studies have shown that MaxiK channels are activated by the release of Ca2+ from sarcoplasmic reticulum (SR) stores (Nelson et al., 1995). In human myometrial smooth muscle cells, increases in intracellular Ca2+ released from SR stores elicited by caffeine application resulted in the translocation of the C-terminal end of MaxiKα splice variant, mK44, from intracellular stores to the cell membrane (Korovkina et al., 2006). To investigate whether microtubule-associated MaxiK channels would fare a similar response, we hypothesized that surface membrane expression of MaxiKα could be induced by release of Ca2+ from intracellular stores. To ensure SR was the source of Ca2+ release, all pharmacological treatments were conducted in Ca2+-free buffers. After treatment of primary cultured astrocytes with 20 mM caffeine for 30 minutes at 37°C, double immunolabeling of MaxiKα (Fig. 6A) and α-tubulin (Fig. 6B) revealed an increased expression of MaxiKα at the plasma membrane. Intracellular colocalization between MaxiKα and α-tubulin remained consistent as observed in image overlay Fig. 6C, but MaxiKα surface expression at the cell membrane appeared distinct from the microtubule network as limited colocalization was seen at the periphery (white arrows, Fig. 6A,C). Caffeine application induced an approximate ~6-fold increase in the number of cultured astrocytes with MaxiKα labeling at the cell surface (Fig. 6G, # cells counted/condition = ~3,000, n=3).
Figure 6.
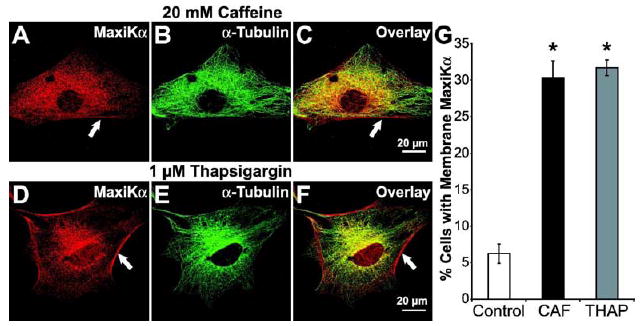
Increases in intracellular Ca2+ increases MaxiKα expression at the plasma membrane of cultured astrocytes. Astrocytes double labeled with anti-MaxiKα (A, D red) and anti-α-tubulin (B, E green); concurrent dual fluorophore labeling (yellow) in overlays (C, F). After 20 mM caffeine (A-C) or 1 μM thapsigargin (D-F) MaxiKα was distinctly observed at the plasma membrane (white arrows). Note in the overlays that MaxiKα signal in the periphery (plasma membrane) did not coincide with the microtubule signals. (G) Mean percentage of cells (~3000 cells/coverslip, manual count, n=3 independent cultures) with MaxiKα expression at the plasma membrane after caffeine (CAF) or thapsigargin (THAP) treatment. n=10 cells/condition.
To test an alternative mechanism of increasing intracellular Ca2+ concentrations thereby further bolstering the hypothesis that increasing cytosolic Ca2+ would induce increased expression of MaxiKα at the astrocyte plasma membrane, 1 μM thapsigargin (THAP) was added to the culture media of primary astrocyte cultures. THAP works to increase intracellular Ca2+ concentrations by effectively inhibiting the Ca2+ ion pump proteins of intracellular membranes located on the sarcoplasmic reticulum and endoplasmic reticulum (Lytton et al., 1991). Similar to the results of caffeine treatment, double immunolabeling of MaxiKα (Fig. 6D) and α-tubulin (Fig. 6E) showed that 1 μM THAP treatment for 30 minutes at 37° induced increased surface expression of MaxiKα (white arrows, Fig. 6D,F). Manual tally of number of cells with MaxiKα plasma membrane expression after THAP treatment indicated an approximate ~6-fold increase in the number of cultured astrocytes with MaxiKα labeling at the cell surface (Fig. 6G, # cells counted/condition = ~3,000, n=3).
Thromboxane A2 receptor agonist, U46619, increases MaxiKα expression at the plasma membrane
As glial cells possess a broad spectrum of neuroligand receptors that are linked to intracellular Ca2+ mobilization (Finkbeiner, 1993), we sought to identify a potential physiological signaling candidate that would elicit increased MaxiKα surface expression in astrocytes via cytosolic Ca2+ modulation. Thromboxane A2 (TXA2), a metabolite of arachidonic acid produced by cyclooxygenase and TXA2 synthase, is responsible for a variety of cellular responses including platelet aggregation and contraction in various types of smooth muscle (Huang et al., 2004). Previous studies have identified the presence of TXA2’s cognate prostanoid receptor, thromboxane A2 receptor (TPR) in astrocytes (Nakahata et al., 1992;Kitanaka et al., 1995). Although Ca2+ mobilization in response to TPR activation has been demonstrated in cultured astrocytes (Kitanaka et al., 1996), the physiological significance and function of TPR signaling in glia remains undetermined. To explore the hypothesis that TPR activation induces increased MaxiKα surface expression, we investigated the effect of TPR agonist U46619 in primary astrocyte cultures. Similar to the results of caffeine/thapsigargin treatment, 100 nM U46619 application for 6 hours at 37° resulted in increased plasma membrane expression of MaxiKα at the cell surface (Fig. 7C). Double immunolabeling of MaxiKα (Fig. 7A) and α-tubulin (Fig. 7B) revealed an approximate ~6-fold increase in the number of cells with prominent MaxiKα surface expression in comparison to vehicle treated controls (Fig. 7G shaded vs. open bars).
Figure 7.
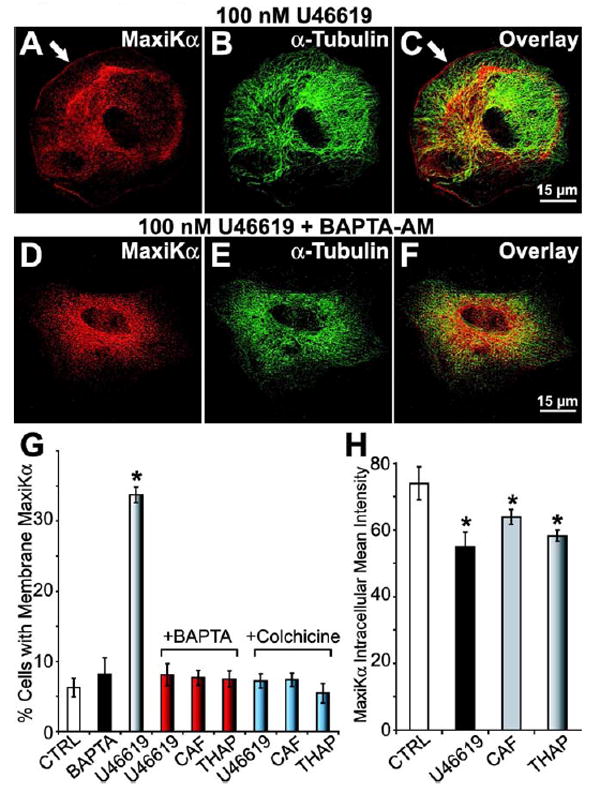
Increases in intracellular Ca2+ caused by Thromboxane A2 agonist U46619 favors MaxiKα distribution at the plasma membrane. Astrocytes double labeled with anti-MaxiKα (A, D red), anti-α-tubulin (B, E green) antibodies, and overlays (C, F). U46619 (100 nM) (A-C) induces MaxiKα expression at the plasma membrane (white arrow). Preincubation with 50 μM BAPTA-AM (D-F) inhibits U46619-induced MaxiKα plasmalemmal targeting. (G) Mean percentage of cultured astrocytes (~3000 cells/coverslip, manual count, n=3 independent cultures) with plasma membrane associated MaxiKα after treatment with vehicle (CTRL, open bar), U46619 (shaded bar) or BAPTA (black bar) alone. Preincubation of BAPTA (red bars) prior to stimulation with U46619, caffeine, or thapsigargin significantly reduced the percentage of membrane distributed MaxiKα to control levels. Preincubation of 100 μM colchicine prior to cell stimulation also prevented the increase in percentage of cells with membrane distributed MaxiKα (blue bars). (H) Mean intensities of intracellular MaxiKα expression after vehicle (CTRL), 100 nM U46619 (black bar), 20 mM caffeine (CAF, gray bar), or 1 μM thapsigargin (THAP, shaded bar) (n = 10 cells/group).
In the cultured astrocytes exhibiting increased MaxiKα plasma membrane expression, analysis of intracellular MaxiKα labeling intensity reveals a slight yet statistically significant reduction of immunolabeling intensity in cell cultures stimulated with U46619, caffeine, or thapsigargin (Fig. 7H; 10 cells/condition, n=3). These data support the hypothesis that the MaxiKα comprising the increased plasma membrane distribution in response to stimulation may be recruited and translocated from the intracellular pools of MaxiKα associated with the microtubule network. Consistent with the view that microtubules serve as a reservoir and conduit for MaxiKα trafficking to the surface, U46619, caffeine, or thapsigargin treatment of astrocytes under depolymerized microtubule conditions (colchicine treatment) failed to exhibit an increase in the number of cells expressing MaxiKα at the surface membrane (Fig. 7G, blue bars).
Preincubation of astrocytes with BAPTA-AM prevents increases in MaxiKα surface expression
We further investigated the role of Ca2+ in caffeine/thapsigargin/U46619 induced MaxiKα cell surface expression. To provide additional support for the hypothesis that Ca2+ is a mediating factor in astrocyte activity dependent MaxiKα cell membrane expression, primary cultured astrocytes were preincubated with BAPTA-AM, a cell permeable Ca2+ chelator. Astrocytes preincubated with 50 μM BAPTA-AM for 30 minutes prior to U46619 application exhibited significantly less MaxiKα surface expression in comparison to vehicle preincubation. Representative images of BAPTA-AM + U46619 treated cultured astrocytes are shown in Figs. 7D-F. Similarly, 50 μM BAPTA-AM preincubation was also able to effectively prevent MaxiKα cell membrane expression induced by caffeine and thapsigargin application. The bar plot summary comparing the average number of cells expressing cell-surface MaxiKα (Fig. 7G) reveal that BAPTA-AM preincubation (red bars) causes a ~6-fold reduction in the number of astrocytes expressing surface MaxiKα after treatment with U46619/caffeine/thapsigargin (compare with shaded bar in Fig. 7G, and with black and gray bars of Fig. 6G). BAPTA-AM preincubation prior to cell stimulation reduces the number of cells exhibiting MaxiKα surface expression to levels comparable to that of untreated controls (Fig. 7G, red vs. open bars) and BAPTA-AM alone (Fig. 7G, red vs. black bars) treated cultured astrocytes (~5%). These results suggest that the changes in intracellular Ca2+, as a result of pharmacological/physiological stimulation, may be necessary for increased surface expression of MaxiK channels in cultured murine astrocytes.
U46619 treatment increases outward macroscopic K+ currents
To determine whether the increase of astrocytic MaxiKα labeling at the plasma membrane in response to U46619 exposure resulted in an increase in functional MaxiK channels, we recorded macroscopic K+ currents in 1 μM U46619 stimulated primary astrocytes using the same protocol as in Fig. 1A. K+ currents elicited by step depolarizations from -70 mV to +160 mV (Vh = 0 mV) were recorded in vehicle treated cells (Fig. 8A, upper trace) or cultured astrocytes treated with 1 μM U46619 for 6 hours prior to current recording (Fig. 8A, lower trace). The average current density-voltage (I-V) plot (Fig. 8B, n = 6 cells per condition) shows a ~3-fold increase in K+ current amplitude in U46619 treated astrocytes suggesting that the increased MaxiKα labeling observed by immunocytochemistry form functional channels resulting in increased outward K+ current.
Figure 8.
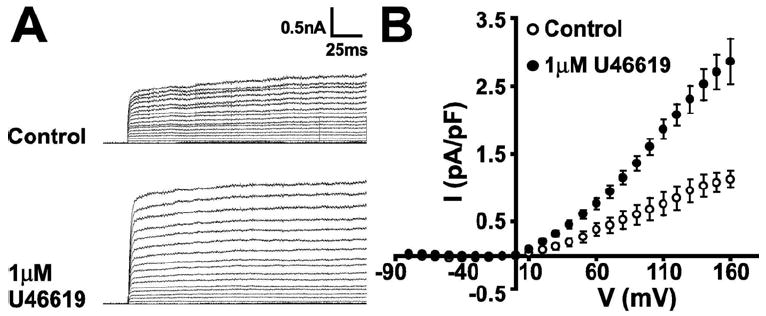
U46619 stimulation of cultured murine astrocytes results in increased K+ currents. (A, upper) Control whole-cell K+ currents recorded during step depolarization from -70 to +160 mV every 10 mV. Vh = 0 mV. (A, lower) K+ currents were significantly greater in ~ 50% of cultured astrocytes stimulated with 1 μM U46619. (B) Average current density-voltage curves for untreated cultured astrocytes (control) and for astrocytes responding to stimulation with U46619 (n = 6 cells/group).
MaxiKα co-localizes with α-tubulin in the cerebral cortex of newborn mice
Previous studies have well-established that microtubule expression is low in mature astrocytes of adult brains (Peters et al., 1991). Our own confocal images of adult mouse cortex double labeled with GFAP (Fig. 9A, red) and α-tubulin (Fig. 9B, green) reiterated this long-held finding. In the overlay image of GFAP and α-tubulin in the cerebral cortex region in the adult mouse brain (Fig. 9C), GFAP labeling is distinct from α-tubulin with minimal fluorophore coincidence indicating that GFAP expressing mature astrocytes exhibit a minimal expression of microtubules. In contrast, newborn mice brain sections (postnatal day 1) simultaneously labeled with both GFAP (Fig. 9D, red) and α-tubulin (Fig. 9E, green) showed robust immunoreactivity of α-tubulin in GFAP expressing astrocytes. In confocal images taken with identical acquisition parameters as in the images of adult brains (Figs. 9A-C), high prevalence of yellow colocalization between the two fluorophores in Fig. 9F indicate that in-vivo GFAP-positive astrocytes in newborn mice exhibit a strong expression of microtubules.
Figure 9.
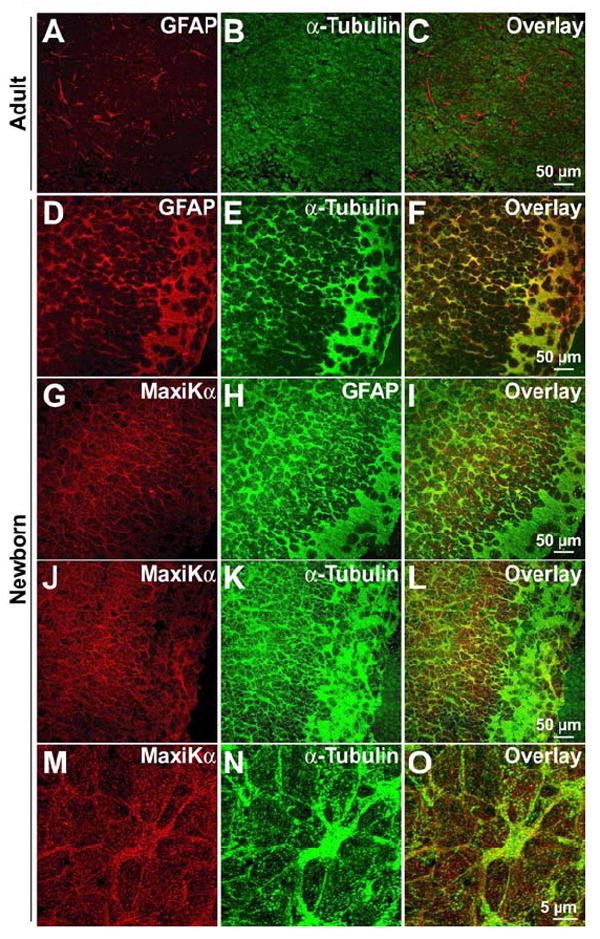
MaxiKα co-localizes with α-tubulin in the newborn cerebral cortex. Cryosections from adult mouse brains (A-C) and newborn (P1) mouse brains (D-O). Co-immunolabeling of GFAP (A) and α-tubulin (B) in adult cortical sections reveal minimal colocalization (C) indicating the lack of α-tubulin expression in mature astrocytes. In contrast, double immunolabeling of GFAP (D) and α-tubulin (E) in P1 mouse cortices show significant colocalization in the image overlay (F). Newborn brain slices labeled with MaxiKα (G) and GFAP (H) exhibit a high degree of co-localization (I) indicating a substantial expression of astrocytic MaxiKα in situ. Comparable to the data found in cultured murine cortical astrocytes, newborn brain cortex sections labeled with MaxiKα (J, 6x zoom M) and α-tubulin (K, 6x zoom N) exhibit significant co-localization (L, 6x zoom O).
To determine if the GFAP-positive in-vivo astrocytes in the newborn mouse brain were immunoreactive for MaxiKα, brain slices were simultaneously labeled with both GFAP monoclonal antibodies and MaxiKα polyclonal antibodies. Unlike adult MaxiKα brain distribution exhibiting minimal colocalization between GFAP and MaxiKα save for perivascular astrocytes (Price et al., 2002), cortical regions of newborn mice brain labeled with MaxiKα (Fig. 9G, red) and GFAP (Fig. 9H, green) display a high degree of co-localization in the large majority of GFAP-positive astrocytes (Fig. 9I).
While confocal images in brain tissue may lack the resolution capacity to differentiate individual microtubules as observed in images of primary cultured cells, our confocal data still reveals a substantial co-localization of MaxiKα with the microtubule network in newborn mouse brain slices (Figs. 9J-O). Consistent with our colocalization findings between MaxiKα and α-tubulin in primary cultured cortical astrocytes, cortical tissue sections from P1 newborn mice brains simultaneously immunolabeled for MaxiKα (Figs. 9J, M 6x zoom) and α-tubulin (Figs. 9K, N 6x zoom) exhibited a considerable co-localization between the two fluorophores in the image overlays (Figs. 9L, O 6x zoom).
Discussion
MaxiK channels are involved in a wide assortment of physiological and pathophysiological processes which may in part be regulated by their cellular and subcellular distribution (Gribkoff et al., 2001). Previous studies on MaxiK distribution in the brain have largely spotlighted neuronal form and function (Sailer et al., 2006;Gu N et al., 2007;Misonou et al., 2006) with sparing emphasis on MaxiK in glia. As there has been a recent emerging research focus on understanding the complexities of integrated brain function and dysfunction via interactions of the neurovascular unit, the multi-cellular interplay between neurons, astrocytes, oligodendrocytes, microglia, and cerebral vasculature (Lok J et al., 2007;Abbott et al., 2006;Park et al., 2003), the knowledge of glial MaxiK subcellular distribution and regulatory traffic mechanisms are important elements in understanding cellular activity in the brain.
The findings presented in this study provide the first direct demonstration that the α-subunit of MaxiK channels in cultured murine cortical astrocytes are distributed intracellularly, associated with the microtubule network. Furthermore, we put forward the novel finding that surface expression of astrocytic MaxiK is regulated by changes in intracellular Ca2+ concentration. To reveal MaxiKα channel subcellular distribution in cultured astrocytes, we implemented three independent visualization methodologies: 1) Specific antibodies directed against the α-subunit of MaxiK, 2) AlexaFluor 594 conjugated iberiotoxin, and 3) Expression of EGFP conjugated MaxiKα delivered by adenoviral infection. Quantitative colocalization analysis of all three visualization strategies confirmed the major finding of MaxiKα association to the astrocytic microtubule network. Iberiotoxin binding of intracellular, microtubule associated MaxiK suggest that the channel is in its tetrameric conformation. Additionally, previously published findings of MaxiKα immunolabeling in other brain cells such as neurons in culture and in brain slices indicate a predominant plasma membrane distribution with no reports of cytosolic, microtubule associated MaxiK channels (Sailer et al., 2006;Misonou et al., 2006). Thus, our finding of the intracellular, robust microtubule distribution of MaxiKα in cultured astrocytes may be a unique attribute to this particular cell type.
Further evidence of this association was attained by the significant decrease of colocalization between MaxiKα and astrocytic microtubules upon depolymerization of microtubules with either colchicine or nocodazole. These findings suggest that MaxiKα interaction with microtubules is dependent on the structural integrity of filamentous microtubules rather than disseminated tubulin monomers. Additional biochemical confirmation of MaxiKα interaction with α-tubulin was demonstrated with the C-terminus “tail” of MaxiKα successfully pulling down α-tubulin from brain lysates. This finding suggests that the microtubule association domain of MaxiKα is located within the intracellular C-terminus “tail” domain.
In addition to the in-vitro interaction between MaxiKα and α-tubulin, native brain tissue MaxiKα was co-immunoprecipitated with microtubules providing further biochemical confirmation of MaxiKα→α-tubulin association in-situ. Whether this interaction is direct or indirect as mediated by a third party protein remains to be seen. Previous studies have reported MaxiK channel interaction with the light chain of microtubule associated protein 1A (MAP1A) in rat brain lysates and in Purkinje cells from adult mouse cerebellum (Park et al., 2004) but our colocalization and biochemical experiments yielded negative results with MAP1A (data not shown) suggesting that a different third party protein may be mediating the binding of MaxiKα to microtubules in cultured murine astrocytes.
Previous studies have demonstrated that MaxiK channel activity is regulated by pools of deep cytosolic Ca2+ (Young et al., 2004). In human uterine myocytes, application of caffeine to release the stores of deep cytosolic Ca2+ evokes the translocation of a proteolytic fragment of a MaxiKα splice variant likely from the endoplasmic reticulum to the surface membrane (Korovkina et al., 2006). In parallel to the findings in human uterine myocytes, we have found that application of caffeine to cultured murine astrocytes also causes an increase in surface expression of MaxiKα but in this case, from the microtubule network. As application of thapsigargin also evokes a similar ~6-fold increase in number of cells with plasma membrane expression, this would suggest that MaxiKα translocation and surface expression is regulated by increases in cytosolic Ca2+ rather than a caffeine-specific activity, i.e. ryanodine receptors. Interestingly, MaxiKα activity in glioma cells is linked to inositol 1,4,5-triphosphate receptors (Weaver et al., 2007); whether MaxiKα targeting in glioma cells is affected by Ca2+ from this or other source remains to be established. Further positive identification of intracellular Ca2+ as a mediating factor for MaxiKα surface expression in normal cultured astrocytes was demonstrated by the inhibition of plasma membrane distribution by preincubation with membrane permeable BAPTA-AM to chelate cytosolic Ca2+.
The decrease in intracellular MaxiKα by increased cytosolic Ca2+ in the presence of caffeine and thapsigargin (and U46619) coupled with the lack of post-stimulation increase in surface expression under depolymerized microtubule conditions support the idea that MaxiKα associated with the microtubule network serve as a reservoir awaiting an increase in cytosolic Ca2+ for initiation of transport to the plasma membrane. Additionally, because MaxiKα associated to the microtubule network is in its tetrameric conformation, a potential functional MaxiKα role in the cytoplasm cannot be discarded at this time.
As efflux of K+ through MaxiK channels distributed in the endfeet of perivascular astrocytes has been proposed as a potential regulating factor in neurovascular coupling (Filosa et al., 2006), our finding that increases in cytosolic Ca2+ increases MaxiKα surface expression may provide clues into recruitment mechanisms which would have an impact on K+ siphoning especially in the newborn brain. Recent studies (Metea et al., 2007) have demonstrated that K+ efflux from depolarized retinal glial endfeet have no effect on the diameter of retinal arterioles, thereby suggesting that K+ siphoning may not contribute to neurovascular coupling in this particular cell system. While untested as of yet in cortical glia, our finding that elevations in deep pools of cytosolic Ca2+ regulates surface expression of MaxiKα in cortical astrocytes may provide an additional potential element that can affect glial K+ influence on vascular tone. One could predict that depending on the numbers of MaxiKα at the plasma membrane that would in turn define the amount of K+ being released to the perivascular space, the vascular response could be vasodilation (K+ at levels to open smooth muscle inward rectifier K+ channels causing hyperpolarization) or vasoconstriction (if K+ is high enough to cause depolarization) (Straub et al., 2007).
Comparable to the effects of caffeine/thapsigargin stimulation, our studies have shown that application of thromboxane A2 receptor agonist, U46619, causes a similar increase in MaxiKα plasma membrane distribution in cultured murine astrocytes. This finding provides a prospective physiological candidate which may impact neurovascular coupling by recruiting additional MaxiK channels to the surface membrane thereby increasing glial K+ efflux to affect the adjacent cerebral vasculature. Reciprocally, as the physiological consequences of thromboxane A2 signaling in glial cells currently remains unclear, linking TXA2 to neurovascular coupling may help to shed light on the matter.
This model of Ca2+-regulated, astrocytic MaxiKα surface expression via microtubule transport observed in the primary culture test system may not be a major operative mechanism in normal, mature astrocytes in-vivo as mature astrocytes are not known to contain a substantial amount of microtubules under normal physiological conditions (Hajos et al., 1984;Peters et al., 1991) and reiterated in our immunolabeling experiments in adult brain tissue sections. Rather, as astrocytic microtubules are prominently expressed during neonatal brain development (Vaughn et al., 1967) as well as during incidences of brain injury leading to astrocytosis (Vaughn et al., 1970), our proposed model of intracellular Ca2+ evoked changes in astrocytic MaxiKα distribution may serve a more appreciable role during the cellular organization of early brain development or during brain injury and disease. As evidenced by our immunohistochemistry results in cortical sections from the newborn mice brain, the substantial co-localization of MaxiKα with the microtubule network would support the position that Ca2+-dependent MaxiK trafficking and surface expression during neonatal/fetal brain architecture formation may play a part in the developmental role of mature astrocytes in neurovascular coupling.
Although the proliferative nature and general characteristics of the primary cultured immature astrocytes may not be entirely reflective of mature astrocytes in-vivo, the cellular behavior of this model system may provide invaluable data and open avenues of study apropos to characterizing physiological and pathophysiological reactive astrocytes. As a variety of pathophysiological cerebral conditions which arouse reactive astrocytes (i.e. intracerebral hemorrhage, stroke and hypertension) also evoke changes in thromboxane activity (van Kooten et al., 1999;Mayhan, 1992;Saloheimo et al., 2005) which can affect interactions in the neurovascular unit, our findings suggesting the relationship between TXA2 and astrocytic MaxiKα may be helpful in future research directed at understanding brain dysfunction and trauma. In an additional, congruent avenue of pathophysiological astrocyte-relevant research, gliomas and astrocytomas, brain tumors derived from unchecked astrocyte proliferation, have been previously shown to express MaxiK channels (Ransom et al., 2001;Weaver et al., 2006). As this category of brain tumors has been previously reported to not only express thromboxane receptors (Honma et al., 2006) but release thromboxane as well (Murphy et al., 1990), our findings of MaxiKα response to U46619 stimulation warrants further study into the relationship between thromboxane and MaxiK channels in astrocyte-derived brain tumors.
Acknowledgments
This work was supported by NIH grants HL54970 (LT), HL088640 (ES), and AHA National Center grant 0435084N (AA).
References
- Abbott NJ, Ronnback L, Hansson E. Astrocyte-endothelial interactions at the blood-brain barrier. Nature Reviews Neuroscience. 2006;7:41–53. doi: 10.1038/nrn1824. [DOI] [PubMed] [Google Scholar]
- Anderson CM, Bergher JP, Swanson RA. ATP-induced ATP release from astrocytes. Journal of Neurochemistry. 2004;88:246–256. doi: 10.1111/j.1471-4159.2004.02204.x. [DOI] [PubMed] [Google Scholar]
- Anderson CS, MacKinnon R, Smith C, Miller C. Charybdotoxin block of single Ca2+-activated K+ channels. Effects of channel gating, voltage, and ionic strength. J Gen Physiol. 1988;91:317–333. doi: 10.1085/jgp.91.3.317. [DOI] [PMC free article] [PubMed] [Google Scholar]
- Barres BA, Koroshetz WJ, Chun LLY, Corey DP. Ion Channel Expression by White Matter Glia - the Type-1 Astrocyte. Neuron. 1990;5:527–544. doi: 10.1016/0896-6273(90)90091-s. [DOI] [PubMed] [Google Scholar]
- Bychkov R, Glowinski J, Giaume C. Sequential and opposite regulation of two outward K+ currents by ET-1 in cultured striatal astrocytes. American Journal of Physiology-Cell Physiology. 2001;281:C1373–C1384. doi: 10.1152/ajpcell.2001.281.4.C1373. [DOI] [PubMed] [Google Scholar]
- Fields RD, Stevens-Graham B. Neuroscience - New insights into neuron-glia communication. Science. 2002;298:556–562. doi: 10.1126/science.298.5593.556. [DOI] [PMC free article] [PubMed] [Google Scholar]
- Filosa JA, Bonev AD, Nelson MT. Calcium dynamics in cortical astrocytes and arterioles during neurovascular coupling. Circulation Research. 2004;95:E73–E81. doi: 10.1161/01.RES.0000148636.60732.2e. [DOI] [PubMed] [Google Scholar]
- Filosa JA, Bonev AD, Straub SV, Meredith AL, Wilkerson MK, Aldrich RW, Nelson MT. Local potassium signaling couples neuronal activity to vasodilation in the brain. Nature Neuroscience. 2006;9:1397–1403. doi: 10.1038/nn1779. [DOI] [PubMed] [Google Scholar]
- Finkbeiner SM. Glial Calcium. Glia. 1993;9:83–104. doi: 10.1002/glia.440090202. [DOI] [PubMed] [Google Scholar]
- Galvez A, Gimenezgallego G, Reuben JP, Roycontancin L, Feigenbaum P, Kaczorowski GJ, Garcia ML. Purification and Characterization of A Unique, Potent, Peptidyl Probe for the High Conductance Calcium-Activated Potassium Channel from Venom of the Scorpion Buthus-Tamulus. J Biol Chem. 1990;265:11083–11090. [PubMed] [Google Scholar]
- Gebremedhin D, Yamaura K, Zhang CY, Bylund J, Koehler RC, Harder DR. Metabotropic glutamate receptor activation enhances the activities of two types of Ca2+-activated K+ channels in rat hippocampal astrocytes. Journal of Neuroscience. 2003;23:1678–1687. doi: 10.1523/JNEUROSCI.23-05-01678.2003. [DOI] [PMC free article] [PubMed] [Google Scholar]
- Gribkoff VK, Starrett JE, Dworetzky SI. Maxi-K potassium channels: Form, function, and modulation of a class of endogenous regulators of intracellular calcium. Neuroscientist. 2001;7:166–177. doi: 10.1177/107385840100700211. [DOI] [PubMed] [Google Scholar]
- Gu N, Vervaeke K, Storm JF. BK potassium channels facilitate high-frequency firing and cause early spike frequency adaptation in rat CA1 hippocampal pyramidal cells. J Physiol. 2007;580(Pt3):859–882. doi: 10.1113/jphysiol.2006.126367. [DOI] [PMC free article] [PubMed] [Google Scholar]
- Hajos F, Rostomian MA. Localization of Alpha-Tubulin Immunoreactivity to Cerebellar Bergmann Glia with the Tu-01 Antibody. Histochemistry. 1984;81:297–299. doi: 10.1007/BF00495643. [DOI] [PubMed] [Google Scholar]
- Hamel E. Perivascular nerves and the regulation of cerebrovascular tone. Journal of Applied Physiology. 2006;100:1059–1064. doi: 10.1152/japplphysiol.00954.2005. [DOI] [PubMed] [Google Scholar]
- Hansson E, Johansson BB, Westergren I, Ronnback L. Glutamate-Induced Swelling of Single Astroglial Cells in Primary Culture. Neuroscience. 1994;63:1057–1066. doi: 10.1016/0306-4522(94)90572-x. [DOI] [PubMed] [Google Scholar]
- He F, Sun YE. Glial cells more than support cells? International Journal of Biochemistry & Cell Biology. 2007;39:661–665. doi: 10.1016/j.biocel.2006.10.022. [DOI] [PubMed] [Google Scholar]
- Honma S, Saika M, Ohkubo S, Kurose H, Nakahata N. Thromboxane A(2) receptor-mediated G(12/13)-dependent glial morphological change. European Journal of Pharmacology. 2006;545:100–108. doi: 10.1016/j.ejphar.2006.06.062. [DOI] [PubMed] [Google Scholar]
- Huang JS, Ramamurthy SK, Lin X, Le Breton GC. Cell signalling through thromboxane A(2) receptors. Cell Signal. 2004;16:521–533. doi: 10.1016/j.cellsig.2003.10.008. [DOI] [PubMed] [Google Scholar]
- Iadecola C. Neurovascular regulation in the normal brain and in Alzheimer’s disease. Nature Reviews Neuroscience. 2004;5:347–360. doi: 10.1038/nrn1387. [DOI] [PubMed] [Google Scholar]
- Kitanaka J, Hashimoto H, Sugimoto Y, Sawada M, Negishi M, Suzumura A, Marunouchi T, Ichikawa A, Baba A. Cdna Cloning of A Thromboxane A(2) Receptor from Rat Astrocytes. Biochimica et Biophysica Acta-Molecular Cell Research. 1995;1265:220–223. doi: 10.1016/0167-4889(94)00225-4. [DOI] [PubMed] [Google Scholar]
- Kitanaka J, Takuma K, Kondo K, Baba A. Prostanoid receptor-mediated calcium signaling in cultured rat astrocytes. Japanese Journal of Pharmacology. 1996;71:85–87. doi: 10.1254/jjp.71.85. [DOI] [PubMed] [Google Scholar]
- Knaus HG, Eberhart A, Glossmann H, Munujos P, Kaczorowski GJ, Garcia ML. Pharmacology and structure of high conductance calcium-activated potassium channels. Cell Signal. 1994;6:861–870. doi: 10.1016/0898-6568(94)90019-1. [DOI] [PubMed] [Google Scholar]
- Korovkina VP, Brainard AM, England SK. Translocation of an endoproteolytically cleaved maxi-K channel isoform: mechanisms to induce human myometrial cell repolarization. Journal of Physiology-London. 2006;573:329–341. doi: 10.1113/jphysiol.2006.106922. [DOI] [PMC free article] [PubMed] [Google Scholar]
- Li NZ, Sul JY, Haydon PG. A calcium-induced calcium influx factor, nitric oxide, modulates the refilling of calcium stores in astrocytes. Journal of Neuroscience. 2003;23:10302–10310. doi: 10.1523/JNEUROSCI.23-32-10302.2003. [DOI] [PMC free article] [PubMed] [Google Scholar]
- Lok J, Gupta P, Guo S, Kim WJ, Whalen MJ, van Leyen K, Lo EH. Cell-cell Signaling in the Neurovascular Unit. Neurochem Res. 2007 doi: 10.1007/s11064-007-9342-9. [DOI] [PubMed] [Google Scholar]
- Lu R, Alioua A, Kumar Y, Eghbali M, Stefani E, Toro L. MaxiK channel partners: physiological impact. Journal of Physiology-London. 2006;570:65–72. doi: 10.1113/jphysiol.2005.098913. [DOI] [PMC free article] [PubMed] [Google Scholar]
- Lytton J, Westlin M, Hanley MR. Thapsigargin Inhibits the Sarcoplasmic Or Endoplasmic-Reticulum Ca-Atpase Family of Calcium Pumps. J Biol Chem. 1991;266:17067–17071. [PubMed] [Google Scholar]
- Mayhan WG. Role of Prostaglandin-H2-Thromboxane-A2 in Responses of Cerebral Arterioles During Chronic Hypertension. American Journal of Physiology. 1992;262:H539–H543. doi: 10.1152/ajpheart.1992.262.2.H539. [DOI] [PubMed] [Google Scholar]
- McCarthy KD, Devellis J. Preparation of Separate Astroglial and Oligodendroglial Cell-Cultures from Rat Cerebral Tissue. Journal of Cell Biology. 1980;85:890–902. doi: 10.1083/jcb.85.3.890. [DOI] [PMC free article] [PubMed] [Google Scholar]
- Medhora M, Narayanan J, Harder D. Dual regulation of the cerebral microvasculature by epoxyeicosatrienoic acids. Trends in Cardiovascular Medicine. 2001;11:38–42. doi: 10.1016/s1050-1738(01)00082-2. [DOI] [PubMed] [Google Scholar]
- Meera P, Wallner M, Toro L. A neuronal beta subunit (KCNMB4) makes the large conductance, voltage- and Ca2+-activated K+ channel resistant to charybdotoxin and iberiotoxin. Proc Natl Acad Sci USA. 2000;97:5562–5567. doi: 10.1073/pnas.100118597. [DOI] [PMC free article] [PubMed] [Google Scholar]
- Metea MR, Kofuji P, Newman EA. Neurovascular coupling is not mediated by potassium siphoning from glial cells. Journal of Neuroscience. 2007;27:2468–2471. doi: 10.1523/JNEUROSCI.3204-06.2007. [DOI] [PMC free article] [PubMed] [Google Scholar]
- Misonou H, Menegola M, Buchwalder L, Park EW, Meredith A, Rhodes KJ, Aldrich RW, Trimmer JS. Immunolocalization of the Ca2+-activated K+ channel Slo1 in axons and nerve terminals of mammalian brain and cultured neurons. Journal of Comparative Neurology. 2006;496:289–302. doi: 10.1002/cne.20931. [DOI] [PMC free article] [PubMed] [Google Scholar]
- Mulligan SJ, MacVicar BA. Calcium transients in astrocyte endfeet cause cerebrovascular constrictions. Nature. 2004;431:195–199. doi: 10.1038/nature02827. [DOI] [PubMed] [Google Scholar]
- Murphy S, Welk G, Thwin SS. Stimulation of Thromboxane Release from Primary-Cell Cultures Derived from Human Astrocytic Glioma Biopsies. Glia. 1990;3:205–211. doi: 10.1002/glia.440030307. [DOI] [PubMed] [Google Scholar]
- Nakahata N, Ishimoto H, Kurita M, Ohmori K, Takahashi A, Nakanishi H. Thromboxane-A2 Receptors in Rabbit Cultured Astrocytes. Journal of Pharmacobio-Dynamics. 1992;15:S54. doi: 10.1016/s0006-8993(10)80013-7. [DOI] [PubMed] [Google Scholar]
- Nelson MT, Cheng H, Rubart M, Santana LF, Bonev AD, Knot HJ, Lederer WJ. Relaxation of arterial smooth muscle by calcium sparks. Science. 1995;270:633–637. doi: 10.1126/science.270.5236.633. see comments. [DOI] [PubMed] [Google Scholar]
- Oh Y. Ion channels in neuroglial cells. Kaohsiung J Med Sci. 1997;13(1):1–9. [PubMed] [Google Scholar]
- Park JA, Choi KS, Kim SY, Kim KW. Coordinated interaction of the vascular and nervous systems: from molecule- to cell-based approaches. Biochemical and biophysical research communications. 2003;311:247–253. doi: 10.1016/j.bbrc.2003.09.129. [DOI] [PubMed] [Google Scholar]
- Park SM, Liu GX, Kubal A, Fury M, Cao LX, Marx SO. Direct interaction between BKCa potassium channel and microtubule-associated protein 1A. FEBS letters. 2004;570:143–148. doi: 10.1016/j.febslet.2004.06.037. [DOI] [PubMed] [Google Scholar]
- Paulson OB, Newman EA. Does the Release of Potassium from Astrocyte Endfeet Regulate Cerebral Blood-Flow. Science. 1987;237:896–898. doi: 10.1126/science.3616619. [DOI] [PMC free article] [PubMed] [Google Scholar]
- Peters A, Palay SL, Webster MA. The Fine Structure of the Nervous System: Neurons and Their Supporting Cells. Third. New York: Oxford University Press; 1991. [Google Scholar]
- Price DL, Ludwig JW, Mi H, Schwarz TL, Ellisman MH. Distribution of rSlo Ca2+-activated K+ channels in rat astrocyte perivascular endfeet. Brain Res. 2002;956:183–193. doi: 10.1016/s0006-8993(02)03266-3. [DOI] [PubMed] [Google Scholar]
- Ransom CB, Sontheimer H. BK channels in human glioma cells. Journal of Neurophysiology. 2001;85:790–803. doi: 10.1152/jn.2001.85.2.790. [DOI] [PubMed] [Google Scholar]
- Ropero AB, Eghbali M, Minosyan TY, Tang GH, Toro L, Stefani E. Heart estrogen receptor alpha: Distinct membrane and nuclear distribution patterns and regulation by estrogen. Journal of Molecular and Cellular Cardiology. 2006;41:496–510. doi: 10.1016/j.yjmcc.2006.05.022. [DOI] [PubMed] [Google Scholar]
- Sailer CA, Kaufmann WA, Kogler M, Chen L, Sausbier U, Ottersen OP, Ruth P, Shipston MJ, Knaus HG. Immunolocalization of BK channels in hippocampal pyramidal neurons. Eur J Neurosci. 2006;24:442–454. doi: 10.1111/j.1460-9568.2006.04936.x. [DOI] [PubMed] [Google Scholar]
- Saloheimo P, Juvela S, Riutta A, Pyhtinen J, Hillbom M. Thromboxane and prostacyclin biosynthesis in patients with acute spontaneous intracerebral hemorrhage. Thrombosis Research. 2005;115:367–373. doi: 10.1016/j.thromres.2004.08.026. [DOI] [PubMed] [Google Scholar]
- Straub SV, Bonev AD, Wilkerson MK, Nelson MT. Dynamic inositol trisphosphate-mediated calcium signals within astrocytic endfeet underlie vasodilation of cerebral arterioles. J Gen Physiol. 2006;128:659–669. doi: 10.1085/jgp.200609650. [DOI] [PMC free article] [PubMed] [Google Scholar]
- Straub SV, Nelson MT. Astrocytic calcium signaling: The information currency coupling neuronal activity to the cerebral microcirculation. Trends in Cardiovascular Medicine. 2007;17:183–190. doi: 10.1016/j.tcm.2007.05.001. [DOI] [PMC free article] [PubMed] [Google Scholar]
- van Kooten F, Ciabattoni G, Koudstaal PJ, Grobbee DE, Kluft C, Patrono C. Increased thromboxane biosynthesis is associated with poststroke dementia. Stroke. 1999;30:1542–1547. doi: 10.1161/01.str.30.8.1542. [DOI] [PubMed] [Google Scholar]
- Vaughn JE, Pease DC. Electron Microscopic Studies of Wallerian Degeneration in Rat Optic Nerves .2. Astrocytes, Oligodendrocytes and Adventitial Cells. Journal of Comparative Neurology. 1970;140:207–&. doi: 10.1002/cne.901400205. [DOI] [PubMed] [Google Scholar]
- Vaughn JE, Peters A. Electron Microscopy of Early Postnatal Development of Fibrous Astrocytes. American Journal of Anatomy. 1967;121:131–&. doi: 10.1002/aja.1001210109. [DOI] [PubMed] [Google Scholar]
- Weaver AK, Bomben VC, Sontheimer H. Expression and function of calcium-activated potassium channels in human glioma cells. Glia. 2006;54:223–233. doi: 10.1002/glia.20364. [DOI] [PMC free article] [PubMed] [Google Scholar]
- Weaver AK, Olsen ML, McFerrin MB, Sontheimer H. BK channels are linked to inositol 1,4,5-triphosphate receptors via lipid rafts: a novel mechanism for coupling [Ca(2+)](i) to ion channel activation. J Biol Chem. 2007;282:31558–31568. doi: 10.1074/jbc.M702866200. [DOI] [PMC free article] [PubMed] [Google Scholar]
- Wei A, Solaro C, Lingle C, Salkoff L. Calcium sensitivity of BK-type KCa channels determined by a separable domain. Neuron. 1994;13:671–681. doi: 10.1016/0896-6273(94)90034-5. [DOI] [PubMed] [Google Scholar]
- Yamaura K, Gebremedhin D, Zhang C, Narayanan J, Hoefert K, Jacobs ER, Koehler RC, Harder DR. Contribution of epoxyeicosatrienoic acids to the hypoxia-induced activation of Ca2+-activated K+ channel current in cultured rat hippocampal astrocytes. Neuroscience. 2006;143:703–716. doi: 10.1016/j.neuroscience.2006.08.021. [DOI] [PubMed] [Google Scholar]
- Young RC, Zhang PS. Functional separation of deep cytoplasmic calcium from subplasmalemmal space calcium in cultured human uterine smooth muscle cells. Cell Calcium. 2004;36:11–17. doi: 10.1016/j.ceca.2003.11.005. [DOI] [PubMed] [Google Scholar]
- Zonta M, Angulo MC, Gobbo S, Rosengarten B, Hossmann KA, Pozzan T, Carmignoto G. Neuron-to-astrocyte signaling is central to the dynamic control of brain microcirculation. Nature Neuroscience. 2003a;6:43–50. doi: 10.1038/nn980. [DOI] [PubMed] [Google Scholar]
- Zonta M, Sebelin A, Gobbo S, Fellin T, Pozzan T, Carmignoto G. Glutamate-mediated cytosolic calcium oscillations regulate a pulsatile prostaglandin release from cultured rat astrocytes. Journal of Physiology-London. 2003b;553:407–414. doi: 10.1113/jphysiol.2003.046706. [DOI] [PMC free article] [PubMed] [Google Scholar]