Abstract
Complementary to axial, lateral displacement and strain can provide important information on the biological soft tissues. In this paper, the effects of different parameters (i.e., lateral displacement, pitch, beamwidth, beam overlap and interpolation) on lateral displacement estimation were investigated, in simulations and homogeneous phantom experiments, using lateral rigid motion only in order to study its fundamentals separately from the effects of axial motion and two-dimensional (2-D) deformation on lateral displacement estimation. The performance of the lateral estimator was evaluated by measuring its associated bias, jitter and correlation coefficient. Simulation results showed that the bias and jitter of the lateral displacement estimation and correlation coefficient of RF signals undergo periodic variations depending on the lateral displacement, with a period equal to the pitch. The performance of the lateral estimation was improved, when a smaller pitch, or a larger beamwidth, was used. The effect of the pitch on the lateral estimation on lateral displacement estimation was found to be greater than the beamwidth effect. Therefore, a smaller pitch is preferred, when the beam overlap remains the same. The use of cubic spline, instead of linear interpolation, increases the correlation coefficient, and decreases the jitter, with the tradeoff of increased bias. The results of the phantom experiments were shown in good agreement with the simulation findings, including the periodic variation of the performance with lateral displacement, effects of pitch, beamwidth and interpolation method on lateral displacement estimation. In conclusion, smaller pitch, wider beamwidth and spline interpolation are key in reducing the jitter error in the lateral displacement estimation.
Keywords: Beam overlap, Beamwidth, Bias, Correlation Coefficient, Cross-correlation, Displacement, Elastography, Estimation, Imaging, Interpolation, Jitter, Lateral Displacement, Motion, Performance, Pitch, Radiofrequency (RF) Signal, Spline, Strain, Ultrasound
INTRODUCTION
Elastography
Ultrasound elastography has been developed into an effective imaging method of estimating the local elastic properties of biological tissues (Ophir et al. 1991). Typically, an external, static, or quasi-static, compression is applied on the tissue. The resulting displacement distribution within the tissue is estimated using cross-correlation analysis on the acquired pre- and post-compression radio-frequency (RF) signals. The strain distribution is then calculated as the spatial gradient of the displacement (Ophir et al. 1991, Luo et al. 2004). By solving the inverse problem, the shear modulus, or Young’s modulus, can be reconstructed from the estimated displacement and strain images, i.e., elastograms (Skovoroda et al. 1995, Kallel and Bertrand 1996).
Several different elastographic methods and applications have been developed over the past decades. For example, elastography has been successfully applied to the diagnosis of breast lesions and is currently clinically used (Hiltawsky et al. 2001, Itoh et al. 2006). By using the inherent contraction and relaxation of the myocardium as the stimulus, myocardial elastography has developed for noninvasively imaging regional myocardial function (Konofagou et al. 2002, Lee et al. 2007, Luo et al. 2007).
Lateral Motion Estimation
Typically, only the axial (i.e., along ultrasound beams) displacement and strain are estimated in ultrasound elastography due to the fact that the compression is applied in the axial direction in which the ultrasound RF signals are also acquired. However, most biological tissues are nearly incompressible (Parker et al. 1990), i.e., the axial compression leads to expansion in the lateral (i.e., perpendicular to ultrasound beams in the image plane) and elevational (i.e., perpendicular to the image plane) directions. Estimation of the lateral displacement and strain may provide important additional information on the tissue mechanical properties. Furthermore, in cardiac applications, the heart undergoes complex motion and deformation in the three-dimensional (3-D) space. Estimation and interpretation of only the axial information may also result in angle-dependent artifacts (Zervantonakis et al. 2007).
In addition to the axial displacements and strains, elastography has been shown capable of obtaining lateral displacements and strains. Konofagou and Ophir (1998) proposed a lateral displacement estimation method by using the RF signal interpolation in the lateral direction so as to get sub-pitch lateral motion estimate. The correlation coefficient between a one-dimensional (1-D) RF signal kernel in the reference frame and a 1-D kernel in the post-interpolation comparison frame was calculated within a two-dimensional (2-D) search range. The peak location of the correlation coefficient provided both axial and lateral motion. The information of axial strain and lateral displacement was further used to correct the RF signals and compensate for their decorrelation noise on the lateral and axial displacement estimation, respectively (Konofagou and Ophir 1998). Therefore, an iterative and recorrelation strategy was proposed in order to obtain more accurate axial and lateral displacement estimates as well as corresponding images. In Lee et al. (2007), an alternative recorrelation technique was implemented, by shifting RF signal segments in the comparison frame according to the estimated axial displacement, prior to lateral displacement estimation. After recorrelation, the effects of axial motion and deformation on the image quality were effectively compensated.
By taking advantage of the lateral estimation technique, lateral, shear strains and the Poisson’s ratio have been shown capable of being estimated (Konofagou and Ophir 1998, Konofagou et al. 2000a). Shear strains help distinguish different tumors based on their mobility (Konofagou et al. 2000a). Poisson’s ratio elastography and poroelastography have also been developed to estimate the Poisson’s ratio, an important mechanical parameter of the tissues, and to describe spatial and temporal behavior of poroelastic materials, respectively (Konofagou et al. 2001, Righetti et al. 2004, Righetti et al. 2005). In cardiac applications, the axial / lateral estimation of myocardium were used to calculate the angle-independent radial, circumferential and principal strains (Langeland et al. 2005, Lee et al. 2007, Zervantonakis et al. 2007).
Performance Evaluation
In order to improve the performance of elastography, the effects of different parameters on the displacement and strain estimation need to be studied. Previously reported efforts have concentrated on the performance analysis of the axial displacement and strain estimation using different parameters (Walker and Trahey 1994, 1995, Bilgen and Insana 1997a, 1997b, Varghese and Ophir 1997b). However, there are only a few fundamental studies on the performance of the lateral displacement and strain estimation. In particular, the effects of lateral displacement, pitch, beamwidth and beam overlap on the lateral displacement and strain estimation have not been studied thoroughly.
Walker and Trahey (1994) derived analytical expressions predicting the magnitude of jitter for l-D and 2-D time-delay estimation using cross-correlation. In that paper, a 1-D lateral kernel and a 2-D kernel were considered in the 1-D and 2-D problems, respectively. In this paper, the lateral displacement estimation method uses a 1-D axial kernel (Konofagou and Ophir 1998). In Walker and Trahey (Trahey 1994), the RF signal interpolation in the lateral direction (Konofagou and Ophir 1998) had not been taken into account. Kallel and Ophir (1997) studied the effects of 3-D tissue motion on axial strain estimation. Konofagou et al. (2000b) investigated the theoretical bound on the estimation of lateral displacement and strain. The theoretical effects of pitch, beamwidth, lateral strain and lateral interpolation were analyzed within the framework of the Strain Filter (Konofagou et al. 2000b). The theoretical analysis in those two studies (Kallel and Ophir 1997, Konofagou et al. 2000b, Viola and Walker 2002) was based on the correlation coefficient between the pre- and post-deformation RF signals acquired at the same beam location (e.g., at beam n in both pre- and post-deformation frames). The correlation coefficient between consecutive RF signals at the same beam location could also be found in Viola and Walker (2002). However, RF signals obtained at different beam locations due to the lateral search and lateral interpolation (e.g., at beam n and n+Δu in the pre- and post-deformation frames, respectively, where Δu is the sub-beam lateral displacement) had not been taken into account in those studies (Kallel and Ophir 1997, Konofagou et al. 2000b, Viola and Walker 2002). As will be shown in this paper, the correlation coefficient as well as the bias and jitter error of the lateral displacement estimation as a function of the magnitude of the lateral displacement undergo periodic variations. This was not predicted by the previously developed theoretical analysis (Konofagou et al. 2000b). The effects of different interpolation methods on the lateral displacement estimation will also be taken into account in this paper.
The lateral motion leads to a decorrelation increase between the pre- and post-deformation RF signals. Kallel and Ophir (1997) assumed that the point-spread function (PSF) components were separable and found that the effects of lateral displacement and axial strain on the axial strain estimation were also separable. Therefore, the effects of lateral displacement on the axial strain estimation could be decoupled from those of the axial strain. The effects of axial strain on the axial displacement and strain estimation could be significantly reduced by using global axial stretching (Varghese and Ophir 1997a), a local, adaptive stretching method (Alam et al. 1998) or recorrelation techniques (Konofagou and Ophir 1998, Lee et al. 2007). In Kallel and Ophir (1997), the lateral displacements were assumed to be the same within the ultrasonic beams, because the lateral strain was small and the beams were relatively narrow. Therefore, the effects of lateral strain on the axial strain estimation were deemed negligible.
In the analysis of this paper, we assume that the effects of axial displacement and strain on the lateral displacement estimation can be significantly reduced by using the stretching or recorrelation techniques (Varghese and Ophir 1997a, Alam et al. 1998, Konofagou and Ophir 1998, Lee et al. 2007). The effects of lateral strain on the lateral displacement estimation are also deemed negligible.
In this paper, we study the effects of different parameters (i.e., pitch1, beamwidth and interpolation method) on the lateral displacement estimation under well-controlled simulation and experimental conditions, which only consider lateral rigid motion. The axial displacement/strain and lateral strains are thus ignored to separate and emphasize the effects of lateral displacement. In the simulations, a homogeneous phantom is displaced in the lateral direction without any axial displacement/strain or lateral strain. Phantom experiments using lateral rigid motion are also performed to validate the simulation findings.
METHODS
RF Signal Simulation
The pre- and post-displaced RF signals were generated using a 2-D convolution-based linear scattering model (Maurice and Bertrand 1999). The lateral component of a transducer PSF has a Gaussian shape while the axial component is a cosine function modulated by a Gaussian envelope (Maurice and Bertrand 1999). The axial component of a transducer PSF had a 60% -6 dB bandwidth and a 3.3 MHz center frequency whereas the lateral PSF component had a full width at half maximum (FWHM) or, a -6dB beamwidth, varying between 1 and 6 mm. The original lateral pitch or pitch was equal to 0.0156 mm. The sampling frequency of the RF signals was 20 MHz. The speed of sound in tissues was assumed to be equal to 1540 m/s.
The scattering function consisted of point scatterers uniformly distributed in a rectangular sampling grid with a 100-mm width and a 50-mm depth. The grid intervals were equal to the original pitch (i.e., 0.0156 mm) in the lateral direction and the sampling interval (i.e., 0.0385 mm) in the axial direction. In the axial direction, the scatterer density was 12 scatterers / wavelength, satisfying the requirement for fully-developed speckle (Wagner et al. 1983). The strength, or echogeneity, of each scatterer followed a normal distribution.
The 2-D PSF was sampled onto the same sampling grid and was convolved with the scattering function to obtain the pre-displaced RF signals. The scatterers were then moved in the lateral direction with an increment equal to the original pitch. In this way, the lateral displacement was always equal to integer multiples of the sampling interval so that the interpolation on the scattering function (Shapo et al. 1996) was not necessary. The post-displaced RF signals were then obtained from the convolution of the 2-D PSF and the post-displaced scattering function.
In this study, Gaussian white noise was added to the RF signals simulated above. The sonographic signal-to-noise ratio (SNRs), defined as the root-mean-square (RMS) value of the previously simulated RF signal divided by the RMS of the noise, was set to be 60 dB, similar to what was previously considered in prior literature on tissue strain estimation (Walker and Trahey 1995) and myocardial elastography (Lee et al. 2007). Previous studies have also shown that the performance of myocardial elastography remains relatively unaffected when the SNRs is higher than 16 dB (Luo et al. 2008).
Data Processing in Simulation
In the lateral displacement estimation, the original RF signals were decimated (i.e., down-sampled) in the lateral direction. The decimation factor ranged from 10 to 80 to simulate a pitch from 0.156 mm to 1.25 mm. The simulated lateral displacement became a fraction of the pitch.
The pre- and post-displaced RF signals were referred to as reference and comparison signals, respectively. The algorithm developed by Konofagou and Ophir (1998) was used to estimate the lateral displacements. The comparison RF signals were interpolated in the lateral direction, with an interpolation factor of 40. Unless otherwise stated, a linear interpolation method was used since it was the typical method used in literature (Konofagou and Ophir 1998).
The normalized cross-correlation function was used in order to obtain the lowest jitter error (Viola and Walker 2003). The window size was equal to 3.85 mm with a 90% overlap. Since no axial motion was simulated, only a lateral 1-D search was performed to find the RF segment in the post-interpolated comparison signals that best matched the RF segment in the reference signals. The pre-defined search range was larger than the simulated lateral motion. Cosine interpolation was applied around the initial cross-correlation peak to obtain the sub-sample lateral displacements and improve the precision of estimation (Céspedes et al. 1995).
The average estimated lateral displacement was calculated in a region of interest (ROI) of 50 × 50 mm2 located at the center of the simulated phantom. The ROI was smaller than the simulated phantom in order to reduce the boundary effects of the RF signal simulation and lateral displacement estimation. The bias of the estimation was obtained as the simulated lateral motion subtracted from the average estimates, while the jitter was calculated to be equal to the standard deviation (SD) of the estimates (Pinton and Trahey 2006). The mean and SD of the correlation coefficient were also calculated in the same ROI.
Phantom Preparation
A polyacrylamide tissue-mimicking phantom was constructed, prepared in the following manner: a pre-mixed 40% liquid acrylamide (19:1 acrylamide:bis-acrylamide ratio) (Thermo Fisher Scientific Inc., Waltham, MA) was diluted in deionized water to produce an acrylamide concentration of 40% (weight/volume). The resulting solution was dissolved (1.75 ml per total mL) in 1M trishydroxymethylaminomethane (TRIS, 1.0 mL per total ml) with deionized water (7.16 mL per total mL). 10% ammonium persulfate (APS, 8.4 μL per total mL) and N,N,N’,N’-tetramethylethylenediamine (TEMED, Sigma-Aldrich, St. Louis, MO, 0.5 μL per total mL) were subsequently added. The mixture was allowed to polymerize at room temperature for approximately 15 minutes prior to use.
Data Acquisition
As shown in Fig. 1, the phantom was placed in a water tank and subsequently immersed in degassed water. A linear-array transducer (model 10L5, Terason Ultrasound, Burlington, MA) was attached to a computer-controlled positioner (Velmex Inc., Bloomfield, NY) and placed below the water surface but without contact to the phantom. Efforts were made to align the lateral and axial directions of the transducer to the horizontal and vertical directions of the positioner, respectively. The 128-element linear array had a center frequency of 7 MHz. The pitch was approximately equal to 0.30 mm. A Terason 2000 ultrasound system (Teratech Corp., Burlington, MA) was used to drive the transducer. The transmit focus was at a depth of 2.8 cm while dynamic focusing was used in the receive aperture. The RF signals were acquired at a sampling frequency of 30 MHz and a frame rate of about 50 Hz. Each RF frame had 256 beams, which are twice the number of the elements because of the use of beamforming techniques.
Figure 1.
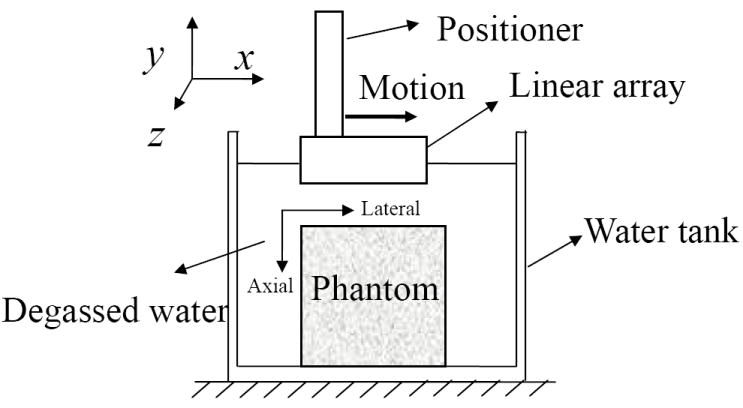
The sketch map of the phantom experiment.
The transducer was then moved by the positioner in the horizontal (or approximately, lateral) direction at a step of 0.015 mm and at a speed of 1 mm/s. Forty steps were performed to reach a maximum lateral motion of 0.6 mm. Five seconds after the transducer was moved to at each position, the RF signals were acquired at a sampling frequency of 30 MHz and a frame rate of about 50 Hz. In the data processing, only one frame of the RF signals was used for each step. Therefore, the frame rate of the RF signals, or the speed at which the probe was moved, did not affect the results, since the transducer moved between acquisitions.
Displacement Estimation
The reference used, with respect to which displacement was estimated, was the first RF frame acquired. The lateral motion between the comparison and reference signals ranged from 0 to 0.6 mm. The axial and lateral displacements were estimated using 1-D cross-correlation and recorrelation methods in a 2-D search (Lee et al. 2007). A normalized cross-correlation function was used with a window size of 2.57 mm and a 90% overlap. The RF signals in the comparison frame were interpolated laterally in order to obtain precise lateral displacement estimation (Konofagou and Ophir 1998, Lee et al. 2007). The interpolation factor was equal to 40. A linear interpolation method was used, unless otherwise stated. Cosine interpolation was applied around the initial cross-correlation peak, first axially and then laterally, to obtain the sub-sample 2-D displacement (Céspedes et al. 1995, Lee et al. 2007).
In order to study the effects of the pitch on lateral displacement estimation, the acquired RF signals were decimated by a factor of 4 or 2 (i.e., from 256 to 128, or 64, beams) in the lateral direction. When 256 or 128 beams were used, the pitch was deemed to be the same, i.e., 0.3 mm. When 64 beams were used, the pitch was imitated to increase from 0.3 to 0.6 mm. In order to compare the performance of different beamwidths, three ROI’s were selected, one near the focal zone and the other two 6.5 mm away from the focal zone. The centers of the ROI’s were at depths of 2.15, 2.8 and 3.45 cm, respectively. The ROI size was equal to 5 × 5 mm2.
Experimental Beamwidth Measurement
The beamwidth of the linear array was measured at the three regions mentioned above. A 5-0 (1.0 metric) braided thread (Ethicon Inc., Somerville, NJ) was immersed in degassed water and fixed to line along the elevational direction of the linear array. The linear array was moved by the positioner in the axial and lateral directions, until the thread was placed and seen at the center of the previously chosen ROI. The RF signals were then acquired; and the beamwidth was measured at the center of each ROI, as the width (FWHM) of the backscattered signals from the thread, i.e., the FWHM of the beam profile along the lateral direction, assuming that the beamwidth within each ROI was the same. For ROI’s I, II and III, the beamwidths were measured to be equal to 0.9, 1.3 and 1.7 mm, respectively. Although transmit focus was at a depth of 2.8 cm, the beamwidth near the transmit focus (ROI II) was wider than in ROI I or III, probably because of the focusing on the receive mode.
RESULTS
Simulation Results
The simulation results are organized as follows. Figure 2 shows the effects of the magnitude of the lateral displacement on lateral displacement estimation at a fixed pitch (0.625mm) and beamwidth (2 mm). Figure 3 compares the estimator performance at different pitches at a fixed beamwidth (2 mm). Figure 4 depicts the beamwidth effects on lateral displacement estimation at a fixed pitch (0.625 mm). Figure 5 illustrates the performance of the lateral displacement estimation at the same beam overlap (defined as 1 − pitch / beamwidth (Konofagou and Ophir 1998)) of 68.75%. Figure 6 compares the linear and cubic spline methods in the RF signal interpolation in the lateral direction. In each figure, the estimated lateral displacement images are first compared. The performance indices (i.e., bias, jitter and correlation coefficient) at different parameters (i.e., pitch, beamwidth, etc) are then plotted against the lateral displacement.
Figure 2.
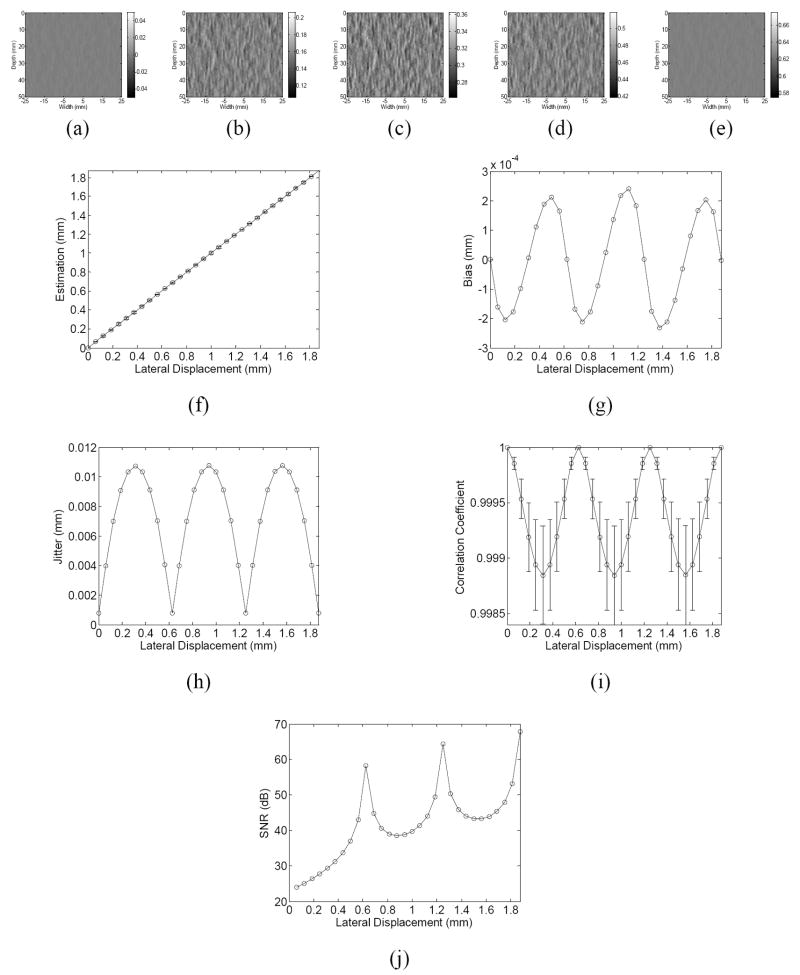
The estimated lateral displacement images when the applied lateral displacement is equal to (a) 0, (b) 0.25, (c) 0.5, (d) 0.75 or (e) 1 pitch, and (f) average of the estimated displacement, (g) the bias and (h) jitter of estimation, (i) average correlation coefficient and (j) signal-to-noise (SNR) ratio of lateral displacement estimation as a function of the applied lateral displacement ranging from 0 to 3 pitch. In (a)-(e), the gray scale is equal to the true displacement ± 0.05 mm. In (f) and (i), the error bar represent one standard deviation (SD). (pitch = 0.625 mm, beamwidth = 2 mm).
Figure 3.
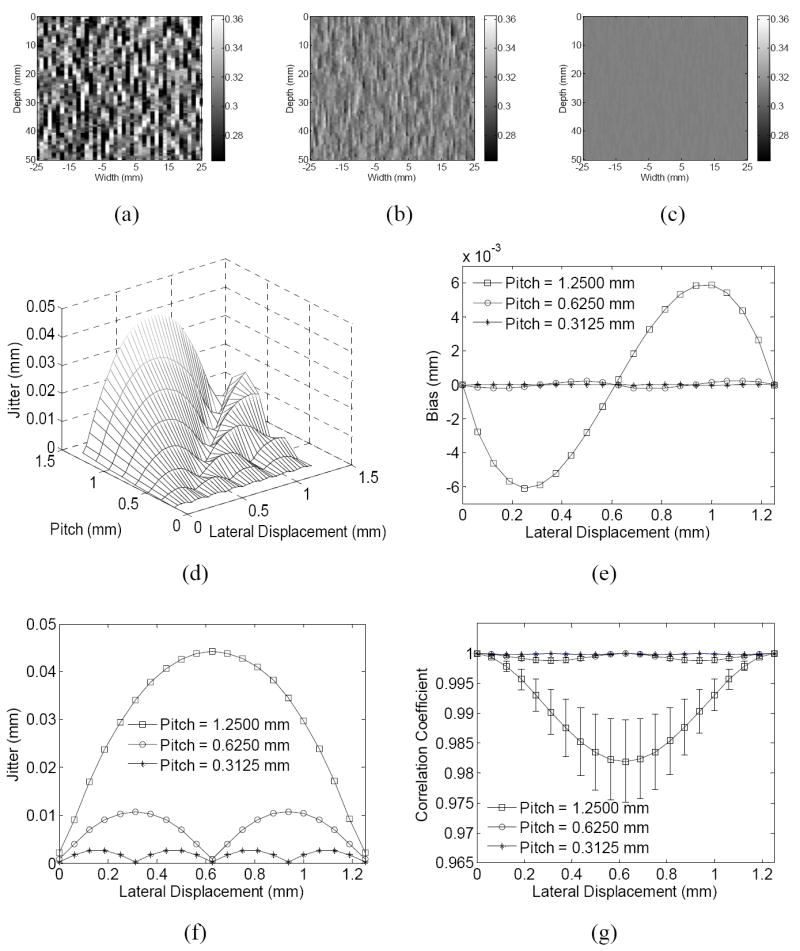
The estimated lateral displacement images when the applied lateral displacement is 0.3125 mm and the pitch is (a) 1.25 mm, (b) 0.625 and (c) 0.3125 mm, respectively, and (d) 3-D plot of the estimation jitter varied with the pitch and lateral displacement, (e) the bias and (f) jitter of the estimation and (g) correlation coefficient (average ± SD) as a function of the lateral displacement at different pitch. (beamwidth = 2 mm).
Figure 4.
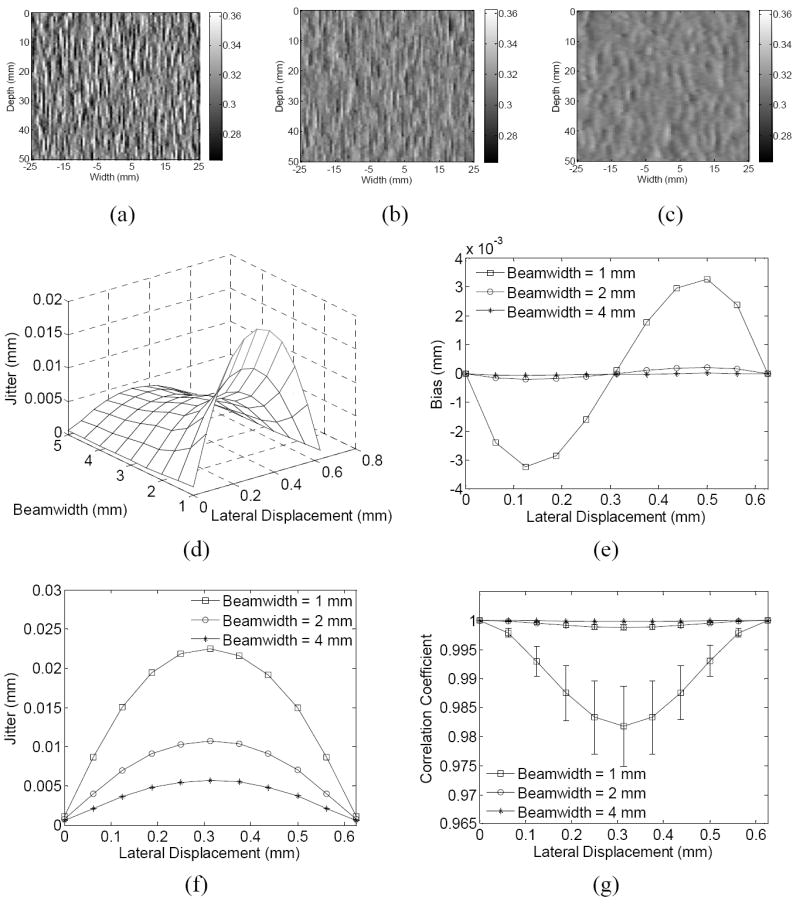
The estimated lateral displacement images when the applied lateral displacement is 0.3125 mm and the beamwidth is (a) 1 mm, (b) 2 and (c) 4 mm, respectively, and (d) 3-D plot of the estimation jitter varied with the beamwidth and lateral displacement, (e) the bias and (f) jitter of the estimation and (g) correlation coefficient (average ± SD) as a function of the lateral displacement at different beamwidth. (pitch = 0.625 mm).
Figure 5.
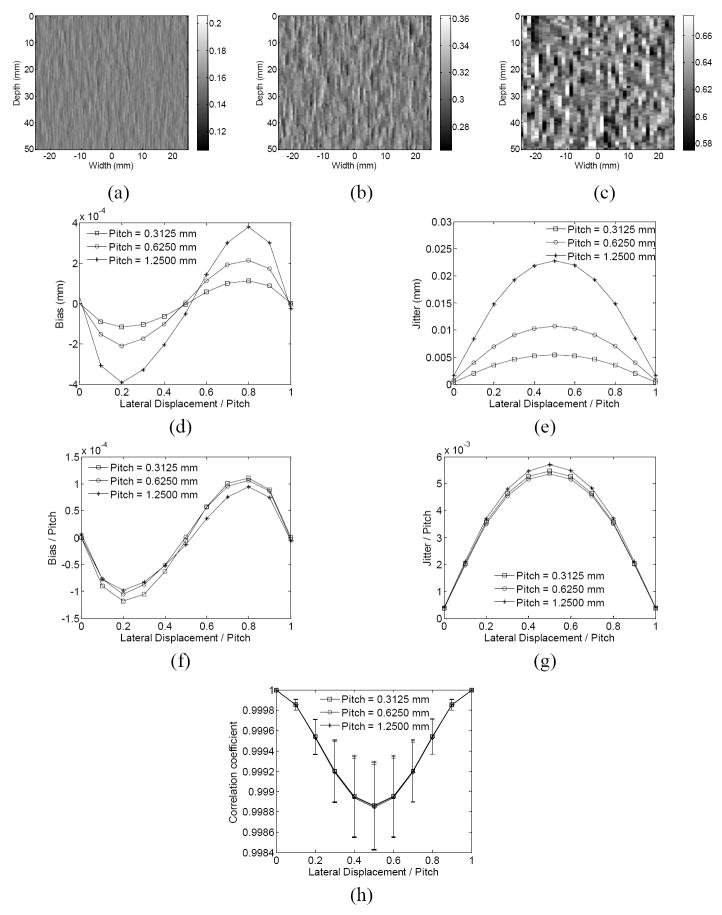
The estimated lateral displacement images with a beam overlap of 68.75% and lateral displacement of 0.5 pitch and pitch of (a) 0.3125, (b) 0.625 and (c) 1.25 mm, and the (d) bias and (e) jitter of estimation in millimeter , the (f) bias and (g) jitter divided by the pitch and the (h) correlation coefficient (average ± SD) as a function of the lateral displacement normalized by the pitch in the simulation. In (e)-(h), the lateral displacement ranges from 0 to 1 pitch and is normalized by the pitch. The pitch is equal to 0.3125, 0.625 and 1.25 mm, respectively, while the corresponding beamwidth is equal to 1, 2 and 4 mm, respectively. The beam overlap remains the same (68.75%).
Figure 6.
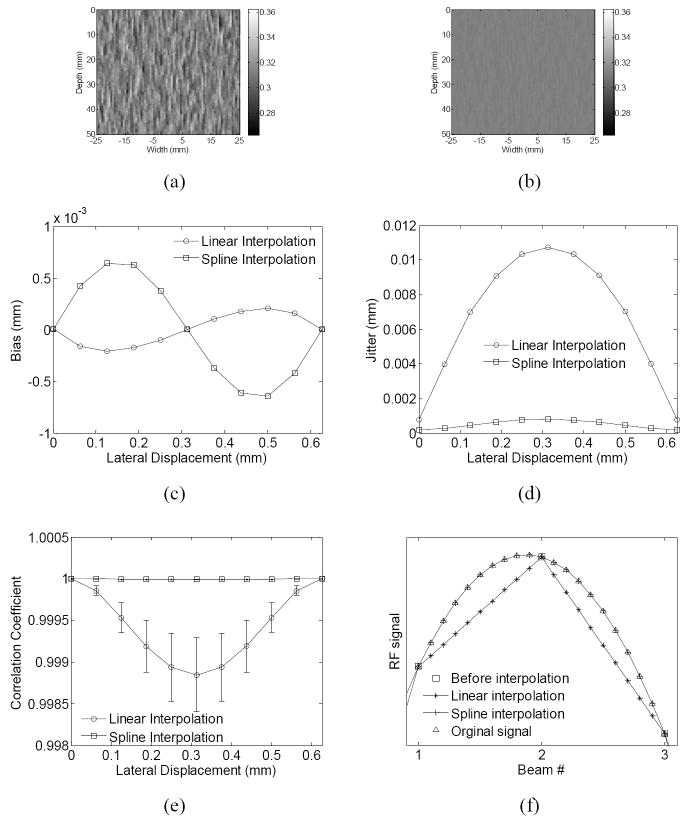
The estimated lateral displacement images with the use of (a) linear and (b) spline interpolation on the RF signals and (c) bias and (d) jitter of estimation and (e) correlation coefficient (average ± SD) in the simulation. (f) compares the interpolated RF signals by different methods with the pre- interpolation signals used in the estimation and the original sub-pitch signal before beam decimation in simulation. An interpolation factor of 10 is used for clarity. (pitch = 0.0625 mm, beamwidth = 2 mm).
At the same pitch and beamwidth, the estimation performs best when the displacement is equal to 0 or the pitch (Fig. 2 (a) and (e)). Figure 2 (c) appears to be the noisiest, followed by Figs. 2 (b) and (d). From Figs. 2 (a) to (e), the performance of the lateral displacement estimation deteriorates first (Fig. 2 (a)-(c) or, 0-0.5 pitch) and then improves (Fig. 2 (c)-(e) or, 0.5-1 pitch). Figures 2(f) shows that the estimation algorithm performs reliably over the entire range of the lateral displacement (i.e., 0-3 pitches). A linear relationship between the true and estimated displacements is shown (r > 0.999).
As shown in Figs. 2(g), (h) and (i), all three performance indices undergo a periodic variation, with the period equal to the pitch. When the displacement is equal to half-integer pitch multiples (e.g., 0, 0.5, 1, 1.5 or 2 pitches), the bias is the lowest and nearly zero. The bias is maximum when the displacement is approximately ± 0.2 pitch away from the beams. The jitter reaches the minimum at integer pitch multiples (e.g., 0, 1 or 2 pitches) and maximum at odd half-integer pitch multiples (e.g., 0.5, 1.5 or 2.5 pitches), respectively. On the other hand, the correlation coefficient is maximum at integer pitch multiples and minimum at odd half-integer pitch multiples, respectively.
Figure 2(j) shows the signal-to-noise ratio (SNR) of the lateral displacement estimation as a function of the lateral displacement. The SNR is defined as the ratio of the average over the SD (i.e., jitter) of estimation. As shown in Fig. 2(j), in addition to the oscillation due to the periodic variation of the jitter, the SNR profile also shows an increased trend with the lateral displacement, suggesting that a larger lateral displacement is preferred in order to obtain a higher SNR.
As shown in Figs. 3(a)-(c), at the same beamwidth of 2mm, the estimation noise drops as the pitch becomes smaller. The bias, jitter and correlation coefficient variation with the lateral displacement in Figs. 3(e)-(g) have the same periodic patterns as in Fig. 2 (e.g., with a period equal to the pitch). More importantly, the estimator performance improves as the pitch decreases, i.e., the jitter and bias drop while the correlation coefficient increases. The 3-D plot of the jitter against the pitch and lateral displacement in Fig. 3(d) shows the same variation as Fig. 3(f).
Figures 4(a)-(c) show that larger beamwidth reduces the estimation noise. As evident in Figs. 4(e)-(g), both the bias and jitter decrease while the correlation coefficient increases when the beamwidth increases. The 3-D plot of the jitter against the beamwidth and lateral displacement in Fig. 4(d) also shows lower jitter at larger beamwidth.
If the same beam overlap is fixed, the estimation noise increases with the pitch (Figs. 5(a)-(c)). The correlation coefficient remains the same, regardless of the pitch (Fig. 5(h)). The bias and jitter in millimeter increase with the pitch (Figs. 5(d) and (e)). At a fixed beam overlap, a larger pitch also denotes a larger beamwidth. These two parameter changes have opposite effects, as discussed and shown in Figs. 3 and 4. Results in Figs. 5(d) and (e) indicate that the effects of the pitch on the lateral displacement estimation are significantly larger than those of the beamwidth. On the other hand, when the bias and jitter are normalized by the pitch and plotted against the lateral displacement, also normalized by the pitch, they become relatively independent of the pitch (or, the beamwidth) (Figs. 5(f) and (g)). Results in Figs. 5(d) and (e) can be explained by the fact that the lateral displacement estimation is first measured in sub-pitch and then converted into mm by multiplying by the pitch.
In Figs. 6 (a) and (b), the spline interpolation on the RF signals is found to obtain significantly smoother displacement estimates, as confirmed by the lower jitter and higher correlation coefficient (Figs. 6(d)-(e)). The tradeoff is that the bias of the spline interpolation is higher, but is still on the same order of 0.1 μm (Fig. 6(c)). As shown in Fig. 6(f), the sub-pitch or, interpolated, RF signals using the spline interpolation reconstruct the original signals significantly better than those using the linear interpolation. This may explain the decreased jitter associated with the spline compared to that with the linear interpolation (Fig. 6(d)). If the jitter noise is more important than the bias, which may be true in most applications, the spline interpolation would be advisable.
Phantom Results
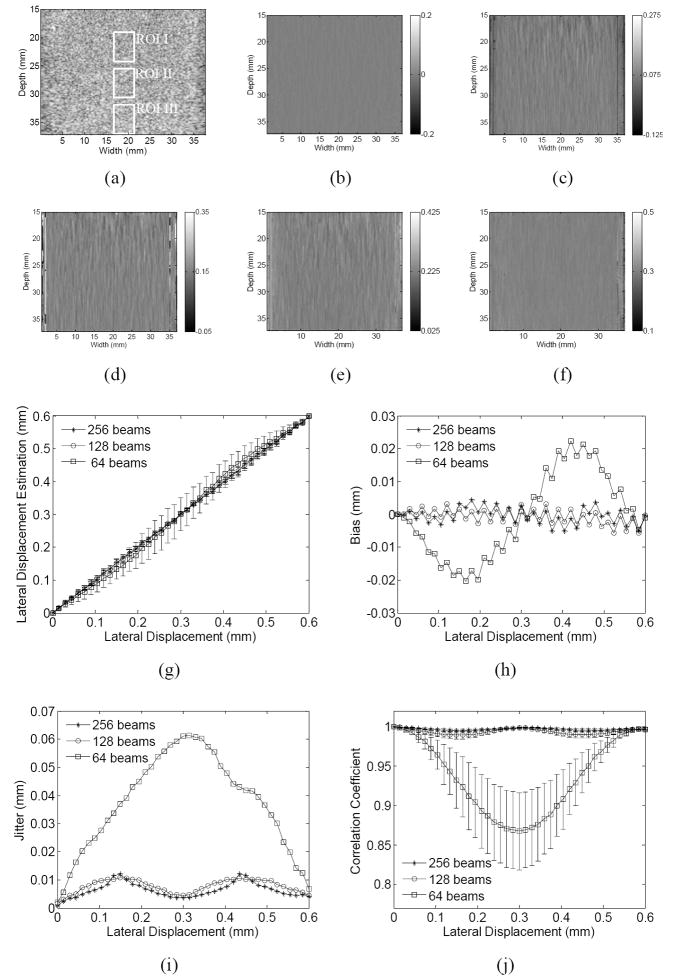
At a total beam number of 128 and a pitch of 0.3 mm, the estimation performance deteriorates for lateral displacements between 0 and 0.5 pitch multiples (Fig. 7(b)-(d)), while it improves between 0.5 and 1 pitch multiples (Fig. 7(d)-(f)), i.e., in agreement with the simulation results (Figs. 2 (a)-(e)).
Figure 7.
The (a) B-mode image of the phantom, the estimated lateral displacement images when the lateral displacement between the reference and comparison frames is (b) 0, (c) 0.25, (d) 0.5, (e) 0.75 and (f) 1 pitch with the use of 128 beams, (g) the estimated lateral displacement (mean ± SD) as a function of the true displacement, (h) the estimated displacement (average ± SD), the (h) bias and (i) jitter of estimation and (j) correlation coefficient (average ± SD) with the use of 256, 128 and 64 beams, respectively. In (g)-(j), results are calculated from region III indicated in (a).
When 256, or 128, beams are used (i.e., pitch = 0.3 mm), a linear relationship between the true and estimated lateral displacements is shown in Fig. 7(g) (r > 0.999). By using 64 beams (i.e., pitch = 0.6 mm), however, the displacement is underestimated, or overestimated, when the displacement is between 0 and 0.3 mm, or between 0.3 and 0.6 mm, respectively, due to the presence of estimation bias.
Using a total beam number of 64, the bias is minimum when the displacement is 0, 0.5 or 1 pitch multiples (i.e., 0, 0.3 or 0.6 mm) (Fig. 7(h)), i.e., when the interpolation or RF signals is not required or adjacent beams contribute to the interpolated, sub-beams equally (appendix A). The bias for the 0.30-mm pitch (i.e., 256 or 128 beams) is very small (< 0.005 mm) and does not clearly exhibit a periodic variation with the lateral displacement. For both 0.30- and 0.60-mm pitches, the jitter is the lowest (or, the highest), and the correlation coefficient is the highest (or, the lowest), when the displacement is equal to integer pitch multiples (or, at odd half-integer pitch multiples) (Fig. 7(i)). As is evident in Figs. 7(h), (i) and (j), a pitch of 0.3 mm could result in significantly lower bias and jitter and higher correlation coefficient, demonstrating the importance of a smaller pitch in the lateral displacement estimation. The maximum jitter is approximately equal to 10 μm when a pitch of 0.3 mm is used. The maximum jitter of the lateral displacement estimation is on the same order of the simulation values found by Walker and Trahey (1994).
Figure 7(j) also shows that the correlation coefficient is slightly higher at increased beam density from 128 to 256 beams. When 256 beams are used, the jitter is also slightly lower, except at lateral displacements around 0.15 or 0.45 mm (Fig. 7(i)). The bias remains similar in both cases (Fig. 7(h)). The variation period is also the same in both cases because the pitch is the same (0.3 mm).The non-significant difference between the use of 256 and 128 beams suggests that the fundamental limit of the lateral displacement estimation may thus be mainly determined by the original pitch in the linear array, and the lateral estimator performance is not expected to be significantly improved with an increased beam density by using beamforming techniques.
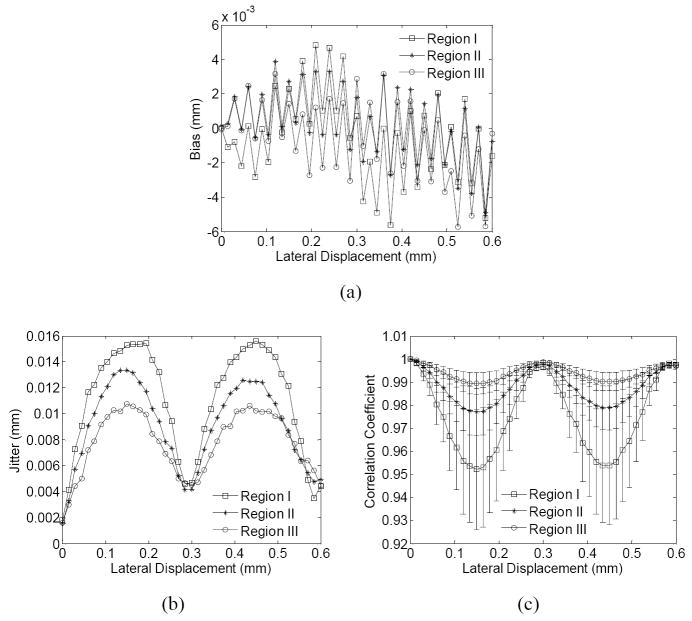
Figure 8 compares the performance of the estimation in ROI’s I, II and III, as indicated in Fig. 7(a). The same periodic variation can be observed in the jitter and correlation coefficient of three ROI’s. In addition, the jitter is the lowest in region III and highest in region I, except for displacements between 0.5 and 0.6 mm, while the correlation coefficient is the highest in region III and the lowest in region I. These results can be explained by the largest beamwidth in region III (1.7 mm) and smallest beamwidth in region I (0.9 mm). Although similar across the three ROI’s, the bias appears slightly lower in region III than in regions I and II (Fig. 8(a)), because of the wider beamwidth, similar to the simulation results (Fig. 4). These experimental results in different regions with different beamwidths are thus in good agreement with the simulation results (Fig. 4).
Figure 8.
The (a) bias and (b) jitter of estimation and (c) correlation coefficient (average ± SD) calculated from regions I, II and III indicated in Fig. 7 (a), respectively.
Both the pitch and beamwidth affect the performance of the lateral displacement estimation. A smaller pitch or a larger beamwidth is preferred, as both contribute to a higher beam overlap (Konofagou and Ophir 1998). However, simulation results also confirm that the pitch effects on the lateral estimation performance are larger than the beamwidth effects. For examples, the jitter difference between the pitch of 1.25 and 0.625 mm is four-fold (Fig. 3(f)), while the jitter difference between the beamwidth of 1 and 2 mm is twice (Fig. 4(f)). The phantom experimental findings are consistent with the simulation results. Greater effects of the pitch are shown in Figs. 7 and 8. The jitter increases by a six-fold when the pitch increases from 0.3 to 0.6 mm (Fig. 7(i)), but less than twice when the beamwidth decreases from 1.7 to 0.9 mm (Fig. 8(b)).
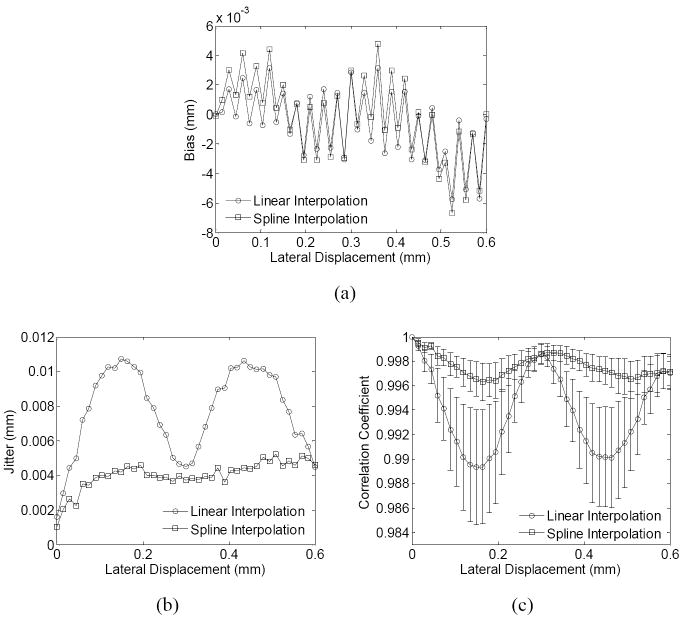
Finally, in Figs. 9(a)-(c), the spline interpolation is found to have lower jitter and higher correlation coefficient and bias, as consistent with the simulations findings (Fig. 6). The maximum jitter is reduced from 10 to 5 μm when the spline instead of linear interpolation is used.
Figure 9.
The (a) bias and (b) jitter of estimation and (c) correlation coefficient (average ± SD) in the phantom experiment, with the use of different lateral interpolation methods on the RF signals. Results are calculated from calculated from region III indicated in Fig. 4 (c). (pitch = 0.3 mm).
DISCUSSION
Most biological soft tissues are nearly incompressible (Parker et al. 1990); the lateral and elevational tissue strains are approximately equal to half of the axial strain. Therefore, lateral motion of tissues is inevitable in ultrasound elastography. In this paper, a lateral rigid motion was therefore assumed in simulation in order to evaluate the performance of a lateral displacement estimator. In the phantom experiments, the phantom did not undergo any deformation while the transducer was moved in the lateral direction. In both simulation and phantom results, the correlation coefficients between the pre- and post-displaced RF signals were much higher than in the presence of strains, because only lateral rigid motion was considered.
The results of the simulation and phantom experiments clearly demonstrate a periodic variation in the performance of the lateral displacement estimation (i.e., bias, jitter and correlation coefficient) at different lateral displacements, with the period equal to the pitch. The reader is referred to appendix A for a brief explanation regarding the periodic variation. From the periodic variation of the estimation performance, some implication can be made (appendix B). The performance analysis of the lateral strain estimation (Konofagou et al. 2000b) is beyond the scope of this work, because only lateral rigid motion is considered. After the spatial gradient operation (Luo et al. 2004), improved performance in the lateral displacement estimation is expected to result in higher quality in the lateral strain images. Some implications on the lateral strain estimation (e.g., periodic variation in the strain estimation performance and the “zebra” artifacts) are included in appendix B.
As shown in Figs. 3 and 4, in order to reduce the bias and jitter of the lateral displacement estimation, a smaller pitch and a larger beamwidth are preferred. At smaller pitch, the transducer provides more beams, which are the reliable data instead of the post-interpolation, reconstructed beams. However, small pitch may complicate the design of the transducer. At larger beamwidths, the adjacent beams share more ultrasound scatterers and the RF signals of these beams are more statistically dependent. Therefore, it may be more accurate to interpolate the RF signals between adjacent beams. As a result, increasing the beamwidth reduces the jitter and bias. However, the trade-off is the reduced lateral resolution (Righetti et al. 2003) and will thus be dictated by the application in question.
As discussed in appendix A, the performance of the lateral displacement estimation relies on the accuracy of the lateral interpolation of RF signals. If a sinc interpolation is used, the sub-pitch noiseless signals can be in theory fully reconstructed, as long as the sampling frequency is higher than the Nyquist frequency. Therefore, the correlation coefficient between the reference RF signals and the comparison, interpolated RF signals is equal to 1, in the presence of lateral displacement only. However, the sinc interpolation theoretically needs an infinite signal duration, otherwise it tends to produce ripple artifacts, i.e., the ringing effect. Although a weighting function is suggested in sinc interpolation with finite-length signal, the optimal shape and length of the weighting function may vary across applications. Given the small number of beams (e.g., 64-256) on clinical ultrasound images, the sinc interpolation may not be considered practical for the RF signal interpolation in the lateral direction. Therefore, linear interpolation is widely used in lateral displacement estimation in elastography because it is simple and straightforward (Konofagou and Ophir 1998, Lee et al. 2007). Results in Figs. 6 and 9 demonstrate that the cubic spline interpolation can obtain lower jitter and higher correlation coefficient, at the cost of slightly increased bias. This can be explained by the fact that the cubic spline interpolation may provide more accurate sub-pitch signals between beams, since the data are interpolated via a piecewise polynomial function that preserves second-derivative continuity (Fig. 6(f)). One possible reason for the increased bias of the spline interpolation is that the spline interpolation preserves second-derivative continuity and thus is more sensitive to the variation of the pre-interpolated signals. However, this remains to be further investigated. The cubic spline interpolation may be preferred over the linear interpolation in elastography because the bias is typically much lower than jitter.
In myocardial elastography, where a phased-array transducer is typically used, the beam spacing increases with depth and is not equal to the pitch (Luo et al. 2008). According to the findings in this study, a shallow depth is expected to obtain lower bias and jitter than a deeper region in a phased array configuration because, the beam spacing is smaller. However, the fundamental limit of the lateral displacement estimation at a specific depth may still be determined by the pitch, even though some beamforming schemes are used to increase the beam number, similar to the results shown in Figs. 7(g)-(j). In addition, both the beamwidth and displacement may vary spatially. The combined effects of all these factors on lateral displacement estimation in myocardial elastography using a phased array will be explored in future studies.
The results of the lateral displacement estimation in this study can also be extended into the elevational displacement estimation since the same estimation methods in 3-D were used (Konofagou and Ophir 2000). Similarly, smaller pitch and larger beamwidth in the elevational directions are expected to improve the performance of the elevational displacement estimation in terms of bias, jitter and correlation coefficient.
CONCLUSION
Simulation and phantom experiments were performed to investigate the effects of various parameters on lateral displacement estimation in ultrasound elastography. A lateral rigid motion configuration was applied in order to eliminate the effects of axial displacement / strain and lateral strain on lateral displacement estimation. The estimator performance as indicated by the bias, jitter and correlation coefficient shows a periodic variation with lateral displacement, with a period equal to the pitch. Due to the periodic variation, a larger lateral displacement might be preferred to improve the signal-to-noise ratio of the estimation. The performance was found to improve with a decreased pitch and/or an increased beamwidth. A smaller pitch was preferred at the same beam overlap, because the effects of pitch on lateral displacement estimation appeared to be larger than those of the beamwidth. The cubic spline interpolation of the RF signals in the lateral direction decreased the jitter but increased the bias. In summary, smaller pitch, wider beamwidth and spline interpolation are required in order to reduce the jitter error of the lateral displacement estimation.
Acknowledgments
This study was supported in part by the American Heart Association (SDG0435444T), National Institutes of Health (R01EB006042) and the Wallace H. Coulter foundation. The authors appreciate Caroline Maleke, M.S., and Yao-Sheng Tung, M.S., Department of Biomedical Engineering, Columbia University, for preparing the phantom used in this study. The authors also thank Wei-Ning Lee, M.S., and Jean Provost, M.S., Department of Biomedical Engineering, Columbia University, for their helpful discussions.
APPENDIX A
EXPLANATION OF THE PERIODIC VARIATION OF THE PERFORMANCE
The lateral displacement estimation relies on RF signal interpolation in the lateral direction, which provides sub-pitch information. Assume the pre-deformation RF signal in the reference frame is A0 while the corresponding RF signal at the same beam location in the comparison frame is B0. The lateral displacement is assumed to be between 0 and 1 pitch; therefore, the most matched sub-pitch RF beam Bi is between beam B0 and the adjacent beam B1.
When the displacement is equal to 0, the RF lateral interpolation may not be required while the correlation coefficient between A0 and B0 reaches the maximum value of 1. The interpolated peak is expected to be very close to the pre-interpolated peak. Therefore, the bias and jitter would be the lowest.
When the lateral displacement increases but is smaller than one half of the pitch, the contribution of beam B0 to the interpolated beam Bi decreases. However, when the lateral displacement is larger than half a pitch, the interpolated beam Bi is more contributed by beam B1. Since the bias can be either positive or negative while the jitter is always positive, the bias and jitter as a function of the lateral displacement is antisymmetric or symmetric, respectively, at half a pitch. When the displacement is equal to half a pitch, the estimation becomes unbiased probably because beams B0 and B1 contribute equally or similarly to the interpolated beam Bi. However, the jitter reaches a maximum value.
When the displacement ranges from 1 to 2 pitch multiples or, from 2 to 3 pitch multiples, etc, the same variation repeats. Therefore, the performance of the lateral displacement estimation shows a periodic variation, with the period equal to the pitch. The findings are very similar to previous results on the bias and/or jitter of time delay estimation (Céspedes et al. 1995, Hoyt et al. 2006). In those studies, the period of the bias and/or bias is equal to the sampling interval of the echo signals. The bias is caused through the curve fitting applied to the cross-correlation function (Céspedes et al. 1995). The period of the bias and jitter in lateral displacement estimation in this paper is equal to the pitch (i.e., the sampling interval in the lateral direction). The bias is due to the lateral interpolation of the RF signals as well as the curve fitting applied to the cross-correlation function. The effects of the former source of bias are usually larger than the latter when the interpolation factor is adequate.
If the beam overlap and the lateral displacement in sub-pitches (i.e., lateral displacement normalized by the pitch) are both fixed, the reference beam A0 and comparison beam B0 share the same percentage of scatterers regardless of the pitch, because both the beamwidth and the lateral displacement in millimeters vary simultaneously. The correlation between A0 and B0 is therefore fixed. Similarly, the correlation between beam A0 and B1 does not vary with the pitch. After the interpolation applied to the RF signals in order to obtain the sub-beam signals between B0 and B1, it is intuitive to assume that the correlation function follows the same shape in the lateral direction; and the width of the correlation function in sub-pitch samples does not depend on the pitch. Therefore, the correlation coefficient as well as the bias and jitter of the lateral displacement estimation, both measured in sub-pitches, is relatively independent of the pitch, as shown in Figs. 5(f)-(h). However, similar bias and jitter measured in sub-pitches in Figs. 5(f) and (g) are converted to larger values at larger pitches, when measured in millimeters (Figs. 5(d) and (e).
APPENDIX B
IMPLICATIONS OF THE PERIODIC VARIATION OF THE PERFORMANCE
Assume the lateral displacement u of a homogeneous phantom undergoing a uniform lateral strain εx is given by
| (A7) |
where x is the beam position relative to the axis with zero lateral displacement.
If the lateral strain εx is fixed, the lateral displacement u is proportional to the beam position x. According to the periodic variation of the lateral displacement estimation performance with the lateral displacement as shown in Fig. 2, the performance of the lateral displacement estimation also periodically varies with the beam position. The period is equal to pitch /εx. At a fixed beam position x, the bias and jitter of the lateral displacement estimation as a function of the lateral strain is also expected to vary periodically, with a period equal to pitch / x.
When the lateral strains vary spatially, the lateral displacement is expected to have a similar variation with the beam position. However, the period depends on the local lateral strain distribution. It has been shown that the periodic variation of the bias in the axial displacement estimation may induce periodic bright and dark artifact in the axial strain images, i.e., “zebra” (Céspedes et al. 1995, Ophir et al. 1996). Similarly, the periodic bias of lateral displacement estimation may also result in the “zebra” artifact in the lateral strain images.
The performance of the lateral displacement estimation is mainly determined by the jitter since the bias is at least one order of magnitude lower. Because of the periodic variation as shown in Fig. 2, the jitter remains the same when the lateral motion increases by integer pitch multiples. In this case, the SNR of the lateral displacement estimation increases with the lateral displacement. Figure 2(j) suggests that a larger lateral displacement is preferred in order to obtain a higher SNR.
In the presence of lateral strain, similar results could be expected. A larger lateral strain might obtain a higher SNR. However, in elastography, a larger strain usually means a larger axial strain, which can deteriorate the correlation between the pre- and post-deformed signals. Therefore, there exists a trade-off, which has been shown in the Strain Filter framework for the lateral strain estimation (Konofagou et al. 2000b), although the periodic variation has not been shown.
Footnotes
In the simulation described in this paper, we assume that, for an unsteered linear array, the spacing between the centers of adjacent beams is equal to the spacing between adjacent array elements (i.e., pitch).
Publisher's Disclaimer: This is a PDF file of an unedited manuscript that has been accepted for publication. As a service to our customers we are providing this early version of the manuscript. The manuscript will undergo copyediting, typesetting, and review of the resulting proof before it is published in its final citable form. Please note that during the production process errors may be discovered which could affect the content, and all legal disclaimers that apply to the journal pertain.
References
- Alam SK, Ophir J, Konofagou EE. An adaptive strain estimator for elastography. IEEE Trans Ultrason Ferroelectr Freq Control. 1998;45:461–472. doi: 10.1109/58.660156. [DOI] [PubMed] [Google Scholar]
- Bilgen M, Insana MF. Error analysis in acoustic elastography .1. Displacement estimation. J Acoust Soc Am. 1997a;101:1139–1146. doi: 10.1121/1.418018. [DOI] [PubMed] [Google Scholar]
- Bilgen M, Insana MF. Error analysis in acoustic elastography .2. Strain estimation and SNR analysis. J Acoust Soc Am. 1997b;101:1147–1154. doi: 10.1121/1.418019. [DOI] [PubMed] [Google Scholar]
- Céspedes I, Huang Y, Ophir J, Spratt S. Methods for Estimation of Subsample Time Delays of Digitized Echo Signals. Ultrason Imaging. 1995;17:142–171. doi: 10.1177/016173469501700204. [DOI] [PubMed] [Google Scholar]
- Hiltawsky KM, Kruger M, Starke C, Heuser L, Ermert H, Jensen A. Freehand ultrasound elastography of breast lesions: Clinical results. Ultrasound Med Biol. 2001;27:1461–1469. doi: 10.1016/s0301-5629(01)00434-3. [DOI] [PubMed] [Google Scholar]
- Hoyt K, Forsberg F, Ophir J. Comparison of shift estimation strategies in spectral elastography. Ultrasonics. 2006;44:99–108. doi: 10.1016/j.ultras.2005.08.006. [DOI] [PubMed] [Google Scholar]
- Itoh A, Ueno E, Tohno E, Kamma H, Takahashi H, Shiina T, Yamakawa M, Matsumura T. Breast disease: Clinical application of US elastography for diagnosis. Radiology. 2006;239:341–350. doi: 10.1148/radiol.2391041676. [DOI] [PubMed] [Google Scholar]
- Kallel F, Bertrand M. Tissue elasticity reconstruction using linear perturbation method. IEEE Trans Med Imaging. 1996;15:299–313. doi: 10.1109/42.500139. [DOI] [PubMed] [Google Scholar]
- Kallel F, Ophir J. Three-dimensional tissue motion and its effect on image noise in elastography. IEEE Trans Ultrason Ferroelectr Freq Control. 1997;44:1286–1296. [Google Scholar]
- Konofagou E, Ophir J. A new elastographic method for estimation and imaging of lateral displacements, lateral strains, corrected axial strains and Poisson’s ratios in tissues. Ultrasound Med Biol. 1998;24:1183–1199. doi: 10.1016/s0301-5629(98)00109-4. [DOI] [PubMed] [Google Scholar]
- Konofagou EE, D’hooge J, Ophir J. Myocardial elastography - A feasibility study in vivo. Ultrasound Med Biol. 2002;28:475–482. doi: 10.1016/s0301-5629(02)00488-x. [DOI] [PubMed] [Google Scholar]
- Konofagou EE, Harrigan T, Ophir J. Shear strain estimation and lesion mobility assessment in elastography. Ultrasonics. 2000a;38:400–404. doi: 10.1016/s0041-624x(99)00125-0. [DOI] [PubMed] [Google Scholar]
- Konofagou EE, Harrigan TP, Ophir J, Krouskop TA. Poroelastography: Imaging the poroelastic properties of tissues. Ultrasound Med Biol. 2001;27:1387–1397. doi: 10.1016/s0301-5629(01)00433-1. [DOI] [PubMed] [Google Scholar]
- Konofagou EE, Ophir J. Precision estimation and imaging of normal and shear components of the 3D strain tensor in elastography. Phys Med Biol. 2000;45:1553–1563. doi: 10.1088/0031-9155/45/6/311. [DOI] [PubMed] [Google Scholar]
- Konofagou EE, Varghese T, Ophir J. Theoretical bounds on the estimation of transverse displacement, transverse strain and Poisson’s ratio in elastography. Ultrason Imaging. 2000b;22:153–177. doi: 10.1177/016173460002200302. [DOI] [PubMed] [Google Scholar]
- Langeland S, D’hooge J, Wouters PF, Leather HA, Claus P, Bijnens B, Sutherland GR. Experimental validation of a new ultrasound method for the simultaneous assessment of radial and longitudinal myocardial deformation independent of insonation angle. Circulation. 2005;112:2157–2162. doi: 10.1161/CIRCULATIONAHA.105.554006. [DOI] [PubMed] [Google Scholar]
- Lee W-N, Ingrassia CM, Fung-Kee-Fung SD, Costa KD, Holmes JW, Konofagou EE. Theoretical Quality Assessment of Myocardial Elastography With In Vivo Validation. IEEE Trans Ultrason Ferroelectr Freq Control. 2007;54:2233–2245. doi: 10.1109/tuffc.2007.528. [DOI] [PubMed] [Google Scholar]
- Luo J, Bai J, He P, Ying K. Axial strain calculation using a low-pass digital differentiator in ultrasound elastography. IEEE Trans Ultrason Ferroelectr Freq Control. 2004;51:1119–1127. doi: 10.1109/tuffc.2004.1334844. [DOI] [PubMed] [Google Scholar]
- Luo J, Fujikura K, Homma S, Konofagou EE. Myocardial elastography at both high temporal and spatial resolution for the detection of infarcts. Ultrasound Med Biol. 2007;33:1206–1223. doi: 10.1016/j.ultrasmedbio.2007.01.019. [DOI] [PubMed] [Google Scholar]
- Luo J, Lee W-N, Konofagou EE. Fundamental Performance Assessment of 2-D Myocardial Elastography in a Phased Array Configuration. IEEE Ultrasonics Symp Proc. 2008:954–957. doi: 10.1109/TUFFC.2009.1313. [DOI] [PubMed] [Google Scholar]
- Maurice RL, Bertrand M. Speckle-motion artifact under tissue shearing. IEEE Trans Ultrason Ferroelectr Freq Control. 1999;46:584–594. doi: 10.1109/58.764845. [DOI] [PubMed] [Google Scholar]
- Ophir J, Céspedes I, Garra B, Ponnekanti H, Huang Y, Maklad N. Elastography: ultrasonic imaging of tissue strain and elastic modulus in vivo. 1996;3:49–70. [Google Scholar]
- Ophir J, Céspedes I, Ponnekanti H, Yazdi Y, Li X. Elastography: A Quantitative Method for Imaging the Elasticity of Biological Tissues. Ultrason Imaging. 1991;13:111–134. doi: 10.1177/016173469101300201. [DOI] [PubMed] [Google Scholar]
- Parker KJ, Huang SR, Musulin RA, Lerner RM. TISSUE-RESPONSE TO MECHANICAL VIBRATIONS FOR SONOELASTICITY IMAGING. Ultrasound Med Biol. 1990;16:241–246. doi: 10.1016/0301-5629(90)90003-u. [DOI] [PubMed] [Google Scholar]
- Pinton GF, Trahey GE. Continuous delay estimation with polynomial splines. IEEE Trans Ultrason Ferroelectr Freq Control. 2006;53:2026–2035. doi: 10.1109/tuffc.2006.143. [DOI] [PubMed] [Google Scholar]
- Righetti R, Ophir J, Krouskop TA. A method for generating permeability elastograms and Poisson’s ratio time-constant elastograms. Ultrasound Med Biol. 2005;31:803–816. doi: 10.1016/j.ultrasmedbio.2005.02.004. [DOI] [PubMed] [Google Scholar]
- Righetti R, Ophir J, Srinivasan S, Krouskop TA. The feasibility of using elastography for imaging the Poisson’s ratio in porous media. Ultrasound Med Biol. 2004;30:215–228. doi: 10.1016/j.ultrasmedbio.2003.10.022. [DOI] [PubMed] [Google Scholar]
- Righetti R, Srinivasan S, Ophir J. Lateral resolution in elastography. Ultrasound Med Biol. 2003;29:695–704. doi: 10.1016/s0301-5629(03)00028-0. [DOI] [PubMed] [Google Scholar]
- Shapo BM, Crowe JR, Skovoroda AR, Eberle MJ, Cohn NA, Odonnell M. Displacement and strain imaging of coronary arteries with intraluminal ultrasound. IEEE Trans Ultrason Ferroelectr Freq Control. 1996;43:234–246. [Google Scholar]
- Skovoroda AR, Emelianov SY, Odonnell M. TISSUE ELASTICITY RECONSTRUCTION BASED ON ULTRASONIC DISPLACEMENT AND STRAIN IMAGES. IEEE Trans Ultrason Ferroelectr Freq Control. 1995;42:747–765. [Google Scholar]
- Varghese T, Ophir J. Enhancement of echo-signal correlation in elastography using temporal stretching. IEEE Trans Ultrason Ferroelectr Freq Control. 1997a;44:173–180. doi: 10.1109/58.585213. [DOI] [PubMed] [Google Scholar]
- Varghese T, Ophir J. A theoretical framework for performance characterization of elastography: The strain filter. IEEE Trans Ultrason Ferroelectr Freq Control. 1997b;44:164–172. doi: 10.1109/58.585212. [DOI] [PubMed] [Google Scholar]
- Viola F, Walker WF. Shear Strain Elastography. IEEE Ultrasonics Symp Proc. 2002:1907–1911. [Google Scholar]
- Viola F, Walker WF. A comparison of the performance of time-delay estimators in medical ultrasound. IEEE Trans Ultrason Ferroelectr Freq Control. 2003;50:392–401. doi: 10.1109/tuffc.2003.1197962. [DOI] [PubMed] [Google Scholar]
- Wagner RF, Smith SW, Sandrik JM, Lopez H. Statistics of Speckle in Ultrasound B-Scans. 1983;30:156–163. [Google Scholar]
- Walker WF, Trahey GE. A Fundamental Limit on the Performance of Correlation-Based Phase Correction and Flow Estimation Techniques. IEEE Trans Ultrason Ferroelectr Freq Control. 1994;41:644–654. [Google Scholar]
- Walker WF, Trahey GE. A Fundamental Limit on Delay Estimation Using Partially Correlated Speckle Signals. IEEE Trans Ultrason Ferroelectr Freq Control. 1995;42:301–308. [Google Scholar]
- Zervantonakis IK, Fung-Kee-Fung SD, Lee W-N, Konofagou EE. A novel, view-independent method for strain mapping in myocardial elastography: eliminating angle and centroid dependence. Phys Med Biol. 2007;52:4063–4080. doi: 10.1088/0031-9155/52/14/004. [DOI] [PubMed] [Google Scholar]


