

Abstract
Recently a convincing body of evidence has accumulated, suggesting that the over-expression of carbonic anhydrase isozyme IX (CA IX) in some cancers contributes to the acidification of the extracellular matrix, which in turn promotes the growth and metastasis of the tumor. These observations have made CA IX an attractive drug target for the selective treatment of certain cancers. Currently there is no available x-ray crystal structure of CA IX and this has hampered the rational design of selective CA IX inhibitors. In light of these observations and based on structural alignment homology, using the crystal structure CA II and the sequence of CA IX, a double mutant of CA II with Ala 65 replaced by Ser and Asn 67 replace by Gln has been constructed to resemble the active site of CA IX. This CA IX mimic has been characterized kinetically using 18O-exchange and structurally using x-ray crystallography, alone and in complex with five CA sulfonamide based inhibitors; acetazolamide, benzolamide, chlorzolamide, ethoxzolamide, and methazolamide, and compared to CA II. This structural information has been evaluated in relationship to inhibition studies and in vitro cytotoxicity assays and shows a correlated structure-activity relationship. Kinetic and structural studies of CA II and CA IX mimic reveal chlorzolamide to be a more potent inhibitor of CA IX inducing an active site conformational change upon binding. Additionally, chlorzolamide appears to be cytotoxic to prostate cancer cells. This preliminary study demonstrates that the CA IX mimic may provide a useful model to design more isozyme specific CA IX inhibitors which may lead to development of new therapeutic treatments of some cancers.
Carbonic anhydrases (CAs)1 are zinc-metalloenzymes that catalyze the reversible inter-conversion of CO2 and HCO3- (1). Since their discovery, the CAs have been extensively studied due to their important physiological functions in all kingdoms of life. This family of enzymes is broadly comprised of three well-studied, structurally distinct (α, β, and γ) classes. The α–class is present in vertebrates, but have also been shown to present in other organisms. They (and α-CA domains in more complex isoforms) have a molecular weight of ~29kDa. There are 14 expressed α-CAs (CA I - XIV) in humans, and the active CAs play roles in respiration, pH homeostasis, fluid production, and other functions as yet to be determined (2-5). The α-CAs all share the same overall mixed α/β fold with approximate dimensions of 50 × 40 × 40 Å3. The active site is characterized by a conical cavity that is approximately 15 Å deep. The zinc ion is located at the bottom of the conical active site cavity and is tetrahedrally coordinated by three histidine ligands and a bound hydroxide/water (1). The active sites between isoforms are nearly identical other than a few amino acids that line the cavity (6).
CA IX is a unique member of the human α-class CAs, as it is a membrane associated glycoprotein, composed of several domains including a short intracellular region, a single transmembrane helix, and an extracellular proteoglycan domain that encodes a catalytic CA domain (7). Under normal conditions CA IX is commonly expressed in cells that are thought to need to maintain extracellular pH, such as gastric mucosal cells. However, in many cancers it is over-expressed as a result of hypoxia(3). The regulation of the CA IX gene has been shown to be controlled by the hypoxia inducing factor-1 (7). It has been hypothesized that as tumor growth progresses and becomes insufficient to maintain a supply of oxygen, the cancer cell remodels metabolically, which is partially achieved by the up-regulation of CA IX. Therefore CA IX is considered to be a marker of tumor hypoxia (8).
In hypoxic tumors, it is believed that CA IX plays a critical role in cell survival. In tumors there in an observed increase in CO2 concentration (9, 10). It is believed that this is not a result of oxidative metabolism, but rather a by-product of an increase in the pentose phosphate pathway. This serves to replenish the supply of NADPH and generate ribose-5-phosphate, necessary for nucleotide and coenzyme production (11). The surplus of CO2 is converted to HCO3- and a proton by CA IX, creating the significant increase in extracellular proton concentration causing the acidification of the tumor microenvironment. The alteration in proton flux is also believed to affect the activity of ion transporters and channels (5). Additionally, the acidity may cause the exclusion of weakly basic chemotherapeutic agents rendering traditional therapies less effective (7). The proteoglycan domain of CA IX has been implicated in the disruption of cell-cell adhesion by breaking the connection of E-cadherin to the cytoskeleton, which may lead to tumor invasion (12). Several studies have shown that inhibition of CA IX can lead to decreased invasiveness as well as inducing cell death under hypoxic conditions (3, 8, 13-16). These factors, taken together, provide strong evidence to suggest that CA IX might be an attractive drug target for the treatment of cancers.
One significant barrier that needs to be overcome, for the development of CA IX inhibitors as effective cancer treatments, is to produce a CA IX isoform specific inhibitor, which has a significantly higher affinity for CA IX than other active CA isoforms. The development of a high affinity CA IX inhibitor has been hampered due to the lack of an available crystal structure of CA IX. CA IX being a membrane protein and has so far proven itself difficult to express in sufficient soluble and properly folded quantities for crystallization (17, 18). To overcome these issues, this research reports the expression and structural and kinetics studies of a CA IX active site mimic. The design of the CA IX mimic based on a structural alignments comparison with CA II, and is a double mutant of CA II (A65S N67Q CA II) that imitates the active site of CA IX. This CA IX mimic was expressed and characterized both kinetically and crystallographically, alone and in complex with several common sulfonamide inhibitors, acetazolamide, benzolamide, chlorzolamide, ethoxzolamide, and methazolamide. Preliminary data reveals that the inhibition profiles of the CA IX mimic mirror wild type CA IX compared to values previously published (17). In addition, the crystal structures of the CA IX mimic bound to these drugs reflect the kinetics, showing chlorzolamide, the drug with greatest affinity to CA IX and the CA IX mimic undergoes active site conformational changes rather than a simple lock and key model of inhibition. Further this structural information has been evaluated in relationship to inhibition studies and in vitro cytotoxicity assays and shows a correlated structure-activity relationship. To our knowledge this is the first time a protein mimic has been engineered from a related isozyme for the purpose of drug design. The CA IX mimic presented provides a unique opportunity in developing and assessing CA IX isoform specific inhibitors, while on-going studies attempt to obtain the crystal structure of the catalytic domain of CA IX.
MATERIALS AND METHODS
In silico design of the CAIX mimic
All 14 human CA sequences were obtained from the NCBI database and a multiple sequence alignment was performed using ClustalW (19). A CA IX model was built with Swiss-Model, using the high resolution CA II crystal structure (PDB accession code: 2ILI) as a template (20, 21). The molecular graphics programs Coot was used to visualize and analyze the CA IX model (22).
Enzyme expression and purification
The CA IX mimic was made by site-directed mutagenesis using an expression vector containing the CA II coding region (23, 24). Residue Ala 65 and Asn 67 were mutated to Ser and Gln, respectively. Site-directed mutagenesis was accomplished using the Quick Change Mutatgenesis kit from Stratagene using CA II as a template, and the primers (mutations in bold): 5’-CCTCAACAATGGTCATTCGTTCCAGGTGGAGTTTGATGAC-3’ and 5’-GTCATCAAACTCCACCTGGAACGAATGACCATTGTTGAGG. The DNA sequence was confirmed for the entire coding region for the CA in the expression vector. Expression of the CA IX mimic vector was done by transforming into Escherichia coli BL21(DE3)pLysS, which does not express any endogenous α-CA (25, 26). The purification of CA IX mimic and CA II was performed on an affinity column of p-amino-methyl-benzenesulfonamide as described previously (27). The protein was collected then buffer exchanged into 50 mM Tris-Cl, pH 7.8, concentrated and then analyzed for expression and purity using Coomassie stained SDS-PAGE. The final protein concentration was ~15 mg mL-1 as calculated by measuring the optical density at 280 nm using a molar absorptivity of 5.5 × 10⁴ M-1 cm-1.
Crystallization
Crystals of CA II and CA IX mimic were grown at room temperature using the hanging-drop vapor diffusion method (28). Crystallization drops were prepared by mixing 7 μl protein (~15 mg ml-1 in 50 mM Tris-HCl pH 7.8) with 3 μl precipitant solution (100 mM Tris-HCl pH 9.0, 1.3 M sodium citrate) and 1μL of Hampton HR2-410-02 detergent (Hampton Research, Aliso Viejo, CA). The hanging-drops were equilibrated against 1 ml precipitant solution. Crystals appeared within 5 days.
Drug soaks
The CA inhibitors (acetazolamide (AZM), benzolamide (BZM), chlorzolamide (CHL), ethoxzolamide (EZM), and methazolamide (MZM) – Table 1) were solubilized in water, with AZM, CHL, and MZM requiring the addition of 50%, 10%, and 5% of DMSO, respectively. CA IX mimic and CA II crystals were incubated with the inhibitors solutions at 4mM final concentration for ~24 h prior to x-ray diffraction data collection. As density for DMSO is not present in any of the structures presented and the density of the drugs are continuous, it is assumed that the high concentration of DMSO in the drug soaks is not effecting either binding or the chemical composition of these molecules.
Table 1.
Carbonic anhydrase inhibitors.
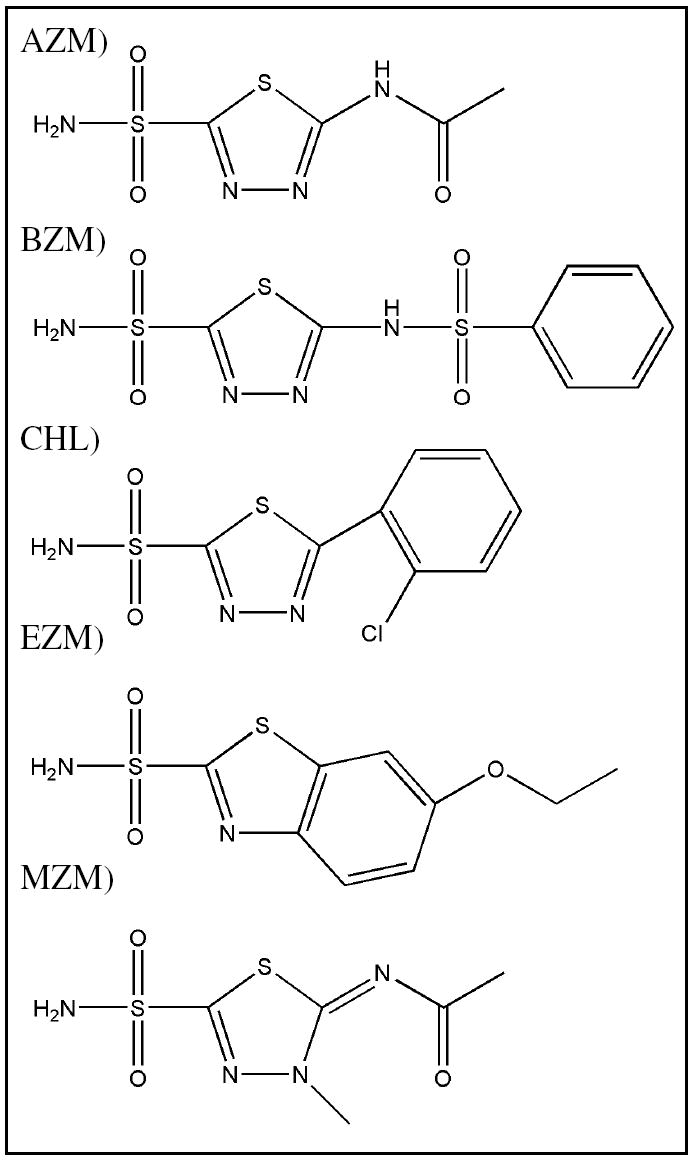 |
AZM - Acetazolamide (N-(5-(aminosulfonyl)-1,3,4-thiadiazol-2-yl)-acetamide), BZM - Benzolamide (1,3,4-Thiadiazole-2-sulfonamide, 5-((phenylsulfonyl)amino), CHL - Chlorzolamide (5-[o-chlorophenyl]-1,3,4-thiadiazole-2-sulfonamide), EZM - Ethoxzolamide (6-ethoxybenzothiazole-2-sulfonamide), MZM - Methazolamide (N-(3-methyl-5-sulfamoyl-3H- 1,3,4-thiadiazol-2-ylidene)
Diffraction data collection
All the diffraction data for both the CA IX mimic and CA II crystals were collected “in house” on the RAXIS IV++ detector using CuKα wavelength (1.5418 Å). The crystal-to-detector distance was set at a range of 80-100 mm (dependent on the quality of diffraction) and images were collected in 1° oscillation steps with a 300 s exposure time. The data was merged using DENZO and scaled with SCALEPACK using HKL 2000 (29). Data statistics are listed in Table 2 and 3.
Table 2.
Crystallographic statistics for CA IX mimic alone and in complex.
| CA IX Mimic | ||||||
|---|---|---|---|---|---|---|
| Data Set Statistics | No Drug | MZM | CHL | AZM | EZM | BZM |
| Space Group | P21 | P21 | P21 | P21 | P21 | P21 |
| Unit-cell parameters (Å,°) |
a=42.8 b= 41.8 c=72.8 β=104.5 |
a=42.9 b=41.8 c=73.0 β=104.6 |
a=42.9 b=41.9 c=73.0 β=104.6 |
a=42.9 b=41.8 c=72.9 β=104.5 |
a=42.8 b=41.7 c=72.8 β=104.5 |
a=42.8 b=42.0 c=72.7 β=104.4 |
| Resolution (Å) | 20-1.60 (1.66-1.60) | 20-1.80 (1.86-1.80) | 20-1.60 (1.66-1.60) | 20-1.70 (1.76-1.70) | 20-1.50 (1.55-1.50) | 20-1.70 (1.76-1.70) |
| Total number of reflections | 92791 | 62807 | 56620 | 82430 | 140381 | 99710 |
| Unique reflections | 31389 (3000) | 22064 (2141) | 26650 (2547) | 26697 (2573) | 37113 (3476) | 25878 (2472) |
| Redundancy | 3.0 | 2.8 | 2.1 | 3.1 | 3.8 | 3.9 |
| Completeness (%) | 94.9 (91.4) | 93.8 (91.1) | 79.8 (76.5) | 96.0 (93.4) | 92.3 (87.2) | 93.1 (89.2) |
| Rsym | 0.074 (0.279) | 0.101 (0.328) | 0.064 (0.297) | 0.068 (0.311) | 0.081 (0.430) | 0.089 (0.488) |
| Refinement Statistics | ||||||
| * Rfactor/+ Rfree | 0.151/0.200 | 0.145/0.214 | 0.146/0.206 | 0.141/0.193 | 0.155/0.190 | 0.143/0.197 |
| Rmsd for bond lengths/angles(°) | 0.008/0.026 | 0.006/0.022 | 0.008/0.024 | 0.007/0.024 | 0.009/0.026 | 0.007/0.023 |
| Average B-Factors (Å2) | ||||||
| No. protein atoms | 2082 | 2081 | 2110 | 2110 | 2122 | 2128 |
| Main/side/solvent | 15.6/23.6/29.1 | 16.1/23.8/27.1 | 15.7/23.0/28.7 | 17.3/24.6/37.5 | 18.6/25.5/29.8 | 19.8/27.1/29.3 |
| No. water molecules | 188 | 165 | 180 | 174 | 170 | 163 |
| Drug | N/A | 16.0 | 16.4 | 17.8 | 22.5 | 32.1 |
| Ramachandran Statistics (%) | ||||||
| Most favored | 88.4 | 88.0 | 87.0 | 90.7 | 88.9 | 86.6 |
| Additional & Generously allowed/disallowed | 11.6 0/0 |
12.0 0/0 |
13.0 0/0 |
9.3 0/0 |
10.6 0.5/0 |
13.0 0.5/0 |
| PDB-ID | 3DC9 | 3DCS | 3DCC | 3DC3 | 3DCW | 3DBU |
Rfactor = Σ∥Fobs∣ - ∣Fcalc∥/Σ∣Fobs∣.
Rfree was monitored using 5% of the reflection data excluded from refinement
Table 3.
Crystallographic statistics for CA II complexed structures.
| CA II | ||||
|---|---|---|---|---|
| Data Set Statistics | MZM | CHL | EZM | BZM |
| Space Group | P21 | P21 | P21 | P21 |
| Unit-cell parameters (Å,°) |
a=42.8 b=41.7 c=72.9 β=104.6 |
a=42.9 b=41.8 c=72.9 β=104.6 |
a=42.8 b=41.7 c=72.9 β=104.6 |
a=42.8 b=42.1 c=72.7 β=104.6 |
| Resolution (Å) | 20-1.60 (1.66-1.60) | 20-1.65 (1.71-1.65) | 50-1.48 (1.53-1.48) | 20-1.70 (1.76-1.70) |
| Total number of reflections | 88307 | 65568 | 112975 | 73979 |
| Unique reflections | 32589 (3179) | 28166 (2674) | 39340 (3727) | 26998 (2596) |
| Redundancy | 2.7 | 2.3 | 2.9 | 2.7 |
| Completeness (%) | 98.3 (96.3) | 93.0 (89.2) | 94.2 (89.3) | 96.7 (94.1) |
| Rsym | 0.067 (0.358) | 0.055 (0.393) | 0.057 (0.214) | 0.067 (0.323) |
| Refinement Statistics | ||||
| *Rfactor/+Rfree | 0.148/0.197 | 0.145/0.190 | 0.149/0.180 | 0.146/0.195 |
| Rmsd for bond lengths (Å)/angles(°) | 0.006/0.025 | 0.007/0.024 | 0.011/0.027 | 0.007/0.023 |
| Average B-Factors (Å2) | ||||
| No. protein atoms | 2104 | 2064 | 2073 | 2068 |
| Main/side/solvent | 17.3/24.8/29.9 | 15.5/23.7/28.2 | 16.2/23.3/32.3 | 18.9/26.0/29.8 |
| No. water molecules | 182 | 184 | 206 | 175 |
| Drug | 18.2 | 16.0 | 13.6 | 27.5 |
| Ramachandran Statistics (%) | ||||
| Most favored | 88.4 | 88.0 | 87.6 | 88.0 |
| Additional & Generously allowed/disallowed | 11.6 0/0 |
12.0 0/0 |
12.0 0.5/0 |
11.6 0.5/0 |
| PDB-ID | 3DAZ | 3D9Z | 3DD0 | 3D8W |
Structure determination
All the crystal structures were determined by molecular replacement methods using the previously solved wild-type CA II structure with solvents removed (PDB code 2ILI)(20). Initially, the structures were refined using the standard refinement protocol of CNS program version 1.1 which included rigid-body, B-factor and energy minimization (30). Difference Fourier maps provided clear phase-unbiased electron density for the respective bound inhibitors. The PRODRG server was used to generate topology files for modeling the inhibitor structures during the subsequent refinement process (31). Once the inhibitors were modeled using the program COOT refinement continued using the program SHELXL97 (22, 32). The conjugate-gradient least-squares model (CGLS) with SHELXL default restraints were used for the protein geometric parameters followed by manual model building with the computer-graphics program COOT and the addition of solvent molecules (22, 32). Refinement of the structures continued until the Rcryst and Rfree converged. The inhibitor-enzyme interactions were determined by observing environmental distances in COOT and the model geometries were analyzed using PROCHECK (22, 33). The coordinates and structure factors for all nine structures have been submitted to the Protein Data Bank. PDB files, data-refinement, and final model statistics are given in Tables 2 and 3.
Oxygen-18 isotope exchange kinetic and inhibition studies
Inhibition constants (Ki values) of all compounds were determined by measurement of the inhibition of the 18O-exchange activity between CO2 and water via mass spectrometry, as reviewed elsewhere (34, 35). Experiments were carried out at 25 °C in solutions buffered at pH 7.4 with 0.1 M Hepes. The concentration of all species of carbonate was 10 mM, 93% HCO3-, 7% CO2, and 0.1% CO32-. The enzyme concentration was 7.3 nM. Inhibitor concentrations ranged up to 800 μM and were analyzed by the method of Henderson for tight binding inhibitors (36).
Cell lines and culture
Human prostate cancer cell line PC-3-Bcl-2 (characterized by marked Bcl-2 overexpression, PTEN deletion, and p53 mutation) was a generous gift from Dr. Timothy McDonnell (The University of Texas M. D. Anderson Cancer Center, Houston, TX). These cells were maintained in Dulbecco’s modified Eagle’s medium (Mediatech, Inc. Herndon, VA) with 4.5 g/l glucose, 4 mM L-glutamine, 10% fetal bovine serum, 100 units/ml penicillin, 100 μg/ml streptomycin, and 500 μg/ml G418. All cells were incubated at 37 °C in a humidified atmosphere of 5% CO2 in air.
In vitro cytotoxicity assay
The prostate cancer cell line stably transfected to overexpress Bcl-2 (PC-3-Bcl-2) was seeded in 96-well plates at a density of 2.5 × 10³ cells per well and treated with drug, control (DMSO only), or mock. The CA inhibitors were dissolved in DMSO and administered at concentrations ranging from 0 nM to 100,000 nM. After 1-4 days, 100 μl of 1 mg/ml MTT (Sigma-Aldrich, St. Louis, MO) solution was added to appropriate plates and allowed to incubate at 37°C for 2.5 hours (37). Each reaction was stopped with lysis buffer (200 mg/ml SDS, 50% N,N-dimethylformamide, pH 4) at room temperature for 1 hour, and the optical density was read on a microplate autoreader (Bio-Tek Instruments, Winooski, VT) at 560 nM. Absorbance values were normalized to the values obtained for the mock treated cells to determine survival percentage. Each assay was performed in triplicate, and the means was calculated from these three assays. Cellular viability was confirmed by means of the crystal violet exclusion test (37).
Western blot analysis
For protein extraction, cells were lysed in lysis buffer [250 mM Tris-HCl (pH 6.8), 2% SDS, and 10% glycerol] and protein inhibitor cocktail (Sigma, St. Louis, MO). A standard protein assay was performed using the DC Protein Assay kit (Bio-Rad, Hercules, CA). Western blot analysis was completed as described previously (38). Immunoblotting was performed by first incubating the proteins with primary antibodies against CA IX (Novus Biologicals, Littleton, CO) and γ-tubulin (Santa Cruz Biotechnology, Santa Cruz, CA) and then with HRP-conjugated secondary antibody (Bio-Rad). Protein antibody complexes were detected by means of chemiluminescence (Amersham, Arlington Heights, IL).
RESULTS
Sequence and structural alignment comparison
The multiple sequence alignment showed the extracellular CA-domain of CA IX (residues 141-390), shared a 39% sequence identity with CA II (residues 1-261). This variation in sequence is approximately the average value of sequence conservation among the human CAs. Superimposition of the Swiss-Model three-dimensional model of the catalytic domain of CA IX onto CA II gave an rmsd of the Cα atoms that was 0.6Å. Not surprising, most of the amino-acid differences between the two isoforms were on the surface. The three centrally located histidines (residues H94, 96, and 119 - CA II numbering) that coordinate the zinc ion, the second sphere histidine coordinating residues (Q92, S117, and the carbonyl of residue 244), and the amino acids that form the hydrophobic CO2 binding pocket (residues V121, V143, L198, T199-CH3, V207 and W209 – CAII numbering). were completely conserved (Figure 1). The active site cavity of CA II can be loosely described as being conical in shape having a 15 Å diameter entrance that tapers into the centre of the enzyme. This cavity is lined with hydrophilic amino acids (residues Y7, N62, H64, A65, N67, T199-Oγ1 and T200-Oγ1- CA II numbering), and these residues exhibit variation between different isoforms. These amino acids are believed to create a solvent network that influences the rate limiting proton transfer step in catalysis. On close inspection of the active site cavity model of CA IX, it differed from CA II with respect to two of these amino acids, namely, A65S and N67Q (based on CA II residue numbering) (Figure 1a). It was hypothesized that these two amino acid differences could cause differences in binding affinity of small molecule inhibitors. Therefore these point mutations were made to CA II to create the CA IX mimic. It is of note that there is a Ser65 in many CA I’s; in CA II from mouse, rat, and chicken; in CA VII, and in some CA IV’s. There is a Gln67 in CA V; CA VI; CA VII; and in alpha CA from Neisseria and Chlamydomonas; and in CA VIII
Figure 1.

Sequence and structure of unbound CA IX mimic. (A) Amino acid sequence alignment of CA II and CA IX from residue 60 to 120 (CA II numbering). Conserved residues His64, His94, His96, His119, and all active site residues, are colored blue. Active site variants, residues 65 and 67, are highlighted in yellow. Alignment performed using Clustal W (31). (B) Crystal structure of CA IX mimic. Backbone (blue cartoon) active site residues (yellow sticks as labeled), Zn2+ (black sphere). (C) Close up view of CA IX mimic. Figure B was generated and rendered in PyMOL (43).
Kinetic comparison
Duda et al., have previously reported the pH profile of kcat/Km for CO2 hydration and the proton transfer-dependent rate constant (RH2O) derived from 18O exchange for CA II, with a kcat/Km for CO2 hydration of (9.8 ± 5) × 107 M-1s-1 and a maximal rate constant for proton transfer from the donor to zinc-bound hydroxide of (8.0 ± 1) × 105 (39). Similarly, the catalytic domain (residues 141-390) of CA IX has been previously cloned and kinetically characterized (17). The pH profile of kcat/Km for CO2 hydration was derived from 18O exchange data and was described by a single ionization with an apparent pKa of 6.3, with a maximal kcat/Km of (5.5 ± 0.1) × 107 M-1s-1. In addition the pH profile for the proton transfer-dependent rate constant of CA IX (RH2O) was shown to be bell-shaped at pH 5-8, similar to CA II with RH2O corresponding to a rate limiting proton transfer from a donor of pKa of 6.4 to an acceptor (zinc-bound hydroxide) with a pKa of 6.4. This was consistent with the pKa obtained from the pH profile of kcat/Km for CO2 hydration. The maximal rate constant for proton transfer from the donor to zinc-bound hydroxide was (1.4 ± 0.3) × 106 s-1.
Similarly, to compare the kinetic properties of CA II and wild-type CA IX to the CA IX mimic, the same 18O protocols were employed. The pH profile (data not shown) determining the kcat/Km (M−1 s−1) for hydration of CO2 catalyzed by CA IX mimic was (5.1 ± 0.2) × 107 M-1s-1 with a (pKa)ZnH2O of 6.7 ± 0.1, and the pH profile for the proton transfer dependent rate constant was fitted and determined to be (8.2 ± 1) × 105s-1, (pKa)donor = 6.8 ± 0.1, and (pKa)ZnH2O = 5.7 ± 0.1. These data were obtained at 25 °C in the absence of buffer using a total concentration of all CO2 species of 25 mM, with the ionic strength maintained at 0.2 M by the addition of sodium sulfate.
Drug inhibition studies
Oxygen-18 exchange methods were also used to measure the inhibition of CA II and the CA IX mimic with the inhibitors AZM, BZM, CHL, EZM, and MZM (Table 1) and compared to available values for CA IX (17). The values measured are given in Table 4. Assessment of the isozyme specificity reveals that AZM, the benchmark CA inhibitor, exhibited a two to three fold better binding affinity for CA IX to CA II, with a Ki of 3.0 nm for wild-type CA IX, 4.9 nm for the CA IX mimic, and 10.1 nm for CA II. This result further demonstrated that the CA IX mimic was more like CA IX than CA II. Of additional interest was CHL exhibited the highest measurable binding affinity of the four inhibitors with accurate data to determine a Ki. ,It has a Ki of 1.1 nm for the CA IX mimic, approximately 2-fold better than the Ki of 2.0 nm for CA II. The inhibitors BZM and MZM showed no significant preferential binding to the CA IX mimic compared to CA II, though BZM was the more potent inhibitor overall, and EZM was a sub-nanomolar inhibitor, below the sensitivity of the Oxygen-18 exchange method instrumentation. This made it impossible to accurately measure the Ki of EZM in these studies.
Table 4.
Ki Values (nM) of inhibitors for CA II, CA IX mimic and CA IX
| Inhibitor | CA II | CA IX mimic | wild-type CA IX |
|---|---|---|---|
| AZM | 10.1±0.7 | 4.9±1 | 3.0* |
| BZM | 7.0±0.9 | 8.8±1.2 | 9.0±1.0 |
| EZM | < 1 | < 1 | - |
| CHL | 2.0±0.4 | 1.1±0.2 | 1.0±0.3 |
| MZM | 11.8±1.8 | 11.4±2 | 9.0* |
data from (17)
Crystallographic study
A complete structural comparison of the binding profiles of the five CA inhibitors (Table 1) was performed with both CA II and the CA IX mimic. All the inhibitor soaked crystals were isomorphous to each other, in the monoclinic space group P21, with mean unit cell dimensions: a = 42.8 ± 0.1, b = 41.8 ± 0.1, c = 72.9 ± 0.1 Å, and β = 104.5 ± 0.1°. The initial electron density omit maps showed unambiguously all the inhibitors had bound in the active site cavity (Figure 2). This binding site has been well characterized for CA II and other α-CAs isoforms (1). All the structures had expected refinement statistics for structures at 1.5-1.8 Å with comparable R factors and rmsd values to CA II (Table 3 and 4). A summary for each of the inhibitors interactions with CA II and CA IX are listed in Table 5. Hydrogen bonds and hydrophobic contact distances that change 0.2 Å or less fall within refinement error and are considered to be the same. The unbound CA IX mimic structure had an rmsd value for 249 Cα atoms of 0.23 Å compared to CA II (PDB code 2ILI)(20). There were no significant conformational changes between the unbound CA II and CA IX mimic, with the exception of residue Ser 65 of CA IX mimic exhibited a dual conformation (Figure 1c). The conformation of Ser 65 facing His 64 had a X1 angle of -176.3° while the other conformation facing away from His 64 was 70.8°. Of additional interest was the proton shuttle residue His 64 in the CA IX mimic showed a dual conformation similar to that previously describe for CA II (35). This implies that the proton shuttling differences were most likely due to residues outside of the cavity
Figure 2.
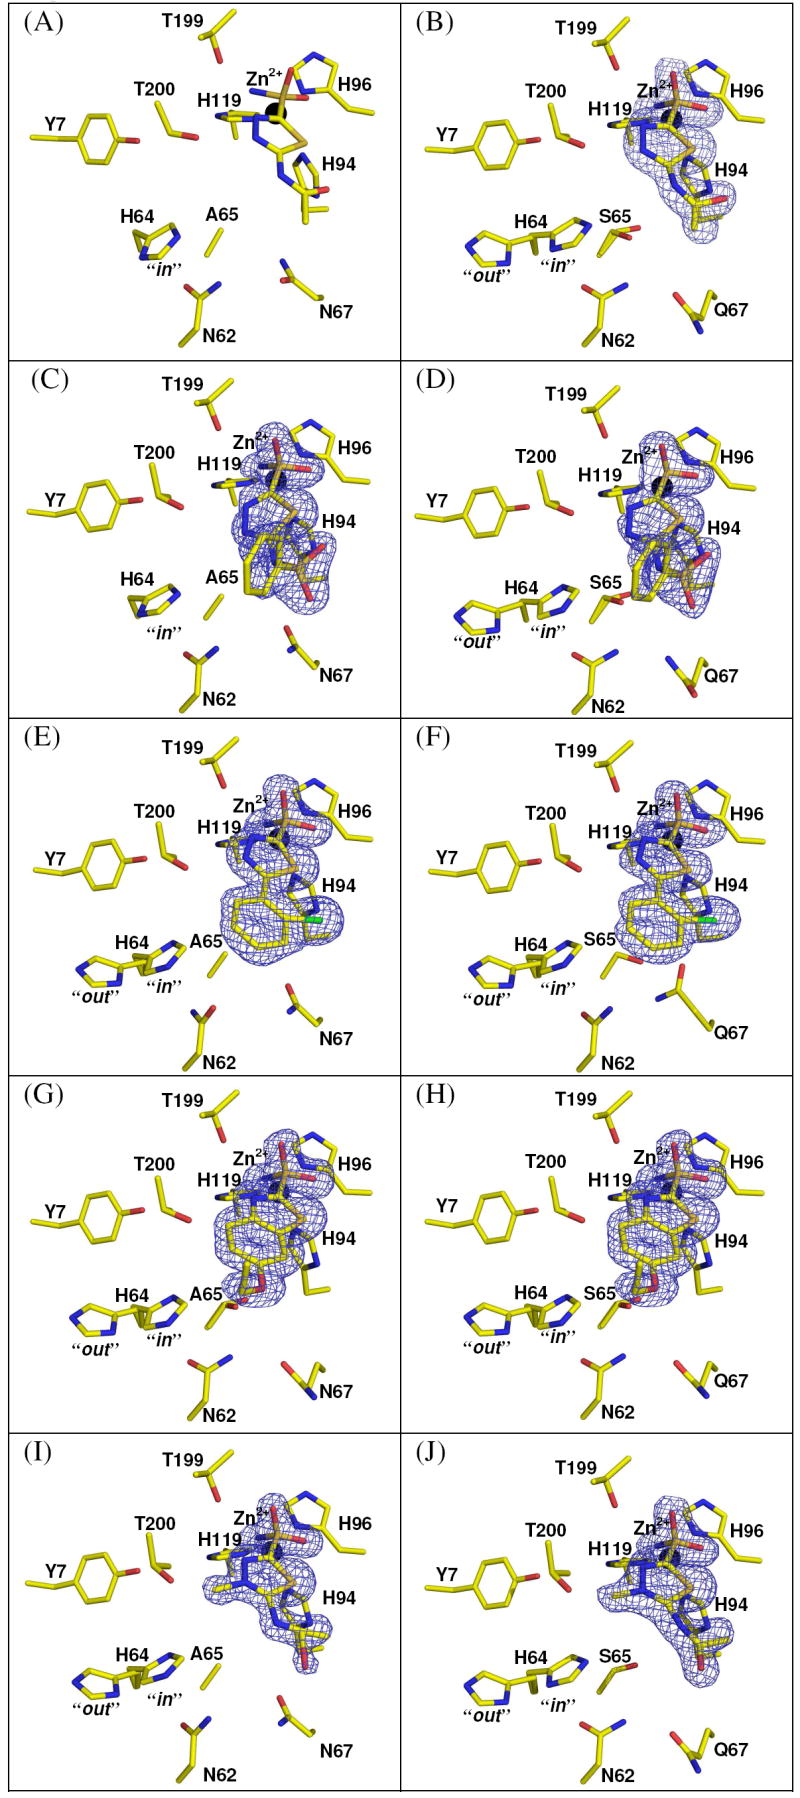
Crystal structures of the active site of CA II and CA IX mimic in complex with inhibitors (A) CA II with AZM, (B) CA IX mimic with AZM (C) CA II with BZM (D) CA IX mimic with BZM (E) CA II with CHL (F) CA IX mimic with CHL (G) CA II with EZM (H) CA IX mimic with EZM (I) CA II with MZM (J) CA IX mimic with MZM. The Zn2+ atom is labeled and shown as a black sphere; side chain residues are labeled and atom coloring are as follows: carbon (yellow), oxygen (red), nitrogen (blue), sulfur (orange), chlorine (green). The blue 2Fo − Fc electron density maps shown is contoured at 1.5σ. Figure generated in PyMOL (43).
Table 5.
Inhibitor-protein interactions (Å).
| Interactions found in all structures | Interactions found in individual drugs | Interactions in individual structures |
|---|---|---|
|
N1 HB*: His 96 (3.3-3.5), Thr 199 (2.8-3.0), ZN2+ (1.9-2.3), His 94 (3.3-3.5), His 119 (3.3- 3.6) O2/O4 HB: His 94 (3.5), Zn2+ (3.0-3.1), His 119 (3.6) O1/O3 HB: Thr 199 (3.0-3.2) S1/S3 HB: Zn2+ (3.0-3.1) HC**: His94 (3.2-3.4) wHC***: Trp 209 (3.6-3.9), His 119 (4.0), His 119 (3.9) [except CA II MZM], His 96 (3.7-4.0) [except CA II MZM], Val 121 (3.7-3.9, 3.8-4.0), His 94 (3.8-4.0, 3.8-4.0, 3.8-4.0), Leu 198 (3.6-3.7, 3.7-3.8, 3.8-3.9, 3.9, 3.7-4.0, 3.7-4.0) |
AZM: N3 HB: Thr 200 (2.9-3.0) N2 HB: Thr 200 (3.1) wHC: His 119 (3.8-3.9, 3.9), His 96 (3.8), Val 143 (4.0), Val 121 (3.7-3.8, 3.8-3.9) |
CA II AZM: O3 HB: Gln 92 (3.2) HC: Gln 92 (3.2), Val 121 (3.5), Phe 131 (3.5, 3.4) wHC: Gln 92 (3.6, 4.0, 3.8), Phe 131 (3.6, 3.7), Leu 198 (4.0) |
|
CA IX mimic AZM: O1 HB: Thr 199 (3.6) wHC: Trp 209 (4.0), Gln 92 (3.8, 4.0), Phe 131 (3.7, 3.8, 3.8, 3.8) | ||
|
BZM: N3 HB: Thr 200 (2.9-3.1) O2 HB: Gln 92 (3.3-3.4) HC: Phe 131 (3.3), Leu 198 (3.3) wHC: His 96 (3.7-3.8), His 119 (3.9), Val 143 (4.0), Val 121 (3.9), Phe 131 (3.5-3.6, 3.7-3.8, 3.7-3.9,3.8-3.9, 4.0) |
CA II BZM: N2 HB: Thr 200 (3.2) N1 HB: Gln 92 (3.6) wHC: Gln 92 (3.9), Phe 131(4.0), Leu 198 (4.0) |
|
|
CA IX mimic BZM: N2 HB: Thr 200 (2.9) wHC: His 94 (3.9), Thr 200 (4.0, 4.0), Phe 131 (3.9), Val 135 (3.9) | ||
|
CHL: O2 HB: His 119 (3.6) N2 HB: Thr 199 (3.5-3.6), Thr 200 (3.4-3.5) N1 HB: Thr 200 (3.0-3.1) HC: Leu 198 (3.4-3.5), Trp 209 (3.5) wHC: His 96 (3.8), His 119 (3.8, 3.9), Thr 199 (4.0), Phe 131 (3.8, 3.8, 3.8-3.9), Leu 198 (3.5-3.6) |
CA II CHL: wHC: Leu 198 (3.6, 3.6, 3.7, 3.7, 3.9) |
|
|
CA IX CHL: CL1 HB: Gln 92 (3.5) wHC: Val 121 (4.0), Leu 198 (3.8, 3.9, 3.9, 4.0) | ||
|
EZM: N2 HB: Thr 200 (3.2-3.4) HC: Leu 198 (3.4, 3.5-3.6), Thr 200 (2.9-3.0, 3.4-3.5) wHC: Trp 209 (4.0), Val 143 (4.0), His 119 (3.8, 3.9), His 96 (3.8), Thr 199 (3.9), Thr 200 (3.7), Pro 201 (3.7, 3.7-3.8), Leu 198 (3.9-4.0), Pro 202 (3.9) |
CA II EZM: wHC: Thr 200 (4.0), Phe 131 (4.0), Leu 198 (4.0) |
|
|
CA IX mimic EZM: wHC: Pro 202 (3.8) | ||
|
MZM: O1 HB: His 119 (3.4-3.6) HC: Thr 200 (3.0-3.1), Pro 201 (3.5-3.6) wHC: Thr 200 (3.8), Phe 131 (3.6, 3.7, 3.8) |
CA II MZM: HC: Gln 92 (3.5) wHC: Val 121 (4.0), Gln 92 (3.8, 4.0, 4.0) |
|
|
CA IX MZM: HC: Trp 209 (3.5), Val 121 (3.5), Gln 92 (3.4, 3.4) wHC: His 96 (4.0), His 119 (3.9, 4.0), Thr 199 (3.9), Val 121 (3.9, 4.0), Leu 198 (3.9, 3.9), Gln 92 (3.7, 3.8, 3.9) |
HB = hydrogen bond (2.0Å-3.6Å)
HC = hydrophobic contact (3.0Å -3.6Å)
wHC = weak hydrophobic contacts (3.6Å -4.0Å)
-CA II_AZM coordinates provided by Dr. Arthur Robbins (personal communication)
All the inhibitor complex structures for both CA II and the CAIX mimic share the same general well characterized sulfonamide binding profile. The N(1) group coordinates to the zinc with a hydrogen bond distance of approximately 2.0 Å and interacts with the nitrogens of His 94, His 96, and His 119 at 3.3-3.6 Å as well as Thr 199 between 2.8-3.0 Å. One oxygen of the sulfonamide group binds to Thr 199 at a distance of between 3.0-3.2 Å. The other oxygen binds His 94 at 3.5 Å, His 119 at 3.6 Å, and Zn2+ at 3.0-3.1 Å. The sulfonamide sulfur binds Zn2+ with a distance of 3.0 Å. There is a Van der Waals interaction with His 94 at a distance of 3.2-3.4 Å as well as numerous weak hydrophobic contacts with residues Trp 209, His 119, His 96, His 94, Val 121, and Leu 198 (listed in Table 5).
In AZM the two nitrogens of the thiadiazole ring form hydrogen bonds with Thr 200 at distances of 2.9-3.0 Å and 3.1 Å, respectively. It also forms weak hydrophobic contacts with residues His 119, His 96, Val 143 and Val 121 in both CA II and CA IX mimic (Figure 2b). The CA II AZM structure contains an additional hydrogen bond with Gln 92 with changes the conformation of the residue and lead to more hydrophobic interactions with Val 121, Phe 131, and weakly with Leu 198. For the CA IX mimic AZM there was an additional hydrogen bond with Thr 199 which created several weak hydrophobic contacts with Trp 209, Gln 92, and Phe 131. In both structures of BZM the O(2) of the sulfonamide hydrogen bonds with the nitrogen of Gln92 at a distance of 3.3-3.4Å, N(3) hydrogen bonds with Thr 200 at 2.9-3.1 Å, and more hydrophobic contacts are made with Leu198 and Phe 131 as well as several weak hydrophobic interactions (Figure 2c). The CA II BZM structure has two additional hydrogen bonds, one to Thr 200 at 3.2 Å and the other to Gln 92 at 3.6 Å. In the CA IX mimic complexed with BZM, there is a 2.9 Å hydrogen bond of the N(2) to Thr 200. There are also weak hydrophobic contacts are seen with residues His 94, Thr 200, Phe 131 and Val135 (Figure 2d). EZM has nearly identical interactions with both CA II and CA IX mimic, which consists of the N(2) hydrogen bonding to Thr 200 at 3.2-3.4 Å and of hydrophobic contacts including Thr 200, Leu 198, Trp 209, His 96, His 119, Thr 199, Pro 201, Pro 202, and Val 143 (Figure 2g, h). There are only a few weak Van der Waals interactions different between the two. MZM forms an additional hydrogen bond between O(1) and His 119 at a distance of 3.4-3.5 and makes hydrophobic contacts with Thr 200, Pro 201, and Phe 131 in both CA II and CA IX mimic. Most of the difference between CA II and CA IX mimic bound to MZM are in weak hydrophobic interactions. (Figure 2i, j).
In the case of CHL, both structures show O(2) hydrogen bonding to His 119 at 3.6 Å, N(2) binding Thr 199 at 3.5-3.6 Å and Thr 200 at 3.4-3.5 Å, and N(1) hydrogen bonding to Thr 200 at a distance of 3.0-3.1 Å. There are also several Van der Waals contacts with residues Leu 198, Trp 209, His 96, His 119, Thr 199, and Phe 131.The structure of CA II CHL show several new weak hydrophobic interactions (Figure 2e). However, in the crystal structure of CA IX mimic in complex with CHL, the chlorine hydrogen bonds with Gln 92, this pulls residue Gln67 into the active site and fixes Ser65 into one conformation oriented towards the His 64 with a X1 angle of 111.4° (Figure 2f and Figure 3a, b).
Figure 3.

Superposition of all five drug complexes in crystal structures. (A) Active sites of CA II complexes. (B) Active sites of CA IX mimic complexes. AZM (red), BZM (magenta), CHL (green), EZM (orange), MZM (blue), Zn2+ (black sphere). (C) and (D) Superposition of all five drugs in CA II and CA IX mimic respectively. (E) and (F) Superposition of all five drugs in CA II and CA IX mimic respectively rotated 90 degrees from previous view. Figure generated in PyMOL (43).
When the drugs are superimposed on one another, the similarities and differences of binding become apparent (Figure 3c-f). The sulfonamide groups are in nearly superimposible orientations. For the most part the thiadiazole ring and hydrophobic tail are locked into a planar geometry with two exceptions. In EZM the thiadiazole ring is rotated out slightly, probably due to the additional conjugated ring, and the ethoxy group lies nearly perpendicular to the regular plane. In BZM the thiadiazole ring is rotated significantly out of plane and the phenylsulfonyl is rotated nearly 90° as compared to the hydrophobic tails of the AZM, CHL, and MZM and aligning with the ethoxy of EZM.
PC-3-Bcl-2 western blot and cytotoxicity assay
A western blot was performed on untreated PC-3-Bcl-2 cells to verify the expression of CA IX in this cancer cell line (Figure 4a). To determine the effects of carbonic anhydrase inhibitors on cell proliferation and viability, PC-3-Bcl-2 prostate cancer cell lines were treated for 96 h with the carbonic anhydrase inhibitors (at concentrations ranging from 0 nM to 100,000 nM), control or mock. Cellular proliferation is depicted at 0.1 mM for all agents (Figure 4b). AZM, BZM, and EZM even at higher doses had no cytotoxic effects. However, MZM at 0.01 mM and 0.1 mM demonstrated significant inhibition of proliferation and viability compared to control (29% and 32% inhibition respectively, p < 0.01). For inhibitor CHL, significant reduction in cellular proliferation and viability was evident only at 0.1 mM (57% inhibition, p < 0.01). It is important to note that these values are consistent with those previously published for in vitro studies of sulfonamides in cancer cell lines (3, 40).
Figure 4.

Cell proliferation analysis in PC-3-Bcl-2 prostate cancer cell lines. (A) Western Blot Analysis verifying the expression of CA IX by the PC-3-Bcl-2 cells. (B) PC-3-Bcl-2 cells were treated with one of the following inhibitors; AZM (red), BZM (magenta), CHL (green), EZM (orange), MZM (blue) at 0.1 mM for 96 hours and then subjected to MTT assay. X axis, exposure time (hours); Y axis, % surviving fraction compared to mock (DMSO only). Only compounds CHL and MZM demonstrated reduced proliferation compared to mock (43% and 68%, respectively). Each assay was performed in triplicate, and the mean for all 3 experiments was calculated. Crystal violet exclusion test confirmed the above MTT results (i.e. decrease proliferation) were associated with increase cell death.
DISCUSSION
This work describes the kinetic and structural characterization a CA IX mimic. Translating the knowledge derived from this mimic to in vitro studies; has identified potential drugs for cancers over-expressing CA IX.
The kinetic characterization of the CA IX mimic, demonstrates that the two amino acid mutations in CA II to CA IX do imitate CA IX in terms of chemistry at the active site zinc ion. The values of kcat/Km for the CA IX mimic are similar to those reported for the CA domain of CA IX in Wingo et. al. and in Hilvo et. al.(17, 18). However these values are lower than those reported for the CA domain with the N-terminal proteoglycan domain in Hilvo et. al.(18). The kcat/Km of both the CA IX mimic and CA IX exhibit a two-fold decrease as compared to CA II which is probably due to a change in hydrophobic properties in the active site caused by the change from the hydrophobic alanine at position 65 to the polar serine residue. In terms of chemistry at His64, however, the kinetic properties of the CA IX mimic are still much like those of CA II. This is likely because there is no significant change in the active site residues that coordinate the waters in the active site cavity. This means there is possibly another, non-active site residue that causes the difference in proton transfer between CA II and CA IX. Further investigation into several theoretical proton shuttling residues identified by molecular dynamics reveal two mutations that might improve the kinetics (41, 42). The first is Glu 69, a Thr in CA IX, and Lys 170, which is a Glu. However, despite the difference in proton transfer rates between the CA IX mimic and CA IX, the kinetic profile of the CA II double mutant seems a good model for inhibition of CA IX in the active site cavity.
To assess the viability of the CA IX mimic as an analog of wild-type CA IX the Ki values have been compared to CA II with the classic sulfonamides. The CA IX mimic values correspond preferentially to wild-type CA IX, lending credence to use this as a model for CA IX isozyme specificity. However the CA IX mimic is not perfect as demonstrated by the slight disparity in Ki values between CA IX mimic and wild-type. The differences fall within statistical variation and given the difficulties in expressing wild-type CA IX, the mimic may provide an opportunity to pre-screen possible drugs or as a model for rational drug design.
Recently a study was published characterizing biochemically the extracellular domains of native CA IX. Amongst the conclusions of this paper was the identification of both dimeric and monomeric forms of CA IX, in the ratio of 60% to 34% respectively (18). Homology modeling of CA IX revealed that the location of the intermolecular disulfide is located on the opposite side of the enzyme, away from the active site. From this information it was concluded that the dimeric state probably does not affect catalytic activity and, as a result, the monomeric CA IX mimic is still a satisfactory model for CA IX inhibition.
In assuming that the CA IX mimic is an adequate analog, the study reveals valuable information regarding the isozyme specificity of classical sulfonamides. The kinetics and crystal structures reveal an interesting story. In the case of AZM, the Ki value is lowered by a factor of two in the CA IX mimic, making it a better inhibitor of the mutant than CA II. This could be due to the conformational change of Gln 92 in the structure of CA IX mimic as compared to CA II, however the in vitro studies show AZM has no cytotoxic effect on the PC-3-Bcl-2 cells. As a result, our study indicates that AZM may not be the most effective agent for this purpose.
BZM and MZM show few differences kinetically or structurally, making them less likely to be preferentially effective against the CA IX found in cancer cells. This being said, MZM did show cytotoxic effects against PC-3-Bcl-2 cells which indicates that it cannot be excluded from the list of possible anti-cancer therapies. EZM cannot be adequately assessed kinetically due to its sub-nanomolar Ki and there are few clues structurally as to its isozyme specificity other than increased surface area binding (unpublished data). Until a more sensitive test of kinetics is developed, its potency presents a risk as a cancer treatment due to the high likelihood of inhibiting CA II.
The results of this study suggest that CHL has the most potential for therapeutics. Comparing the structures of CA II versus CA IX mimic, the chlorine in CHL hydrogen binds to Gln 92 in the mimic and not in CA II. This may be the reason for the conformational change of Gln 67 and the locking of Ser 65 into one position oriented towards His 64. Kinetically, the Ki value is the lowest in CA IX mimic, excluding EZM. The increased inhibition is possibly due to the aforementioned Gln67, which is a mutated active site residue, being pulled into a locked down conformation by Gln 92 then hydrogen bonding to the other mutant residue Ser65. This binding mode is different from the sulfonamides in CA II which typically bind in a “lock and key” mechanism which does not induce conformational changes. Also, CHL is also the only structure with a bulky chloride present and halides such as chlorine are known to affect the hydrostatics of the surrounding environment. The hydrostatic change of the environment is causing this locked down effect improving the inhibition and selectivity of CHL. This evidence is supported by the cytotoxicity assay which shows CHL not only impedes propagation of PC-3-Bcl-2 cells but in fact induces cell death.
In conclusion, we have developed an effective surrogate of CA IX for use in high-throughput kinetic and structural screenings. The fact that the crystallographic analysis and kinetic studies of CA IX mimic correlated to the cytotoxicity assay only serves to reinforce this claim. Of the five drugs studied, AZM, MZM, and CHL were identified as potential anti-cancer drugs, alone or in conjunction with traditional chemotherapy. Further in vitro and in vivo studies are needed to confirm this assertion, as well as an investigation into the disparity between Ki values and growth inhibition curves in vivo. The CA IX mimic also presents a unique opportunity for quick screening of novel CA IX inhibitors.
Footnotes
This work was supported by a grant (GM25154 to D.N.S. and R.M.) from the National Institutes of Health and the Maren Foundation (to R.M.).
Coordinates and structure factors have been deposited in the Protein Data Bank as 3DC9.pdb and 3DC9.sf, 3DCS.pdb and 3DCS.sf, 3DCC.pdb and 3DCC.sf, 3DC3.pdb and 3DC3.sf, 3DCW.pdb and 3DCW.sf, 3DBU.pdb and 3DBU.sf, 3DAZ.pdb and 3DAZ.sf, 3D9Z.pdb and 3D9Z.sf, 3DD0.pdb and 3DD0.sf, and 3D8W.pdb and 3D8W.sf.
Abbreviations: CAs, carbonic anhydrases; CA II, carbonic anhydrase II; CA IX, carbonic anhydrase IX; CA IX mimic, double mutant of CA II with Ala 65 replaced by Ser and Asn 67 replace by Gln to resemble the active site of CA IX: AZM, acetazolamide; BZM, benzolamide; CHL, chlorzolamide; EZM: ethoxzolamide; MZM, methazolamide; CGLS, conjugate gradient least-squares; Ki, inhibition constant.
References
- 1.Krishnamurthy VM, Kaufman GK, Urbach AR, Gitlin I, Gudiksen KL, Weibel DB, Whitesides GM. Carbonic anhydrase as a model for biophysical and physical-organic studies of proteins and protein-ligand binding. Chem Rev. 2008;108:946–1051. doi: 10.1021/cr050262p. [DOI] [PMC free article] [PubMed] [Google Scholar]
- 2.Maren TH, Conroy CW. A new class of carbonic anhydrase inhibitor. J Biol Chem. 1993;268:26233–26239. [PubMed] [Google Scholar]
- 3.Supuran CT, Briganti F, Tilli S, Chegwidden WR, Scozzafava A. Carbonic anhydrase inhibitors: sulfonamides as antitumor agents? Bioorg Med Chem. 2001;9:703–714. doi: 10.1016/s0968-0896(00)00288-1. [DOI] [PubMed] [Google Scholar]
- 4.Supuran CT, Casini A, Scozzafava A. Protease inhibitors of the sulfonamide type: anticancer, antiinflammatory, and antiviral agents. Med Res Rev. 2003;23:535–558. doi: 10.1002/med.10047. [DOI] [PubMed] [Google Scholar]
- 5.Pastorekova S, Parkkila S, Pastorek J, Supuran CT. Carbonic anhydrases: current state of the art, therapeutic applications and future prospects. J Enzyme Inhib Med Chem. 2004;19:199–229. doi: 10.1080/14756360410001689540. [DOI] [PubMed] [Google Scholar]
- 6.Wilkinson BL, Bornaghi LF, Houston TA, Innocenti A, Vullo D, Supuran CT, Poulsen SA. Inhibition of membrane-associated carbonic anhydrase isozymes IX, XII and XIV with a library of glycoconjugate benzenesulfonamides. Bioorg Med Chem Lett. 2007;17:987–992. doi: 10.1016/j.bmcl.2006.11.046. [DOI] [PubMed] [Google Scholar]
- 7.Thiry A, Dogne JM, Masereel B, Supuran CT. Targeting tumor-associated carbonic anhydrase IX in cancer therapy. Trends Pharmacol Sci. 2006;27:566–573. doi: 10.1016/j.tips.2006.09.002. [DOI] [PubMed] [Google Scholar]
- 8.Potter CP, Harris AL. Diagnostic, prognostic and therapeutic implications of carbonic anhydrases in cancer. Br J Cancer. 2003;89:2–7. doi: 10.1038/sj.bjc.6600936. [DOI] [PMC free article] [PubMed] [Google Scholar]
- 9.Gullino PM, Grantham FH, Smith SH. The Interstitial Water Space of Tumors. Cancer Res. 1965;25:727–731. [PubMed] [Google Scholar]
- 10.Gullino PM, Grantham FH, Smith SH, Haggerty AC. Modifications of the acid-base status of the internal milieu of tumors. J Natl Cancer Inst. 1965;34:857–869. [PubMed] [Google Scholar]
- 11.Helmlinger G, Sckell A, Dellian M, Forbes NS, Jain RK. Acid production in glycolysis-impaired tumors provides new insights into tumor metabolism. Clin Cancer Res. 2002;8:1284–1291. [PubMed] [Google Scholar]
- 12.Svastova E, Zilka N, Zat’ovicova M, Gibadulinova A, Ciampor F, Pastorek J, Pastorekova S. Carbonic anhydrase IX reduces E-cadherin-mediated adhesion of MDCK cells via interaction with beta-catenin. Exp Cell Res. 2003;290:332–345. doi: 10.1016/s0014-4827(03)00351-3. [DOI] [PubMed] [Google Scholar]
- 13.Teicher BA, Liu SD, Liu JT, Holden SA, Herman TS. A carbonic anhydrase inhibitor as a potential modulator of cancer therapies. Anticancer Res. 1993;13:1549–1556. [PubMed] [Google Scholar]
- 14.Parkkila S, Rajaniemi H, Parkkila AK, Kivela J, Waheed A, Pastorekova S, Pastorek J, Sly WS. Carbonic anhydrase inhibitor suppresses invasion of renal cancer cells in vitro. Proc Natl Acad Sci U S A. 2000;97:2220–2224. doi: 10.1073/pnas.040554897. [DOI] [PMC free article] [PubMed] [Google Scholar]
- 15.Xiang Y, Ma B, Li T, Yu HM, Li XJ. Acetazolamide suppresses tumor metastasis and related protein expression in mice bearing Lewis lung carcinoma. Acta Pharmacol Sin. 2002;23:745–751. [PubMed] [Google Scholar]
- 16.Supuran C, Scozzafava A. Applications of carbonic anhydrase inhibitors and activators in therapy. Expert Opinion on Therapeutic Patents. 2002;12:217–241. [Google Scholar]
- 17.Wingo T, Tu C, Laipis PJ, Silverman DN. The catalytic properties of human carbonic anhydrase IX. Biochem Biophys Res Commun. 2001;288:666–669. doi: 10.1006/bbrc.2001.5824. [DOI] [PubMed] [Google Scholar]
- 18.Hilvo M, Baranauskiene L, Salzano AM, Scaloni A, Matulis D, Innocenti A, Scozzafava A, Monti SM, Di Fiore A, De Simone G, Lindfors M, Janis J, Valjakka J, Pastorekova S, Pastorek J, Kulomaa MS, Nordlund HR, Supuran CT, Parkkila S. Biochemical characterization of CA IX: one of the most active carbonic anhydrase isozymes. J Biol Chem. 2008 doi: 10.1074/jbc.M800938200. [DOI] [PubMed] [Google Scholar]
- 19.Thompson JD, Higgins DG, Gibson TJ. CLUSTAL W: improving the sensitivity of progressive multiple sequence alignment through sequence weighting, position-specific gap penalties and weight matrix choice. Nucleic Acids Res. 1994;22:4673–4680. doi: 10.1093/nar/22.22.4673. [DOI] [PMC free article] [PubMed] [Google Scholar]
- 20.Fisher SZ, Maupin CM, Budayova-Spano M, Govindasamy L, Tu C, Agbandje-McKenna M, Silverman DN, Voth GA, McKenna R. Atomic crystal and molecular dynamics simulation structures of human carbonic anhydrase II: insights into the proton transfer mechanism. Biochemistry. 2007;46:2930–2937. doi: 10.1021/bi062066y. [DOI] [PubMed] [Google Scholar]
- 21.Schwede T, Kopp J, Guex N, Peitsch MC. SWISS-MODEL: An automated protein homology-modeling server. Nucleic Acids Res. 2003;31:3381–3385. doi: 10.1093/nar/gkg520. [DOI] [PMC free article] [PubMed] [Google Scholar]
- 22.Emsley P, Cowtan K. Coot: model-building tools for molecular graphics. Acta Crystallogr D Biol Crystallogr. 2004;60:2126–2132. doi: 10.1107/S0907444904019158. [DOI] [PubMed] [Google Scholar]
- 23.Gillam S, Smith M. Site-specific mutagenesis using synthetic oligodeoxyribonucleotide primers: II. In vitro selection of mutant DNA. Gene. 1979;8:99–106. doi: 10.1016/0378-1119(79)90010-6. [DOI] [PubMed] [Google Scholar]
- 24.Gillam S, Smith M. Site-specific mutagenesis using synthetic oligodeoxyribonucleotide primers: I. Optimum conditions and minimum ologodeoxyribonucleotide length. Gene. 1979;8:81–97. doi: 10.1016/0378-1119(79)90009-x. [DOI] [PubMed] [Google Scholar]
- 25.Davanloo P, Rosenberg AH, Dunn JJ, Studier FW. Cloning and expression of the gene for bacteriophage T7 RNA polymerase. Proc Natl Acad Sci U S A. 1984;81:2035–2039. doi: 10.1073/pnas.81.7.2035. [DOI] [PMC free article] [PubMed] [Google Scholar]
- 26.Studier FW, Moffatt BA. Use of bacteriophage T7 RNA polymerase to direct selective high-level expression of cloned genes. J Mol Biol. 1986;189:113–130. doi: 10.1016/0022-2836(86)90385-2. [DOI] [PubMed] [Google Scholar]
- 27.Khalifah RG. Histidine-200 alters inhibitor binding in human carbonic anhydrase B. A carbon-13 nuclear magnetic resonance identification. Biochemistry. 1977;16:2236–2240. doi: 10.1021/bi00629a030. [DOI] [PubMed] [Google Scholar]
- 28.McPherson A. Preparation and Analysis of Protein Crystals. John Wiley and Sons; New York: 1982. [Google Scholar]
- 29.Otwinowski Z, Minor W. Processing of X-ray Diffraction Data Collected in Oscillation Mode. Vol. 276. Yale University; New Haven, CT, USA: 1997. [DOI] [PubMed] [Google Scholar]
- 30.Brunger AT, Adams PD, Clore GM, DeLano WL, Gros P, Grosse-Kunstleve RW, Jiang JS, Kuszewski J, Nilges M, Pannu NS, Read RJ, Rice LM, Simonson T, Warren GL. Crystallography & NMR system: A new software suite for macromolecular structure determination. Acta Crystallogr D Biol Crystallogr. 1998;54:905–921. doi: 10.1107/s0907444998003254. [DOI] [PubMed] [Google Scholar]
- 31.Schuttelkopf AW, van Aalten DM. PRODRG: a tool for high-throughput crystallography of protein-ligand complexes. Acta Crystallogr D Biol Crystallogr. 2004;60:1355–1363. doi: 10.1107/S0907444904011679. [DOI] [PubMed] [Google Scholar]
- 32.Sheldrick GM. A short history of SHELX. Acta Crystallogr A. 2008;64:112–122. doi: 10.1107/S0108767307043930. [DOI] [PubMed] [Google Scholar]
- 33.Laskowski RA, Moss DS, Thornton JM. Main-chain bond lengths and bond angles in protein structures. J Mol Biol. 1993;231:1049–1067. doi: 10.1006/jmbi.1993.1351. [DOI] [PubMed] [Google Scholar]
- 34.Silverman DN. Carbonic anhydrase: oxygen-18 exchange catalyzed by an enzyme with rate-contributing proton-transfer steps. Methods Enzymol. 1982;87:732–752. doi: 10.1016/s0076-6879(82)87037-7. [DOI] [PubMed] [Google Scholar]
- 35.Fisher Z, Hernandez Prada JA, Tu C, Duda D, Yoshioka C, An H, Govindasamy L, Silverman DN, McKenna R. Structural and kinetic characterization of active-site histidine as a proton shuttle in catalysis by human carbonic anhydrase II. Biochemistry. 2005;44:1097–1105. doi: 10.1021/bi0480279. [DOI] [PubMed] [Google Scholar]
- 36.Segel I. Enzyme Kinetics: Behavior and Analysis of Rapid Equilibrium and Steady-State Enzyme Systems. Wiley-Interscience; New York: 1975. [Google Scholar]
- 37.Anai S, Shiverick K, Medrano T, Nakamura K, Goodison S, Brown BD, Rosser CJ. Downregulation of BCL-2 induces downregulation of carbonic anhydrase IX, vascular endothelial growth factor, and pAkt and induces radiation sensitization. Urology. 2007;70:832–837. doi: 10.1016/j.urology.2007.06.1118. [DOI] [PubMed] [Google Scholar]
- 38.Goodison S, Nakamura K, Iczkowski KA, Anai S, Boehlein SK, Rosser CJ. Exogenous mycoplasmal p37 protein alters gene expression, growth and morphology of prostate cancer cells. Cytogenet Genome Res. 2007;118:204–213. doi: 10.1159/000108302. [DOI] [PubMed] [Google Scholar]
- 39.Silverman DN, Tu CK. Carbonic anhydrase catalyzed hydration studied by 13C and 18O labeling of carbon dioxide. J Am Chem Soc. 1976;98:978–984. doi: 10.1021/ja00420a019. [DOI] [PubMed] [Google Scholar]
- 40.Svastova E, Hulikova A, Rafajova M, Zat’ovicova M, Gibadulinova A, Casini A, Cecchi A, Scozzafava A, Supuran CT, Pastorek J, Pastorekova S. Hypoxia activates the capacity of tumor-associated carbonic anhydrase IX to acidify extracellular pH. FEBS Lett. 2004;577:439–445. doi: 10.1016/j.febslet.2004.10.043. [DOI] [PubMed] [Google Scholar]
- 41.Riccardi D, Konig P, Guo H, Cui Q. Proton transfer in carbonic anhydrase is controlled by electrostatics rather than the orientation of the acceptor. Biochemistry. 2008;47:2369–2378. doi: 10.1021/bi701950j. [DOI] [PubMed] [Google Scholar]
- 42.Roy A, Taraphder S. Identification of proton-transfer pathways in human carbonic anhydrase II. J Phys Chem B. 2007;111:10563–10576. doi: 10.1021/jp073499t. [DOI] [PubMed] [Google Scholar]
- 43.DeLano WL. Delano Scientific. Palo Alto; CA, USA: 2002. [Google Scholar]