

Abstract
The search for novel enzymes and enzymatic activities is important to map out all metabolic activities and reveal cellular metabolic processes in a more exhaustive manner. Here we present biochemical and physiological evidence for the function of the uncharacterized protein YihU in Escherichia coli using metabolite profiling by capillary electrophoresis time-of-flight mass spectrometry. To detect enzymatic activity and simultaneously identify possible substrates and products of the putative enzyme, we profiled a complex mixture of metabolites in the presence or absence of YihU. In this manner, succinic semialdehyde was identified as a substrate for YihU. The purified YihU protein catalyzed in vitro the NADH-dependent reduction of succinic semialdehyde to γ-hydroxybutyrate. Moreover, a yihU deletion mutant displayed reduced tolerance to the cytotoxic effects of exogenous addition of succinic semialdehyde. Profiling of intracellular metabolites following treatment of E. coli with succinic semialdehyde supports the existence of a YihU-catalyzed reduction of succinic semialdehyde to γ-hydroxybutyrate in addition to its known oxidation to succinate and through the tricarboxylic acid cycle. These findings suggest that YihU is a novel γ-hydroxybutyrate dehydrogenase involved in the metabolism of succinic semialdehyde, and other potentially toxic intermediates that may accumulate under stress conditions in E. coli.
The search for novel enzymes is important to better our understanding of the metabolic systems of the cell. Although computational tools can be used to functionally annotate enzymes based on sequence homology, gene structure and expression, and prediction of enzyme-like domains, the identification of the exact physiological substrates remains difficult when sequence similarity to known enzymes is low (<60%) and requires experimental confirmation (1, 2). Consequently, many gaps remain in metabolic pathways even in the model microorganism Escherichia coli (3, 4). Moreover, the identification of dispensable enzymatic activities, such as metabolic bypass pathways or the characterization of enzymes that are expressed only under specific physiological conditions, is particularly challenging.
The β-hydroxyacid dehydrogenase enzyme family is a structurally conserved group of enzymes that include β-hydroxyisobutyrate dehydrogenase, 6-phosphogluconate dehydrogenase, and numerous uncharacterized homologs (5, 6). This enzyme family contains well conserved domains in its sequence that include a N-terminal Rossmann-fold characteristic of a dinucleotide binding site, a well defined sequence at the substrate binding site, and a conserved lysine residue proposed as a critical catalytic residue. This last specific structural feature has been proposed based on site-directed mutagenesis and x-ray crystal structures (6, 7). The E. coli K12 proteome appears to contain four β-hydroxyacid dehydrogenase paralogs. The product of the glxR gene has been identified as tartronate semialdehyde reductase, catalyzing the NAD+-dependent oxidation of d-glycerate and the NADH-dependent reduction of tartronate semialdehyde (8). This enzyme plays a role in allantoin utilization under anaerobic conditions in E. coli (9). However, the function of the other three representatives of the family remains unknown.
Under aerobic conditions in E. coli, γ-aminobutyrate (GABA)2 is metabolized via GABA transaminase (EC 2.6.1.19) (10) and oxidized to succinate by at least two different succinic semialdehyde dehydrogenases (EC 1.2.1.16 and EC 1.2.1.24) (11, 12), and then further metabolized in the tricarboxylic acid cycle. In some animals (13), plants (14), and bacterial species (15, 16), γ-hydroxybutyrate (GHB) can be produced during GABA catabolism through the reduction of succinic semialdehyde (SSA) under anaerobic conditions. A γ-hydroxybutyrate dehydrogenase (GHBDH) was recently identified in Arabidopsis thaliana (14). Interestingly, the Arabidopsis enzyme does not show significant homology with known GHBDHs, however, its sequence exhibits similarity to several dehydrogenases including β-hydroxyacid dehydrogenases and 6-phosphogluconate dehydrogenases. However, the existence of an equivalent of the GHBDH reaction and an alternative reductive pathway for GABA metabolism in E. coli is still unreported.
We have previously developed a screening method, based on in vitro assays in combination with metabolite profiling by capillary electrophoresis-mass spectrometry (CE-MS), to discover novel enzymatic activities (17). We hereby refer to this method as Metabolic Enzyme and Reaction discovery by Metabolite profile Analysis and reactant IDentification (MERMAID). Using this method, the enzymatic activity of any uncharacterized protein can be tested in an unbiased way by monitoring changes in a complex metabolite mixture that are induced by the test protein. This can allow to directly determine the substrate(s) and/or product(s) of the reaction without designing specific assays. Compounds whose levels specifically decrease following incubation with a protein are likely substrates, whereas metabolites whose level increase during the incubation are likely products of the reaction. In this study, we screened the E. coli YihU protein using the MERMAID approach and observed that it displays reductase activity toward short chain aldehydes, predominantly toward SSA. This activity differs from that of the known β-hydroxyacid dehydrogenases. We further demonstrate the presence of an alternative reaction for SSA catabolism leading to the production of GHB in E. coli.
EXPERIMENTAL PROCEDURES
Expression and Purification of Recombinant Proteins
Histidine-tagged recombinant proteins were purified from ASKA clones (A Complete Set of E. coli K12 ORF Archive) (18). Each of the full-length open reading frames is cloned in an archive expression vector pCA24N (GenBankTM AB052891) containing a His6 tag at the amino-terminal of the open reading frame. Recombinant proteins were produced in E. coli AG1 cells (Stratagene, La Jolla, CA) and purified using cobalt-based immobilized TALON metal affinity chromatography resins with a gravity-flow column (Clontech, Palo Alto, CA) according to the protocol provided by the manufacturer. Finally, the proteins were eluted from the column using 50 mm sodium phosphate buffer (pH 7.0) containing 150 mm NaCl and 200 mm imidazole. The protein solution was ultrafiltrated with a 10,000 nominal molecular weight limit filter (Millipore, Billerica, MA) to exchange buffer to an imidazole-free sodium phosphate buffer. The enriched protein solution supplemented with 30% of glycerol was stored at −30 °C until use. The concentration of purified proteins was determined using a protein assay reagent (Bio-Rad) using bovine serum albumin as a standard and purity was estimated by SDS-PAGE. Size exclusion chromatography was performed using a Bio-Silect SEC-250-5 column (300 × 7.8 mm) (Bio-Rad) equilibrated with 100 mm sodium phosphate buffer (pH 7.0) containing 150 mm NaCl and using an Agilent 1100 series purification system (Agilent Technologies Inc.). Fractions were collected at a flow rate of 0.5 ml/min. Calibration was performed using the gel filtration molecular weight standards from Bio-Rad.
Enzyme Assays
Unless otherwise stated, spectrophotometric dehydrogenase assays were performed at 37 °C in 100 μl of reaction mixture containing 5 mm substrate and 1 μg of purified protein in 100 mm MOPS-KOH buffer (pH 7.2) and 1 mm NADH (in the reductive direction) or 100 mm Tris-HCl buffer (pH 8.8) and 1 mm β-NAD+ (in the oxidative direction) together with 10 mm MgCl2, 10 mm KCl, 1 mm MnCl2. Reactions were initiated by adding substrate, and monitored by measuring the change in NADH absorbance at 340 nm. Specific activities were calculated from the rate of change in NADH amount (μmol/min) per mg of protein used. All spectrophotometric assays were performed using a SpectraMax Plus microplate spectrophotometer (Molecular Devices). Confirmation of YihU activity on GHB was performed using GHB synthesized from alkaline hydrolysis of γ-butyrolactone (19).
Metabolomics-based Enzyme Screening Using MERMAID Method
Metabolomics-based in vitro enzyme screening was performed as described previously (17) with some modifications. Reactions were performed in 20 mm Tris-HCl buffer (pH 7.2), 10 mm MgCl2, 10 mm KCl, 1 mm MnCl2, with a metabolite mixture prepared from yeast extract (BD Biosciences) supplemented with 200 μm of the following general enzyme cofactors: NAD+, NADH, NADP+, NADPH, thiamine pyrophosphate, pyridoxal 5′-phosphate, biotin, S-(5′-adenosyl)-l-methionine, coenzyme A (CoA), flavin mononucleotide (FMN), flavin adenine dinucleotide, acetyl-CoA, ATP, AMP, GTP, GDP, GMP, and CMP. In addition to the above components, 200 μm each of methionine sulfone, 3-aminopyrrolidine, MES, and trimesic acid were added to the reaction mixture as internal standards for CE-TOFMS analysis. Following the addition of 1 μg of purified protein to 100 μl of the above assay solution, the mixture was incubated for 1 h or longer at 37 °C. The reaction mixture was ultrafiltrated through a Millipore centrifugal membrane with 10,000 nominal molecular weight limit to remove the enzyme and stop the reaction. The filtrate was analyzed directly by CE-TOFMS in both positive and negative modes to profile cationic and anionic molecules, respectively.
Instrumentation and CE-TOFMS Conditions
CE-TOFMS was carried out using an Agilent CE Capillary Electrophoresis System equipped with an Agilent 6210 Time-of-flight mass spectrometer, Agilent 1100 isocratic HPLC pump, Agilent G1603A CE-MS adapter kit, and Agilent G1607A CE-ESI-MS sprayer kit (Agilent Technologies, Waldbronn, Germany). The system was controlled by Agilent G2201AA ChemStation software for CE. Data acquisition was performed by Analyst QS Build: 7222 software for Agilent TOF (Applied Biosystems and MDS Sciex, Ontario, Canada). Instrumental conditions for separations and detections of metabolites were as follows. The cationic metabolites were separated on a fused silica capillary (50 μm × 100 cm) using 1 m formic acid as the electrolyte. The applied voltage was set at +30 kV. A solution of 50% (v/v) methanol/water was delivered as the sheath liquid at 10 μl/min (20, 21). Separations of anionic metabolites were carried out on a cationic polymer-coated SMILE (+) capillary (Nacalai Tesque, Kyoto, Japan) using 50 mm ammonium acetate (pH 8.5) as the electrolyte. The applied voltage was set at −30 kV. A solution of 5 mm ammonium acetate in 50% (v/v) methanol/water was delivered as the sheath liquid (21, 22). For nucleotides, separations were performed using a fused silica capillary and 50 mm ammonium acetate (pH 7.5) as the electrolyte. The capillary was pretreated for 20 min with 25 mm ammonium acetate, 75 mm sodium phosphate buffer (pH 7.5). The applied voltage was set at −30 kV. A solution of 50% (v/v) methanol/water was delivered as the sheath liquid. Pressure (50 mbar) was applied to the capillary inlet during the run (23). Electrospray ionization-TOFMS (ESI-TOFMS) was conducted in the positive ion mode (4000 V) for cationic metabolites, and the negative ion mode (3500 V) for anionic metabolites and nucleotides. Dry nitrogen gas was maintained at 10 p.s.i. Exact mass data were acquired over a 50–1000 m/z range (24, 25). Data analysis was performed using a differential visualization tool that can highlight differences in the metabolite composition of two or more complex samples (26). In some cases, metabolite quantification was performed using in-house software that detects peak features, performs migration time alignment, and peak area integration. Absolute quantification was performed using metabolite standards for calibration, when available.
CE-Q-TOFMS Conditions
The acquisition of MS/MS spectra was performed using a Q-star XL (Applied Biosystems) instrument. Most of the conditions were identical to those in anionic metabolite analysis using CE-TOFMS. ESI-Q-TOFMS was conducted in the negative product ion scan mode; the ion spray voltage was set at −4000 V. Dry air (GS1) was maintained at 30 p.s.i. The declustering potentials 1 and 2, and the collision energy voltage were set at −30, −15, and −15, or −10 V, respectively.
Bacterial Strains and Growth Conditions
E. coli K12 BW25113 (laboratory stock) was used as parental strain in this study. The empty plasmid pCA24N and the plasmid containing an insert encoding His-tagged YihU (JW3853) were obtained from the ASKA library (18). BW25113 was transformed with plasmid pCA24N or the yihU-containing plasmid, and the transformants were used for the experiment. The yihU knock-out strain was obtained from the Keio collection (27). E. coli was pre-cultured until mid-exponential phase in LB medium and an aliquot was inoculated into fresh LB followed by incubation at 37 °C with shaking. When the cells reached the mid-exponential phase (OD590 = 0.6), 0.5 mm isopropyl β-d-thiogalactopyranoside was added to induce yihU expression, and the culture was incubated at 37 °C until the stationary phase. At that point, 1-ml aliquots of the culture were incubated at 37 °C with or without 5 mm SSA (Sigma) for the indicated time period after which cells were collected to extract metabolites. For the experiments measuring resistance against SSA, cells were grown in LB medium at 37 °C to the mid to late exponential phase (OD590 = 1.0), then 1-ml aliquots of culture were treated with different concentrations of SSA and incubated for 1 h at room temperature. Cells were then washed twice with LB, and then spread onto LB plates to measure viable cells.
Metabolite Extraction
Samples for intracellular metabolite measurements were processed as described previously with the following modifications (21, 25). Briefly, the culture (OD590 × sampling volume (ml) of culture = 5) was filtrated under vacuum using a 0.4-μm pore size filter. Cells on the membrane filter were immediately washed with Milli-Q water to remove extracellular components, and then quickly immersed in 2 ml of methanol containing 2.5 μm each of the internal standards, methionine sulfone, MES, and d-camphor 10-sulfonic acid. Dishes containing filters were sonicated for 30 s to resuspend the cells. A 1.6-ml portion of the cell suspension was transferred to a tube, and mixed with an equal volume of chloroform and 640 μl of Milli-Q water. After vortexing and centrifugation, the aqueous layer was recovered and ultrafiltrated by centrifugation at 9100 × g using Amicon Ultrafree-MC ultrafilter devices (Millipore Co.). The filtrate was dried, and then dissolved in 25 μl of Milli-Q water before CE-TOFMS analysis.
RESULTS
Screening YihU for Enzymatic Activity by Metabolite Profiling
As reported previously (17), we have been screening multiple uncharacterized enzyme-like proteins using generic assays based on metabolite profiling to discover novel activities. The activity of one such candidate, the putative E. coli dehydrogenase YihU, was assayed using a complex metabolite mixture prepared from yeast extract supplemented with defined cofactors, in the presence or absence of YihU protein as described under “Experimental Procedures.” Following incubation, metabolites in the reaction mixture were profiled by CE-TOFMS. In this manner, we looked for metabolite level changes induced by YihU protein addition that can suggest the presence of enzymatic activity and reveal its substrates and products. Fig. 1 shows the anionic metabolite profiles obtained by CE-TOFMS analysis after in vitro reaction in the presence or absence of YihU protein. The levels of two anionic compounds (m/z 101.027 and 115.006) that were not prominent in the control reaction were found to significantly increase following incubation with YihU protein. These compounds were therefore candidates as products of the YihU enzymatic reaction. Increased levels of the anionic compounds were detected only in the presence of NAD+ or NADH, indicating that the reaction was NAD+/NADH-dependent and thus likely an oxidoreductase activity. There were no other significant changes in metabolite profiles of both cationic and anionic compounds beside noise-related false-positive signals (Fig. 1 and supplemental Fig. S1). In addition, there was no clear corresponding decrease in metabolite peaks that could have allowed to directly identify the potential substrate(s).
FIGURE 1.

Changes in the metabolite profiles during in vitro reaction with YihU. Two-dimensional density plots of anionic metabolite profiles obtained by CE-TOFMS analysis after in vitro reaction with (right panel) or without (left panel) the YihU protein. The color intensity on the maps represent total ion count according to the scale below. The inset in the upper right box of each panel is a magnified view of the area of the rectangle at the bottom left. Arrows mark metabolites whose level changed significantly in the reaction mixture containing YihU and are labeled with metabolite m/z.
We next attempted to identify the unknown anions (m/z 101.027 and 115.006) by comparing their accurate mass with the theoretical mass of compounds in the KEGG LIGAND data base (28). Among the resulting candidate compounds, those that were commercially available were analyzed by CE-TOFMS and CE-Q-TOFMS, and compared with the unknowns. The m/z ratio of one anion (m/z 101.027) was identical with that of SSA (within 1 ppm), whereas that of the other anion with m/z 115.006 corresponded with fumarate. There was perfect correspondence of CE migration times between the MERMAID reaction-produced unknowns and authentic standards (SSA and fumarate) when spiked into the MERMAID sample (supplemental Fig. S2, A and B). In addition, when the MS/MS spectrum of one of the anions (m/z 115) was compared with that of fumarate, the two showed clear similarities with two major product ions of m/z 59 and 71 (supplemental Fig. S2C). MS/MS spectral data for the m/z 101 anion could not be obtained due to its low abundance in the reaction mixture (<10 μm). However, both accurate mass and relative CE migration time (and MS/MS spectrum for the m/z 115 anion) strongly support the fact that SSA and fumarate were the two products specifically produced by the reaction catalyzed by YihU during MERMAID screening.
To further investigate the enzymatic activity of YihU protein and because no clear substrate candidates were found during screening, we used a defined reaction mixture composed of only the pairs of identified products (SSA-NADH or NAD+, fumarate-NADH or NAD+) as substrates for the reverse reaction with YihU. When SSA and NADH were used for the reaction, the NADH peak disappeared with a concomitant appearance of an anionic peak of m/z 103.041 and NAD+ (Fig. 2A), indicating a NADH-dependent reduction of SSA by YihU. Although SSA must have been consumed in the reaction, its corresponding peak intensity only marginally decreased, probably due to saturation of the mass detector signal at the high concentration (5 mm) of SSA used. When a similar reaction was performed with fumarate and NADH or NAD+, no clear changes in metabolite levels were observed. We also tested succinate as substrate because fumarate might be generated by NAD+-dependent oxidation of succinate, but no enzymatic reaction was observed under these conditions. This result suggests that in vitro production of fumarate requires other unknown component(s) or cofactor(s) that were present in the original metabolite mixture of yeast extract but remained undetectable by CE-TOFMS (either neutral compounds or compounds below the detection limit).
FIGURE 2.

Confirmation of in vitro enzymatic activity of YihU toward SSA by CE-TOFMS. A, selected ion electropherograms. Reactions were performed in MOPS buffer (pH 7.2) supplemented with salts and metals (“Experimental Procedures”) and using 5 mm SSA, 1 mm NADH, and YihU protein. Selected ion (anion) electropherograms show substrates (SSA and NADH) and products (unknown anion with m/z 103.04 and NAD+) of the reaction. Signals from each electropherogram are overlaid and show metabolites in the presence (red) and absence (blue) of YihU protein. B, proposed reaction catalyzed by YihU protein.
According to the BRENDA enzyme database (29), the NADH-dependent reduction of SSA by γ-hydroxybutyrate dehydrogenase (GHBDH; EC 1.1.1.61) generates GHB (Fig. 2B), a compound whose theoretical m/z value of 103.040 is in good agreement with the accurate mass of the unknown anion (m/z 103.041) measured by CE-TOFMS. We compared the profiles of the unknown anion with the GHB standard by CE-TOFMS and CE-Q-TOFMS analysis. There was perfect correspondence of CE migration time between the unknown anion and GHB when the latter was spiked into samples. The measured mass was within 1.1 ppm of that of GHB and the MS/MS spectrum of the unknown anion was nearly identical with that of GHB standard (Fig. 3). Moreover, the MS/MS fragmentation patterns of the GHB structural isomers, 2- and 3-hydroxybutyrate, were distinct from that of the unknown compound (supplemental Fig. S3). These results provide strong evidence that the unknown peak of m/z 103.041 is indeed GHB and therefore YihU is a novel E. coli GHBDH that can produce GHB from SSA.
FIGURE 3.

MS/MS spectra of GHB (upper panel) and an unknown anion (m/z 103.04) (lower panel) obtained by CE-Q-TOFMS. Numbers adjacent to each peak indicate m/z values of their respective ions.
Structural Homology Among E. coli β-Hydroxyisobutyrate Dehydrogenases and Arabidopsis GHBDH
Sequence analysis by BLAST (blastp) (30) using the full-length amino acid sequence of YihU as query showed that the sequence is similar to the structurally conserved β-hydroxyisobutyrate and 6-phosphogluconate dehydrogenases family of enzymes. The highest scoring sequences are uncharacterized proteins from closely related organisms, Shigella flexneri (100% identity), Salmonella sp. (85% similarity), other bacteria, and E. coli strains, which are most likely YihU orthologs. InterProScan (31) results with the YihU sequence showed that the protein comprises the characteristic NAD(P)-binding Rossmann-like domain of 6-phosphogluconate dehydrogenase (PF03446). Including YihU, E. coli K12 (W3110) contains a total of four proteins annotated as members of the β-hydroxyisobutyrate dehydrogenase family (GenoBase). Fig. 4 shows the alignment of YihU with the three E. coli β-hydroxyisobutyrate dehydrogenase paralogs (GarR, GlxR, and YgbJ) and GHBDH from A. thaliana. As can be seen, amino acid similarity between YihU and other proteins was found throughout the length of the proteins with especially well conserved stretches in the previously reported dinucleotide cofactor binding, substrate binding, and catalytic domains (5, 6) (Fig. 4).
FIGURE 4.

Amino acid sequence alignments of YihU (P0A9V8) and its β-hydroxyacid dehydrogenase paralogs in E. coli (P0ABQ2, P77161, and Q46888) and GHBDH in A. thaliana (Q94B07). All sequences were obtained from the UniProtKB/Swiss-Prot data base. Alignments were performed using the CLUSTALW (version 1.83) multiple sequence alignments using the default parameter through the DDBJ web interface. Residues conserved in at least four proteins are highlighted in red. Conserved domains associated with putative specific functions are indicated with thick black bars.
To further characterize YihU, its quaternary structure was analyzed by size exclusion chromatography. The protein eluted with an apparent native size of ∼143,000 (Kav value of 0.27) (supplemental Fig. S4). The monomeric molecular weight of YihU is predicted to be 31,154 as calculated from its amino acid sequence suggesting that the protein associates into a homotetramer, a common feature that was also observed for other β-hydroxyacid dehydrogenases in E. coli and Haemophilus influenzae (8).
Characterization of YihU Enzymatic Activity
The results of the original screening and subsequent confirmations suggested that YihU can catalyze the NADH-dependent reduction of SSA to GHB. To determine the substrate specificity of YihU and compare it with other members of the family, its enzymatic activity toward various metabolites was analyzed and contrasted with that of two of its E. coli paralogs, the tartronic semialdehyde reductases (GlxR and GarR; gene products of glxR (9) and garR/yhaE, respectively). NADH-dependent reductase activity was tested using several short chain aldehydes and keto acids. The kinetic parameters are shown in Table 1. YihU displayed ∼3-fold higher specific activity toward SSA compared with methylglyoxal. The specific reductase activities of GlxR and GarR on SSA were barely detectable, therefore, kinetic parameters were not obtained. No reductase activity was detected on other related compounds (glycolaldehyde, d-glyceraldehyde, methylbutanal, propanal, and ketogluconate), with any of the three enzymes. The cofactor and metal requirements of YihU reductase activity were examined using SSA. The NADH-dependent SSA reductase activity was 4-fold higher than that with NADPH (0.4 versus 0.1 μmol/min/mg). No significant differences in the activity were observed when using different divalent metals (Mg2+, Mn2+, Ca2+, Co2+, and Zn2+).
TABLE 1.
Kinetic parameters for purified YihU, GlxR, and GarR proteins
| Protein | Substratea | K m | Vmax |
|---|---|---|---|
| mm | μmol/min/mg | ||
| YihU | Succinic semialdehyde | 4.3 ± 1.2 | 0.20 ± 0.04 |
| Methylglyoxal | 9.0 ± 0.7 | 0.067 ± 0.002 | |
| γ-Hydroxybutyrate | 102 ± 7 | 0.062 ± 0.003 | |
| 3-Hydroxypropane sulfonate | 1.0 ± 0.2 | 9.0 ± 1.0 | |
| d-Glycerate | NDb | ND | |
| 3-Hydroxypropanoate | ND | ND | |
| GlxR | d-Glycerate | 0.53 ± 0.05 | 0.33 ± 0.04 |
| GarR | Methylglyoxal | 26 ± 2 | 0.08 ± 0.03 |
| d-Glycerate | 1.6 ± 0.5 | 3.0 ± 1.3 | |
| 3-Hydroxypropanoate | 7.6 ± 0.6 | 0.23 ± 0.02 |
aKm values for succinic semialdehyde and methylglyoxal were determined using 1 mmNADH and 1 mmNAD+for other substrates.
b ND, not detected.
We next assayed the NAD+-dependent oxidizing activities of the same proteins using several hydroxy acids (Table 1). Activity toward GHB was observed only in YihU, although the kinetic parameters indicated a rather low activity under the conditions used. GlxR showed high specificity toward d-glycerate, as previously reported (8). Although its enzymatic activity has not been confirmed experimentally, we found that GarR also showed high activity toward d-glycerate and a substrate specificity similar to GlxR. In contrast to GlxR and GarR, no significant NAD+-dependent oxidation of d-glycerate was observed with YihU. Among the other related and commercially available substrates tested (3-hydroxypropanoate, 2- and 3-hydroxybutyrate, 6-hydroxyheptanoate, 6-phosphogluconate, succinate, and 3-hydroxypropane sulfonic acid), YihU only exhibited NAD+-dependent oxidation of 3-hydroxypropane sulfonic acid although this compound is not a known cellular metabolite.
These results clearly demonstrate that YihU displays a characteristic NAD(H)-dependent oxidoreductase activity with a preference for SSA as substrate in the reductive direction. However, in the initial MERMAID screening, SSA was produced by the YihU reaction. This was probably the result of the reversed NAD+-dependent oxidation of GHB because of the relative lack of SSA in the original substrate mixture used. However, SSA accumulation remained rather low (<10 μm) under the conditions used.
Role of YihU in Resistance to SSA Toxicity
The apparent reversibility of the YihU-catalyzed in vitro enzymatic reaction suggests a possible physiological role related to the redox state of the cell. SSA is a reactive aldehyde (32) that can cause damage to cells (33). To test for a possible role of YihU in SSA detoxification in E. coli cells, we measured the effect of yihU deletion on E. coli survival following exposure to toxic levels of SSA. Fig. 5 shows the survival ratio of E. coli following treatment with SSA in the yihU knock-out and in the wild type strain. Cells in the yihU knock-out strain were more sensitive to exogenous SSA than wild type cells (Fig. 5). The reduced resistance to SSA in the yihU disruptant is in agreement with the proposed enzymatic activity of YihU toward SSA. This result suggests that YihU may play a role in the degradation of SSA under specific physiological conditions.
FIGURE 5.
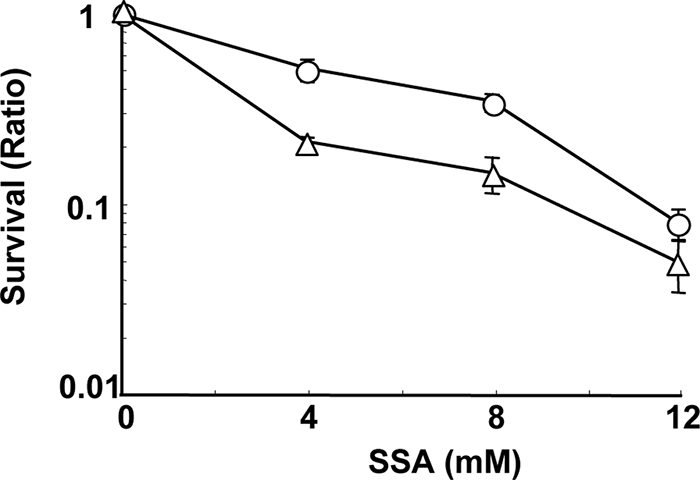
Survival of E. coli cells following exogenous SSA addition. Survival (ratio) indicates the ratio of colony forming unit of treated over untreated cells (0 mm). Plots indicate wild type strain (circles) and yihU knock-out strain (triangles), respectively. Values represent the average of three independent determinations and error bars indicate the mean ± S.E.
Support for the Existence of an Alternative SSA Degradation Pathway in E. coli
In E. coli, SSA is generated during glutamate and GABA metabolism via GABA transaminase (EC 2.6.1.19) (10) and normally further oxidized to succinate by SSA dehydrogenases (EC 1.2.1.16 and EC 1.2.1.24) (11, 12) before entering the tricarboxylic acid cycle (Fig. 6). An alternative SSA reductive pathway leading to its conversion to GHB via a GHBDH (EC 1.1.1.61) exists in animals (13), in some bacteria (15, 16, 34), and in plants (14). However this alternative route has not yet been reported in E. coli.
FIGURE 6.

Time course of intracellular metabolite levels in E. coli subjected to SSA treatment. Measurement of metabolites was performed by CE-TOFMS. The x axis and y axis indicate time (min) after SSA addition and metabolite level (nmol/OD/ml), respectively. The level of metabolite is displayed as amount of metabolite (nmol) in 1 ml of culture (OD590 = 1) and represents the difference between untreated and treated samples. The open and closed circles represent the control and YihU overproducing strain, respectively. The expected YihU reaction (EC 1.1.1.61) is highlighted by a shadowed box. The data shown are from a representative dataset from three independent experiments. The other two datasets are in supplemental Fig. S5.
As described above, we found that the activity of YihU is analogous to that of GHBDH. To explore the possibility of a similar alternative SSA catabolic route in E. coli, we examined the effect of exogenous SSA addition on intracellular metabolite levels in control (empty vector) and YihU overproducing (vector with yihU gene) stationary phase E. coli. The resulting metabolite profiles are shown in Fig. 6 and supplemental Fig. S5, whereas the results of t tests are in supplemental Table S1. The rapid responses to SSA addition were prominently observed in metabolites adjacent to SSA over the time period monitored. The intracellular levels of SSA and GHB increased rapidly after exogenous addition of SSA in both control and YihU overproducing strains. This increase in intracellular GHB level suggests that SSA was converted to GHB by GHBDH. Interestingly, the levels of succinate and its downstream metabolites in the tricarboxylic acid cycle such as fumarate and malate were not significantly changed after SSA treatment in either strain, suggesting that excess SSA was metabolized mainly through the alternative SSA metabolic pathway leading to GHB formation.
In the YihU overproducing strain, the accumulation of intracellular SSA over 30 min and GHB over the first 10 min was lower than that of the control strain (p < 0.05) (supplemental Table S1), suggesting rapid reduction of SSA by YihU and the possible existence of additional metabolic reactions downstream of GHB. The significant accumulation of GABA observed in response to SSA treatment in the control strain may reflect inhibition of GABA transaminase by its product, SSA. SSA is reported as a strong inhibitor of GABA transaminase in some organisms (35, 36). On the other hand, activation of glutamate decarboxylase (EC 4.1.1.15) is known to contribute to the acid stress response and may also be partially responsible for GABA accumulation (37). This phenomenon did not seem to occur to a significant extent in the YihU expressing strain probably due to faster conversion of SSA to GHB. In contrast, the levels of some amino acids decreased following SSA treatment in the control strain (Gln, Phe, and Tyr). These may represent secondary or indirect effects of SSA accumulation as suggested by the delayed responses (>5 min) in contrast to the more rapid changes in metabolites adjacent to SSA (GABA and GHB). Other metabolites such as His and Asp, also showed significant differences in the t test (supplemental Table S1), however, the mechanistic link between these responses and SSA treatment is not readily apparent.
Overall, the observed responses in metabolites following SSA treatment support the existence of an alternative SSA metabolic route leading to GHB formation via YihU in E. coli. Furthermore, the observed responses to YihU overproduction in E. coli cells together with the in vitro enzymatic activity results strongly suggest that YihU is a physiologically active SSA reductase.
DISCUSSION
In this study, we reported a novel biochemical and physiological function for the uncharacterized E. coli protein YihU. Screening using the MERMAID method suggested that YihU displays an oxidoreductase activity that was further characterized and found to correspond to that of the GHBDH. Our results further suggest that YihU can play an important role in preventing cellular damage resulting from SSA accumulation by reducing it to GHB.
Our screening method takes advantage of the CE-TOFMS ability to profile a large number of charged metabolites. In this study we did not extend our analysis to lipids or neutral compounds using alternative analytical methods such as LC-MS or GC-MS although it could be advantageous to do so to target a broader range of enzymes. However, neither the current experimental results, nor the sequence similarity of YihU with other enzymes suggest that high affinity substrates are likely to be found among non-polar metabolites. We also used a quick filtration and methanol-quenching method prior to intracellular metabolite extraction as previously optimized for CE-MS analysis (21). Although this method can reproducibly extract most metabolites in the central metabolic pathways, the level of some intermediates may be affected due to rapid intracellular turnover or leakage during the filtration/washing steps that are necessary to ensure reliable measurements by CE-MS. Recently, sampling procedures for microbial cell metabolome analysis have been developed and discussed (38–40). Quenching of the metabolism before filtration and analysis of both intracellular metabolites and culture media may offer promising solutions to some of these issues, but rigorous quantitative comparison of metabolites under different conditions (i.e. salt concentration), remains difficult. Despite efforts by many groups there is, to our knowledge, no processing/quenching method that does not result in some significant trade off. Improved solutions are important and challenging tasks for future developments in metabolomics. However, our conclusions, which are based on comparisons of metabolite levels between different treatments and strains, should not be affected by sample processing-related changes in absolute concentration.
Structural studies have shown that a serine residue at the active site of 6-phosphogluconate dehydrogenase is essential for 6-phosphogluconate binding (7). Interestingly, whereas this serine residue is conserved in all three YihU paralogs of E. coli and also in Arabidopsis GHBDH, a glycine residue is found at the same position in YihU. In contrast, in the highly conserved catalytic domain consensus sequence GXXGXGXXXKXXXN/Q, the lysine residue previously proposed as a key catalytic residue (7) is conserved in all aligned proteins including YihU. These findings suggest that YihU possesses a β-hydroxyacid dehydrogenase-like catalytic function, whereas its substrate specificity may differ due to the specific amino acid differences found in the substrate-binding domain. In fact, in vitro enzymatic activity assays have demonstrated that the YihU protein exhibits substrate specificity and characteristics that are distinct from its paralogs, GlxR and GarR, in agreement with the differences in conserved amino acid residues at the predicted substrate-binding site.
YihU displayed NADH-dependent SSA reductase activity, converting SSA to GHB. SSA is a key intermediate in the GABA metabolic pathway. Although the exact physiological function of this pathway is rather unclear in many organisms, a recent study demonstrated that SSA is a key signal that couples the stress response to quorum-sensing signal decay in bacteria (32). In Arabidopsis, GHB accumulates during oxygen deficiency and plays a role in oxidative stress tolerance (14). In animals, GHB is an important neuromodulator in the central nervous system (41). Although the exact physiological role of GHB in E. coli remains unclear, YihU may function under specific stress conditions that lead to accumulation of SSA. These may include the acid stress response, a phenomenon associated with the stationary phase of growth. Interestingly a well known mechanism employed to respond to acidification is via glutamate decarboxylase activity, which results in the capture of protons and the formation of GABA (37). It is therefore tempting to speculate that the observed changes in GABA levels are linked to this process. The levels of other metabolites may also have changed in a biologically meaningful way in response to SSA but the current results, using a limited number of replicates (n = 3), preclude further conclusions. However, the few statistically significant changes observed support the role of YihU in SSA metabolism and detoxification. SSA is also known to be oxidatively metabolized to succinate by SSA dehydrogenases encoded by gabD (10) and yneI genes (33) in E. coli. However, because YihU activity reduces SSA to GHB, whereas both gabD and yneI encode SSA dehydrogenases that oxidize it to succinate, it is likely that YihU functions under redox conditions that preclude oxidative SSA metabolism. This hypothesis is supported by the fact that in some plants SSA dehydrogenase activity appears dependent on the energy and NAD+/NADH redox state of the cell (42).
An operon that includes the yihU gene in Salmonella was previously suggested to be important for the formation of surface antigens and resistance to desiccation but its exact biochemical function has not been elucidated (43). The order and structure of genes around yihU are well conserved in enterobacteria (E. coli, Salmonella, and Shigella), and, at least in E. coli, yihU may be part of a transcription unit that includes the adjacent genes yihS and yihT (EcoCyc (44)). Moreover, yihU gene expression in E. coli appears to be rpoS-dependent according to the E. coli Gene Expression Data base of the University of Oklahoma. These findings suggest that YihU functions mainly at the stationary phase of growth when the cell faces specific physiological stresses linked to nutrient deprivation.
Methylglyoxal is another aldehyde that can be a substrate for YihU, albeit with lower affinity. Methylglyoxal is a highly toxic electrophile and is known to be produced by microorganisms including E. coli. Although the mechanism of its accumulation under various physiological conditions is still relatively unclear, the link between nutritional balance and methylglyoxal production in E. coli has been studied (45). These studies suggest that methylglyoxal accumulation may occur under nutritional stress. Similarly to what we found with SSA, E. coli cells overproducing YihU appear resistant to higher concentrations of methylglyoxal than wild type.3 Both GSH-dependent (46, 47) and -independent (48–51) pathways for methylglyoxal detoxification are known in E. coli. Although the enzymes involved in the GSH-dependent process are well characterized, some of those associated with the GSH-independent pathways are not well characterized and it is possible that YihU might also play a role in this pathway.
Finally, in anaerobic bacteria such as Clostridium sp., GABA is metabolized to butyrate via SSA, GHB, and various CoA-esters (52). The identification of other E. coli enzymes catalyzing such additional metabolic reactions downstream of GHB would clarify whether such a pathway is also active in E. coli. In conclusion, the main function of YihU in E. coli appears to be related to the catabolism of SSA and possibly other toxic aldehydes such as methylglyoxal produced following particular nutritional and energy/redox stresses.
Supplementary Material
Acknowledgments
We are grateful to Hirotada Mori and Kenji Nakahigashi for providing the E. coli strains of ASKA clones and Keio collection and Masahiro Sugimoto and Kosaku Shinoda for assistance in metabolome data analyses.
This work was supported by a grant-in-aid for scientific research from the Japan Society for the Promotion of Science (JSPS) (to M. R.) and research funds from the Yamagata prefectural government and Tsuruoka city.

The on-line version of this article (available at http://www.jbc.org) contains supplemental Figs. S1–S5 and Table S1.
N. Saito and M. Robert, unpublished data.
- GABA
- γ-aminobutyric acid
- GHB
- γ-hydroxybutyric acid
- SSA
- succinic semialdehyde
- CE-TOFMS
- capillary electrophoresis time-of-flight mass spectrometry
- MES
- 2-(N-morpholino)ethansulfonic acid
- MOPS
- 3-(N-morpholino)propanesulfonic acid
- GHBDH
- γ-hydroxybutyrate dehydrogenase
- ESI
- electrospray ionization.
REFERENCES
- 1.Rost B. ( 2002) J. Mol. Biol. 318, 595– 608 [DOI] [PubMed] [Google Scholar]
- 2.Tian W., Skolnick J. ( 2003) J. Mol. Biol. 333, 863– 882 [DOI] [PubMed] [Google Scholar]
- 3.Reed J. L., Vo T. D., Schilling C. H., Palsson B. O. ( 2003) Genome Biol. 4, R54. [DOI] [PMC free article] [PubMed] [Google Scholar]
- 4.Chen L., Vitkup D. ( 2007) Trends Biotechnol. 25, 343– 348 [DOI] [PubMed] [Google Scholar]
- 5.Hawes J. W., Harper E. T., Crabb D. W., Harris R. A. ( 1996) FEBS Lett. 389, 263– 267 [DOI] [PubMed] [Google Scholar]
- 6.Njau R. K., Herndon C. A., Hawes J. W. ( 2001) Chem. Biol. Interact. 130–132, 785– 791 [DOI] [PubMed] [Google Scholar]
- 7.Adams M. J., Ellis G. H., Gover S., Naylor C. E., Phillips C. ( 1994) Structure 2, 651– 668 [DOI] [PubMed] [Google Scholar]
- 8.Njau R. K., Herndon C. A., Hawes J. W. ( 2000) J. Biol. Chem. 275, 38780– 38786 [DOI] [PubMed] [Google Scholar]
- 9.Cusa E., Obradors N., Baldomà L., Badía J., Aguilar J. ( 1999) J. Bacteriol. 181, 7479– 7484 [DOI] [PMC free article] [PubMed] [Google Scholar]
- 10.Bartsch K., von Johnn-Marteville A., Schulz A. ( 1990) J. Bacteriol. 172, 7035– 7042 [DOI] [PMC free article] [PubMed] [Google Scholar]
- 11.Donnelly M. I., Cooper R. A. ( 1981) Eur. J. Biochem. 113, 555– 561 [DOI] [PubMed] [Google Scholar]
- 12.Marek L. E., Henson J. M. ( 1988) J. Bacteriol. 170, 991– 994 [DOI] [PMC free article] [PubMed] [Google Scholar]
- 13.Andriamampandry C., Siffert J. C., Schmitt M., Garnier J. M., Staub A., Muller C., Gobaille S., Mark J., Maitre M. ( 1998) Biochem. J. 334, 43– 50 [DOI] [PMC free article] [PubMed] [Google Scholar]
- 14.Breitkreuz K. E., Allan W. L., Van Cauwenberghe O. R., Jakobs C., Talibi D., Andre B., Shelp B. J. ( 2003) J. Biol. Chem. 278, 41552– 41556 [DOI] [PubMed] [Google Scholar]
- 15.Valentin H. E., Zwingmann G., Schönebaum A., Steinbüchel A. ( 1995) Eur. J. Biochem. 227, 43– 60 [DOI] [PubMed] [Google Scholar]
- 16.Wolff R. A., Kenealy W. R. ( 1995) Protein Expr. Purif. 6, 206– 212 [DOI] [PubMed] [Google Scholar]
- 17.Saito N., Robert M., Kitamura S., Baran R., Soga T., Mori H., Nishioka T., Tomita M. ( 2006) J. Proteome Res. 5, 1979– 1987 [DOI] [PubMed] [Google Scholar]
- 18.Kitagawa M., Ara T., Arifuzzaman M., Ioka-Nakamichi T., Inamoto E., Toyonaga H., Mori H. ( 2005) DNA Res. 12, 291– 299 [DOI] [PubMed] [Google Scholar]
- 19.Marvel C. S., Birkhimer E. R. ( 1929) J. Am. Chem. Soc. 51, 260– 262 [Google Scholar]
- 20.Soga T., Heiger D. N. ( 2000) Anal. Chem. 72, 1236– 1241 [DOI] [PubMed] [Google Scholar]
- 21.Soga T., Ohashi Y., Ueno Y., Naraoka H., Tomita M., Nishioka T. ( 2003) J. Proteome Res. 2, 488– 494 [DOI] [PubMed] [Google Scholar]
- 22.Soga T., Ueno Y., Naraoka H., Ohashi Y., Tomita M., Nishioka T. ( 2002) Anal. Chem. 74, 2233– 2239 [DOI] [PubMed] [Google Scholar]
- 23.Soga T., Ishikawa T., Igarashi S., Sugawara K., Kakazu Y., Tomita M. ( 2007) J. Chromatogr. A 1159, 125– 133 [DOI] [PubMed] [Google Scholar]
- 24.Soga T., Baran R., Suematsu M., Ueno Y., Ikeda S., Sakurakawa T., Kakazu Y., Ishikawa T., Robert M., Nishioka T., Tomita M. ( 2006) J. Biol. Chem. 281, 16768– 16776 [DOI] [PubMed] [Google Scholar]
- 25.Ohashi Y., Hirayama A., Ishikawa T., Nakamura S., Shimizu K., Ueno Y., Tomita M., Soga T. ( 2008) Mol. Biosyst. 4, 135– 147 [DOI] [PubMed] [Google Scholar]
- 26.Baran R., Kochi H., Saito N., Suematsu M., Soga T., Nishioka T., Robert M., Tomita M. ( 2006) BMC Bioinformatics 7, 530. [DOI] [PMC free article] [PubMed] [Google Scholar]
- 27.Baba T., Ara T., Hasegawa M., Takai Y., Okumura Y., Baba M., Datsenko K. A., Tomita M., Wanner B. L., Mori H. ( 2006) Mol. Syst. Biol. 2, 2006.0008 [DOI] [PMC free article] [PubMed] [Google Scholar]
- 28.Goto S., Okuno Y., Hattori M., Nishioka T., Kanehisa M. ( 2002) Nucleic Acids Res. 30, 402– 404 [DOI] [PMC free article] [PubMed] [Google Scholar]
- 29.Schomburg I., Chang A., Schomburg D. ( 2002) Nucleic Acids Res. 30, 47– 49 [DOI] [PMC free article] [PubMed] [Google Scholar]
- 30.Altschul S. F., Gish W., Miller W., Myers E. W., Lipman D. J. ( 1990) J. Mol. Biol. 215, 403– 410 [DOI] [PubMed] [Google Scholar]
- 31.Quevillon E., Silventoinen V., Pillai S., Harte N., Mulder N., Apweiler R., Lopez R. ( 2005) Nucleic Acids Res. 33, W116– 120 [DOI] [PMC free article] [PubMed] [Google Scholar]
- 32.Wang C., Zhang H. B., Wang L. H., Zhang L. H. ( 2006) Mol. Microbiol. 62, 45– 56 [DOI] [PubMed] [Google Scholar]
- 33.Fuhrer T., Chen L., Sauer U., Vitkup D. ( 2007) J. Bacteriol. 189, 8073– 8078 [DOI] [PMC free article] [PubMed] [Google Scholar]
- 34.Hardman J. K. ( 1962) Methods Enzymol. 5, 778– 783 [Google Scholar]
- 35.Maître M., Ciesielski L., Cash C., Mandel P. ( 1975) Eur. J. Biochem. 52, 157– 169 [DOI] [PubMed] [Google Scholar]
- 36.Van Cauwenberghe O. R., Shelp B. J. ( 1999) Phytochemistry 52, 575– 581 [Google Scholar]
- 37.De Biase D., Tramonti A., Bossa F., Visca P. ( 1999) Mol. Microbiol. 32, 1198– 1211 [DOI] [PubMed] [Google Scholar]
- 38.Schaub J., Schiesling C., Reuss M., Dauner M. ( 2006) Biotechnol. Prog. 22, 1434– 1442 [DOI] [PubMed] [Google Scholar]
- 39.van der Werf M. J., Overkamp K. M., Muilwijk B., Coulier L., Hankemeier T. ( 2007) Anal. Biochem. 370, 17– 25 [DOI] [PubMed] [Google Scholar]
- 40.Winder C. L., Dunn W. B., Schuler S., Broadhurst D., Jarvis R., Stephens G. M., Goodacre R. ( 2008) Anal. Chem. 80, 2939– 2948 [DOI] [PubMed] [Google Scholar]
- 41.Lettieri J. T., Fung H. L. ( 1979) J. Pharmacol. Exp. Ther. 208, 7– 11 [PubMed] [Google Scholar]
- 42.Busch K., Piehler J., Fromm H. ( 2000) Biochemistry 39, 10110– 10117 [DOI] [PubMed] [Google Scholar]
- 43.Gibson D. L., White A. P., Snyder S. D., Martin S., Heiss C., Azadi P., Surette M., Kay W. W. ( 2006) J. Bacteriol. 188, 7722– 7730 [DOI] [PMC free article] [PubMed] [Google Scholar]
- 44.Karp P. D., Riley M., Saier M., Paulsen I. T., Collado-Vides J., Paley S. M., Pellegrini-Toole A., Bonavides C., Gama-Castro S. ( 2002) Nucleic Acids Res. 30, 56– 58 [DOI] [PMC free article] [PubMed] [Google Scholar]
- 45.Tötemeyer S., Booth N. A., Nichols W. W., Dunbar B., Booth I. R. ( 1998) Mol. Microbiol. 27, 553– 562 [DOI] [PubMed] [Google Scholar]
- 46.Cooper R. A. ( 1984) Annu. Rev. Microbiol. 38, 49– 68 [DOI] [PubMed] [Google Scholar]
- 47.Ferguson G. P., Munro A. W., Douglas R. M., McLaggan D., Booth I. R. ( 1993) Mol. Microbiol. 9, 1297– 1303 [DOI] [PubMed] [Google Scholar]
- 48.Misra K., Banerjee A. B., Ray S., Ray M. ( 1995) Biochem. J. 305, 999– 1003 [DOI] [PMC free article] [PubMed] [Google Scholar]
- 49.Misra K., Banerjee A. B., Ray S., Ray M. ( 1996) Mol. Cell. Biochem. 156, 117– 124 [DOI] [PubMed] [Google Scholar]
- 50.Grant A. W., Steel G., Waugh H., Ellis E. M. ( 2003) FEMS Microbiol. Lett. 218, 93– 99 [DOI] [PubMed] [Google Scholar]
- 51.Ko J., Kim I., Yoo S., Min B., Kim K., Park C. ( 2005) J. Bacteriol. 187, 5782– 5789 [DOI] [PMC free article] [PubMed] [Google Scholar]
- 52.Gerhardt A., Cinkaya I., Linder D., Huisman G., Buckel W. ( 2000) Arch. Microbiol. 174, 189– 199 [DOI] [PubMed] [Google Scholar]
Associated Data
This section collects any data citations, data availability statements, or supplementary materials included in this article.