

Abstract
Mutations in the human bestrophin 1 (hBest1) chloride channel cause Best vitelliform macular dystrophy. Although mutations in its transmembrane domains were found to alter biophysical properties of the channel, the mechanism for disease-causing mutations in its N and C termini remains elusive. We hypothesized that these mutations lead to channel dysfunction through disruption of an N-C-terminal interaction. Here, we present data demonstrating that hBest1 N and C termini indeed interact both in vivo and in vitro. In addition, using a spectrum-based fluorescence resonance energy transfer method, we showed that functional hBest1 channels in the plasma membrane were multimers. Disease-causing mutations in the N terminus (R19C, R25C, and K30C) and the C terminus (G299E, D301N, and D312N) caused channel dysfunction and disruption of the N-C interaction. Consistent with the functional and biochemical results, mutants D301N and D312N clearly reduced fluorescence resonance energy transfer signal, indicating that the N-C interaction was indeed perturbed. These results suggest that hBest1 functions as a multimer in the plasma membrane, and disruption of the N-C interaction by mutations leads to hBest1 channel dysfunction.
Extensive evidence has shown that bestrophins are anion channels when expressed heterologously in cell lines (1–9) and represent a type of endogenous calcium-activated chlorine channel in several cell types (10–12). Mutations disrupting hBest1 channel function lead to Best vitelliform macular dystrophy (Best disease) (13). Bestrophin 1 channels have been reported to exist as oligomers (2, 14). Results from immunoprecipitation experiments suggested that hBest1 exists as tetramers or pentamers when expressed heterologously (2), whereas a hydrodynamic study based on the calculations of the molecular mass of the Best1-detergent complex concluded that native porcine Best1 channels are dimers (14). Besides the uncertainty about the subunit stoichiometry, it is still unclear how bestrophin subunits assemble and interact in functional channels.
Understanding how disease-causing mutations might adversely affect the assembly and interaction of bestrophin subunits is important for elucidating the molecular mechanism underlying the Best disease. The hBest1 protein contains six transmembrane domains (TMD1–6) with intracellularly located N and C termini. There are three “hot spots” of disease-causing mutations in hBest1: the N-terminal region, TMD2, and the C terminus proximal to TMD6 (13, 15). Multiple lines of evidence support that mutations in TMD2 alter the biophysical properties of the channel (3, 4, 7). How mutations distributed around the N- and C-terminal regions cause Best disease is less clear, although strong evidence recently suggested that certain mutations in the C terminus disrupt hBest1 channel gating by Ca2+ (16). N-C-terminal interaction of multimeric channels has been demonstrated to be involved in the activation of many channel types including inward rectifier K+ channels (17) and cyclic nucleotide-gated channels (18–20). In the present study we tested the hypothesis that an interaction between the N and C termini plays an important role in normal hBest1 channel function, and weakening or disruption of this interaction by mutations leads to channel dysfunction.
To test our hypothesis, we introduced disease-causing mutations into the N- or C-terminal regions of hBest1 expressed in HEK293 cells and tested the effects of mutations on subunit interaction and channel function with a combination of electrophysiological, biochemical, and optical methods. We found that these mutations not only disrupted channel function but also caused N- and C-terminal dissociation both in vitro and in vivo. The findings suggest a novel molecular mechanism for the mutations in hBest1 to cause human Best disease.
MATERIALS AND METHODS
Generation of Mutations in hBest1 and Heterologous Expression
hBest1 cDNA in pRK5 vectors was generously provided by Jeremy Nathans (John Hopkins University). For FRET measurements, hBest1 or its mutants were subcloned into pEYFP-N3 and pCerulean-N3 vectors (Clontech, Palo Alto, CA), respectively. Site-specific mutations in hBest1 were made using a PCR-based site-directed mutagenesis kit (QuikChange kit; Stratagene) as described previously (4). hBest1 wild type (WT),3 point mutants, or fluorescent-fused hBest1 cDNAs were transfected into HEK293 cells (ATCC, Manassas, VA) using FuGENE 6 transfection reagent (Roche Applied Science). pEGFP (Invitrogen) was co-transfected with nonfluorescent hBest1 wild type or mutants to identify successfully transfected cells. 0.6 μg of DNA was used to transfect one 35-mm culture dish. One day after transfection, the cells were trypsinized and replated on glass coverslips for electrophysiological recording and FRET. Single transfected cells were used for patch clamp experiments within 3 days after transfection.
Electrophysiology
Recordings were performed using whole cell recording configuration of the patch clamp (21). Patch pipettes were made with borosilicate glass (Sutter Instrument Co.), pulled by a Sutter P-2000 puller (Sutter Instrument Co.), and fire-polished. Patch pipettes had resistances of 2–3.5 MΩ. The bath was grounded via a 3 m KCl-agarose bridge connected to a Ag/AgCl reference electrode. Holding potential was 0 mV. Step voltages in 20-mV increments were applied between −100 and 100 mV with 1-s duration to record Cl− currents. The data were acquired by an Axopatch 200A amplifier controlled by Clampex 8.1 via a Digidata 1322A data acquisition system (Axon Instruments). The experiments were conducted at room temperature (23–25 °C). The standard pipette solution (high intracellular Ca2+ solution) contained 146 mm CsCl, 2 mm MgCl2, 5 mm Ca2+-EGTA, 10 mm HEPES, 10 mm sucrose, pH 7.3, adjusted with N-methyl-d-glucamine. The calculated Ca2+ concentration in the internal solution was 4.5 μm (4). The standard extracellular solution (150 mm Cl− solution) contained 140 mm NaCl, 4 mm KCl, 2 mm CaCl2, 1 mm MgCl2, 10 mm glucose, 10 mm HEPES, pH 7.3. with NaOH. This combination of solutions set the reversal potential, Erev, for chlorine currents to zero, whereas cation currents carried by Na+ or Cs+ had very positive or negative Erev, respectively. Extracellular Cl− was replaced on an equiosmolar basis with SO42− (100 mm Na2SO4, 1 mm CaCl2, 10 mm HEPES, pH 7.3), which is impermeant, to verify that the current was carried by Cl−. Voltage ramps from −100 to +100 mV were used for this purpose. Because the chlorine currents were time-independent, voltage ramps provided a reliable I-V relationship. For quantitative analysis and graphical presentation, we used OriginPro 7.0 software (Microcal). The data are presented as the means ± S.E.; statistic significance was analyzed with Student's t test.
Cell Surface Biotinylation
hBest1 WT or mutant-transfected and native HEK-293 cells were placed on ice, washed with PBS, and then biotinylated with 0.5 mg/ml Sulfo-NHS-LC Biotin (Pierce) in PBS for 30 min. The cells were washed with PBS and incubated in 100 mm glycine in PBS to quench free biotin for 30 min. After washing, the cells were scraped from the dish, collected by centrifugation, and suspended in ice-cold lysis buffer (150 mm NaCl, 5 mm EDTA, 50 mm HEPES, pH 7.4, 1% Triton X-100, 0.5% (v/v) protease inhibitor mixture III (Calbiochem), and 10 phenylmethylsulfonyl fluoride) 250 μl/100-mm dish. The extract was clarified at 10,000 × g for 15 min. Biotinylated proteins in supernatant were isolated by incubation of 200 μl of extract with 100 μl of streptavidin beads (Pierce) overnight with gentle agitation at 4 °C. The beads were collected by simple centrifugation and washed four times with 0.6 ml of lysis buffer plus 200 mm NaCl. The biotinylated proteins were eluted from beads with 200 μl of 2× Laemmli buffer and loaded onto an SDS-PAGE gel with ∼10 μl of protein supernatant/well. The separated proteins were transferred to nitrocellurose membrane for Western blotting. The immunoblots were probed with anti-Myc and anti-glyceraldehyde-3-phosphate dehydrogenase antibodies, followed by secondary anti-mouse IgG. Immunoreactive bands were visualized by enhanced chemiluminescence (ECL kit; Amersham Biosciences).
Co-immunoprecipitation and Western Blotting
The cDNA fragments encoding the N or C terminus of hBest1 were synthesized using the Pfu polymerase chain reaction with hBest1 cDNA as a template. The hBest1 N terminus (hBest1-N) was subcloned into pGEX-4T-3 vector (Amersham Biosciences) in which the N terminus was fused to GST. To express GST-hBest1-N protein, the vector was transformed into Escherichia coli BL21 cells (Amersham Biosciences), and the fusion protein synthesis was induced using 0.25 mm isopropyl β-d-thiogalactopyranoside (Amersham Biosciences) at 25–30 °C for 3–5 h. Bacteria were lysed in lysis buffer (150 mm NaCl, 10% glycerol, 50 mm Tris-HCl, pH 7.4, 1% Triton X-100, 1 mm dithiothreitol, 0.1 mm EDTA) containing protease inhibitors. Low Ca2+ lysis buffer included 5 mm EDTA, whereas high Ca2+ included 0.1 mm CaCl2. Solubilized proteins were collected as the supernatant of a 17,000 × g centrifugation. GST fusion proteins were purified with glutathionine-Sepharose beads (Amersham Biosciences). hBest1-C terminus carrying six Myc tags was subcloned into pcDNA3.1 and expressed in HEK293. The proteins were extracted with lysis buffer 48 h after transfection. Glutathionine-Sepharose beads that had been prelinked to GST fusion proteins were mixed with HEK cell extracts in lysis buffer and rotated at 4 °C for 2 h to allow protein-protein interaction. Similar amounts of GST fusion proteins were used for each assay. The beads were centrifuged at 2000 × g for 2 min and washed three times with lysis buffer. After a final wash, the beads were heated in sample buffer for SDS-PAGE, and unbound proteins were separated with 15% SDS-polyacrylamide gels (Bio-Rad). After transferring to a nitrocellurose membrane, hBest1-C was detected by an anti-Myc antibody (Invitrogen) followed by a secondary antibody, horseradish peroxidase-conjugated goat anti-mouse IgG (1/7,000) (Jackson ImmunoResearch Laboratories). Immunoreactive bands were visualized as described above.
Spectrum-based FRET Measurements
HEK293 cells were co-transfected with a C-terminal Cerulean fluorescent protein-tagged hBest1 construct (hBest1-CFP) and a C-terminal enhanced yellow fluorescent protein-tagged hBest1 construct (hBest1-YFP) using Lipofectamine 2000 (Invitrogen) according to the procedure recommended by the manufacturer. Fluorescence imaging was conducted at room temperature 1–2 days after transfection using a fully automated, inverted fluorescence microscope (Olympus IX-81). Two filter cubes (Chroma) were used to collect spectroscopic images from each cell (excitation, dichroic): Cube I, D436/20, 455dclp; Cube II, HQ500/20, Q515lp. Under our experimental conditions, autofluorescence from untransfected cells was negligible. Most transfected cells exhibited clear plasma membrane fluorescence. However, there were also strong intracellular fluorescence signals in these cells. Our study focused on the plasma membrane fluorescence using the following approach. Fluorescence emission was detected using a Hamamasu HQ CCD camera in conjunction with a spectrograph (Acton SpectraPro 2150i). The captured spectra images contained emissions from a thin section of the cell covered by the spectrograph input slit. Because fluorescence signals sampled along the slit represent different parts of the cell, the approach allowed selective analysis of FRET signals from functional channel proteins in the plasma membrane region (22, 23). Because the signal from fluorescently labeled channel proteins in the plasma membrane greatly exceeded the nonspecific background signal in the neighboring area, the fluorescence intensity represented predominately the functional channel proteins in the cell surface membrane. Emission spectra from these fluorescence signals were constructed and used for FRET analysis (22).
FRET efficiency was estimated from the enhanced acceptor (YFP) emission as previously described (24). Enhanced acceptor emission was quantified by comparing CFP-YFP cells to those expressing only YFP constructs, as shown in Fig. 5. The measured FRET efficiency, Eapp, was calculated as follows,
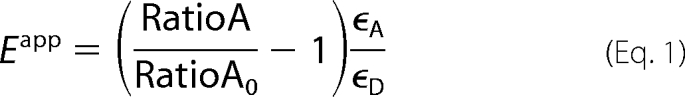 |
in which RatioA is the fluorescence intensity ratio of YFP excited at 436 and 500 nm from CFP+YFP samples, RatioA0 is the ratio from YFP-only samples, and ϵA and ϵD are extinction coefficient for YFP and CFP, respectively. We determined ϵA/ϵD at the CFP excitation wavelength (436 nm) from standard excitation spectra for CFP and YFP.
FIGURE 5.

Spectroscopic imaging of HEK cells expressing hBest1-CFP-D301N (A–C) and TRPV2-CFP (D–F) channels. A and D, fluorescence image of a cell expressing hBest1-CFP-D301N (A) and TRPV2-CFP (D). The box indicates the spectrograph input slit; only fluorescence signal within the box was collected. B and E, spectroscopic images from cells shown in A and D. The x axis represents wavelength, with low wavelength on the left. The y axis represents the cell position. The bright strips are fluorescence from the plasma membrane area, as indicated by the dashed arrow. The solid arrow in E indicates fluorescence signals from the intracellular area. C and F, CFP fluorescence emission spectra constructed from the membrane fluorescence (indicated by dashed arrows) in B and E.
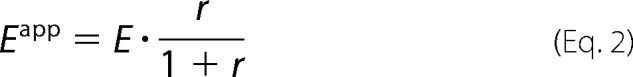
Because the random assembly of CFP- and YFP-labeled subunits yielded a mixture of all possible combinations of the fluorophores pairs, we fitted the distribution of measured FRET efficiency values from individual cells as a function of the CFP-to-YFP intensity ratio (FC/FY) with models specific for multisubunit protein complexes (25). The expression levels of CFP- and YFP-tagged constructs varied dramatically from cell to cell and yielded variable FC/FY, which appeared to be a general feature for expressing exogenous channel proteins through cell transfection (23, 25). Results from fits with a model based on dimeric channel complexes (23) are presented (see Fig. 7), although an alternative model based on tetrameric channel complexes (22) yielded a similar difference between the wild type and mutant channels. The dimer model is described by the following equations (25),
 |
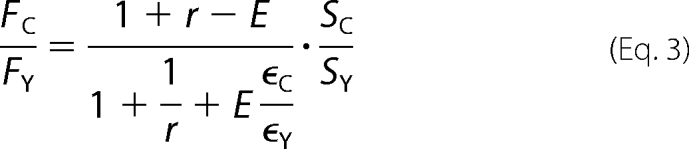 |
in which r is the relative expression level between CFP and YFP, E is the FRET efficiency, and SC and SY are system transfer functions for CFP and YFP, respectively (25). SC/SY can be determined from measurements of a donor-acceptor pair with a known E value or from a global fit of multiple datasets collected with the same recording system and the same fluorophores. When Equations 2 and 3 are combined, the unknown parameter r is cancelled, leaving E as the only unknown parameter. To estimate E, we incorporated equations 2 and 3 in Microsoft Excel and fitted our data sets by varying E to achieve minimum chi-square. For this approach, we have previously estimated that the confidence interval is about 5% (22).
FIGURE 7.

Mutations affect hBest1 intersubunit interaction mediated by the C terminus. FRET efficiency is plotted as a function of the fluorescence intensity ratio between CFP and YFP (FC/FY). Each symbol represents a measurement from an individual cell. Superimposed solid curves are fits with a FRET model based on dimeric channel complexes. A, positive FRET signals from cells co-expressing both wild type hBest1-CFP and hBest1-YFP. B, absence of FRET from cells co-expressing hBest1-CFP and TRPV2-YFP (negative control). C and D, reduced FRET observed from cells expressing hBest1-CFP-D301N + hBest1-YFP-D301N (C) or hBest1-CFP-D312N + hBest1-YFP-D312N (D). E, FRET signals between hBest1-YFP and hBest1-CFP-D312N. The dotted and dashed curves represent the levels of FRET signals observed in hBest1 WT channels and D312N channels, respectively.
RESULTS
Mutations in N and C Termini Disrupt hBest1 Chlorine Channel Function
In the N terminus of hBest1, Arg25 and Lys30 are well conserved among mammalian bestrophins. Disease-causing mutations have been found to occur in Arg25 (R25W or R25Q) and Lys30 (K30R). Our study focused on these two positively charged residues as well as Arg19, assuming that this charged residue may also be important for structural integrity of the channel protein. These residues were mutated individually into a cysteine. Consistent with the disease phenotypes, both R25C and K30C lost ∼95% of channel activities. (Fig. 1, C and F). hBest1-R19C mutant channels remained functional, but the current was dramatically reduced (Fig. 1, B and F). These results indicate that all three charged residues are important for hBest1 function.
FIGURE 1.

Effects of mutations in N and C termini on hBest1 chlorine channel function. hBest1 wild type (wt) or mutant cDNA was co-transfected with GFP into HEK293 cells. The green cells were selected for whole cell current recording (see “Materials and Methods” for details). A–D, representative whole cell currents expressed by wild type, R19C, R25C, or D312N mutant of hBest1 in HEK293 cells. Steady-state currents induced by step voltages were slightly outward rectifying with small time dependence. Cells transfected with GFP, K30C, G299E, or D301N mutants showed small currents (not shown) that were similar to R25C. E, dominant-negative inhibition of wild type hBest1 by G299E mutant. Currents of HEK cells transfected with wild type (wt) hBest1 (■), G299E mutant (▴), or WT plus G299E (▾) were induced by ramp voltage stimulations. D301N showed a similar effect. F, average of currents induced by WT hBest1 or N- or C-terminal mutants and co-expression of WT and C-terminal mutants. Whole cell currents at the end of the +100-mV step voltage were averaged and plotted versus membrane potentials. Compared with the wild type, all mutations and dominant-negative effects significantly inhibited hBest1 channel function (p < 0.01, n = 4–7).
In the C terminus, there is a highly conserved, highly charged acidic domain (297PFGEDDDDFE306) immediately after TMD6, the function of which has been long pursued (13). Recently, Xiao et al. (16) identified a C-terminal region of hBest1 (amino acids 312–323) as a putative Ca2+-binding loop (EF hand) that is involved in the gating of hBest1 by Ca2+; Ca2+ binding to this EF hand activates the channel in a process that requires the acidic domain (amino acids 293–308) and another regulatory domain (amino acids 350–390). In the present study we focused on disease-causing mutations either within the acidic domain, G299E and D301N, or the EF hand, D312N. We found that both G299E and D301N led to nonfunctional chlorine channels (Fig. 1). In addition, these point mutations dominant-negatively inhibited wild type hBest1 function. Mutation D312N led to lower channel activity (Fig. 1, D and F).
To test whether dysfunction of the mutant channels was due to trafficking defects, we conducted cell surface protein biotinylation test. We found that hBest1 channels with N-terminal R25C or K30C mutation trafficked to the membrane normally (Fig. 2). Our previous membrane biotinylation experiments also showed that the hBest1 proteins with C-terminal mutations were trafficked to the plasma membranes (26). In addition, fluorescently labeled mutant channels were also found to locate at the plasma membrane, as indicated by the fluorescence signal distribution (data not shown). Overall, these data suggest that the lack or reduction of channel current by the N- or C-terminal mutations was not due to a protein trafficking abnormality but due to disruption of channel function.
FIGURE 2.

Localization of hBest1 WT and N-terminal mutant proteins to the plasma membrane of HEK-293 cells. Biotinylated proteins extracted from nontransfected control cells (Con) and WT, R25C, or K30C mutant hBest1-transfected cells were purified with affinity streptavidin beads and subject to SDS-PAGE and Westerns. Proteins on immunoblots were probed with antibody to the Myc tag on hBest1 (68kD) (top panel) (see “Materials and Methods” for details). Biotinylated (middle panel) and total cellular proteins (bottom panel) were probed with antibody to glyceraldehyde-3-phosphate dehydrogenase (37 kDa). The immunoblots indicate that the intracellular proteins were not biotinylated.
An N-C-terminal Interaction in hBest1
Because N-C termini interactions are involved in activation of inward rectifier K+ channels and cyclic nucleotide-gated channels (17–20), the above results suggested to us that hBest1 N and C termini may associate during activation of the channel. To test the potential role N and C termini may play in intersubunit interaction in bestrophin channels, we synthesized and isolated N- and C-terminal proteins of hBest1. The N terminus segment (amino acids 1–30) was fused with GST at the N-terminal end (GST-N), whereas the C terminus segment (amino acids 292–586) was fused with a six-Myc tag at the C-terminal end (C-6×Myc). GST and GST-fused N-terminal proteins were synthesized and purified from E. coli. 6×Myc-fused C-terminal proteins were expressed in HEK293 cells (Fig. 3, A and B). Glutathione-agarose, which binds GST with high affinity, was used to pull down the GST-N proteins and proteins bound to it. Association of the C-terminal segment with the N-terminal segment was detected by an antibody against the 6×Myc tag in Western blot. Consistent with our hypothesis, hBest1 N and C termini did interact in vitro (Fig. 3C). In addition, we showed that the C terminus did not associate with Glutathione-agarose-GST complex, indicating that the interaction between GST-N and C-terminal was specific (Fig. 3, C and D). To our knowledge, this finding is the first direct demonstration of the hBest1 N-C-terminal interaction, indicating a possible functional role in hBest1.
FIGURE 3.

Interaction between GST-hBest1-N terminus and Myc-hBest1-C terminus. A, Coomassie-stained gel of GST or GST-fused hBest1-N-terminal proteins (expected molecular weights are indicated by asterisks). B, Western blot of Myc-fused hBest1-C-terminal proteins purified from HEK293 cells. 100 μg of total cell proteins extracted from HEK293 cells transfected with wild type or mutant hBest1 C termini were subject to SDS-PAGE and Western blotting. Myc-tagged proteins were detected by antibody to Myc. C, binding of hBest1 N- and C- terminal fusion proteins in the presence and absence of ∼100 μg of extracted proteins (B) from hBest1 wild type C terminus (292–586)-transfected HEK cells was mixed with GST or GST-N protein in the binding buffer with or without calcium added. The GST-bound proteins were subjected to Western blotting probed with antibody to Myc. The two lanes on the left show the amounts of the loaded extracts for GST binding reaction: 100 and 50 μg. D, disruption of N- and C-terminal interaction by mutations in N- or C terminus. As described in C, the proteins bound to GST or GST-N were detected with antibody to Myc.
The N-C Interaction Is Ca2+-independent
Because hBest1 activation is mediated by intracellular Ca2+ (2, 16, 27), we tested the hypothesis that Ca2+ might activate the channel via promoting the N-C interaction. However, the interaction was positively detected even in the absence of Ca2+ in the solutions (Fig. 3C). Therefore, the N-C association of hBest1 may not be mediated by channel Ca2+ sensing.
Disruption of the N-C Interaction by Disease-causing Mutations
Based on the results described above, we introduced mutations into the hBest1 N or C terminus and tested the effect of these mutations on the interaction between the two parts. For this purpose, we selected one mutation (R25C) in the N terminus and three mutations (G299E, D301E, or D312N) in the C terminus. As shown in Fig. 3D, the N-terminal R25C mutant (GST-N-R25C) did not bind to the wild type C terminus (C-6×Myc). In addition, none of the C-terminal segments containing G299E, D301E, or D312N mutant bound to the wild type N terminus (GST-N). The results demonstrated that the selected mutations in the N and C termini disrupted the interaction between the two counterparts and suggested that disruption of the N-C interaction underlies the mutation phenotypes.
Human Best1 Subunits Form Functional Multimers
To determine whether hBest-1 form functional multimers, we tested hBest-1 multimerization using a spectrum-based FRET method as previously described (25). For this purpose we constructed fusion constructs in which CFP or YFP was attached to either the N or C terminus of hBest1. However, we found that hBest1 constructs carrying a fluorescent protein at its N terminus lost chlorine channel function, even though the protein appeared to have normal cellular distribution (data not shown). For this reason, we focused on the two C-terminal hBest1 fusion constructs that did exhibit functional chlorine channel activities (Fig. 4) as well as strong plasma fluorescence (Fig. 5) when transfected into HEK293 cells, although hBest1-YFP had lower channel activity (Fig. 4). Fluorescent protein-fused D301N mutants also remained nonfunctional.
FIGURE 4.

Functional expression of hBest1 wild type or mutants fused with fluorescent proteins in HEK cells. See Fig. 1 legend for details. The patterns of steady-state current traces of the fluorescent protein-fused wild type (wt), D301N, and D312N mutants were similar to those of wild type, K25C, and D312N mutants, respectively, shown in Fig. 1 (n = 3–7).
Given that multiple hBest1 subunits associate to yield channel function, we predicted that the C-terminally attached CFP and YFP would be positioned close enough in the channel complex to generate FRET signals. To test this prediction, hBest1-CFP and hBest1-YFP were co-expressed, and the fluorescence emission was recorded from the plasma membrane region of individual cells (Fig. 5). Both CFP and YFP emissions were clearly observed from co-transfected cells (Fig. 6A). Using a standard CFP spectrum collected from a cell expressing only hBest1-CFP, we could extract the YFP emission from cells co-expressing hBest1-CFP and hBest1-YFP. To determine whether this YFP emission contained any FRET signal, the ratio between the extracted YFP signal and the total YFP emission upon direct excitation (Fig. 6B, left panel) was compared with a similar ratio between signals from cells expressing only hBest1-YFP (which should not contain any FRET) (Fig. 6B, right panel). Because the fluorescence ratio is independent of the expression level, the method allowed reliable comparison across cells with different expression levels. The extra YFP signal from the hBest1-CFP/hBest1-YFP co-expression cell indicated that FRET indeed occurred (Fig. 6B).
FIGURE 6.

Functional hBest1 channels are multi-subunit complexes. A, an example emission spectrum from a cell co-expressing hBest1-CFP and hBest1-YFP under CFP excitation. Superimposed are a scaled CFP standard spectrum and the extracted YFP emission. B, positive FRET signal from co-assembly of hBest1-CFP and hBest1-YFP subunits. The relative amplitude of YFP emission under CFP excitation (curve a) to the total YFP signal from the same cell under YFP excitation (curve b) (left panel), calculated as RatioA, is compared with that of a cell expressing only hBest1-YFP (right panel), calculated as RatioA0. The enhanced emission of YFP caused by FRET leads to a higher relative amplitude, as indicated in the left panel.
To more quantitatively study assembly between hBest1 subunits, the FRET efficiency value in individual cells was determined from the spectral information as previously described (24). The FRET efficiency values exhibited a positive correlation with the CFP-to-YFP intensity ratio measured from the same cells (Fig. 7). As discussed previously (25), this correlation is what is to be expected from random association between CFP- and YFP-tagged subunits and can be used to determine the FRET efficiency between CFP and YFP on neighboring subunits of the channel complex. Assessment of the FRET signal from hBest1-CFP/hBest1-YFP co-expressing cells with this approach yielded a FRET efficiency estimate of 36% (n = 28) (Fig. 7A). To confirm the formation of multi-subunit channel complex, we co-expressed hBest1-CFP with an unrelated membrane protein, the transient receptor potential channel vanilloid type 2, TRPV2, labeled with YFP (TRPV2-YFP) (Fig. 7B). No FRET was detected from these negative control cells (n = 44). We conclude that human bestrophin-1 functions as multimers in the plasma membrane.
hBest1 C-terminal Mutations Disrupt N-C Interaction
Using this FRET approach, we investigated how disease-causing mutations affect N-C termini interaction in functional channels. We introduced two mutations, D301N and D312N, into hBest-1 C terminus. hBest1-CFP-D312N was partially functional, whereas hBest1-CFP-D301N was nonfunctional in whole cell current configuration (Fig. 4). Because similar observations were made with channels without the fluorescent protein tag (Fig. 1B), these results further confirmed that the fluorescent tag did not interfere with normal channel assembly or function. Compared with the wild type hBest1, these mutants clearly exhibited reduced FRET signals (17% FRET efficiency for D301N, n = 33, Fig. 7C; 20% for D312N, n = 25, Fig. 7D). In these measurements, a difference of 5% is generally considered to be significant (22). The results thus indicate that the C termini to which CFP and YFP were attached became further apart in mutant channels. This finding is consistent with our results from functional recordings and biochemistry experiments, suggesting that when the N-C interaction was disrupted, the C termini were left in a more free state that negatively affected channel function.
hBest1 C-terminal Mutations Do Not Prevent Assembly with Wild Type Subunit
Although functional recordings suggested that subunits with C-terminal mutations could associate with wild type subunits to inhibit current, we further confirmed assembly between wild type and mutant subunits with FRET. When hBest1-YFP and hBest1-CFP-D312N were co-expressed, positive FRET signals were clearly observed. Interestingly, the estimated FRET efficiency, 28% (n = 41), is between those from the wild type channels and the D312N mutant channels (Fig. 7E). The intermediate FRET efficiency value is what to be expected because in the heteromeric channels, the N- and C-terminal of wild type subunits are able to interact, whereas those of the mutant subunit (and probably between wild type and mutant subunits) are not. In summary, our results suggest that wild type and D312N mutant subunits are able to co-assemble into functional channels, and the N-C-terminal interaction is indeed disrupted by mutations.
DISCUSSION
In summary, immunoprecipitation experiments demonstrated that the hBest1 N and C termini interacted in vitro. Disease-causing mutations in the N terminus (R19C, R25C, and K30C) and the C terminus (G299E, D301N, and D312N) led to channel dysfunction and disruption of the N-C interaction. Using a FRET method we showed that functional hBest1 channels in the plasma membrane are multimers. Consistent with the functional and biochemical results, mutants D301N and D312N clearly reduced FRET signal, indicating that the hBest1 N-C interaction was perturbed in vivo. These results suggest that hBest1 functions as multimers and that disruption of the N-C interaction by mutations leads to hBest1 channel dysfunction.
Functional Roles of N-C-terminal Interaction between hBest1 Channel Subunits
It has been presumed that bestrophin 1 channels are multimeric (2, 14). Our data from dominant-negative inhibition of hBest1 in HEK cells (Fig. 1) and from FRET measurements both support this conclusion. Although the data do not unequivocally distinguish between dimers and higher order multimers, we favor the latter over the former for the following reasons. In functional tests, wild type and mutated subunits were able to combine into heteromeric channels. Because of the dominant-negative effects of the mutations, these heteromeric channels are nonfunctional. Assuming random assembly between the wild type and mutant subunits, we should expect current reduction by 75%, if hBest1 exists as a dimer, because there is a 25% probability for two wild type subunits to form a functional channel. However, we observed a >90% loss of currents. The result is best explained if higher order multiples are formed.
Interestingly, whereas the N-C-terminal interaction strongly affects channel function, it appears that the interaction does little to affect subunit assembly. As discussed above, clearly wild type subunits and subunits with N- or C-terminal mutations were able to assemble. FRET results also indicate that mutations in C terminus do not disrupt the assembly of subunits. These results indicate that the association of TMDs between subunits mediates subunit assembly and keeps C termini close enough for energy transfer to occur. Existing evidence from biochemistry experiments indicate that C-terminal deletion or mutations such as G299E did not affect the multimerization of hBest1 subunits, suggesting that TMDs might be responsible for hBest1 subunit assembly (2). Putting these results together, we conclude that mutations in the N- and C-terminal regions disrupt an N-C-terminal interaction that is required for hBest1 function.
How Is Ca2+ Sensed by hBest1?
Like some other channels, activation of hBest1 is sensitive to Ca2+; the channel is activated by an increase in the intracellular Ca2+ concentration. In cyclic nucleotide-gated channels, calmodulin inhibits channel current by directly disrupting an N- and C-terminal interaction of adjacent subunits that exerts an auto-excitatory effect (19, 20). Because a calmodulin-binding consensus sequence is not found in hBest1 N or C terminus, it is likely that calmodulin does not mediate the Ca2+ sensitivity of hBest1. The highly conserved C-terminal motif 300EDDDDFE306 has been thought to play an important role in mediating Ca2+ sensitivity (13). Recently, it is reported that this region may serve as a Ca2+-binding site (16). Our mutation results are consistent with the finding and confirm the importance of this motif for hBest1 function. Surprisingly, the absence of Ca2+ did not affect the N- and C-terminal interaction in solution (Fig. 3C). Although it remains possible that channel activation by Ca2+ binding to the highly charged motif requires other parts of the channel protein, our results may suggest that Ca2+ sensing of hBest1 is mediated by a mechanism other than the N-C-terminal interaction. Although our results showed that Ca2+ did not mediate the N-C interaction, it remains possible that a normal N-C interaction is a prerequisite for Ca2+ sensing. Further investigation is needed to resolve the issue.
Mechanisms by Which hBest1 Mutations Cause the Best Disease
Mutations of hBest1 have been demonstrated to cause several ophthalmologic diseases including Best vitelliform macular dystrophy (Best disease) (13, 15). However, the mechanism by which the mutations cause dysfunction of hBest1 protein and lead to eye diseases remains controversial (13, 15, 28–30). Because bestrophins are found to possess chlorine channel function (2), the mechanism for Best disease has been considered to be a loss of chlorine channel function in retinal pigment epithelia when the channel protein is mutated. Consistent with this idea, a hallmark diagnostic feature of Best disease is the slow light peak reduction in electrooculogram (31), which is thought to reflect a decrease in the chlorine conductance in the basolateral membrane of the retinal pigment epithelia (32). Bestrophin 1 protein has been shown to be expressed in the basolateral membrane of retinal pigment epithelia (33). Recently we found that hBest1 has high HCO3− conductance (9). This suggests that disease-causing mutations may also alter HCO3− transport between photoreceptors and the choriocapillaris. However, hBest1 has also been suggested as a regulator of voltage-dependent calcium channels (28, 29, 34). The electrooculogram characteristics of the disease are thought to be due to the aberrant calcium channel activity in Best1 KO mice (29). When mutations occur in hBest1 proteins, the regulation of voltage-dependent calcium channels by hBest1 may be altered, leading to Best disease.
Understanding the structure and function of bestrophin 1 will help clarify the mechanism of Best disease. Because the disease-causing mutations occur in three hot spots that reside in different functional domains, we assume that they destroy the channel function by different mechanisms. In previous studies we have studied the mutations in mBest2 TMD2 systematically. We concluded that TMD2 contributes to the formation of the bestrophin channel pore and that mutations in TMD2 disturb channel function by disrupting the pore structure (3, 4, 7, 27). We also studied the effects of mutations between TMD2 and TMD5, but the mechanism remains unclear (9, 26). As for the mutations in the C terminus, a recent study strongly suggests that mutations in the C terminus disrupt hBest1 channel gating by affecting the interplay between intracellular Ca2+ and the gating machinery (16).
In this study, we demonstrated both in vitro and in vivo that mutations in N and C termini led to nonfunctional channels by causing the two termini to dissociate. Our results point to a mechanistic explanation of the disease phenotype caused by mutations in these regions. We propose that the N-C interaction is critical for hBest1 activation. Mutant channels with mutations occurring in N or C terminus, despite being able to assemble and traffic to the cell surface, cannot activate because of the disrupted N-C interaction.
Acknowledgment
We thank H. Criss Hartzell for critical comments on the manuscript.
This work was supported, in whole or in part, by National Institutes of Health Grant REY016754A (to J. Z.), GM60448, and EY014852. This work was also supported by an American Federation of Aging Research Award and a Qingdao University Faculty Grant (to Z. Q.), American Heart Association Grant 0665201Y (to J. Z.), and Research Facilities Improvement Program Grant C06-RR-12088-01 from the National Center for Research Resources.
- WT
- wild type
- FRET
- fluorescence resonance energy transfer
- PBS
- phosphate-buffered saline
- GST
- glutathione S-transferase
- GFP
- green fluorescent protein
- CFP
- cyan fluorescent protein
- YFP
- yellow fluorescent protein
- TMD
- transmembrane domain.
REFERENCES
- 1.Tsunenari T., Nathans J., Yau K. W. ( 2006) J.Gen. Physiol. 127, 749– 754 [DOI] [PMC free article] [PubMed] [Google Scholar]
- 2.Sun H., Tsunenari T., Yau K. W., Nathans J. ( 2002) Proc. Natl. Acad. Sci. U. S. A. 99, 4008– 4013 [DOI] [PMC free article] [PubMed] [Google Scholar]
- 3.Qu Z., Hartzell C. ( 2004) J. Gen. Physiol. 124, 371– 382 [DOI] [PMC free article] [PubMed] [Google Scholar]
- 4.Qu Z., Fischmeister R., Hartzell C. ( 2004) J. Gen. Physiol. 123, 327– 340 [DOI] [PMC free article] [PubMed] [Google Scholar]
- 5.Qu Z., Wei R. W., Mann W., Hartzell H. C. ( 2003) J. Biol. Chem. 278, 49563– 49572 [DOI] [PubMed] [Google Scholar]
- 6.Qu Z., Cui Y., Hartzell C. ( 2006) FEBS Lett. 580, 2141– 2146 [DOI] [PubMed] [Google Scholar]
- 7.Qu Z., Chien L. T., Cui Y., Hartzell H. C. ( 2006) J. Neurosci. 26, 5411– 5419 [DOI] [PMC free article] [PubMed] [Google Scholar]
- 8.Qu Z. Q., Yu K., Cui Y. Y., Ying C., Hartzell C. ( 2007) J. Biol. Chem. 282, 17460– 17467 [DOI] [PubMed] [Google Scholar]
- 9.Qu Z., Hartzell H. C. ( 2008) Am. J. Physiol. Cell Physiol 294, C1371– 1377 [DOI] [PMC free article] [PubMed] [Google Scholar]
- 10.Barro Soria R., Spitzner M., Schreiber R., Kunzelmann K. ( 2006) J. Biol. Chem. 281, 17460– 17467 [DOI] [PMC free article] [PubMed] [Google Scholar]
- 11.Chien L. T., Zhang Z. R., Hartzell H. C. ( 2006) J. Gen. Physiol. 128, 247– 259 [DOI] [PMC free article] [PubMed] [Google Scholar]
- 12.Pifferi S., Pascarella G., Boccaccio A., Mazzatenta A., Gustincich S., Menini A., Zucchelli S. ( 2006) Proc. Natl. Acad. Sci. U. S. A. 103, 12929– 12934 [DOI] [PMC free article] [PubMed] [Google Scholar]
- 13.Hartzell H. C., Qu Z., Yu K., Xiao Q., Chien L. T. ( 2008) Physiol. Rev. 88, 639– 672 [DOI] [PubMed] [Google Scholar]
- 14.Stanton J. B., Goldberg A. F., Hoppe G., Marmorstein L. Y., Marmorstein A. D. ( 2006) Biochim. Biophys. Acta 1758, 241– 247 [DOI] [PMC free article] [PubMed] [Google Scholar]
- 15.Hartzell C., Qu Z., Putzier I., Artinian L., Chien L. T., Cui Y. ( 2005) Physiology 20, 292– 302 [DOI] [PubMed] [Google Scholar]
- 16.Xiao Q., Prussia A., Yu K., Cui Y. Y., Hartzell H. C. ( 2008) J. Gen. Physiol. 132, 681– 692 [DOI] [PMC free article] [PubMed] [Google Scholar]
- 17.Qu Z., Yang Z., Cui N., Zhu G., Liu C., Xu H., Chanchevalap S., Shen W., Wu J., Li Y., Jiang C. ( 2000) J. Biol. Chem. 275, 31573– 31580 [DOI] [PubMed] [Google Scholar]
- 18.Varnum M. D., Zagotta W. N. ( 1997) Science 278, 110– 113 [DOI] [PubMed] [Google Scholar]
- 19.Zheng J., Varnum M. D., Zagotta W. N. ( 2003) J. Neurosci. 23, 8167– 8175 [DOI] [PMC free article] [PubMed] [Google Scholar]
- 20.Brady J. D., Rich E. D., Martens J. R., Karpen J. W., Varnum M. D., Brown R. L. ( 2006) Proc. Natl. Acad. Sci. U. S. A. 103, 15635– 15640 [DOI] [PMC free article] [PubMed] [Google Scholar]
- 21.Neher E. ( 1992) Science 256, 498– 502 [DOI] [PubMed] [Google Scholar]
- 22.Cheng W., Yang F., Takanishi C. L., Zheng J. ( 2007) J. Gen. Physiol. 129, 191– 207 [DOI] [PMC free article] [PubMed] [Google Scholar]
- 23.Bykova E. A., Zhang X. D., Chen T. Y., Zheng J. ( 2006) Nat. Struct. Mol. Biol. 13, 1115– 1119 [DOI] [PubMed] [Google Scholar]
- 24.Zheng J., Zagotta W. N. ( 2000) Neuron 28, 369– 374 [DOI] [PubMed] [Google Scholar]
- 25.Takanishi C. L., Bykova E. A., Cheng W., Zheng J. ( 2006) Brain Res. 1091, 132– 139 [DOI] [PubMed] [Google Scholar]
- 26.Yu K., Qu Z., Cui Y., Hartzell H. C. ( 2007) Investig. Ophthalmol. Vis. Sci. 48, 4694– 4705 [DOI] [PubMed] [Google Scholar]
- 27.Tsunenari T., Sun H., Williams J., Cahill H., Smallwood P., Yau K. W., Nathans J. ( 2003) J. Biol. Chem. 278, 41114– 41125 [DOI] [PMC free article] [PubMed] [Google Scholar]
- 28.Rosenthal R., Bakall B., Kinnick T., Peachey N., Wimmers S., Wadelius C., Marmorstein A., Strauss O. ( 2006) FASEB J. 20, 178– 180 [DOI] [PubMed] [Google Scholar]
- 29.Marmorstein L. Y., Wu J., McLaughlin P., Yocom J., Karl M. O., Neussert R., Wimmers S., Stanton J. B., Gregg R. G., Strauss O., Peachey N. S., Marmorstein A. D. ( 2006) J. Gen. Physiol. 127, 577– 589 [DOI] [PMC free article] [PubMed] [Google Scholar]
- 30.Marmorstein A. D., Kinnick T. R. ( 2007) Exp. Eye Res. 85, 423– 424 [DOI] [PMC free article] [PubMed] [Google Scholar]
- 31.Wajima R., Chater S. B., Katsumi O., Mehta M. C., Hirose T. ( 1993) Ophthalmologica 207, 174– 181 [DOI] [PubMed] [Google Scholar]
- 32.Gallemore R. P., Hughes B. A., ller S. S. ( 1997) Prog. Retinal Eye Res. 16, 509– 566 [Google Scholar]
- 33.Marmorstein A. D., Marmorstein L. Y., Rayborn M., Wang X., Hollyfield J. G., Petrukhin K. ( 2000) Proc. Natl. Acad. Sci. U. S. A. 97, 12758– 12763 [DOI] [PMC free article] [PubMed] [Google Scholar]
- 34.Yu K., Xiao Q., Cui G., Lee A., Hartzell H. C. ( 2008) J. Neurosci. 28, 5660– 5670 [DOI] [PMC free article] [PubMed] [Google Scholar]