

Abstract
We used spike-triggered current source-density analysis to examine axonal and postsynaptic currents generated in the visual cortex of awake rabbits by spontaneous spikes of individual sustained and transient dorsal lateral geniculate nucleus (LGNd) neurons. Using these data, we asked whether sustained/transient sensory responses are related to short-term synaptic dynamics at the thalamocortical synapse. Most sustained (34 of 40) and transient (24 of 25) neurons generated axonal and monosynaptic responses in layer 4 and/or 6 of the aligned cortical domain, with input from transient neurons arriving ∼0.3 ms earlier and 100–200 μm deeper. Postsynaptic cortical responses generated by both thalamic cell classes were reduced in amplitude after a preceding impulse and slowly recovered over a period of >750 ms. We interpret this to reflect interval-dependent recovery from chronic depression at the thalamocortical synapse, caused by significant spontaneous firing of LGNd cells (∼8 Hz). Surprisingly, postsynaptic cortical responses generated by spontaneous spikes of sustained thalamic neurons were more depressed than those of transient neurons. This difference was seen both in layers 4 and 6. The depression saturated rapidly with multiple preceding impulses, and postsynaptic responses generated by sustained neurons during maintained visual stimulation remained sufficiently robust to allow a sustained flow of information to the cortex. Our results indicate a relationship between the sensory response properties of thalamic neurons and the short-term dynamics of their synapses, and suggest that cortical recipients of sustained and transient thalamic inputs will differ considerably in their response modulation by prior impulse activity.
Keywords: thalamocortical, synaptic dynamics, synaptic depression, dorsal lateral geniculate nucleus (LGNd), striate cortex, synaptic plasticity, thalamus, visual
Introduction
Neocortical synapses display considerable diversity in their short-term dynamics, with some showing activity-dependent depression, others showing facilitation, and some showing very little activity-dependent variations. The synapses of thalamocortical neurons are known to depress, although there is considerable variability in the extent to which individual thalamocortical neurons depress (Gil et al., 1997; Swadlow et al., 2002). Although the mechanisms underlying synaptic depression/facilitation have been well explored (for review, see Zucker and Regehr, 2002), the functional significance of depressing or facilitating synapses in particular circuits remain elusive. A body of theoretical work has suggested that synaptic dynamics may shape the receptive field response dynamics of postsynaptic neurons, which are often highly nonlinear (Chance et al., 1998). One suggestion, based on in vitro studies in auditory cortex, maintains that transient responses may be supported by depressing synapses with initial high release probability and sustained responses may be supported by weakly or nondepressing synapses (Atzori et al., 2001). However, testing this idea requires a means for assessing both the receptive field responses of the presynaptic impulse train and the dynamics of the synapses that these impulses activate, assessments that are generally made in vivo and in vitro, respectively.
Here, we examine this idea in a very different system, the visual thalamocortical (TC) synapse of the awake rabbit. In the rabbit, as in other mammals, classes of concentrically organized retinal ganglion cells respond in a sustained or transient manner to maintained stimulation of the receptive field center (Caldwell and Daw, 1978), and the sustained/transient distinction is maintained at the level of the dorsal lateral geniculate nucleus (LGNd) (Cleland et al., 1971; Swadlow and Weyand, 1985; Van Hooser et al., 2003). First, we classified each LGNd neuron as sustained or transient using traditional receptive field analyses, and then we measured the dynamics of the synapses generated by each of these neurons using the method of spike-triggered current source-density (CSD) analysis. This approach enables assessment of monosynaptic currents generated by impulses of single presynaptic afferents to the topographically aligned region of cortex (Swadlow et al., 2002; Bereshpolova et al., 2006; Jin et al., 2008). We found that TC synapses of sustained and transient geniculocortical neurons generated monosynaptic currents that differed significantly in their dynamics and in their sublaminar organization within layer 4. However, we found that thalamocortical synapses of sustained neurons were more depressing (not less) than those of transient neurons. Despite the strong depression generated by sustained LGNd neurons, however, we show that synapses of these cells convey a very sustained flow of information to the visual cortex during prolonged sensory stimulation.
Materials and Methods
Extracellular recordings were obtained from the LGNd and from the retinotopically aligned region of V1 from two chronically prepared, adult Dutch-belted rabbits. Initial surgery was performed under anesthesia using aseptic procedures. Subsequent recordings were obtained in the awake state using procedures approved by the Institutional Animal Care and Use Committee at the University of Connecticut in accordance with National Institutes of Health guidelines. Methods used to ensure the comfort of our subjects have been described in detail previously (Swadlow et al., 2002). Rabbits were held snugly within a stocking and were placed on a rubber pad. The steel bar on the head was fastened to a restraining devise in a manner that minimized stress on the neck. Rabbits generally sat quietly for several hours of each recording session and were then returned to their home cage.
Physiological recordings
Spike data and cortical and hippocampal electroencephalographic (EEG) activity were acquired using a Plexon (Dallas, TX) data acquisition system. Thalamic microelectrodes were constructed of quartz-insulated, platinum-tungsten filaments (Reitboeck, 1983) (stock diameter, 40 μm), pulled to a taper and sharpened to a fine tip. A concentric array of seven such independently movable electrodes (∼150 μm spacing) was chronically implanted within the LGNd after retinotopic mapping (Swadlow et al., 2005). Electrodes were each under microdrive control and were guided within fine-diameter (150 μm outer diameter) stainless steel tubes. Recording sessions usually lasted 4–8 h, during which the presynaptic and postsynaptic impact of one or more LGNd neurons was thoroughly studied. Cortical field potential and multiunit recordings were obtained using 16-channel silicone probes (NeuroNexus Technologies, Ann Arbor, MI). Probe sites were separated vertically by 100 μm, had surface areas of 700 μm2, and had impedances of 0.3–0.8 MΩ. Spike data from the probe sites usually consisted of low-amplitude multi-unit activity, used for plotting receptive fields. Field potentials at each site were filtered at 2 Hz to 1.9 kHz (half-amplitude) and sampled continuously at 5 or 10 kHz. Recordings were obtained from monocular regions of V1 that lie within 10° of the visual streak [the visual horizon (Levick, 1967)]. A hippocampal electroencephalogram was recorded via platinum–iridium microwires.
The success of these experiments depended on achieving precise retinotopic alignment between the LGNd and V1 recording site. After obtaining stable recordings from one or more LGNd neurons, V1 was mapped using a finely tapered microelectrode (60 μm maximal diameter) until retinotopic alignment was achieved. This electrode was then replaced with the 16-channel probe. Simultaneous receptive field maps (below) were obtained from superficial and deep probe sites to estimate depth within the cortex and to assure that the probe sites were in retinotopic alignment. The dura was always left intact. In some penetrations, layer 6 probe sites were identified by antidromic activation of corticogeniculate neurons via microstimulation (<10 μA) via the LGNd electrodes (Swadlow et al., 2002).
Visual stimulation and receptive field measures
Corrective lenses were not used in these awake subjects (for discussion, see Bezdudnaya et al., 2006). Receptive fields were plotted simultaneously for the LGNd neurons under study and at the V1 probe sites. Receptive field mapping was accomplished using sparse noise stimulation consisting of small flashing light and dark stimuli presented on a 20 inch computer monitor (refresh rate, 100 Hz; mean luminance, 36 cd/m2). Stimuli consisted of high-contrast squares (0.5–2°) presented pseudorandomly, in a grid of 30 × 22. Each square was presented for either 10 or 20 ms. The size of each grid space was 1°, and the size of the squares was either 1 or 2°. Receptive fields were constructed using methods of reverse correlation (Jones and Palmer, 1987) and smoothed, and contour lines were fitted using bilinear interpolation. Receptive filed size was calculated as the number of grid spaces included within the 30% contour line of the maximum response. We have implemented a real-time version of this procedure that enables sensitive receptive fields in LGNd and layer 4 to be mapped very quickly. In a lighted environment, the eye of the rabbit is remarkably stable, usually remaining within a region of ±0.5° for periods of several minutes (Collewijn, 1977; Swadlow and Weyand, 1987). Because LGNd and cortical receptive fields are much larger than this (the smaller LGNd fields are ∼2° in diameter), and because they can usually be generated within 30–60 s of stimulation onset, eye movements did not present a problem. Each day, we plotted the receptive fields on each of the probe sites many times, and it was obvious when an eye movement had occurred (the same “smearing” of the receptive field could be seen at each of the probe sites). LGNd and cortical receptive fields were acquired and plotted simultaneously to assess retinotopic alignment.
The degree of receptive field overlap between LGNd and V1 sites was calculated by comparing the receptive fields of the LGNd neuron with the receptive field of the multiunit cortical response recorded on a cortical probe channel within layer 4. This site was 300 μm below the reversal point in currents generated from a brief full-field visual flash. Based on an analysis of microlesions made at fixed distances from this reversal point, we estimate this channel to be the middle of layer 4
The distinction between sustained and transient LGNd neurons
LGNd neurons were presented with a high-contrast, light or dark spot over the receptive field center and were classified as sustained or transient based on the resulting maintained discharge. The stimulus was presented for at least 0.5 s, the size of the spot was approximately the size of the receptive field center, and the contrast polarity (light or dark) was appropriate for the sign of the receptive field center (on or off). This test was always applied in the alert state because the maintained discharge of sustained LGNd neurons is sensitive to EEG state (Livingstone and Hubel, 1981; Swadlow and Weyand, 1985). We examined the response that occurred from 400 to 500 ms after stimulus onset and classified all cells that displayed an enhanced maintained discharge (above the prestimulus baseline) of >10 spikes/s as sustained and <10 spikes/s as transient [as described by Bezdudnaya et al. (2006)].
Spike-triggered CSD analyses
Depth profiles of the synaptic impact of LGNd impulses were generated using methods described previously (Swadlow and Gusev, 2000; Swadlow et al., 2002). Spike-triggered averages of the cortical field activity were generated from the “spontaneous” impulse activity of LGNd neurons. For the “control” record, we used all of the spikes in the data set except those that occurred within 5 ms of another spike. We eliminated LGNd spikes with short (<5 ms) interspike intervals to avoid generating compound averages from any high-frequency spikes. When examining the effects of preceding interspike interval on the spike-triggered potentials, we analyzed only those LGNd spikes that were (1) preceded by interspike intervals of a given value and (2) were not followed by another spike within 5 ms.
CSD profiles were generated from the field profiles according to the method described by Freeman and Nicholson (1975). First, we duplicated the uppermost and lowermost field trace (Vaknin et al., 1988), which converted our 16 recording channels to a total of 18 channels. Next, we smoothed (Freeman and Nicholson, 1975) to reduce high spatial-frequency noise components. This eliminated two of the 18 traces: Smoothing: , where φ is the field potentials, r is the coordinate perpendicular to the layers, and h is the sampling interval (100 μm).
Next, we calculated the second derivative, and this yielded a total of 14 traces: Second derivative: . In the CSD profiles, current sinks are indicated by downward deflections and sources are indicated by upward deflections. To facilitate visualization of CSD profiles, we generated color image plots. These were plotted by linear interpolation along the depth axis, with red and blue representing current sinks and sources, respectively. Green is approximately zero, normalized to the 1 ms period before the thalamic spike.
Two conditions had to be met before an LGNd neuron was considered to have generated a postsynaptic impact in either layer 4 or 6: (1) the response had to be preceded by a clear axon terminal response ≥1 μV in amplitude; and (2) the response had to follow this axonal component by <1 ms and consist of a sharp negativity in the spike-triggered record. In all cases, we ensured that this same sequence of events (including latency measures) was repeatable, based on at least two separate trains of LGNd spikes.
The peak amplitude of the postsynaptic response was measured only during the initial 1 ms, to avoid the possibility of including disynaptic currents. For a number of reasons, we are confident that the presynaptic and postsynaptic responses measured reflect the activity of a single LGNd neuron, and not the correlated activity of several LGNd neurons. (1) The rise times of the axonal and postsynaptic events were extremely brief (axonal field potential, 0.22.ms; postsynaptic rise time, 0.46 ms), and closely neighboring LGNd neurons differed considerably in axonal conduction times (range up to 1.2 ms for neighboring pairs, recorded simultaneously on the same electrode). Together, these factors would generate considerable temporal blurring of the cortical responses if neighboring LGNd neurons were firing in precise synchrony. (2) Even “precise synchrony” of thalamic neurons (Alonso et al., 1996) occurs over a scale of ±1 ms, and this would introduce additional temporal blurring in this response if thalamic synchrony had contributed significantly. (3) Marked differences between neighboring LGNd neurons were also seen in the depth distribution of axonal and postsynaptic responses, and this, too, would be blurred if synchronous firing were a strong contributing factor. (4) Our data were obtained under conditions of spontaneous impulse activity, in which the potential for stimulus-generated synchrony is minimized. (5) Finally, we have observed no precise synchrony (±1 ms) in the spike trains of pairs of LGNd neurons with highly overlapping receptive fields.
When the analysis of an LGNd neuron was complete, we examined depth profiles within V1 that were generated by brief, full-field visual flashes. These depth profiles, combined with microlesions at selected channels of the probes, provided a useful depth reference for the low-amplitude field potentials and synaptic currents generated by each of the LGNd neurons studied.
The samples studied
The overall sample.
Retinotopic alignment of LGNd and V1 recording sites was crucial for these experiments, and all of the LGNd neurons that we included were required to have a receptive field center that overlapped, to some degree, with the multiunit receptive fields recorded on cortical probe sites within layer 4. LGNd neurons from the overall sample that generated a postsynaptic impact within layer 4 (as defined above) were used to examine the latency and time course of axonal and postsynaptic responses generated by sustained and transient LGNd afferents to V1 and depth of the responses in V1 (see Fig. 2). Three subsamples, used for different analyses, were drawn from the overall sample, and these are described in Table 1 and in supplemental Fig. 3 (available at www.jneurosci.org as supplemental material). LGD neurons in subsample A were selected based on a criterion of very precise retinotopic alignment, whereas those in subsamples B and C were selected based on the presence/strength of their postsynaptic impact.
Figure 2.
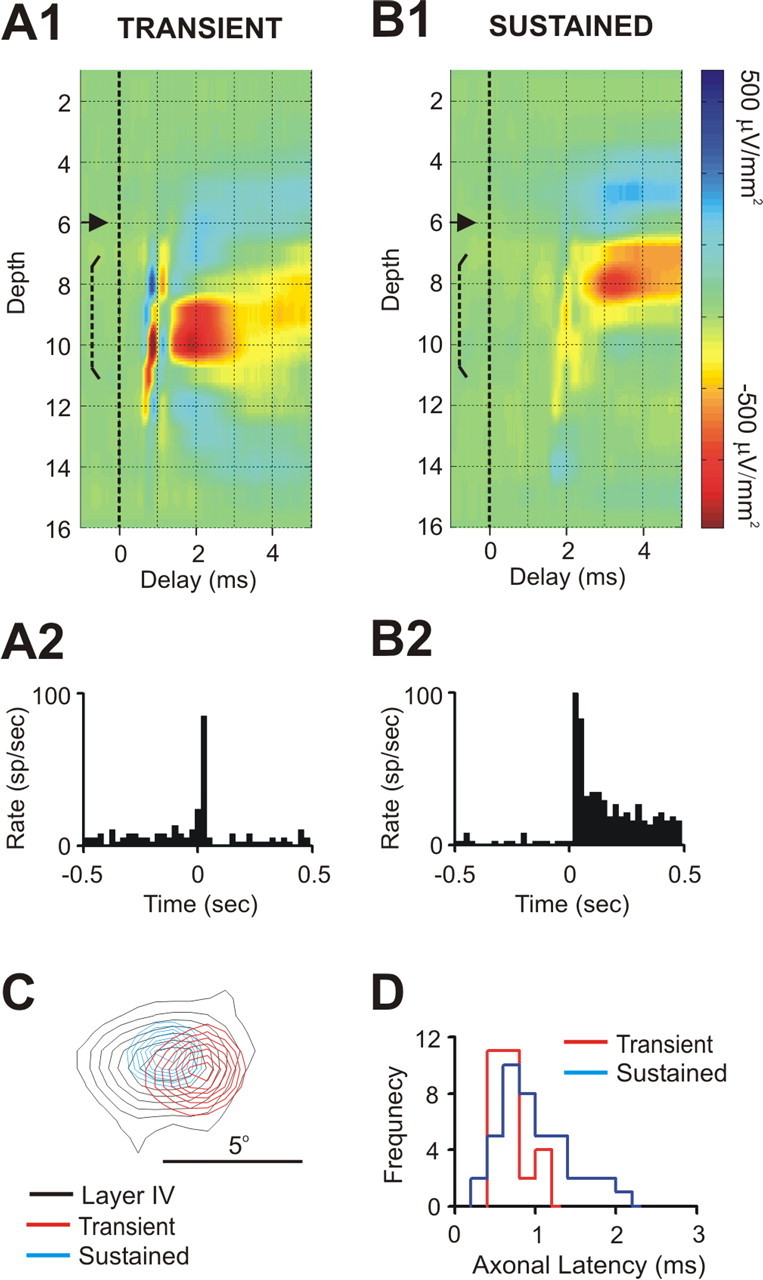
Laminar profile of postsynaptic impact and thalamocortical axonal latency are related to the sustained/transient distinction. A1, B1, Depth profiles of spike-triggered CSDs from a transient (A1) and sustained (B1) LGNd cell. These cells were simultaneously studied, and both provided a monosynaptic input to V1 that was recorded on the same 16-channel probe. Note the shorter latency of the transient cell that generated a postsynaptic response deep within layer 4 compared with the sustained cell that generated a response more superficially. A2, B2, Poststimulus time histograms from these LGNd cells resulting from maintained stimulation of their receptive field centers. C, The receptive fields of both the sustained (blue) and transient (red) neuron were very well aligned with the cortical probe (black). D, The frequency distribution of axonal latencies for both sustained (blue) and transient (red) neurons from subsample A.
Table 1.
Summary of sustained and transient cells for each sample studied
| Sustained | Transient | Total | |
|---|---|---|---|
| Overall sample | |||
| No synaptic impact | 9 | 1 | 10 |
| Layer 4 only | 37 | 25 | 62 |
| Layers 4 and 6 | 5 | 3 | 8 |
| Layer 6 only | 1 | 0 | 1 |
| Totals | 52 | 29 | 81 |
| Subsample A | |||
| No synaptic impact | 6 | 1 | 7 |
| Layer 4 only | 28 | 21 | 49 |
| Layers 4 and 6 | 5 | 3 | 8 |
| Layer 6 only | 1 | 0 | 1 |
| Totals | 40 | 25 | 65 |
| Subsample B | 17 | 17 | 34 |
| Subsample C | 10 | 9 | 19 |
The numbers of cells generating a postsynaptic response, in particular cortical layers, is provided for sustained and transient cells from the overall sample and for subsample A. Note that the three subsamples were drawn from the overall sample and were not mutually exclusive. The motivation and criteria for selection of these three subsamples is described in Materials and Methods.
Subsample A.
For some analyses, noted in the text, we required the retinotopic alignment of the center of the LGNd and cortical fields to be aligned within 50% of the diameter of the LGNd receptive field. This requirement for retinotopic precision was even more stringent than that described for the overall sample (above), and we refer to these cases as being very well aligned. There was no requirement for cells in subsample A to generate a postsynaptic cortical impact. Indeed, the cells in this subsample were used for statistics concerning the proportion of sustained and transient populations that did generate a postsynaptic impact within layers 4 and 6. Those LGNd cells in subsample A that did generate a synaptic impact within layer 4 were used for comparing the amplitude of these responses.
Subsamples B and C.
Unlike the cells in subsample A, LGNd cells in subsamples B and C had no requirement of retinotopic alignment beyond that of our overall sample. However, LGNd cells in these subsamples were required to have generated a postsynaptic impact in the cortex (as defined above).
Subsample B was used for most analyses of synaptic dynamics (in which the spikes were segregated into four bins, based on preceding interspike interval) (see Figs. 3, 4, 6). Here, we included only those cells from the overall sample that generated a postsynaptic response (as defined above) at each of the four interval-bins tested. Because LGNd neurons in awake rabbits generally fire spontaneously at rates of 4–10 per second, relatively few spikes occur at the longest interspike intervals tested (>500 ms), and lengthy spontaneous spike trains were required to obtain sufficient spikes at the longest intervals (for these cases, a mean of 22,000 spikes was collected from each LGNd neuron).
Figure 3.
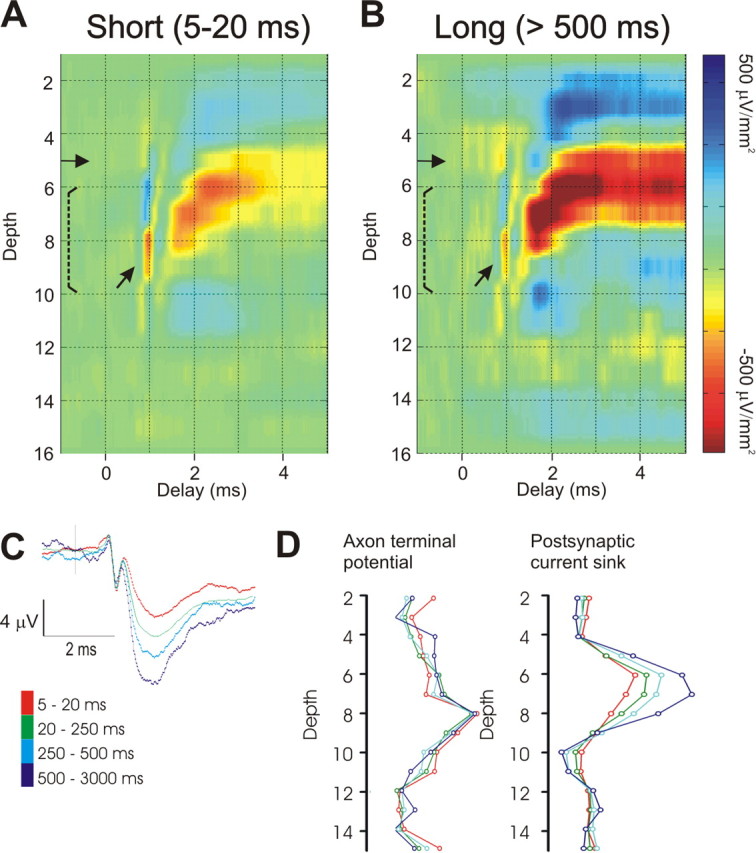
The postsynaptic response of thalamocortical neurons depends on the preceding interspike interval. CSD profiles generated by selected spikes of the same LGNd neuron presented in Figure 1. A, The left profiles were generated by LGNd spikes with preceding interspike intervals of 5–20 ms (n = 5390 spikes). B, Profiles on the right were generated by LGNd spikes with preceding interspike intervals of 500–3000 ms (n = 1087 spikes). Gain settings and color intensities for both CSD profiles are identical. Note that the postsynaptic response but not the axonal response (arrow) is greatly reduced at the shorter interval. C, The spike-triggered field potential from the peak channel generated from selected spikes with different preceding interspike intervals. D, The amplitude of the axon terminal response (left) and the amplitude of the initial 1 ms of the postsynaptic current sink (right) plotted through the depth of the cortex for different preceding interspike intervals.
Figure 4.

The interval-dependent reduction in postsynaptic response is greater for sustained than transient neurons. For sustained (open bars) and transient (filled bars) cells, the postsynaptic currents generated within layer 4 by spikes with short preceding interspike intervals (5–20 ms) were compared with the responses generated by spikes with long preceding intervals (500–3000 ms; shown as a reduction percentage).
Figure 6.

Interval dependent in postsynaptic response in layer 6. For four sustained (blue) and two transient (red), the postsynaptic currents generated within layer 6 were calculated from thalamic spikes with preceding intervals of 5–20 ms, 20–250 ms, 250–500 ms, or 500–3000 ms. Amplitude values were normalized against the values generated by spikes with the longest (500–3000). As is seen in layer 4, after short preceding intervals, the postsynaptic responses in layer 6 are more strongly reduced in sustained neurons than in transient neurons.
Subsample C was used for analyzing the time course of synaptic dynamics, in which spikes were subdivided to an even greater extent (see Fig. 5). Here, there were nine interval bins (rather than four, as in subsample B). In addition, subsample C was further restricted to those LGNd neurons that generated a strong synaptic impact within layer 4 of V1 (>300 μV/mm2, based on the entire spike train). This cutoff value was somewhat greater than the mean amplitude for the cells in subsample A (and for cells in our overall sample) (supplemental Fig. 3, available at www.jneurosci.org as supplemental material). The subdivision of the spike train into nine interval bins, the rarity of spikes occurring at the longest interval value (in this case, >750 ms), and the need to accurately monitor small differences in response amplitude for this time course analysis motivated the restriction of this sample to large-amplitude responses that were well above the noise level.
Figure 5.

Temporal dynamics of synaptic depression in sustained versus transient inputs to visual cortex. The degree of reduction in the postsynaptic responses generated by spikes with differing preceding intervals for sustained and transient populations, shown as a percentage of those resulting from spikes with very long preceding intervals (>750 ms). Error bars show ±SEM; each asterisk indicates an interval bin in which the two classes significantly differed at a p < 0.05. The gray line shows the percentage of the total spike train contributing to each bin. Typically, <3% on the total spike train had interspike intervals >750 ms (indicated by the horizontal gray dashed line).
Results
The impact of an LGNd impulse on the visual cortex
We recorded from 81 LGNd concentric neurons with receptive fields that had some degree of overlap with the multiunit receptive field of layer 4 (our overall sample). These cells were obtained from two rabbits (49 in one and 32 in the other). We also recorded from two directionally selective LGNd neurons, both of which generated a synaptic impact with in layer 4, but these data are not further described here. Concentric neurons were classified as sustained (n = 52) or transient (n = 29), based on their response to a maintained stimulus of appropriate contrast over the receptive field center (supplemental Fig. 1). In the LGNd, sustained responding to standing contrast is highly dependent on an alert state (Swadlow and Weyand, 1985; Bezdudnaya et al., 2006), and tests used to differentiate sustained versus. transient neurons were always done under conditions of EEG arousal (see Materials and Methods). Forty-four percent of the sustained cells, and 62% of transient neurons were on-centered, with the remainder being off-centered.
Extracellular spike trains were recorded from LGNd neurons, and spike-triggered field potentials were recorded through the layers of the retinotopically aligned region of V1 (Fig. 1A). These data were obtained from a sustained LGNd neuron, where the PSTH of the response showed a prolonged response to maintained stimulation of the receptive field center (Fig. 1B) and the cortical probe was well aligned with the receptive field of the LGNd neuron. In this case, the center of the LGNd receptive field was slightly displaced from the center of the cortical field in layer 4 (Fig. 1C), by ∼ 30% of the diameter of the LGNd receptive field center. The degree of such retinotopic misalignment with the center of the cortical field was similar for the 81 LGNd neurons that we study here, and was very similar for sustained and transient neurons (mean separation = 39 and 28% of the LGNd receptive field diameter for sustained and transient populations, respectively). The spike-triggered field potential generated by this LGNd neuron (Fig. 1D) (and by most LGNd neurons) within layer 4 could be readily divided into two components: (1) a short-latency, short duration (rise time = 0.21 ms sustained and 0.24 ms for transient, duration 0.72 and 0.75 ms, respectively), biphasic or triphasic response (usually initially positive-going) reflecting invasion of the presynaptic impulse into the axon terminal arborization [the axon terminal potential (Swadlow and Gusev, 2000)] (Fig. 1D, top arrow). (2) Following the onset of the axonal potential by <1 ms, a fast-rising negative-going potential (10–90% rise time = 0.47 ms for sustained, 0.43 for transient) occurs, reflecting a focal monosynaptic depolarization (Swadlow and Gusev, 2000; Swadlow et al., 2002; Bereshpolova et al., 2006) (Fig. 1D, bottom arrow). Figure 1E shows the depth profile of the spike-triggered field potentials generated by this LGNd neuron, and F shows the CSD of these profiles. A colorized version of the CSD profile is shown in Figure 1G, where red reflects inward currents (sinks) and blue reflects current sources. Notably, these spatiotemporal profiles of axonal and synaptic currents generated by spontaneous LGNd impulses were highly specific for individual LGNd neurons and were very repeatable over time (supplemental Fig. 2, available at www.jneurosci.org as supplemental material).
Figure 1.

The method. A, Extracellular recordings were obtained from one or more LGNd neurons in awake rabbits. Field potentials were recorded from the retinotopically aligned region of V1 using a 16-channel silicone probe (vertical spacing, 100 μm). B, LGNd neurons were identified as sustained or transient based on the poststimulus time histogram (PSTH) generated by a light or dark spot over the receptive field center. The PSTH of a sustained LGNd neuron after a 1 s presentation of a white spot over its receptive field center is shown. C, Receptive fields were mapped with sparse noise, and retinotopic alignment of LGNd (blue) with a layer 4 cortical site (black) was quantified (in this case, sites were misaligned by approximately one-third of the LGNd receptive field center diameter). D, A spike-triggered average of the field potential elicited from one of the cortical sites in layer 4 (channel 7 in E), showing the axon terminal potential and the postsynaptic response. E, F, Depth profiles of the spike-triggered field potentials were examined on all cortical recording sites (E), and the CSD depth profile of these averages was derived (F). These spike-triggered field and CSD profiles were based on all of the spikes generated by this LGNd neuron (>42,000). G, A color map of the spike-triggered CSD from F. In this and in subsequent figures, the solid horizontal arrows in CSD tracings indicate the channel that corresponded to the reversal point of the field potential generated by a diffuse flash stimulus. Brackets indicate our estimate of the upper and lower boundaries of layer 4 (see Materials and Methods).
Seventy of the 81 LGNd neurons in our overall sample generated a presynaptic and postsynaptic response in layer 4. A summary of the number of cells recorded that projected to layer 4 and/or 6 is provided in Table 1, and the mean and range of the postsynaptic response amplitudes and retinotopic alignment values for each sample studied are illustrated in supplemental Fig. 3 (available at www.jneurosci.org as supplemental material). Sustained cells generated a synaptic impact within layer 4 that was superficial to that generated by transient neurons. In nine especially informative cases, a sustained and a transient LGNd neuron were simultaneously or successively studied, with both cells generating strong responses in layer 4 (recorded on the same 16-channel probe). One such case is seen in Figure 2. In this, and in each of these nine cases, the peak amplitude of the synaptic response generated by the transient neuron was 100–200 μm deeper than that of the sustained neuron (p < 0.003), although the depth distribution of the current sinks generated usually overlapped somewhat.
Sustained cells had significantly longer axonal conduction times than transient cells (mean of 0.96 and 0.69 ms, respectively; p < 0.003), although these distributions overlapped considerably (Fig. 2D). Notably, all LGNd neurons with axonal conduction times of >1.2 ms (12 of 12) were sustained (as seen in the example in Fig. 2B). Moreover, the axonal conduction times of single afferents were consistent whenever we moved our cortical probe, and repeat measures were made at different sites within the terminal arbor of the same cell (r = 0.89; n = 33; p < 0.001). The receptive field centers of transient cells were slightly larger in diameter (by a mean of ∼10%) than those of sustained cells, but this difference was not statistically significant.
One would expect that the degree of retinotopic alignment would be related to both the likelihood of detecting spike-triggered currents generated by single LGNd neurons in V1 and the amplitude of these currents. For this reason, we limited our analyses of the proportion of LGNd neurons that generated a synaptic response in either or both cortical layers 4 and 6, as well as the mean amplitude of these responses to those cases in which the cortical probe was very well aligned with the LGNd receptive field (the centers of the cortical and LGNd receptive fields were separated by less than half the diameter of the LGNd receptive field (n = 65; subsample A in Materials and Methods). Notably, for such very well aligned cases, a very high proportion of transient (24 of 25) and sustained (33 of 40) showed a clear postsynaptic impact on layer 4. In addition, one of the seven sustained neurons in this sample that did not generate a synaptic response in layer 4 did generate a response in layer 6 (below). For these 57 very well aligned cases, the average of the peak postsynaptic response generated from transient cells was somewhat greater than that from sustained cells, but this difference was not statistically significant (291 ± 33 vs 224 ± 25 μV/mm2 for transient and sustained neurons, respectively; p = 0.10). The range of peak postsynaptic response amplitudes was 118–635 μV/mm2 (transient) and 60–654 μV/mm2 (sustained).
The same sample of very well aligned LGNd neurons (subsample A) was used to determine the proportion of LGNd neurons that generated a synaptic impact within layer 6. Of these LGN neurons that generated a synaptic impact within layer 4, 3 of 24 transient cells and 5 of 33 sustained cells also generated a synaptic impact within layer 6. An example of one of these cases can be seen in supplemental Figure 4 (available at www.jneurosci.org as supplemental material). Additionally, one of the very well aligned sustained neurons generated a response in layer 6, but not in layer 4.
Dynamics of postsynaptic currents generated in layer 4 during spontaneous spike trains
The spike-triggered CSD depth profile shown in Figure 1 was based on all 42,577 spontaneous spikes that were generated by this neuron in ∼2 h of study. Next, we selectively examined in the same spike train, the presynaptic and postsynaptic impact generated by impulses with differing preceding interspike intervals (Fig. 3). TC synapses are depressing, and we expected that the postsynaptic responses of impulses with the long preceding intervals will be stronger, reflecting recovery from a chronic synaptic depression that results from the significant spontaneous firing rates of LGNd neurons. In this context, it is important to note that very similar rates of spontaneous firing were seen in sustained (mean, 8.1 ± 0.7 Hz) and transient (mean, 7.8 ± 0.5 Hz) populations. Spikes with short (5–20 ms) or long (>500 ms) preceding interspike intervals were used to generate the depth profiles in Figure 3, A and B, respectively. Note that although the amplitude of the postsynaptic current sink is substantially larger in Figure 3B than in Figure 3A, the amplitude of the presynaptic (axon terminal) potential (oblique arrows in colorized version) is approximately the same. Figure 3C shows, at various preceding interspike intervals, the spike-triggered field potential on channel 7 of our 16-channel probe. This channel was within layer 4. Whereas the axonal terminal component of the response is not influenced by the preceding interspike interval, the postsynaptic component clearly is. Figure 3D shows, for this same LGNd neuron, the relationship between the preceding interspike interval and the peak amplitude of the axonal (left) and postsynaptic current sinks (right) as a function of depth on the 16-channel probe. As shown in Figure 3C, whereas the axon terminal potential is not affected by this variable, the postsynaptic current sinks increases with the duration of the preceding interspike interval.
Such measures were obtained in each of 17 sustained cells and 17 transient cells that were studied (subsample B in Materials and Methods), and in each of these cells, impulses with shorter preceding interspike intervals generated postsynaptic current sinks of lesser amplitude than did impulses preceded by long intervals. These results are shown in Figure 4 where, for each LGNd cell studied, the amplitude of the postsynaptic impact generated by spikes with short preceding interspike intervals (5–20 ms) was calculated as a percentage of the value obtained for that cell at long preceding interspike intervals (>500 ms). Although all of the LGNd neurons generated reduced postsynaptic responses at the shorter intervals, there are very significant differences among them in the magnitude of this effect. Notably, sustained cells generated a postsynaptic response that was significantly more reduced at the short interval than was seen in transient cells (t test, p < 0.001).
To examine the stability of the depressed response (supplemental Fig. 5, available at www.jneurosci.org as supplemental material), we divided the spike trains of each of these LGNd neurons in half, and the value of the reduced postsynaptic amplitude in layer 4 seen during the first and second half of the data file is presented on the x- and y-axis, respectively. The strong correlation observed between these measures over time (r = 0.939; n = 34; p < 0.001) indicates that our measures of synaptic depression are highly reliable.
We next examined the time course of the depressed response normalized against the synaptic impact that was generated by spikes with very long preceding interspike intervals (750–3000 ms), when synapses would be even more fully recovered than in the above analyses (which were normalized using the interval values of 500–3000 ms). Moreover, interval bin widths were more finely graded in this analysis. The more stringent selection criteria (subsample C in Materials and Methods) resulted in a reduced sample of 10 sustained and 9 transient cells (compared with 17 of each type, in Fig. 4). The normalized postsynaptic response for both sustained and transient neurons observed at each interval tested is seen in Figure 5. We observed a significant effect of interval (repeated-measures ANOVA; p < 0.001) and of cell class (p < 0.008). Sustained cells were more depressed at short intervals (5–25 ms) than transient cells (t test, p < 0.005) and continued to be so for all selected intervals up to and including 400–500 ms (p < 0.024). Notably, although the degree of reduction in the postsynaptic response was greater in sustained than in transient cells, the time courses of the reduced responses were very similar for these cell classes (50% recovery is ∼300 and 260 ms in sustained and transient cells, respectively).
It is important to note that short interspike intervals in our spontaneously firing LGNd neurons were not associated with substantial increases in the firing rate of postsynaptic cortical neurons. To assess this, we analyzed the spike trains of 44 cortical neurons that were in precise topographic alignment (separation of <0.5 of the LGNd receptive field diameter) with an LGNd neuron that provided a synaptic input to layer 4. These neurons were recorded through the same 16-channel recording probes used to monitor the local field potentials. For each LGNd–cortical cell pair, we compared the preceding interspike intervals of two groups of cortical spikes: those that immediately followed thalamic spikes with very short (5–25 ms) or very long (>500 ms) preceding interspike intervals (supplemental Fig. 6, available at www.jneurosci.org as supplemental material). Despite this great difference in the instantaneous firing rate of the presynaptic thalamic neuron (65-fold), the preceding intervals of the associated cortical spikes differed by only 16% (p < 0.001). When the postsynaptic cortical neurons were limited to those found in layer 4 (n = 17, within the synaptic impact zone of the LGNd neuron), this value increased to 26% (p < 0.002).
Next, we examined the synaptic dynamics within layer 6 for six LGNd neurons that generated a postsynaptic impact within this layer (four sustained, two transient cells) (Fig. 6). As was seen in layer 4, there was a significant effect of the preceding interspike interval on the postsynaptic currents (repeated-measures ANOVA; F = 76.14; df = 3,12; p < 0.001). Notably, more depression was seen among the four sustained neurons than among two transient neurons (ANOVA; p < 0.036).
Dynamics of postsynaptic currents generated during sustained high-frequency visual response and during high-frequency spontaneous activity
The above analyses of synaptic dynamics were based on spontaneous spike trains of LGNd neurons that had been previously shown to respond in a sustained or transient manner to maintained visual stimulation. In these analyses, the duration of the interval that immediately preceded an action potential was shown to have a large effect on the postsynaptic impact that was generated by that spike. However, synaptic depression is known to accumulate, and trains of spikes with short preceding intervals often generate much more depression than do spikes after a single short preceding interspike interval [Gil et al. (1997), their Fig. 3]. It seemed likely, therefore, that an even stronger depression would be seen at the thalamocortical synapses of sustained LGNd neurons during the sustained, high-frequency response that is typically generated in these cells by maintained visual stimulation of their receptive field centers. To examine this, we further studied three of the sustained cells that had been investigated during lengthy periods of spontaneous firing by stimulating the receptive field centers of these cells with a high-contrast visual stimulus (1 s on, 1 s off) for several hundred trials (n = 517). The poststimulus histogram generated by this stimulation in one of these cells is shown in Figure 7A. Note that the mean rate of responding was ∼75 Hz during the initial half-second of the response and 38 Hz during the later half-second (in red), maintained values that are much higher than the baseline value for this cell. The colorized CSD depth profile in Figure 7B shows the presynaptic and monosynaptic impact generated by impulses that occurred during the later half-second of the stimulation period, following this extensive period of high-frequency stimulation. The colorized CSD profiles in Figure 7, C and D, are taken from the same cell, but before the visual stimulation, during the extended periods of spontaneous activity that were used to generate the values shown in Figure 4. The CSD profiles were generated by spikes with long intervals (>200 ms) (Fig. 7C) or by spikes with shorter preceding intervals (Fig. 7D). This range of shorter preceding intervals (Fig. 7D) was selected to match the mean interspike interval seen during the last half-second of the visual stimulation (in red; i.e., a similar mean interval as the spikes used to generate Fig. 7B). Note that during the extended period of visual stimulation (Fig. 7B), the presynaptic impact remained constant, and the postsynaptic impact is only slightly reduced from that seen after comparable preceding intervals that occur during the spontaneous activity (Fig. 7D). For the three cells that we studied in this manner, the maximal amplitude of the postsynaptic impact during the last half-second of the maintained visual stimulation was reduced by 6, 17, and 36%, compared with that generated by spikes after comparable intervals during spontaneous activity. Thus, multiple preceding high-frequency spikes generate only a modest enhancement of the depression seen after a single short interspike interval.
Figure 7.

Synaptic impact generated by single LGNd axons during sustained visual responding. A, The poststimulus time histogram of a sustained LGNd neuron after the presentation of a luminous spot covering the receptive field center for 1 s (517 repetitions; total spike count, 34,178). B, Spikes from the last 0.5 s of the presentation were selected (mean preceding interval, 25 ms) and used to generate the spike-triggered CSD. C, D, Spike-triggered CSDs generated from spontaneous spikes with a preceding interspike interval of >200 ms (C) or between 16 and 49 ms (D). The latter values were selected to match the interspike intervals generated during the sustained visual response.
The effects of visual stimulation on the synaptic dynamics of transient neurons could not be readily tested because of the large extracellular field potentials generated by transient visual stimulation. We were, however, able to examine the effects of spontaneous multiple preceding impulses on both sustained and transient populations. To do this (Fig. 8), we selected all spikes with a short preceding interspike interval (5–20 ms) (Fig. 8A, red arrows at top) and examined the 200 ms preceding each of these spikes. We then compared the postsynaptic impact generated by spikes that were preceded by only a single spike during that 200 ms window (Fig. 8A, middle) with those spikes that followed a period of high activity (five or more spikes within the preceding 200 ms) (Fig. 8A, bottom). The strength of the postsynaptic impact from these spikes was normalized to values generated by spikes with long preceding intervals (>500 ms). Figure 8B shows that, for both sustained and transient cells, short-interval spikes that followed periods of high activity generated significantly weaker postsynaptic responses than short-interval spikes that occurred in relative isolation (sustained cells: t = 7.226, df = 16, p < 0.001; transient cells: t = 5.596, df = 16, p < 0.001). Notably, sustained and transient neurons did not differ significantly in the degree of the further reduction that resulted from many prior preceding impulses. While sustained cells decreased, under conditions of multiple preceding impulses, from 61 to 46% of the peak value (relative to long interval), transient cells decreased from 77 to 62%.
Figure 8.
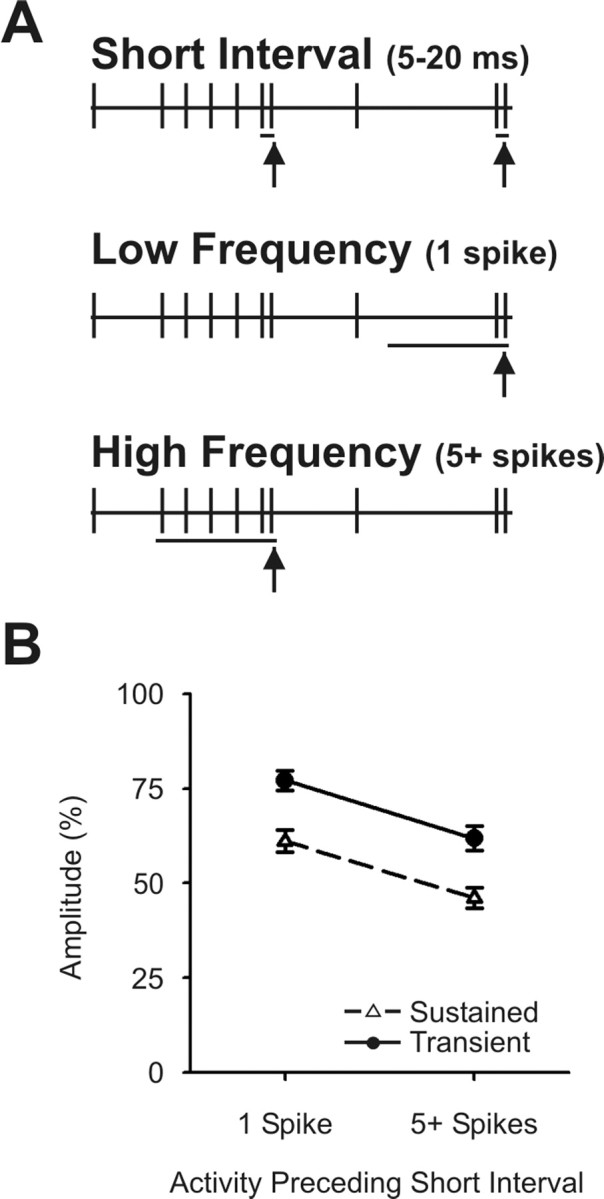
Accumulation of depression with multiple preceding impulses does not differ between sustained and transient neurons. A, Diagram of the method of spike selection. Spontaneous activity in sustained and transient neurons was studied. Spikes with short preceding interspike intervals (5–20 ms) were selected for analysis (top, vertical arrows). For each of these spikes, we examined the preceding 200 ms and compared those short-interval spikes that had only a single preceding spike during this period (middle, vertical arrow) with those that had at least five spikes during this period (bottom, vertical arrow). B, For both sustained and transient cells, post-synaptic responses generated by spikes with short preceding intervals were of somewhat lower amplitude if they followed periods of high activity (5 or more spikes) compared with those with only a single spike during this interval. Data points show the mean normalized amplitude (compared with spikes with long preceding intervals of 500–3000 ms) ± SEM.
Discussion
Both sustained (85%) and transient (96%) LGNd afferents generated a distinct presynaptic and postsynaptic response within the retinotopically aligned region of V1, and the time courses of these events were remarkably similar to those generated by single thalamocortical axons terminating within rabbit S1 (Swadlow et al., 2002), corticotectal axons terminating in the superior colliculus (Bereshpolova et al., 2006), and feline LGNd axons terminating in V1 (Jin et al., 2008). For both sustained and transient cells, the amplitude of the postsynaptic responses generated in V1 was reduced, in an interval-dependent manner, for >750 ms after a prior spontaneous impulse. Surprisingly, however, the interval-dependent reduction in postsynaptic response amplitude was significantly greater in sustained than in transient neurons, and this difference between cell classes remained significant for at least 400–500 ms after the preceding impulse. This difference between sustained and transient populations cannot be accounted for by class differences in the time courses of the postspike reduction (Fig. 5), by differences in the cumulative depressing effect of increasing numbers of high-frequency spikes (Fig. 8), or by differences in spontaneous firing rates (both ∼8 Hz).
Such a reduced postsynaptic response could be attributable to mechanisms other than short-term synaptic depression, such as feed-forward inhibition (Swadlow, 2003; Callaway, 2004; Cruickshank et al., 2007). However, the extended time course of the reduced postsynaptic response (>750 ms) is inconsistent with the time course of feedforward inhibition and is very similar to the time course of synaptic depression seen in vitro studies of the thalamocortical synapse (Gil et al., 1997). In contrast, feedforward inhibition, which is thought to be mediated by a fast GABAA receptor mechanism, has a time course of a few tens of milliseconds (Salin and Prince, 1996a,b), and even longer-lasting GABAB mechanisms (<300 ms) (Connors et al., 1988; Molyneaux and Hasselmo, 2002) are too fast to account for the extended time course of the observed postsynaptic reduction. A reduced postsynaptic response could also be related to an increased activity in postsynaptic cells (and associated conductance changes) that may be correlated with short presynaptic interspike intervals. However, only slight (albeit significant) changes in the postsynaptic (cortical) instantaneous firing rate are associated with single thalamic spikes with very short preceding interspike intervals (supplemental Fig. 6, available at www.jneurosci.org as supplemental material). This result was not unexpected because, except for one instance (Fig. 7), we were studying responses generated by spontaneous thalamic spikes, not spikes that were driven by electrical or sensory stimulation (which would be expected to generate high rates of postsynaptic, as well as presynaptic activity). We cannot rule out all possible postsynaptic influences in our studies, but we believe, based on the above considerations, that our results are best explained by a mechanism of synaptic depression that differs in strength between sustained and transient neurons. We and others have argued that thalamocortical synapses are subject to a chronic state of depression in awake subjects (Ramcharan et al., 2000; Swadlow and Gusev, 2001; Castro-Alamancos, 2002; Castro-Alamancos and Oldford, 2002; Swadlow et al., 2002; Boudreau and Ferster, 2005). Chronic depression at this synapse results because thalamocortical synapses are depressing and are subject to high levels of spontaneous firing.
Considerable attention has been given to the role that synaptic dynamics might play in the operation of sensory cortical networks (Abbott et al., 1997; Gerstner et al., 1997; Chance et al., 1998; Senn et al., 1998; Goldman et al., 1999; Nadim et al., 1999; Reich et al., 2000; Atzori et al., 2001; Castro-Alamancos, 2002; Chung et al., 2002; Freeman et al., 2002; Goldman et al., 2002; Manor et al., 2003; Mikula and Niebur, 2003). Our findings show that synaptic dynamics generated by single axons may indeed be tuned to their temporal sensory response characteristics. However, our results do not support the notion that transient receptive field response dynamics are supported by synapses that are more strongly depressing than those mediating sustained responding. In contrast, sustained LGNd neurons displayed more synaptic depression at their intracortical terminals than did transient neurons. One possible explanation for this result may lie in previous work showing that transient neurons are able to follow much higher rates of peripheral sensory stimulation than sustained neurons (Bezdudnaya et al., 2006), and that their sensitivity to contrast is much higher (Cano et al., 2006). These response characteristics may place greater demands on the synaptic resources of these cells than are placed by the prolonged responses of sustained LGNd neurons, and synaptic mechanisms may be tuned to these demands.
Sustained LGNd axons generated a peak synaptic impact in layer 4 that was more superficial than that generated by transient neurons. This situation appears to be opposite to that seen in the cat, in which X-type LGN neurons [linear cells that tend to respond in a sustained manner (for review, see Sherman and Spear, 1982)] terminate deeper than Y-type inputs [Humphrey et al., 1985; Jin et al. (2008), their Fig. 2b, using the same recording methods as here]. The substantial overlap in depth of the sustained and transient inputs, however, raises the possibility of convergence of these parallel pathways onto common cortical targets, and indirect evidence for such convergence has been reported in cat V1 (Alonso, 2001). In rabbit, a likely target population would be fast-spike interneurons in layer 4 which, in somatosensory cortex, receive a highly convergent input from the ventrobasal thalamus (Swadlow, 1995; Swadlow and Gusev, 2002). We have previously suggested similar high levels of thalamocortical convergence onto fast-spike interneurons of the visual cortex (Alonso and Swadlow, 2005), and preliminary cross-correlation analyses in our laboratory have revealed two such cells that have each received a convergent input from a sustained and from a transient LGNd cell (our unpublished observation). Such highly convergent circuitry could account for the lack of orientation and directional selectivity seen in these cells in rabbit V1 [most efferent neurons of rabbit V1 are well tuned to orientation and direction (Swadlow and Weyand, 1987; Swadlow, 1988)] and would suggest that feedforward inhibition in V1 is broadly tuned not only to orientation and direction but also to temporal response characteristics.
It is important to note that the present results in awake rabbits reflect the mean depression for a large number of the synapses formed by a single LGNd axon. Our results show that sustained and transient classes of LGNd neurons differ significantly in the average nature of their synaptic dynamics and that these average differences are reliably maintained over time (hours), in both in layer 6 and in layer 4. Such differences could be attributable to intrinsic properties of the thalamic cells that directly result in more or less depressing synapses. Alternatively, because synaptic dynamics can be under the control of postsynaptic targets (Markram et al., 1998; Reyes et al., 1998; Beierlein et al., 2007), and because sustained and transient neurons target different depths within layer 4, it is possible that these differences in synaptic dynamics result indirectly, from a tendency of sustained and transient populations to target different postsynaptic populations.
The finding of strong synaptic depression in sustained LGNd neurons raises the question of how information about maintained (standing) contrast reaches the visual cortex and, more generally, about the persistence of “sustained” responses in successive nodes of a network, where each node may be subject to considerable synaptic depression. We know that such sustained information does reach V1 because robust sustained responses are seen in most simple cells of rabbit visual cortex during maintained stimulation of their dominant subfield (Swadlow and Weyand, 1987). Such sustained responses in cortical neurons are consistent with our finding of robust postsynaptic responses generated by LGNd impulses that occurred after considerable periods of sustained, visually driven impulse activity (Fig. 7). Thus, only a modest further reduction in the postsynaptic response was seen after a long series of high-frequency presynaptic impulses, compared with a single (spontaneous) high-frequency impulse. This result is similar to our observations of spontaneous spike trains, where only a mild increase in depression was seen after increased numbers of prior spikes (Fig. 8). Together, these data indicate that the synapses of sustained LGNd neurons are subject to a synaptic depression that rapidly saturates with increasing numbers of high-frequency spikes (Zucker and Regehr, 2002) but that the postsynaptic response amplitude that is finally reached is sufficiently high to allow generation of a significant sustained response in recipient cortical neurons.
A recent study by Boudreau and Ferster (2005) documented a chronic synaptic depression at the geniculocortical synapse that resulted from high spontaneous firing rates of LGNd neurons in vivo. These authors found significant depression in the monosynaptic responses elicited by the second of two electrical pulses delivered to LGNd axons in which spontaneous activity had been silenced by retinal inactivation. Moreover, they found that this depression saturated rapidly and that increases in thalamic activity beyond background levels generated only a mild increased depression. Our results are in general agreement with the finding of a chronic, rapidly saturating depression at the geniculocortical synapse (see also Reig et al., 2006). In contrast to previous work, however, our results are based on the analysis of single LGNd afferents, not summed activity of many electrically driven LGNd afferents. Because of this, we were able to document a large range in the degree of synaptic depression displayed by individual LGNd neurons and, importantly, document that the degree of depression is specific to LGNd cell type. Understanding how these cell-specific differences in short-term synaptic dynamics at the thalamocortical synapses influence cortical processing will await a more detailed analysis of the response properties of the cortical targets of sustained and transient LGNd neurons.
Footnotes
This work was supported by National Science Foundation Grant IOB-0445583 and National Institute of Mental Health Grant MH-64024. We thank Prof. Jose-Manuel Alonso for insightful discussions and Victor Serdyukov for expert hardware and software development and support.
References
- Abbott LF, Varela JA, Sen K, Nelson SB. Synaptic depression and cortical gain control. Science. 1997;275:220–224. doi: 10.1126/science.275.5297.221. [DOI] [PubMed] [Google Scholar]
- Alonso JM. Rules of connectivity between geniculate cells and simple cells in cat primary visual cortex. J Neurosci. 2001;21:4002–4015. doi: 10.1523/JNEUROSCI.21-11-04002.2001. [DOI] [PMC free article] [PubMed] [Google Scholar]
- Alonso JM, Swadlow HA. Thalamocortical specificity and the synthesis of sensory cortical receptive fields. J Neurophysiol. 2005;94:26–32. doi: 10.1152/jn.01281.2004. [DOI] [PubMed] [Google Scholar]
- Alonso JM, Usrey WM, Reid RC. Precisely correlated firing in cells of the lateral geniculate nucleus. Nature. 1996;383:815–819. doi: 10.1038/383815a0. [DOI] [PubMed] [Google Scholar]
- Atzori M, Lei S, Evans DI, Kanold PO, Phillips-Tansey E, McIntyre O, McBain CJ. Differential synaptic processing separates stationary from transient inputs to the auditory cortex. Nat Neurosci. 2001;4:1230–1237. doi: 10.1038/nn760. [DOI] [PubMed] [Google Scholar]
- Beierlein M, Fioravante D, Regehr WG. Differential expression of posttetanic potentiation and retrograde signaling mediate target-dependent short-term synaptic plasticity. Neuron. 2007;54:949–959. doi: 10.1016/j.neuron.2007.06.002. [DOI] [PMC free article] [PubMed] [Google Scholar]
- Bereshpolova Y, Stoelzel CR, Gusev AG, Bezdudnaya T, Swadlow HA. The impact of a corticotectal impulse on the awake superior colliculus. J Neurosci. 2006;26:2250–2259. doi: 10.1523/JNEUROSCI.4402-05.2006. [DOI] [PMC free article] [PubMed] [Google Scholar]
- Bezdudnaya T, Cano M, Bereshpolova Y, Stoelzel CR, Alonso JM, Swadlow HA. Thalamic burst mode and inattention in the awake LGNd. Neuron. 2006;49:421–432. doi: 10.1016/j.neuron.2006.01.010. [DOI] [PubMed] [Google Scholar]
- Boudreau CE, Ferster D. Short-term depression in thalamocortical synapses of cat primary visual cortex. J Neurosci. 2005;25:7179–7190. doi: 10.1523/JNEUROSCI.1445-05.2005. [DOI] [PMC free article] [PubMed] [Google Scholar]
- Caldwell JH, Daw NW. New properties of rabbit retinal ganglion cells. J Physiol (Lond) 1978;276:257–276. doi: 10.1113/jphysiol.1978.sp012232. [DOI] [PMC free article] [PubMed] [Google Scholar]
- Callaway EM. Feedforward, feedback and inhibitory connections in primate visual cortex. Neural Netw. 2004;17:625–632. doi: 10.1016/j.neunet.2004.04.004. [DOI] [PubMed] [Google Scholar]
- Cano M, Bezdudnaya T, Swadlow HA, Alonso JM. Brain state and contrast sensitivity in the awake visual thalamus. Nat Neurosci. 2006;9:1240–1242. doi: 10.1038/nn1760. [DOI] [PubMed] [Google Scholar]
- Castro-Alamancos MA. Role of thalamocortical sensory suppression during arousal: focusing sensory inputs in neocortex. J Neurosci. 2002;22:9651–9655. doi: 10.1523/JNEUROSCI.22-22-09651.2002. [DOI] [PMC free article] [PubMed] [Google Scholar]
- Castro-Alamancos MA, Oldford E. Cortical sensory suppression during arousal is due to the activity-dependent depression of thalamocortical synapses. J Physiol (Lond) 2002;541:319–331. doi: 10.1113/jphysiol.2002.016857. [DOI] [PMC free article] [PubMed] [Google Scholar]
- Chance FS, Nelson SB, Abbott LF. Synaptic depression and the temporal response characteristics of V1 cells. J Neurosci. 1998;18:4785–4799. doi: 10.1523/JNEUROSCI.18-12-04785.1998. [DOI] [PMC free article] [PubMed] [Google Scholar]
- Chung S, Li X, Nelson SB. Short-term depression at thalamocortical synapses contributes to rapid adaptation of cortical sensory responses in vivo. Neuron. 2002;34:437–446. doi: 10.1016/s0896-6273(02)00659-1. [DOI] [PubMed] [Google Scholar]
- Cleland BG, Dubin MW, Levick WR. Sustained and transient neurones in the cat's retina and lateral geniculate nucleus. J Physiol (Lond) 1971;217:473–496. doi: 10.1113/jphysiol.1971.sp009581. [DOI] [PMC free article] [PubMed] [Google Scholar]
- Collewijn H. Eye and head movements in freely moving rabbits. J Physiol (Lond) 1977;266:471–498. doi: 10.1113/jphysiol.1977.sp011778. [DOI] [PMC free article] [PubMed] [Google Scholar]
- Connors BW, Malenka RC, Silva LR. Two inhibitory postsynaptic potentials, and GABAA and GABAB receptor-mediated responses in neocortex of rat and cat. J Physiol (Lond) 1988;406:443–468. doi: 10.1113/jphysiol.1988.sp017390. [DOI] [PMC free article] [PubMed] [Google Scholar]
- Cruickshank SJ, Lewis TJ, Connors BW. Synaptic basis for intense thalamocortical activation of feedforward inhibitory cells in neocortex. Nat Neurosci. 2007;10:462–468. doi: 10.1038/nn1861. [DOI] [PubMed] [Google Scholar]
- Freeman JA, Nicholson C. Experimental optimization of current source-density technique for anuran cerebellum. J Neurophysiol. 1975;38:369–382. doi: 10.1152/jn.1975.38.2.369. [DOI] [PubMed] [Google Scholar]
- Freeman TC, Durand S, Kiper DC, Carandini M. Suppression without inhibition in visual cortex. Neuron. 2002;35:759–771. doi: 10.1016/s0896-6273(02)00819-x. [DOI] [PubMed] [Google Scholar]
- Gerstner W, Kreiter AK, Markram H, Herz AV. Neural codes: firing rates and beyond. Proc Natl Acad Sci USA. 1997;94:12740–12741. doi: 10.1073/pnas.94.24.12740. [DOI] [PMC free article] [PubMed] [Google Scholar]
- Gil Z, Connors BW, Amitai Y. Differential regulation of neocortical synapses by neuromodulators and activity. Neuron. 1997;19:679–686. doi: 10.1016/s0896-6273(00)80380-3. [DOI] [PubMed] [Google Scholar]
- Goldman MS, Nelson JC, Abbott LF. Decorrelation of spike trains by synaptic depression. Neurocomputing. 1999;26–27:147–153. [Google Scholar]
- Goldman MS, Maldonado P, Abbott LF. Redundancy reduction and sustained firing with stochastic depressing synapses. J Neurosci. 2002;22:584–591. doi: 10.1523/JNEUROSCI.22-02-00584.2002. [DOI] [PMC free article] [PubMed] [Google Scholar]
- Humphrey AL, Sur M, Uhlrich DJ, Sherman SM. Projection patterns of individual X- and Y-cell axons from the lateral geniculate nucleus to cortical area 17 in the cat. J Comp Neurol. 1985;233:159–189. doi: 10.1002/cne.902330203. [DOI] [PubMed] [Google Scholar]
- Jin JZ, Weng C, Yeh CI, Gordon JA, Ruthazer ES, Stryker MP, Swadlow HA, Alonso JM. On and off domains of geniculate afferents in cat primary visual cortex. Nat Neuroci. 2008;11:88–98. doi: 10.1038/nn2029. [DOI] [PMC free article] [PubMed] [Google Scholar]
- Jones JP, Palmer LA. The two-dimensional spatial structure of simple receptive fields in cat striate cortex. J Neurophysiol. 1987;58:1187–1211. doi: 10.1152/jn.1987.58.6.1187. [DOI] [PubMed] [Google Scholar]
- Levick WR. Receptive fields and trigger features of ganglion cells in the visual streak of the rabbits retina. J Physiol (Lond) 1967;188:285–307. doi: 10.1113/jphysiol.1967.sp008140. [DOI] [PMC free article] [PubMed] [Google Scholar]
- Livingstone MS, Hubel DH. Effects of sleep and arousal on the processing of visual information in the cat. Nature. 1981;291:554–561. doi: 10.1038/291554a0. [DOI] [PubMed] [Google Scholar]
- Manor Y, Bose A, Booth V, Nadim F. Contribution of synaptic depression to phase maintenance in a model rhythmic network. J Neurophysiol. 2003;90:3513–3528. doi: 10.1152/jn.00411.2003. [DOI] [PubMed] [Google Scholar]
- Markram H, Wang Y, Tsodyks M. Differential signaling via the same axon of neocortical pyramidal neurons. Proc Natl Acad Sci USA. 1998;95:5323–5328. doi: 10.1073/pnas.95.9.5323. [DOI] [PMC free article] [PubMed] [Google Scholar]
- Mikula S, Niebur E. Synaptic depression leads to nonmonotonic frequency dependence in the coincidence detector. Neural Comput. 2003;15:2339–2358. doi: 10.1162/089976603322362383. [DOI] [PubMed] [Google Scholar]
- Molyneaux BJ, Hasselmo ME. GABA(B) presynaptic inhibition has an in vivo time constant sufficiently rapid to allow modulation at theta frequency. J Neurophysiol. 2002;87:1196–1205. doi: 10.1152/jn.00077.2001. [DOI] [PubMed] [Google Scholar]
- Nadim F, Manor Y, Kopell N, Marder E. Synaptic depression creates a switch that controls the frequency of an oscillatory circuit. Proc Natl Acad Sci USA. 1999;96:8206–8211. doi: 10.1073/pnas.96.14.8206. [DOI] [PMC free article] [PubMed] [Google Scholar]
- Ramcharan EJ, Cox CL, Zhan XJ, Sherman SM, Gnadt JW. Cellular mechanisms underlying activity patterns in the monkey thalamus during visual behavior. J Neurophysiol. 2000;84:1982–1987. doi: 10.1152/jn.2000.84.4.1982. [DOI] [PubMed] [Google Scholar]
- Reich DS, Mechler F, Purpura KP, Victor JD. Interspike intervals, receptive fields, and information encoding in primary visual cortex. J Neurosci. 2000;20:1964–1974. doi: 10.1523/JNEUROSCI.20-05-01964.2000. [DOI] [PMC free article] [PubMed] [Google Scholar]
- Reig R, Gallego R, Nowak LG, Sanchez-Vives MV. Impact of cortical network activity on short-term synaptic depression. Cereb Cortex. 2006;16:688–695. doi: 10.1093/cercor/bhj014. [DOI] [PubMed] [Google Scholar]
- Reitboeck HJ. Fiber microelectrodes for electrophysiological recordings. J Neurosci Methods. 1983;8:249–262. doi: 10.1016/0165-0270(83)90038-9. [DOI] [PubMed] [Google Scholar]
- Reyes A, Lujan R, Rozov A, Burnashev N, Somogyi P, Sakmann B. Target-cell-specific facilitation and depression in neocortical circuits. Nat Neurosci. 1998;1:279–285. doi: 10.1038/1092. [DOI] [PubMed] [Google Scholar]
- Salin PA, Prince DA. Spontaneous GABAA receptor-mediated inhibitory currents in adult rat somatosensory cortex. J Neurophysiol. 1996a;75:1573–1588. doi: 10.1152/jn.1996.75.4.1573. [DOI] [PubMed] [Google Scholar]
- Salin PA, Prince DA. Electrophysiological mapping of GABAA receptor-mediated inhibition in adult rat somatosensory cortex. J Neurophysiol. 1996b;75:1589–1600. doi: 10.1152/jn.1996.75.4.1589. [DOI] [PubMed] [Google Scholar]
- Senn W, Segev I, Tsodyks M. Reading neuronal synchrony with depressing synapses. Neural Comput. 1998;10:815–819. doi: 10.1162/089976698300017494. [DOI] [PubMed] [Google Scholar]
- Sherman SM, Spear PD. Organization of visual pathways in normal and visually deprived cats. Physiol Rev. 1982;62:738–855. doi: 10.1152/physrev.1982.62.2.738. [DOI] [PubMed] [Google Scholar]
- Swadlow HA. Efferent neurons and suspected interneurons in binocular visual cortex of the awake rabbit: receptive fields and binocular properties. J Neurophysiol. 1988;59:1162–1187. doi: 10.1152/jn.1988.59.4.1162. [DOI] [PubMed] [Google Scholar]
- Swadlow HA. Influence of VPM afferents on putative inhibitory interneurons in S1 of the awake rabbit: evidence from cross-correlation, microstimulation, and latencies to peripheral sensory stimulation. J Neurophysiol. 1995;73:1584–1599. doi: 10.1152/jn.1995.73.4.1584. [DOI] [PubMed] [Google Scholar]
- Swadlow HA. Fast-spike interneurons and feedforward inhibition in awake sensory neocortex. Cereb Cortex. 2003;13:25–32. doi: 10.1093/cercor/13.1.25. [DOI] [PubMed] [Google Scholar]
- Swadlow HA, Gusev AG. The influence of single VB thalamocortical impulses on barrel columns of rabbit somatosensory cortex. J Neurophysiol. 2000;83:2802–2813. doi: 10.1152/jn.2000.83.5.2802. [DOI] [PubMed] [Google Scholar]
- Swadlow HA, Gusev AG. The impact of “bursting” thalamic impulses at a neocortical synapse. Nat Neurosci. 2001;4:402–408. doi: 10.1038/86054. [DOI] [PubMed] [Google Scholar]
- Swadlow HA, Gusev AG. Receptive-field construction in cortical inhibitory interneurons. Nat Neurosci. 2002;5:403–404. doi: 10.1038/nn847. [DOI] [PubMed] [Google Scholar]
- Swadlow HA, Weyand TG. Receptive-field and axonal properties of neurons in the dorsal lateral geniculate nucleus of awake unparalyzed rabbits. J Neurophysiol. 1985;54:168–183. doi: 10.1152/jn.1985.54.1.168. [DOI] [PubMed] [Google Scholar]
- Swadlow HA, Weyand TG. Corticogeniculate neurons, corticotectal neurons, and suspected interneurons in visual cortex of awake rabbits: receptive-field properties, axonal properties, and effects of EEG arousal. J Neurophysiol. 1987;57:977–1001. doi: 10.1152/jn.1987.57.4.977. [DOI] [PubMed] [Google Scholar]
- Swadlow HA, Gusev AG, Bezdudnaya T. Activation of a cortical column by a thalamocortical impulse. J Neurosci. 2002;22:7766–7773. doi: 10.1523/JNEUROSCI.22-17-07766.2002. [DOI] [PMC free article] [PubMed] [Google Scholar]
- Swadlow HA, Bereshpolova Y, Bezdudnaya T, Cano M, Stoelzel CR. A multi-channel, implantable microdrive system for use with sharp, ultra-fine “Reitboeck” microelectrodes. J Neurophysiol. 2005;93:2959–2965. doi: 10.1152/jn.01141.2004. [DOI] [PubMed] [Google Scholar]
- Vaknin G, DiScenna PG, Teyler TJ. A method for calculating current source density (CSD) analysis without resorting to recording sites outside the sampling volume. J Neurosci Methods. 1988;24:131–135. doi: 10.1016/0165-0270(88)90056-8. [DOI] [PubMed] [Google Scholar]
- Van Hooser SD, Alexander J, Heimel F, Nelson SB. Receptive field properties and laminar organization of lateral geniculate nucleus in the gray squirrel (Sciurus carolinensis) J Neurophysiol. 2003;90:3398–3418. doi: 10.1152/jn.00474.2003. [DOI] [PubMed] [Google Scholar]
- Zucker RS, Regehr WG. Short-term synaptic plasticity. Annu Rev Physiol. 2002;64:355–405. doi: 10.1146/annurev.physiol.64.092501.114547. [DOI] [PubMed] [Google Scholar]