Abstract
A major goal in the study of ribosome structure and function is to obtain a complete description of the conformational dynamics of the ribosome during the many steps of protein synthesis. Here, we report a new approach to the study of ribosome dynamics using Translation-Libration-Screw (TLS) refinement against experimental X-ray diffraction data. TLS analysis of complexes of the 70S ribosome suggests that many of its structural features have an inherent tendency for anisotropic movement. Analysis of displacements of the 30S and 50S ribosomal subunits reveals an intrinsic bias for ‘ratchet-like’ intersubunit rotation. The libration axes for both subunits pass through the peptidyl transferase center (PTC), indicating a tendency for structural rotations to occur around the site of peptide bond formation. The modes of anisotropic movement of ribosomal RNA components, including the head of the 30S subunit, the L1 and L11 stalks and the two main arms of the tRNAs were found to correlate with their respective modes of movement previously inferred from comparisons of ribosomes trapped in different functional states. In the small subunit, the mobilities of features interacting with the Shine-Dalgarno helix are decreased in the presence of the Shine-Dalgarno helix, supporting the proposal that that formation of the Shine-Dalgarno helix during initiation may contribute to stabilization of the small subunit for optimal interaction with initiator tRNAfMet. The similarity of TLS parameters for two independently solved structures of similar ribosome complexes suggests that TLS analysis can provide useful information about the dynamics of very large macromolecular objects and at resolutions lower than those at which TLS refinement has commonly been applied.
Introduction
Ribosomes are the ribonucleoprotein particles responsible for converting genetic information encoded in messenger RNA (mRNA) into proteins. During protein synthesis, transfer RNAs (tRNAs) deliver amino acids to the ribosome. Recognition of the cognate aminoacyl-tRNA for each mRNA codon (decoding process) occurs on the small (30S) subunit and is followed by peptide bond formation in the peptidyl-transferase center (PTC) of the large subunit. Each cycle of elongation is followed by translocation of tRNAs through the ribosome, during which tRNA moves from the A (aminoacyl) site to the P (peptidyl) site and then to the E (exit) site before leaving the ribosome. These functional processes are accompanied by rapid, large-scale molecular movements of tRNA, mRNA and translation factors that are believed to be accompanied by corresponding movements in the structure of the ribosome. For example, comparison of cryo-EM reconstructions of ribosomes trapped in different states of translocation has led to a model for translocation based on intersubunit rotation1 that has recently been supported by solution studies using FRET2 and intersubunit cross-linking3. Although translocation normally requires participation of elongation factor EF-G and GTP, it has been shown to occur in their absence under certain in vitro conditions4; 5; 6; 7; 8, indicating that the ribosome has an inherent ability to undergo the conformational rearrangements required for translocation. It seems likely that the structure of the ribosome has been optimized during evolution to support these and other dynamic events that underlie protein synthesis. A major goal in the study of ribosome structure and function is to obtain a full description of the molecular dynamics of translation, in terms of the structures of the ribosome and its functional ligands. The studies presented here suggest a novel approach toward this end.
Since the magnitudes and directionalities of atomic displacements are captured in diffraction data9, these data can be exploited to infer information about macromolecular dynamics. Attributing individual atomic anisotropic displacement parameters to a model, however, is possible only when high-resolution (better than 1.2 Å) diffraction data are available10. However, at lower resolutions (commonly 1.2 to 3 Å)11, TLS (translation-libration-screw) formalism can be applied to rigid domains, rather than to individual atoms, and has been demonstrated to closely approximate the anisotropic behavior of an atomic model12; 13. Comparison of TLS parameters with the amplitudes of normal modes describing the internal motion of a protein indicates that TLS parameters for the overall motion make the largest contribution to atomic displacements14; 15. TLS analysis has been shown to provide biologically relevant information, such as identification of mobile domains contributing to induced fit of a protein as well as of regions of restricted mobility, comprised of biologically critical sites, such as the active sites of enzymes16; 17. The theory underlying TLS parameterization has been presented in detail by Schomaker and Trueblood18; 19 and Howlin et al20. In summary, apart from improving agreement between an atomic structure and diffraction data by approximating anisotropic disorder of atoms, TLS refinement yields translational, librational and screw tensors for the respective rigid groups. The collective anisotropic disorder of atoms representing each rigid group can therefore be described as translation along translational axes, torsional oscillations around librational axes and screw motions along screw axes. In this work, TLS formalism has allowed visualization of the anisotropic dynamics of the ribosomal subunits and their sub-structures, and tRNAs bound to the ribosome.
Results
TLS refinement
The structure used for TLS analysis represents an elongation-like ribosomal complex containing a short 10-nucleotide defined mRNA, tRNAPhe bound to the P site and an endogenous mixture of tRNAs bound to the E site (modeled as tRNAPhe), determined at 3.7-Å resolution21, referred to below as the tRNAPhe complex. TLS refinement followed a conventional refinement strategy and led to reduction in crystallographic R and free R factors, indicating improvement of the fit of the structural model to the experimental diffraction data. Comparison of the relative magnitudes of translational, librational and screw tensor eigenvalues showed that TLS motion is primarily characterized by libration (see Materials and Methods). The focus of the following discussion will therefore be on the libration axes obtained by treating the tRNAPhe complex as either 4 or 70 independent TLS groups, as well as on comparison of librational movements with those of the crystal structure of a separate ribosome-tRNA complex recently solved at similar resolution22.
TLS parameterization of the ribosome represented by 4 rigid groups
Cryo-EM, biochemical and biophysical studies suggest that movement of ribosomal subunits during translocation can be approximated as a ratchet-like intersubunit rotation 1; 2; 3. In order to explore the inherent tendency of the subunits to move, TLS refinement was performed with the 30S subunit, 50S subunit and P- and E-site tRNAs treated as four separate TLS groups. For each subunit, the librational components are anisotropic (the magnitudes of the primary axes are 2.5- and 5-fold higher than that of the second largest axis for the large and small subunit, respectively) and imply that inherent intersubunit movement is biased towards ratchet-like libration (Figures 1a–c). For the large subunit, the primary librational axis, around which the subunit as a rigid group undergoes the largest anisotropic displacement, nearly coincides with that of the small subunit (Figures 1a, 1b). This main axis of the large subunit connects the peptidyl transferase center with proteins L20 and L21 on the solvent side of the subunit. The primary axis of the small subunit penetrates the subunit through the penultimate stem (h44) between nucleotides U1407 and A1492-A1493 in the decoding site23 and through the cleft formed by proteins S2, S5 and S8 at the solvent side. Thus, the major librational axes for the two ribosomal subunits pass through their respective main functional sites. Interestingly, for both subunits, the libration axes intersect near the peptidyl-transferase center (PTC). One possible explanation is that the inherent ribosomal mobility is tuned to minimize disruption of the conformation of the PTC during different steps of protein synthesis, to ensure precise aligment of the ribosomal nucleotides forming the PTC during catalysis. This might be important, for example, to exclude attack by water of the peptidyl-tRNA linkage24. Another possibility is that the structure of the ribosome is optimized for rotation of the aminoacyl- and peptidyl-tRNAs around the PTC during their movements before, during and following catalysis. It should also be taken into account that the PTC is located near the center of the ribosome, and is therefore less likely to show large displacements of the kind that are observed at the extremities of the ribosome.
Figure 1.
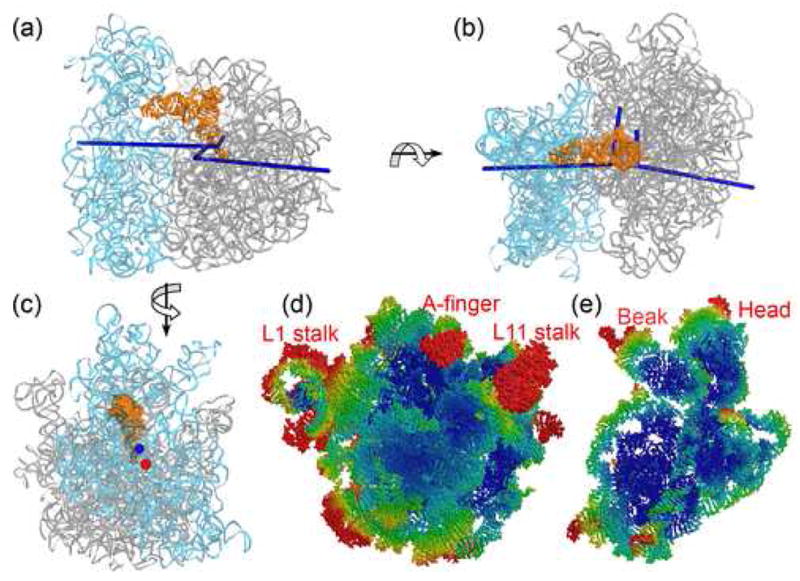
Libration axes and thermal ellipsoids for the 30S and 50S ribosomal subunits. P-site tRNA (orange), 16S (cyan) and 23S (grey) rRNAs, and libration axes derived from a 4-TLS group refinement (blue) are shown. (a) Side view (b) Top view (c) View from the solvent face of the 30S subunit showing the location of the principal libration axis derived from the 4-TLS group refinement (blue) and of the intersubunit ratcheting axis suggested by cryo-EM experiments28 (red). (d) and (e) Thermal ellipsoids derived from the 70S-TLS group refinement for the large and small ribosomal rRNAs viewed from the subunit interface. Atomic displacement parameters in this and the following figures are colored according to the magnitude of the displacements, ramped from blue (smallest) to red (largest). The directional anisotropy of peripheral regions and the lack of mobility in the central regions suggest an inherent bias for rotation of the ribosomal subunits in a ‘ratchet-like’ mode.
The orientations and magnitudes of libration axes for the P- and E-site tRNAs show a striking correlation with the distortions of the tRNAs caused by their interactions with the ribosome 21; 25. The two longest librational axes of the E-site tRNA are nearly equal in magnitude (Figure 2a). Rotation of the structure of free tRNA by 4° and 7° consecutively around the E-tRNA libration reproduces the kink observed in the E-tRNA structure relative to that of free tRNA21, suggesting that the libration axes reflect the inherent directionality of E-tRNA movements. The librational motion of P-tRNA is highly anisotropic, and the relative eigenvalues of its libration tensor are greater than those for the E-tRNA (Figure 3a), consistent with the higher degree of distortion of the P-tRNA observed in the X-ray crystal structures 21; 25. Its primary axis goes through the D loop and between the A26 -G44 non-canonical base pair, making a ~45° angle with the anticodon stem-loop of P-tRNA; its second libration axis is orthogonal to the helical axis of the D stem. Interestingly, rotation of tRNA by ~10° around the primary axis followed by ~5° rotation around the second axis generates the kink in the anticodon arm centered at the A26-G44 pair which has been observed in the P, E and A/T states of tRNA 21; 25; 26. However, the observed distortion of the D loop, which is partially unwound only in the P-tRNA, orienting the acceptor arm towards the A site, cannot be generated by rotation around libration axes; this distortion would require rotation around the third libration axis, whose magnitude is 0. This may be an indication that treating tRNA as a single rigid group may be insufficient to account for the complexity of the distortion of tRNA conformation in the P site.
Figure 2.
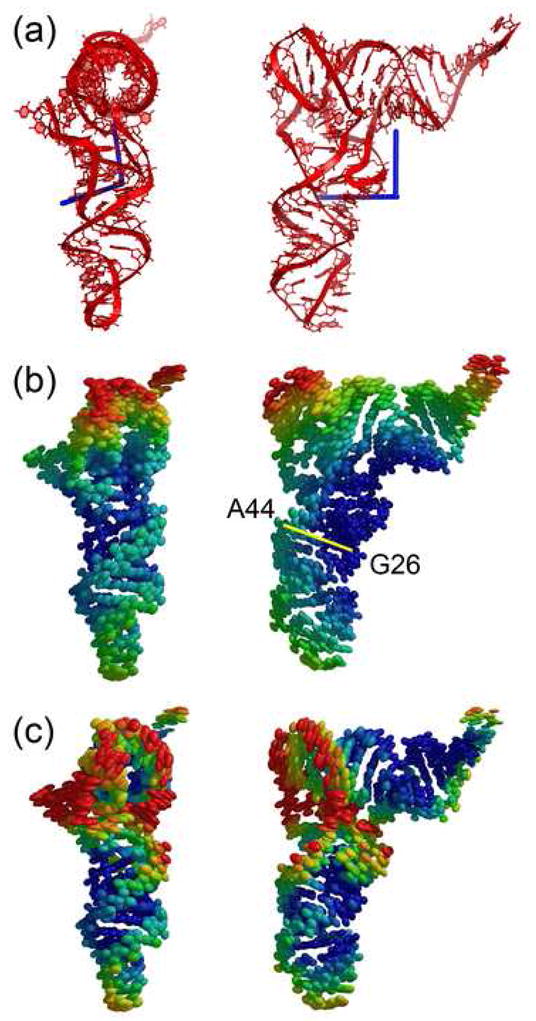
Libration axes and thermal ellipsoids for the E-site tRNA. (a) Libration axes. (b) Thermal ellipsoids for E-site tRNA represented as a single TLS group in a 4-TLS group refinement of the ribosome. (c) Thermal ellipsoids for E-site tRNA represented as 2 TLS groups in a 70-TLS group refinement of the ribosome.
Figure 3.
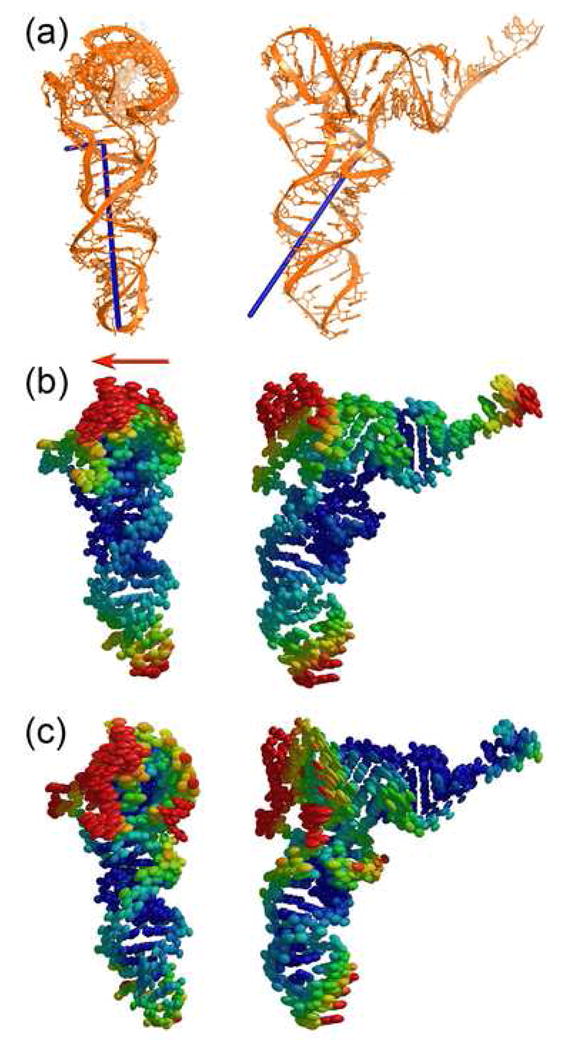
Libration axes and thermal ellipsoids for the P-site tRNA. (a) Libration axes. (b) Thermal ellipsoids for P-site tRNA represented as a single TLS group in a 4-TLS group refinement of the ribosome. Direction of translocation is shown by red arrow. (c) Thermal ellipsoids for P-site tRNA represented as 2 TLS groups in a 70-TLS group refinement of the ribosome.
The center of libration for both P- and E-site tRNAs is located near the D stem (Figures 2a, 3a), which leads to roughly similar distributions of the relative anisotropic disorder of the atoms. Representation of the TLS parameters in terms of atomic anisotropic displacement parameters suggests that in the P- and E-site tRNAs the A26-G44 base pair is among the least mobile regions (Figures 2b, 3b), consistent with the conclusion that this base pair represents one of the main hinge points of tRNA distortion21; 26. The most mobile region of tRNA is the elbow, consistent with the fact that this region of tRNA must travel by more than 50 Å during translocation. Interestingly, anisotropic displacement of the elbow is biased in the direction of translocation, orthogonal to the plane of the tRNA (Figures 2b, 3b).
TLS parameterization of the ribosome represented by 70 rigid groups
The ribosomal subunits contain features that are believed to move independently at different stages of protein synthesis26; 27; 28; 29. We have performed TLS refinement after splitting the ribosome into 70 rigid groups, represented by ribosomal proteins, tRNAs and rRNA domains (see Materials and Methods). The following discussion concerns TLS analysis of rRNA and tRNA.
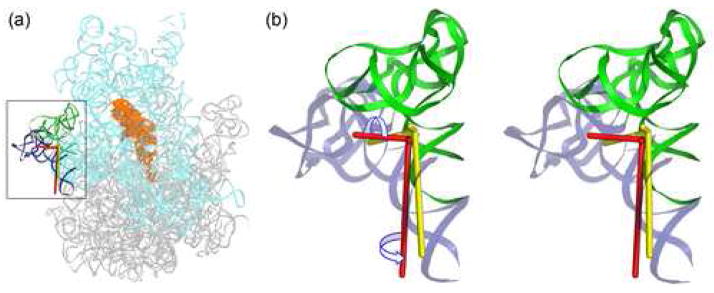
Division of the ribosome into 70 groups results in a TLS solution consistent with the ratchet-like mode of intersubunit rotation (REF). Both subunits exhibit dynamic behavior in which their central cores are less mobile than their peripheral parts (Figures 1d, 1e). The anisotropic displacement of both subunits is biased toward mutual rotation around the principal axes obtained from the 4-group TLS refinement (previous section), which is especially clear for the small ribosomal RNA (Figure 1e). The overall mean displacement of the 23S rRNA domains is smaller than that of the 16S rRNA domains (Table 1), suggesting that the large subunit is intrinsically less mobile than the small subunit, consistent with prior observations28;30. However, there are two regions of 23S rRNA that exhibit similar or even higher mobility than the mobile regions of 16S rRNA. The most mobile region of rRNA is the L1 stalk (Table 1), consistent with cryo-EM29 and X-ray structures21; 30; 31; 32, which show the L1 stalk in positions that differ by more than 30 Å between different structures. In the ribosome-tRNA complex, where the L1 stalk interacts with the elbow of E-site tRNA, the stalk is oriented toward the middle of the 50S subunit21, while in the vacant ribosome or in the individual large subunit structure the L1 stalk tilts away from the ribosome into solution30; 31, suggesting that its function is to remove the deacylated tRNA from the E site. Location of the libration axes outside of the L1 stalk structure (Figure 4) suggests that its displacement involves significant movement of most of the L1 stalk, consistent with its observed positions21; 30; 31; 32. Rotation around two major libration axes by ~50° with subsequent translation is sufficient to transform the position of the L1 stalk of the tRNA-bound ribosome into that of vacant ribosome (Figure 4). The lengths of the libration axes are not equal, most likely reflecting an additional component of L1 stalk mobility due to contact with the beak of the small subunit of a symmetry-related ribosome.
Table.
Libration tensor eigenvalues for the 3.7 Å tRNAPhe 20 and 3.8 Å tRNAfMet 21 70S ribosome complexes.
| 23S TLS Group | Eigenvalues | 16S TLS Group | Eigenvalues | ||
|---|---|---|---|---|---|
| tRNAPhe complex20 | tRNAfMet complex21 | tRNAPhe complex20 | tRNAfMet complex21 | ||
| Domain I and h26–35 | 0.098 | 0.015 | Body 1 | 0.204 | 0.185 |
| 1-810 & 2895–2902 | 0.055 | 0.052 | (h1–4 & h15–18) | 0.194 | 0.088 |
| 0.000 | 0.032 | 5–51 & 360–562 | 0.000 | 0.010 | |
| 0.051* | 0.033 | 0.133 | 0.094 | ||
| Domain II excluding h26–35 and h42–44 | 0.128 | 0.048 | Body 2 | 0.065 | 0.055 |
| 811–990 &1164–1270 | 0.085 | 0.034 | (h5–14) | 0.011 | 0.040 |
| 0.056 | 0.067 | 0.176 | 0.157 | ||
| 0.089 | 0.05 | 52–359 | 0.084 | 0.084 | |
| L11 stalk (h42–44) | 0.263 | 0.122 | Platform 1 | 0.307 | 0.070 |
| 991–1163 | 0.512 | 0.457 | (h19–20 & h24–27) | 0.394 | 0.172 |
| 0.086 | 0.058 | 563–588 & 756–919 | 0.000 | 0.025 | |
| 0.287 | 0.212 | 0.234 | 0.089** | ||
| Domain III | 0.236 | 0.127 | Platform 2 | 0.101 | 0.003 |
| 1271–1646 | 0.154 | 0.050 | (h21–23) | 0.253 | 0.142 |
| 0.057 | 0.099 | 0.000 | 0.059 | ||
| 0.149 | 0.092 | 589–755 | |||
| 0.118 | 0.068 | ||||
| Domain IV | 0.094 | 0.048 | Head 1 | 0.334 | 0.107 |
| 1647–2010 | 0.030 | 0.085 | (h28–29 & h41–43) | 0.042 | 0.000 |
| 0.000 | 0.000 | 920–949 & 1232–1396 | 0.129 | 0.213 | |
| 0.041 | 0.044 | 0.168 | 0.107 | ||
| Domain V excluding h74–88 | 0.217 | 0.045 | Beak | 0.431 | 0.178 |
| 2011–2058 &2448–2627 | 0.033 | 0.000 | (h30–34) | 0.562 | 0.590 |
| 0.000 | 0.059 | 950–1063 &1193–1231 | 0.000 | 0.123 | |
| 0.083 | 0.035 | 0.331 | 0.297 | ||
| Domain V excluding h73, h76–78, h89–93 | 0.122 | 0.000 | Head 3 | 0.309 | 0.178 |
| 2059–2092 &2197–2447 | 0.044 | 0.021 | (h35–40) | 0.019 | 0.045 |
| 0.025 | 0.101 | 1064–1192 | 0.271 | 0.395 | |
| 0.064 | 0.041 | 0.200 | 0.206 | ||
| L1 stalk (h76–78) | 0.119 | 0.085 | Penultimate stem and 3′ tail | 0.000 | 0.000 |
| 2093–2196 | 0.373 | 0.321 | (h44–45) | 0.082 | 0.051 |
| 0.965 | 0.863 | 1397–1529 | 0.677 | 0.254 | |
| 0.486 | 0.423 | 0.253 | 0.102 | ||
| Domain VI | 0.121 | 0.014 | |||
| 2628–2894 | 0.067 | 0.040 | |||
| 0.015 | 0.144 | ||||
| 0.067 | 0.066 | ||||
| Average for 23S | 0.146 | 0.111 | Average for 16S | 0.190 | 0.131 |
Three libration tensor eigenvalues are shown for each TLS group. The mean eigenvalues are given in bold.
The regions of 16S rRNA that contact the Shine-Dalgarno helix have significantly lower mobilities in the presence of a SD helix, and are indicated by underlined mean libration values.
Figure 4.
Libration axes for the L1 stalk. (a) Position of the L1 stalk relative to the rest of the ribosome. (b) Stereo view of the location and relative magnitudes of libration axes for the L1 stalk of the tRNAPhe complex (red) and tRNAfMet complex (yellow) are partially consistent with the movement required to displace the L1 stalk of the tRNA-bound complex (green) into the position observed in the vacant ribosome30 (blue). The relative magnitudes of the libration axes suggest that an additional anisotropic component may arise from a crystal contact involving the L1 stalk.
Another region of 23S rRNA demonstrating significant mean displacement is the L11 stalk. The L11 stalk interacts with EF-Tu and EF-G26; 33; 34; 35; 36 and is therefore implicated in the tRNA-binding and translocation functions. The largest displacement of L11 stalk atoms in the tRNAPhe complex (Figure 5) is in the direction which brings the L11 stalk into the conformation observed in the vacant ribosome, supporting the biological relevance of the dynamics information provided by TLS refinement for this region.
Figure 5.
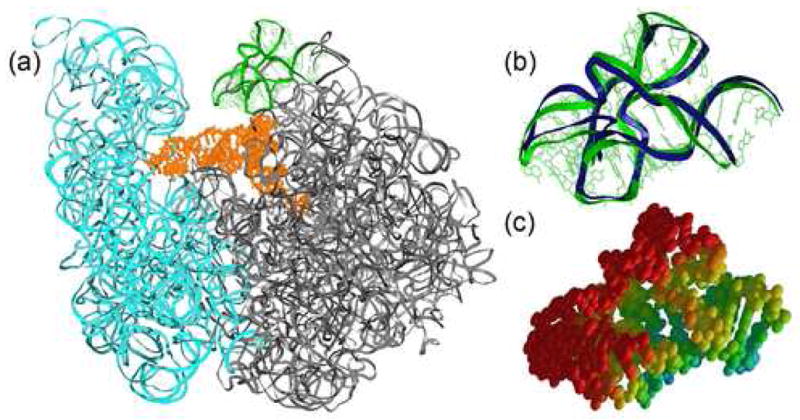
Anisotropic displacement of the L11 stalk derived from the 70-TLS group refinement. (a) Position of L11 stalk relative to the rest of the ribosome. (b) Differences between L11 stalk positions in the tRNAPhe complex (green) and the vacant ribosome30 (blue) structures when 23S rRNAs are superimposed. The direction of L11 stalk movement is consistent with anisotropic displacements obtained by TLS refinement. (c) Thermal ellipsoids.
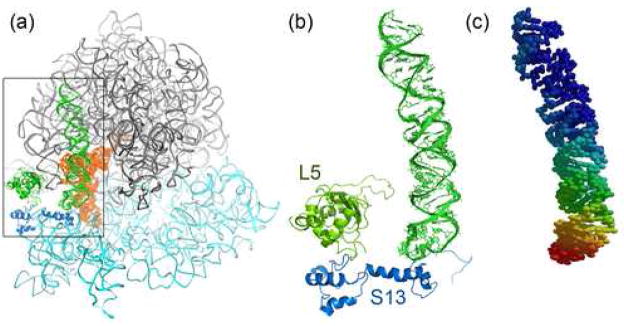
By examining the atomic anisotropic displacements represented by thermal ellipsoids derived from TLS tensors, we have found that the tip of h38 (the “A-site finger”) demonstrates anisotropy directed along the axis of α-helix 3 (amino acids 68–84) of small-subunit protein S13, with which it forms intersubunit bridge B1a (Figure 6). Direct comparison of the location of h38 with that in the vacant ribosome is not possible because h38 is disordered in the latter structure. However, ribosomal protein L5, which contacts S13 to form bridge B1b, is displaced anisotropically in the direction of h38 in the tRNAPhe complex21; 30. Together, these observations suggest that movement of the B1a and B1b bridges may be coupled, although there is no direct interaction between them.
Figure 6.
Anisotropic displacement of the A-site finger (h38) derived from the 70-TLS group refinement. (a) Position of the A-site finger relative to the rest of the ribosome. (b) Location of the A-site finger relative to proteins L5 and S13. (c) Thermal ellipsoids showing the bias of anisotropic displacement of the tip of the A-site finger along α-helix 3 of protein S13.
The most mobile part of the small subunit is its so-called beak, at the A-site end of the head (Table 1), whose anisotropic movements may reflect constraints imposed by contact with the L1 stalk of a symmetry-related ribosome. Its different observed orientations may thus be explained, at least in part, by differences in the lattice contacts between ribosomes crystallized in different crystal forms (Figure 7). At the underside of the head, helix 31, whose loop contacts the P-site tRNA anticodon loop via m2G966, is connected by two single-stranded RNA segments to the coaxial helix 30–32 arm. The h31 region shows anisotropic disorder directed between the 30S A and P sites (Figure 8), suggesting that it may be a mobile tRNA-binding element that can follow the movement of tRNA as it translocates from the 30S A site to the P site. The 3′-minor domain of 16S rRNA comprising h44–45 has a primary libration around an axis oriented almost parallel to the penultimate stem (h44) and located on its inner face. Rotation of the domain around this axis suggests that the outer side of the penultimate stem, which forms several bridges with the large subunit, moves more than the inner side. One of these 50S subunit contacts, bridge B3, is at or near the axis of intersubunit rotation37. This unusual anisotropic movement of h44 may be therefore be related in some way to the mechanics of translocation.
Figure 7.
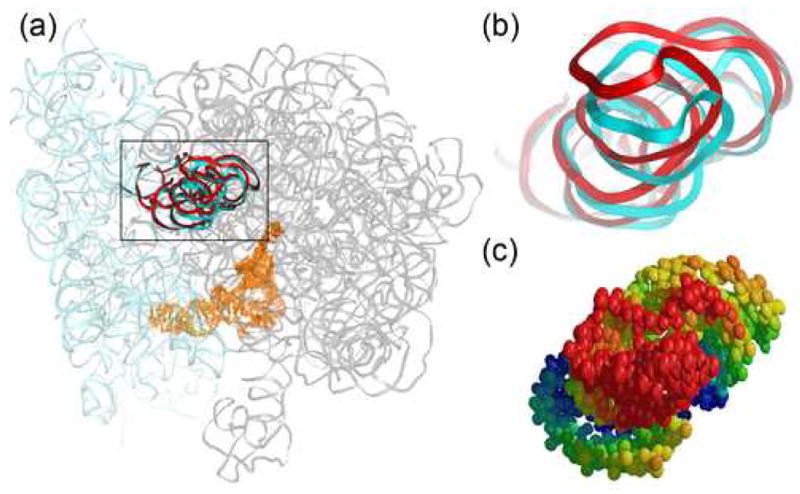
Anisotropic displacement of the tip of the 16S rRNA beak is likely influenced by crystal contacts. (a) Position of the beak relative to the rest of the ribosome. (b) Superposition of the tRNAPhe complex21 (cyan) structure with the similar structure of the 2.8Å tRNAfMet complex crystallized in a different crystal form25 (red). (c) Thermal ellipsoids derived from the 70-TLS group refinement.
Figure 8.
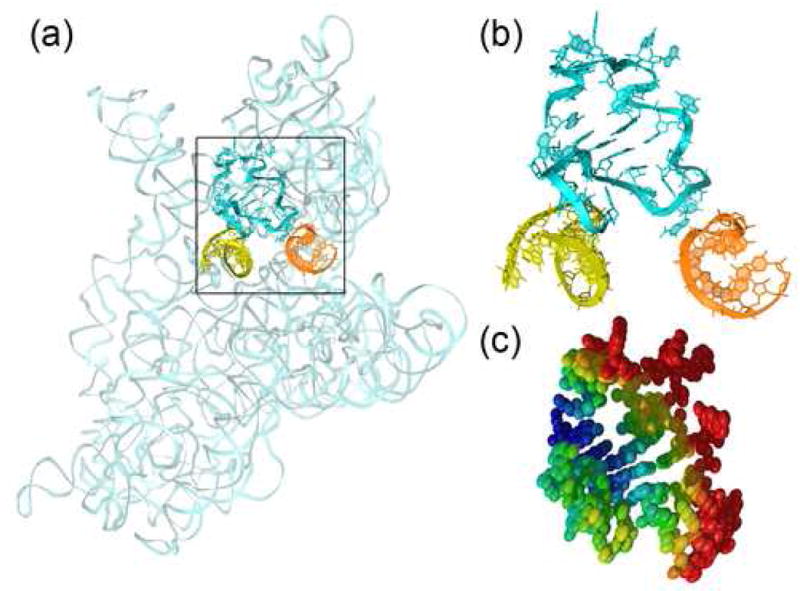
Anisotropic displacements at the base of the 16S rRNA beak suggest that h31 and its connecting loops may move between the 30S A and P sites. (a) Position of h31 relative to the rest of 16S rRNA. (b) Position of h31 (cyan) relative to the anticodon stem loops of the P- (orange) and A-site (yellow) tRNAs. (c) Thermal ellipsoids derived from the 70-TLS group refinement.
During the 70-group refinement of the ribosome, tRNA molecules were split into their anticodon arm and acceptor arm domains. The relative distribution of atomic anisotropic disorder overall is similar to that derived from refinement with tRNAs treated as single rigid groups (Figures 2 and 3), again placing A26 and G44 among the least mobile nucleotides and the elbow as the most disordered region. Anisotropic displacement of the P-tRNA elbow is biased in the direction of translocation, while the E-tRNA elbow does not show a uniform directional displacement.
Comparison with an independent 3.8-Å X-ray structure of the ribosome
In order to validate the results of TLS refinement of the tRNAPhe complex, TLS parameters were analyzed for an initiation-like 70S ribosome complex (tRNAfMet complex) determined at 3.8 Å resolution22. The tRNAfMet complex contains a tRNAfMet at the P site and endogenous tRNAs at the E-site and a mRNA with an eight base-pair Shine-Dalgarno-sequence. Root-mean square difference between the phosphate atoms of the ribosomal RNAs for the tRNAPhe and tRNAfMet ribosomes is 0.9 Å.
Eigenvalues of TLS libration tensors for the tRNAPhe and tRNAfMet complexes were strongly correlated for 23S rRNA and for 16S rRNA (correlation coefficients = 0.95 and 0.72, respectively). The lower correlation between 16S rRNAs is likely due to the difference between the mRNAs, as discussed below. In contrast, the eigenvalues for the ribosomal proteins are more weakly correlated (correlation coefficient = 0.30), suggesting that they are not representative of a general functional anisotropy for ribosomal proteins. When determined at resolutions of 3.5 Å and lower, amino-acid side chains of ribosomal proteins are more disordered than rRNA elements, as can be observed in electron density maps21 or by comparison of B factors of known structures solved at similar resolution21; 30; therefore, TLS formalism may largely reflect coordinate error rather than true functionally-related anisotropic displacements of ribosomal proteins. Alternatively, poor TLS parameterization of proteins might be caused by lack of strong restraints (e.g. covalent connections) between protein rigid groups. Since ribosomal RNA accounts for approximately 70% of the mass of the ribosome, and its TLS parameters are strongly correlated between the tRNAPhe and tRNAfMet complex structures, TLS analysis based on ribosomal RNA is more likely to be representative of true anisotropic motions of ribosomal subunits and their subdomains. This suggestion is also supported by the strong correlation between TLS-predicted movements and structural differences observed for the ribosome stalled in different functional states (Figures 4, 5).
TLS parameters for the tRNAfMet complex support the conclusion that the large subunit is generally less mobile than the small subunit, with the exception of the L1 and L11 stalks. (The L1 stalk and the beak of 16S rRNA have the highest average mean displacements around their respective librational axes.) The greatest discrepancy in mean displacements between the tRNAPhe and tRNAfMet complexes is for the 30S subunit neck, platform and 3′-minor domain. Interestingly, all of these regions include features that are constrained by formation of the Shine-Dalgarno (SD) interaction (helix 45 in the 3′ minor domain) or interact with the backbone of the SD helix (the neck and platform). In the tRNAPhe complex, which contains a short mRNA lacking a SD sequence 21, these subdomains are signficantly more mobile (average displacement of 0.193) than those in the tRNAfMet complex (average displacement of 0.091), which contains a Shine-Dalgarno helix (Table 1). Thus, the Shine-Dalgarno helix appears to restrain the mobility of the small subunit subdomains with which it interacts. This might play a role in optimal positioning of the small subunit for interaction with initiator tRNA during initiation, (for example, promoting optimal interaction between G1338 and A1339 with the minor groove of the anticodon stem 25; 38; 39 as was proposed based on comparison of the tRNA-containing ribosome complex with structures of vacant ribosomes and with that representing an elongation-like complex 30; 37.
Analysis of anisotropic motions for the tRNAPhe and tRNAfMet complexes demonstrates that TLS formalism can be applied at lower resolution and to large macromolecular complexes, with some limitations. We have shown that for ribosome structures solved at 3.7–3.8 Å, only ribosomal RNA can be used for interpretation of anisotropic displacements. Therefore, care must be taken when TLS parameters are interpreted at such resolution; it is recommended that TLS results be validated against other biophysical or structural data.
Conclusions
The observed atomic displacements in the 70S ribosome complex are not random in nature but are directed along pathways that often coincide with the directions of movements that are believed to accompany the processes of protein synthesis. The magnitudes of the TLS librations, however, do not always strictly reflect the functional dynamics of the ribosome, but are sometimes also influenced by constraints dictated by the crystallographic environment. For the most part, the observed anisotropic motions of tRNA molecules, ribosomal subunits and their subdomains are consistent with large-scale rearrangements that have been detected by X-ray crystallography 25; 30; 31; 37, cryo-EM26; 27; 28; 29 and other biophysical experiments2.
Materials and Methods
Starting models and diffraction data
The structures of the 3.7 Å tRNAPhe 21 and 3.8 Å tRNAfMet 22 T. thermophilus ribosomal complexes containing mRNA, P- and E-tRNAs were downloaded from the Protein Data Bank40 (PDB accession codes 2OW8 and 1VSA for the former and XXX for the latter). Their structures were obtained by real-space 41 and reciprocal-space simulated annealing torsion-angle dynamics and B-group refinement methods 42 as described in Korostelev et al (2006), with the starting models for the structures of ribosomal proteins L15, L19, L21, L28 and L29 adapted from the recent 2.8 Å model of the ribosome 25. Due to limitations of the 3.7–3.8 Å resolution, grouped isotropic B-factors for amino acids and nucleotides, rather than for individual atoms, are available for both models. Structure factor amplitudes, experimental error estimates, and cross-validation information were downloaded from the PDB for the tRNAPhe and tRNAfMet 70S ribosomal complexes.
TLS refinement procedure
TLS refinement was carried out in REFMAC 5.211 and led to reduction in R/Rfree from 0.365/0.369 (tRNAPhe complex) and 0.342/0362 (tRNAfMet complex) to 0.348/0.359 and 0.324/0.352, respectively. Prior to refinement, all atomic temperature factors were set to a constant value of 60 Å2. A bulk solvent correction model with the parameters of the mask optimized to 1.8 Å (VDWProb), 1.8 Å (IONProb) and 1.1 Å (RSHRink), and overall anisotropic scaling were applied. TLS refinements were carried out using the amplitude-based maximum likelihood function. The refinements converged after 3–5 cycles; no significant change in R/Rfree was observed when more than 3 refinement cycles were carried out. Convergence was also indicatedby the similarities between TLS tensors resulting from refinements carried out for 3 and 10 cycles. Each cycle of TLS refinement was followed by only 1 to 2 rounds of positional and B-factor refinement with damping factors of 0.25 (for positional and B-factor shifts at each step) in order to minimize overfitting.
Choice of the number of TLS groups
Each TLS group contributes 20 refinement parameters; therefore, using up to 100 TLS groups does not significantly increase the total number of refinement parameters for the ribosome, which has nearly 150,000 atoms. We have tested TLS refinements using 4, 70 and 100 TLS groups. Since ribosomes consist of two subunits, which have been shown to move with respect to each other during translocation1; 2; 3, the two subunits and the two tRNAs bound to the P and E sites were treated as individual rigid bodies in 4-group TLS refinements. The rationale for using 70 TLS groups comes from the observation that ribosomal proteins, subdomains of ribosomal RNA and of tRNAs can move with respect to each other at different stages of protein synthesis26; 28. Thus, the next ‘crude’ division of the ribosome involved treating each of the ribosomal proteins (47 proteins are modeled in each of the 70S complexes used), 5S rRNA, 9 subdomains of 23S rRNA (Table 1), 8 subdomains of 16S rRNA (Table 1), anticodon arm (nucleotides 8–48) and acceptor arm (nucleotides 1–7 and 49–76) domains of tRNAs (for both P- and E-site tRNAs) as individual TLS groups. The designation of the boundaries of different groups within the ribosomal RNAs was based on our knowledge of the domain structure of the rRNA. The regions connecting well-defined subdomains were chosen as boundaries and did not include secondary structure elements such as helices and loops. mRNA was not included in the TLS refinement of the tRNAPhe complex since only 6 nucleotides of mRNA are modeled. In the tRNAfMet 70S complex, the 5′ region of the modeled 18-nucleotide mRNA forms the Shine-Dalgarno helix with the 3′ tail of the small-subunit rRNA and therefore the mRNA was combined with the 3′-terminal nucleotides (1534–1541) of 16S rRNA into one group. Overall, 69 TLS groups were used for the tRNAPhe complex and 70 groups for the tRNAfMet complex; for simplicity, both refinements are referred to as 70-group refinements. During the 100-group TLS refinement, 16S and 23S rRNAs were split into finer pieces comprised of secondary structure elements.
Refinement of 70 TLS groups yielded R/Rfree values that were marginally lower than those obtained by refinement of 4 TLS groups (0.3478/0.359 vs. 0.3486/0.3599), while TLS refinement with 100 TLS domains was unstable and led to negative eigenvalues for librational tensors. Similar crystallographic residuals for the 4- and 70-domain TLS refinements might suggest that modeling the ribosome as 4 TLS regions is sufficient to infer most of the ribosome dynamics information that TLS refinement can provide. In order to test this hypothesis, we have analyzed the TLS-derived temperature factors for 23S rRNA, which is the largest constituent of the ribosome. 23S rRNA was treated as a single TLS group (combined with 5S rRNA and large-subunit proteins) during the 4-group refinement and was split into 9 subdomains (Table 1) in the 70-group refinement. Isotropic B factors were calculated as the traces of the corresponding atomic anisotropic temperature factors derived from decomposition of the TLS tensors43. These isotropic B factors (Biso) were averaged for each residue of 23S rRNA and then compared to the original grouped B-factors (Bgroup), which range between 15 and 200. Since the residual (Bres) resulting from TLS refinement refined to values lower than 15 (as low as 3 for the 4-group refinement and 1 for the 70-group refinement), a scaling factor was applied to Bres and Biso so that Biso values range between 15 and 200 and thus are on the same scale as Bgroup. Comparison of the isotropic B-factors with grouped B-factors revealed that the 70-group TLS refinement leads to a significantly better description of the temperature factors than the 4-group refinement (Figure 9): the correlation coefficient for the residue-averaged Biso with Bgroup for the whole 23S rRNA (2902 nucleotides) is 1.5 times higher for the 70-group refinement than that for the 4-group refinement (0.5 vs 0.33). This suggests that while there is only marginal improvement in R/Rfree upon splitting of the ribosome into finer TLS groups, the 70-group TLS analysis provides a more detailed characterization of the structural dynamics of the ribosome.
Figure 9.
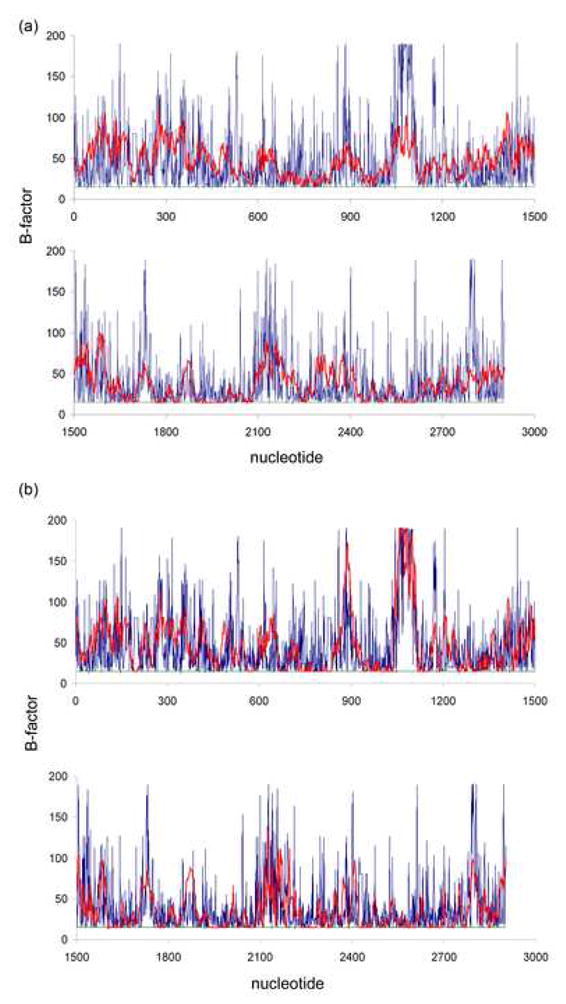
Modeling of isotropic B factors by TLS refinement. Residue-averaged TLS-derived B factors (Biso, red) and grouped B factors of the initial 70S ribosome model (Bgroup, blue) are plotted vs. corresponding nucleotides of the 23S ribosomal RNA. Biso factors resulting from the 4-group refinement (a) are less well correlated with the Bgroup factors from the initial model than those resulting from the 70-group refinement (b) (correlation coefficients are 0.33 and 0.5, respectively). The residual B factor after TLS refinement (green) is low and essentially constant, which reflects the stability of the TLS refinements.
Parameterization of 70 TLS groups for the tRNAPhe and tRNAfMet 70S ribosome structures leads to the following results. Unlike libration, the translational and screw tensors have eigenvalues that are approximately equal in all directions and small in absolute value for the different rigid groups, yielding average mean-square displacements of less than 0.008 A2 (translation) and 0.007 A*degree (screw) for the whole ribosome. The average mean-square displacement around librational axes is 0.51 degree2, indicating that librational motion has the most significant contribution to anisotropic disorder of the ribosomal rigid groups. Eigenvalues of the librational tensors are positive for all TLS groups, showing that TLS refinement was stable and that assignment of rigid groups is physically reasonable.
Atomic anisotropic displacement parameters were calculated by using TLSANL43 by decomposition of the TLS tensors. TLSANL was also employed to generate axes and to calculate eigenvalues for tensors representing translational, librational and screw motions. Pymol44 and Rastep45 were used for visualization of atomic models, TLS axes and atomic thermal ellipsoids. Coordinates for librational axes of ribosomal RNA regions presented in Table 1 can be downloaded in PDB format from http://rna.ucsc.edu/rnacenter/pdb/TLS_axes_rRNA_3.7A.pdb
Acknowledgments
This work was supported by grants No. GM-17129 and GM-59140 (to H.F.N.) from the NIH. We would like to thank Sergei Trakhanov and Martin Laurberg for
Footnotes
Publisher's Disclaimer: This is a PDF file of an unedited manuscript that has been accepted for publication. As a service to our customers we are providing this early version of the manuscript. The manuscript will undergo copyediting, typesetting, and review of the resulting proof before it is published in its final citable form. Please note that during the production process errors may be discovered which could affect the content, and all legal disclaimers that apply to the journal pertain.
References
- 1.Frank J, Agrawal RK. A ratchet-like inter-subunit reorganization of the ribosome during translocation. Nature. 2000;406:318–22. doi: 10.1038/35018597. [DOI] [PubMed] [Google Scholar]
- 2.Ermolenko DN, Majumdar ZK, Hickerson RP, Spiegel PC, Clegg RM, Noller HF. Observation of Intersubunit Movement of the Ribosome in Solution Using FRET. J Mol Biol. 2007 doi: 10.1016/j.jmb.2007.04.042. [DOI] [PubMed] [Google Scholar]
- 3.Horan LH, Noller HF. Intersubunit movement is required for ribosomal translocation. Proc Natl Acad Sci U S A. 2007;104:4881–5. doi: 10.1073/pnas.0700762104. [DOI] [PMC free article] [PubMed] [Google Scholar]
- 4.Pestka S. Studies on the formation of transfer ribonucleic acid-ribosome complexes. VI. Oligopeptide synthesis and translocation on ribosomes in the presence and absence of soluble transfer factors. J Biol Chem. 1969;244:1533–9. [PubMed] [Google Scholar]
- 5.Gavrilova LP, Spirin AS. Stimulation of “non-enzymic” translocation in ribosomes by p-chloromercuribenzoate. FEBS Lett. 1971;17:324–326. doi: 10.1016/0014-5793(71)80177-1. [DOI] [PubMed] [Google Scholar]
- 6.Gavrilova LP, Kostiashkina OE, Koteliansky VE, Rutkevitch NM, Spirin AS. Factor-free (“non-enzymic”) and factor-dependent systems of translation of polyuridylic acid by Escherichia coli ribosomes. J Mol Biol. 1976;101:537–52. doi: 10.1016/0022-2836(76)90243-6. [DOI] [PubMed] [Google Scholar]
- 7.Southworth DR, Brunelle JL, Green R. EFG-independent translocation of the mRNA:tRNA complex is promoted by modification of the ribosome with thiol-specific reagents. J Mol Biol. 2002;324:611–23. doi: 10.1016/s0022-2836(02)01196-8. [DOI] [PubMed] [Google Scholar]
- 8.Fredrick K, Noller HF. Catalysis of ribosomal translocation by sparsomycin. Science. 2003;300:1159–62. doi: 10.1126/science.1084571. [DOI] [PubMed] [Google Scholar]
- 9.Cruickshank DWJ. The determination of the anisotropic thermal motion of atoms in crystals. Acta Cryst. 1956;9:747–753. [Google Scholar]
- 10.Dunitz JD, Schomaker V, Trueblood KN. Interpretation of atomic displacement parameters from diffraction studies of crystals. J Phys Chem. 1988;92(4):856–867. [Google Scholar]
- 11.Winn MD, Murshudov GN, Papiz MZ. Macromolecular TLS refinement in REFMAC at moderate resolutions. Methods Enzymol. 2003;374:300–21. doi: 10.1016/S0076-6879(03)74014-2. [DOI] [PubMed] [Google Scholar]
- 12.Harata K, Abe Y, Muraki M. Crystallographic evaluation of internal motion of human alpha-lactalbumin refined by full-matrix least-squares method. J Mol Biol. 1999;287:347–58. doi: 10.1006/jmbi.1999.2598. [DOI] [PubMed] [Google Scholar]
- 13.Wilson MA, Brunger AT. The 1.0 A crystal structure of Ca(2+)-bound calmodulin: an analysis of disorder and implications for functionally relevant plasticity. J Mol Biol. 2000;301:1237–56. doi: 10.1006/jmbi.2000.4029. [DOI] [PubMed] [Google Scholar]
- 14.Diamond R. On the use of normal modes in thermal parameter refinement: theory and application to the bovine pancreatic trypsin inhibitor. Acta Cryst. 1990;A46:425–435. doi: 10.1107/s0108767390002082. [DOI] [PubMed] [Google Scholar]
- 15.Kidera A, Go N. Normal mode refinement: crystallographic refinement of protein dynamic structure. I. Theory and test by simulated diffraction data. J Mol Biol. 1992;225:457–75. doi: 10.1016/0022-2836(92)90932-a. [DOI] [PubMed] [Google Scholar]
- 16.Yousef MS, Clark SA, Pruett PK, Somasundaram T, Ellington WR, Chapman MS. Induced fit in guanidino kinases--comparison of substrate-free and transition state analog structures of arginine kinase. Protein Sci. 2003;12:103–11. doi: 10.1110/ps.0226303. [DOI] [PMC free article] [PubMed] [Google Scholar]
- 17.Chaudhry C, Horwich AL, Brunger AT, Adams PD. Exploring the structural dynamics of the E. coli chaperonin GroEL using translation-libration-screw crystallographic refinement of intermediate states. J Mol Biol. 2004;342:229–45. doi: 10.1016/j.jmb.2004.07.015. [DOI] [PubMed] [Google Scholar]
- 18.Schomaker V, Trueblood KN. On the rigid-body motion of molecules in crystals. Acta Cryst. 1968;B24:63–76. [Google Scholar]
- 19.Schomaker V, Trueblood KN. Correlation of Internal Torsional Motion with Overall Molecular Motion in Crystals. Acta Cryst. 1998;B54:507–514. [Google Scholar]
- 20.Howlin B, Moss DS, Harris GW. Segmented anisotropic refinement of bovine ribonuclease A by the application of the rigid-body TLS model. Acta Cryst. 1989;A45:851–861. doi: 10.1107/s0108767389009177. [DOI] [PubMed] [Google Scholar]
- 21.Korostelev A, Trakhanov S, Laurberg M, Noller HF. Crystal structure of a 70S ribosome-tRNA complex reveals functional interactions and rearrangements. Cell. 2006;126:1065–77. doi: 10.1016/j.cell.2006.08.032. [DOI] [PubMed] [Google Scholar]
- 22.Korostelev A, Trakhanov S, Asahara H, Laurberg M, Noller HF. Interactions and Dynamics of the Shine-Dalgarno Helix in the 70S Ribosome. Proc Natl Acad Sci U S A. 2007 doi: 10.1073/pnas.0707850104. (in press) [DOI] [PMC free article] [PubMed] [Google Scholar]
- 23.Ogle JM, Brodersen DE, Clemons WM, Tarry MJ, Carter AP, Ramakrishnan V. Recognition of cognate transfer RNA by the 30S ribosomal subunit. Science. 2001;292:897–902. doi: 10.1126/science.1060612. [DOI] [PubMed] [Google Scholar]
- 24.Schmeing TM, Huang KS, Strobel SA, Steitz TA. An induced-fit mechanism to promote peptide bond formation and exclude hydrolysis of peptidyl-tRNA. Nature. 2005;438:520–4. doi: 10.1038/nature04152. [DOI] [PubMed] [Google Scholar]
- 25.Selmer M, Dunham CM, Murphy FVt, Weixlbaumer A, Petry S, Kelley AC, Weir JR, Ramakrishnan V. Structure of the 70S ribosome complexed with mRNA and tRNA. Science. 2006;313:1935–42. doi: 10.1126/science.1131127. [DOI] [PubMed] [Google Scholar]
- 26.Valle M, Zavialov A, Li W, Stagg SM, Sengupta J, Nielsen RC, Nissen P, Harvey SC, Ehrenberg M, Frank J. Incorporation of aminoacyl-tRNA into the ribosome as seen by cryo-electron microscopy. Nat Struct Biol. 2003;10:899–906. doi: 10.1038/nsb1003. [DOI] [PubMed] [Google Scholar]
- 27.Valle M, Zavialov A, Sengupta J, Rawat U, Ehrenberg M, Frank J. Locking and unlocking of ribosomal motions. Cell. 2003;114:123–34. doi: 10.1016/s0092-8674(03)00476-8. [DOI] [PubMed] [Google Scholar]
- 28.Gao H, Sengupta J, Valle M, Korostelev A, Eswar N, Stagg SM, Van Roey P, Agrawal RK, Harvey SC, Sali A, Chapman MS, Frank J. Study of the structural dynamics of the E coli 70S ribosome using real-space refinement. Cell. 2003;113:789–801. doi: 10.1016/s0092-8674(03)00427-6. [DOI] [PubMed] [Google Scholar]
- 29.Tama F, Valle M, Frank J, Brooks CL., 3rd Dynamic reorganization of the functionally active ribosome explored by normal mode analysis and cryo-electron microscopy. Proc Natl Acad Sci U S A. 2003;100:9319–23. doi: 10.1073/pnas.1632476100. [DOI] [PMC free article] [PubMed] [Google Scholar]
- 30.Schuwirth BS, Borovinskaya MA, Hau CW, Zhang W, Vila-Sanjurjo A, Holton JM, Cate JH. Structures of the bacterial ribosome at 3.5 A resolution. Science. 2005;310:827–34. doi: 10.1126/science.1117230. [DOI] [PubMed] [Google Scholar]
- 31.Harms J, Schluenzen F, Zarivach R, Bashan A, Gat S, Agmon I, Bartels H, Franceschi F, Yonath A. High resolution structure of the large ribosomal subunit from a mesophilic eubacterium. Cell. 2001;107:679–88. doi: 10.1016/s0092-8674(01)00546-3. [DOI] [PubMed] [Google Scholar]
- 32.Ban N, Nissen P, Hansen J, Moore PB, Steitz TA. The complete atomic structure of the large ribosomal subunit at 2.4 Å resolution. Science. 2000;289:905–20. doi: 10.1126/science.289.5481.905. [DOI] [PubMed] [Google Scholar]
- 33.Moazed D, Robertson JM, Noller HF. Interaction of elongation factors EF-G and EF-Tu with a conserved loop in 23S RNA. Nature. 1988;334:362–364. doi: 10.1038/334362a0. [DOI] [PubMed] [Google Scholar]
- 34.Agrawal RK, Heagle AB, Penczek P, Grassucci RA, Frank J. EF-G-dependent GTP hydrolysis induces translocation accompanied by large conformational changes in the 70S ribosome. Nat Struct Biol. 1999;6:643–7. doi: 10.1038/10695. [DOI] [PubMed] [Google Scholar]
- 35.Agrawal RK, Penczek P, Grassucci RA, Frank J. Visualization of elongation factor G on the Escherichia coli 70S ribosome: the mechanism of translocation. Proc Natl Acad Sci U S A. 1998;95:6134–8. doi: 10.1073/pnas.95.11.6134. [DOI] [PMC free article] [PubMed] [Google Scholar]
- 36.Stark H, Rodnina MV, Wieden HJ, van Heel M, Wintermeyer W. Large-scale movement of elongation factor G and extensive conformational change of the ribosome during translocation. Cell. 2000;100:301–9. doi: 10.1016/s0092-8674(00)80666-2. [DOI] [PubMed] [Google Scholar]
- 37.Yusupov M, Yusupova G, Baucom A, Lieberman K, Earnest TN, Cate JH, Noller HF. Crystal Structure of the Ribosome at 5.5 Å Resolution. Science. 2001;292:883–896. doi: 10.1126/science.1060089. [DOI] [PubMed] [Google Scholar]
- 38.Dallas A, Noller HF. Interaction of Translation Initiation Factor 3 with the 30S Ribosomal Subunit. Mol Cell. 2001;8:855–64. doi: 10.1016/s1097-2765(01)00356-2. [DOI] [PubMed] [Google Scholar]
- 39.Lancaster L, Noller HF. Involvement of 16S rRNA nucleotides G1338 and A1339 in discrimination of initiator tRNA. Mol Cell. 2005;20:623–32. doi: 10.1016/j.molcel.2005.10.006. [DOI] [PubMed] [Google Scholar]
- 40.Berman HM, Battistuz T, Bhat TN, Bluhm WF, Bourne PE, Burkhardt K, Feng Z, Gilliland GL, Iype L, Jain S, Fagan P, Marvin J, Padilla D, Ravichandran V, Schneider B, Thanki N, Weissig H, Westbrook JD, Zardecki C. The Protein Data Bank. Acta Crystallogr D Biol Crystallogr. 2002;58:899–907. doi: 10.1107/s0907444902003451. [DOI] [PubMed] [Google Scholar]
- 41.Korostelev A, Bertram R, Chapman MS. Simulated-annealing real-space refinement as a tool in model building. Acta Crystallogr D Biol Crystallogr. 2002;58:761–7. doi: 10.1107/s0907444902003402. [DOI] [PubMed] [Google Scholar]
- 42.Brünger AT, Adams PD, Clore GM, DeLano WL, Gros P, Grosse-Kunstleve RW, Jiang JS, Kuszewski J, Nilges M, Pannu NS, Read RJ, Rice LM, Simonson T, Warren GL. Crystallography & NMR system: A new software suite for macromolecular structure determination. Acta Crystallogr D Biol Crystallogr. 1998;54:905–21. doi: 10.1107/s0907444998003254. [DOI] [PubMed] [Google Scholar]
- 43.Howlin B, Butler SA, Moss DS, Harris GW, Driessen HPC. TLSANL: TLS parameter-analysis program for segmented anisotropic refinement of macromolecular structures. J Appl Cryst. 1993;26:622–624. [Google Scholar]
- 44.DeLano WL. The PyMOL Molecular Graphics System User’s Manual 2002 [Google Scholar]
- 45.Merritt EA, Murphy MEP. Raster3D Version 2.0: A Program for Photorealistic Molecular Graphics. Acta Cryst D. 1994;50:869–873. doi: 10.1107/S0907444994006396. [DOI] [PubMed] [Google Scholar]


