

Abstract
Measuring extracellular dopamine in the brain of living animals by means of microdialysis and/or voltammetry is a route towards understanding both normal brain function and pathology. Previous reports, however, suggest that the tissue response to implantation of devices may affect the outcome of the measurements. To address the source of the tissue response and its impact on striatal dopamine systems microdialysis probes were placed in the striatum of anesthetized rats. Images obtained by dual-label fluorescence microscopy show signs of ischemia and opening of the blood-brain barrier near the probe tracks. Opening of the blood-brain barrier was further examined by determining dialysate concentrations of carbi-DOPA, a drug that normally does not penetrate the brain. Although carbi-DOPA was recovered in brain dialysate, it did not alter dialysate dopamine levels or evoked dopamine release as measured by voltammetry near the probes. Microdialysis probes also significantly diminished the effect of intrastriatal infusion of kynurenate on extracellular dopamine levels as measured by voltammetry near the probes.
1. Introduction
Dopamine (DA) plays a crucial role in a variety of cognitive and motor functions (Groto et al., 2007) and is implicated in a number of pathologies including substance abuse (Koob and Bloom, 1988), Parkinson's disease (Cookson, 2005), and attention-deficit hyperactivity disorder (Martinez-Leon, 2006). Measuring DA levels in the brain extracellular space (ECS) of living animals with in vivo microdialysis and/or voltammetry continues to be a mainstay of investigations into both the normal and pathological function of central DAergic systems (Kawagoe et al., 1993; Smith and Justice, 1994; DiChiara et al., 1996; Jones et al., 1998; Garris et al., 1999; Jones et al., 1999; Kulagina et al., 2001; Borland and Michael, 2004; Wightman et al., 2007). Voltammetric measurements, however, reveal the presence of a gradient of DAergic activity in the tissues surrounding microdialysis probes (Borland et al., 2005; Yang and Michael, 2007). We hypothesize that the DAergic gradient is a component of the tissue response to the implantation of the microdialysis probe, a process known to cause tissue trauma (Clapp-Lilly et al., 1999; Zhou et al., 2001). We further hypothesize that the DAergic gradient is the source of disparities between ECS DA levels as measured by voltammetry and microdialysis (Lu et al., 1998; Yang et al., 1998; Qian et al., 1999; Bungay et al., 2003; Borland et al., 2005). This matter is far from fully resolved, however, as other studies report good agreement between in vivo DA levels measured by these techniques (Heien et al., 2005; Wightman et al., 2007). Furthermore, electrophysiological studies find that neurons about 500 μm from microdialysis probes show normal baseline behavior and are responsive to drugs delivered via reverse dialysis (West and Grace 2002; West et al., 2002; van Duuren et al., 2007). The objective of the present study, therefore, is to further characterize the status and DAergic activity of the tissue surrounding microdialysis probes implanted in the rat striatum.
During our recent histological examination of microelectrode implantation sites (Peters et al., 2004) we noticed that the distance between blood vessels in the rat striatum (∼50−60 μm) is considerably less than the diameter of microdialysis probes (≥ ∼220 μm). This observation prompted us to question whether microdialysis probes affect the local microvasculature at the implantation site. This appears to be an important question as DAergic terminals are particularly sensitive to ischemia (for a review, see section 7.1 of Leviel, 2001). We employed dual-label fluorescence microscopy to image blood vessels in horizontal tissue sections containing probe tracks. Blood vessels were labeled with dye-laden polystyrene nanobeads (100 nm in diameter) delivered to the brain by transcardial perfusion. Tissue sections were also processed with antibodies to the platelet endothelial cell adhesion molecule (antiPECAM), a histochemical marker for endothelial cells. Although studies on the response of brain tissue to implants exist (Szarowski et al., 2003), to our knowledge this is the first application of this imaging modality to the issue of how an intracranial implant might affect the local brain vasculature.
Florescence microscopy revealed signs of ischemia and opening of the blood-brain barrier (BBB) near the probe tracks. Thus, we conducted carry-on studies using carbi-DOPA as a probe of BBB permeability. Carbi-DOPA is useful in the treatment of Parkinson's disease because it acts in the periphery to protect l-DOPA from enzymatic decarboxylation but does not interfere with the conversion l-DOPA to DA in the brain (Kaakkola et al., 1992). We measured carbi-DOPA in striatal dialysates using microcolumn HPLC with PFET detection, which in our experience is significantly more sensitive towards carbi-DOPA than traditional electrochemical detection (Jung et al., 2006a; Jung et al., 2006b). Indeed, systemic administration of carbi-DOPA was quickly followed by the appearance of the drug in striatal dialysates. Despite the fact that carbi-DOPA penetrated the BBB, it did not affect dialysate DA levels or evoked DA release as measured by voltammetry near the probes.
We also assessed the effect of kynurenate (KYNA) on extracellular DA levels as measured by voltammetry near microdialysis probes. Kynurenate is a broad-spectrum antagonist of the ionotropic glutamate receptors (e.g. Ivanova et al., 2003; although, see also Wu et al., 2007). According to our voltammetric studies, microinfusion of KYNA directly into the striatum decreases ECS DA from the basal level (Kulagina et al., 2001; Borland and Michael 2004). Although a recent microdialysis study also found that KYNA decreases ECS DA (Wu et al., 2007), our findings were unexpected for two reasons. First, the micromolar magnitude of the recorded decrease in DA concentration far exceeds the nanomolar basal DA concentrations in dialysates (e.g. Smith and Justice, 1994; Qian et al., 1999; Borland et al., 2005). Second, the effect of KYNA was insensitive to tetrodotoxin (TTX) and sensitive to nomifensine, consistent with the classical profile of reverse DA transport (Leviel 2001). However, microdialysis findings suggest that basal DA levels are derived entirely from impulse-dependent DA release (Westerink and deVries, 1988; Westerink et al., 1989). On the other hand, our conclusion that the striatal ECS might contain a pool of DA derived from glutamate-triggered reverse-transport is consistent with the finding of the in vitro study of Lonart and Zigmond (1991). During the present study we found that the voltammetric response to KYNA infusion is significantly diminished near microdialysis probes, suggesting the possibility that alterations of basal reverse DA transport might also be a component of the tissue response to the probes.
2. Materials and Methods
2.1. Chemicals and solutions
2-methylbutane was obtained from Alfa Aesar (Ward Hill, MA). BSA, Triton-X 100, chloral hydrate, carbi-DOPA, kynurenic acid and dopamine were used as received from Sigma (St. Louis, MO). Sucrose, BSA and chloral hydrate were dissolved in phosphate buffered saline (PBS: 155 mM NaCl, 100 mM phosphate, pH 7.4). Perfusion solutions include 2% paraformaldehyde in 0.1 M phosphate buffer pH 7.3 (stored at 4°C) and a 0.1% solution of yellow-green fluorescent nanobeads as received (0.1 μm diameter, FluoSpheres® carboxylate-modified polystyrene microsphere suspensions (2% solids) in water plus 2 mM sodium azide, Molecular Probes, Inc., Eugene, OR) in PBS . Sucrose was obtained from Fisher (Fisher Scientific, Pittsburgh, PA). Carbi-DOPA was administered as a suspension in PBS. Probes were perfused with artificial cerebrospinal fluid (aCSF: 144 mM Na+, 1.2 mM Ca2+, 2.7 mM K+, 152 mM Cl−, 1.0 mM Mg2+, and 2.0 M PO43− adjusted to pH 7.4 with NaOH). Kynurenic acid was also dissolved in aCSF. Gelvatol was prepared by dissolving 20 g polyvinyl alcohol (Sigma, St. Louis, MO) in 80 ml of 0.14 M NaCl solution buffered with 0.01 M KH2PO4-Na2HPO4 at pH 7.2 and stirring for 16 h. After the addition of 40 mL glycerol (Sigma, St. Louis) the solution was stirred for 16 h and centrifuged at 12000 rpm. The supernatant pH was confirmed to be near 7. 100 mg/ml DABCO (1,4-diazabicyclo [2.2.2] octane; Sigma, St. Louis, MO) was added. The solution was stored in an airtight bottle. All solutions were prepared with ultrapure water (NANOPure; Barnstead, Dubuque, IA).
2.2. Microdialysis probes
Vertical, concentric microdialysis probes (280 μm o.d., 4 mm long) were constructed with hollow fiber dialysis membrane (Spectra-Por RC Hollow Fiber, MWCO: 13,000, 160 μm i.d., Spectrum Laboratories, Inc., Rancho Dominguez, CA) and fused silica outlet lines (150 μm o.d., 75 μm i.d., Polymicro Technologies, Phoenix, AZ) as described elsewhere (Abercrombie et al., 1989). Probes were perfused with aCSF at 0.586 μL/min.
2.3. Microinfusion pipettes
Microinfusion pipettes were constructed using fused silica capillary tubing (350μm O.D., 25 μm I.D., Polymicro Technologies, Phoenix, AZ). The outlet tip of the capillary was etched to 40 μm o.d. with concentrated hydrofluoric acid. The inlet end of the capillary was attached to a 50 μL gastight syringe (Hamilton, Reno, NV) driven by a microprocessor-controlled driver (Sutter Instruments, Novato, CA) and pre-filled with kynurenic acid (1 mM in aCSF). The infusion rate was 100 nL/min.
2.4. Animals and surgical procedures
All procedures involving animals were approved by the University of Pittsburgh Institutional Animal Care and Use Committee. Male Sprague-Dawley rats (Hilltop, Scottsdale, PA) (250−375 g) were anesthetized with chloral hydrate (400 mg/kg i.p.) and wrapped in a homoeothermic blanket (EKEG Electronics, Vancouver, BC, Canada) set to 37°C. The rats were placed in a stereotaxic frame (David Kopf Instruments, Tujunga, CA) with the incisor bar 5 mm above the interaural line (Pellegrino et al., 1979). Holes were drilled through the skull in the appropriate positions to expose the underlying dura and brain tissue. Where required, a reference electrode made contact with the brain tissue via a salt bridge. The dura was removed with a scalpel to allow for placement of the microelectrode and/or microdialysis probe into the brain tissue with minimal disruption to the surrounding blood vessels.
2.5. Microdialysis probe placement, tissue fixation, and processing
Microdialysis probes were slowly lowered over 30 min to a final position of 2.5 mm anterior to bregma, 2.5 mm lateral from midline and 7.0 mm below dura. The probes were perfused with aCSF at 0.586 μL/min for 4 hours. In one set of experiments, rats underwent transcardial perfusion before the probes were removed from the brain. In a second group of rats, the probes were removed prior to transcardial perfusion. All rats were perfused with 160 cc of phosphate buffer solution (PBS), followed by 160 cc of 2% paraformaldehyde and 50 cc of 0.1% solution of fluorescent nanobeads. After the perfusion brains were placed in 2% paraformaldehyde for 2 hours and in 30% sucrose overnight for cryoprotection.
The brain was removed from sucrose solution and frozen by dipping in liquid nitrogen-cooled 2-methylbutane. The frozen brain was transported to the microtome in dry ice or stored at −80°C until sliced. The frozen brain was mounted to the object holder with tissue freezing medium (Triangle Biomedical Sciences, Durham, NC) and Quick Freeze® (Electron Microscopy Sciences, Hatfield, PA). The brain was trimmed in 20-μm sections until the brain region of interest was reached. At this point, a 30-μm slice was cut and mounted onto a coverslip. Slides were stored at −20°C prior to antibody labeling.
2.6. Immunofluorescence Protocol
On the day of labeling, the brain slices were removed from the freezer and rehydrated with two washes of 1xPBS (10x PBS, Fischer Scientific, Pittsburgh, PA and diluted with ultrapure water). The slices were treated with 0.1% Triton-X 100 in 1x PBS for 15 min to increase the permeability of the tissue (Bartley et al., 2005). The slices were then washed three times with 0.5% bovine serum albumin (BSA), followed by a 45-min soak in 2% BSA. Finally, the slices were washed five more times with 0.5% BSA.
The prepared slices were soaked in 100 μL of a 0.5% solution of as-received primary antibody in 0.5% BSA (mouse anti-rat PECAM-1 [CD31]; Chemicon, Temecula, CA) for one hour. The slices were washed five times with 0.5% BSA, and then soaked for one hour in 100 μL of a 0.1% solution of as-received secondary antibody in 0.5% BSA (goat anti-mouse IgG, CY3; Jackson Immunoresearch, West Grove, PA). The slices were washed five times with 0.5% BSA and five times with 1x PBS. The slices were soaked in Hoechst stain (diluted in de-ionized water for a final concentration of 1 mg/100 ml, Sigma, St. Louis, MO) for 30 s and washed three times with 1x PBS. The slices were covered with a gelvatol-treated coverslip and stored overnight in the dark at 4°C. The next day, the slices were imaged using a confocal microscope (Olympus Fluoview 1000 Confocal Microscope; Olympus, Melville, NY) or a fluorescence microscope (Olympus BX61; Olympus, Melville, NY).
2.7. Confocal Microscopy
Slices were illuminated with a multi-line argon laser to excite the fluorescent nanobeads at 488 nm. The CY3 dye was excited with a helium-neon laser at 543 nm. The Hoechst stain was excited at 405 nM with a diode laser. A 20X objective lens was used for all images. Confocal images were collected at 1.5 μm intervals in the z-axis. Images were analyzed with Metamorph/Fluor (Universal Imaging Corporation; Molecular Devices) and Adobe Photoshop (Adobe Systems Inc., San Jose, CA).
2.8. Fluorescence Microscopy
All images were collected with a 10X objective lens and the appropriate filter sets from Chroma Technology (Chroma, Rockingham, VT). Images were processed with Adobe Photoshop (Adobe Systems Inc., San Jose, CA).
2.9. HPLC analysis of carbi-DOPA and dopamine in microdialysate
Rats received carbi-DOPA (150 mg/kg i.p.) or vehicle (PBS) 3 hr after probe implantation. Sampling continued at 10-min intervals after drug administration. Samples were collected into microvials containing 0.65 μL of 1 M acetic acid. Dialysate concentrations of carbi-DOPA and DA were determined with high performance liquid chromatography with photoluminescence following electron transfer detection (HPLC-PFET; Jung et al., 2006a and b). Separation of carbi-DOPA was achieved with a reversed-phase, 100 μm i.d. capillary column at a mobile phase flow rate of 1 μL/min. The mobile phase was aqueous acetate-monochloroacetate buffer at pH 2.3, with 0.15 mM disodium EDTA and 13 mM sodium 1-octanesulfonate as an ion-interaction agent, mixed with 12.5% (v/v) acetonitrile. The separation required 8 min. The concentration detection limits of dopamine and carbi-DOPA were 570 pM and 320 pM, respectively, with a 500 nL sample volume.
2.10. Voltammetric microelectrodes and techniques
Dopamine was detected by means of fast-scan cyclic voltammetry using carbon fiber microelectrodes (7 μm in diameter, 400 μm in length) adjacent to microdialysis probes, as described previously by Borland et al (2005). Briefly, single carbon fibers (T300, Union Carbide) were sealed into pulled glass pipets with epoxy and trimmed to length with a scalpel blade. Dopamine was detected by fast-scan cyclic voltammetry by means of an EI-400 potentiostat (currently available from ESA, Chelmsford, MA) controlled with a computer program developed in-house (initial potential 0 V, first sweep to 1 V, second sweep to −0.5 V, and third sweep to 0 V; all potentials vs Ag/AgCl; the sweep rate was 300 V/s; scans were repeated at 100-ms intervals). Calibrations in DA were performed post-in vivo using aCSF buffer. The microelectrodes were implanted into the striatum using a stereotaxic carrier angled 10° from vertical to enable subsequent implantation of a microdialysis probe. A bipolar stimulating electrode was positioned in the ipsilateral medial forebrain bundle (MFB). The stimulus was a constant current, biphasic square wave with a frequency of 60 Hz, a pulse width of 2 ms, a pulse height of 280 μA, and a train length of 10 s. Once a stable and robust (> 50 nA) evoked DA response was established a microdialysis probe was slowly lowered over 30 min to a final position of 2.5 mm anterior to bregma, 2.5 mm lateral from midline and 7.0 mm below dura. The outer surface of the probe was 220 μm from the tip of the microelectrode: we call this ‘voltammetry near microdialysis probes’. Electrical stimulation re-commenced 2 hr after probe placement. Carbi-DOPA (150 mg/kg i.p.) or vehicle (PBS) was administered after the first post-probe stimulus.
2.11. Intrastriatal infusion of kynurenate
Intrastriatal infusions of KYNA were performed as described by Borland and Michael (2004). The implantation of microelectrodes and microdialysis probes was as described in the previous section. A fused silica pipet was positioned 150 μm from the tip of the microelectrode. In all animals, intrastriatal infusion of kynurenate was performed once after the implantation of the microelectrode and pipet. In one group of animals, a microdialysis probe was implanted over a period of 30 min following the first KYNA infusion: the surface of the probe was again 220 μm from the tip of the microelectrode. A second KYNA infusion was performed 2 hr after the completion of the probe implantation. In a second group of animals, a second KYNA infusion was performed without probe implantation. In both groups, the second infusion started 3.2 hr after the start of the first infusion.
3. Results
3.1. Microscopy of double-labeled blood vessels near microdialysis probes
Blood vessels containing fluorescent nanobeads (green, Fig 1a) and labeled with antiPECAM (red, Fig 1b) are clearly visible in images of striatal slices from the brain hemisphere contralateral to probe implantation. Overlaying these images yields excellent spatial agreement between the two labels (n=3, Fig 1c is a representative example), demonstrating reliable double labeling of intact brain microvasculature. The two labels are complementary since the nanobeads image perfusion flow while antiPECAM images endothelium.
Figure 1.
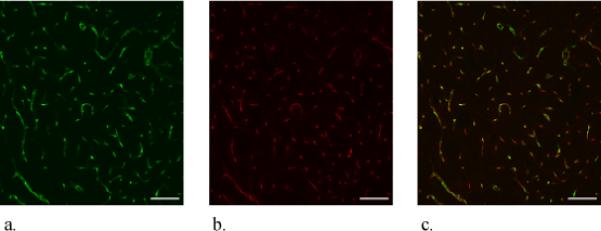
Confocal microscopy of dual-labeled blood vessels in a horizontal section of the rat striatum contralateral to probe implantation (probe-free tissue). These images represent a stack of optical sections taken at 1.5 μm intervals in the z-direction across a 30-μm thick brain slice. The scale bars represent 100 μm. a. Nanobead fluorescence b. antiPECAM fluorescence. c. Overlay of a and b.
Florescence microscopy of horizontal striatal slices, oriented perpendicular to the longitudinal axis of the probes, reveals disruptions of the local vasculature near the probe tracks (Figs 2 and 3, representative images from implantations in 3 different rats, multiple images per rat). The probe tracks themselves appear as dark, label-free spots approximately 300 μm in diameter. The tracks are surrounded by a zone of tissue exhibiting antiPECAM-labeled blood vessels without fluorescent nanobeads. The tracks are also surrounded by a halo of diffuse antiPECAM labeling. Although evident in all cases, the dimensions of the halo and the nanobead-devoid region were variable between animals. Moreover, the nanobead-devoid region is not centro-symmetric about the probe track (Figs 2 and 3).
Figure 2.

Fluorescence microscopy of dual-labeled blood vessels in a 30-μm thick horizontal section of the rat striatum after a 4-hr probe implantation. The scale bars represent 100 μm. a. Nanobead fluorescence. b. antiPECAM fluorescence. c. Overlay of a and b.
Figure 3.

A second example of the images in Figure 2 from a different probe track in a different animal.
Different images were obtained when transcardial perfusion was performed after removing the probe from the brain (Fig 4, representative image from implantations in 3 different rats). The nanobead-devoid region is almost eliminated except for a small region immediately adjacent to the probe track. Furthermore, the diffuse antiPECAM halo is absent. These observations suggest that blockage of blood vessels near the probe was alleviated when the probe was removed. This improved the perfusion and enabled the nanobeads to reach the track. In this case, however, nanobeads are visible outside antiPECAM-labeled blood vessels (see arrows in Fig 4), suggesting that blood vessels near the tracks can leak.
Figure 4.

Fluorescence microscopy as in Figures 2 and 3 except that the microdialysis probe was extracted from the tissue prior to transcardial perfusion. Arrows note the presence of nanobeads (green) outside blood vessels.
3.2. Analysis of rat brain microdialysate for carbi-DOPA and dopamine
Systemic administration of carbi-DOPA (150 mg/kg i.p.) increased carbi-DOPA levels in brain microdialysate samples (Fig 5). Calibration curves were constructed using standard solutions containing 0−100 nM carbi-DOPA and dopamine before analyzing each set of rat brain dialysates. Dialysate carbi-DOPA levels rose to approximately 80 nM after administration (squares; Fig 5). Dialysate dopamine concentrations were unaffected (circles; Fig 5).
Figure 5.

Systemic administration of carbi-DOPA (150 mg/kg i.p.) significantly increases dialysate carbi-DOPA levels (squares) but does not affect dialysate DA levels (circles). In the case of DA, the error bars are smaller than the symbols.
3.3. Stimulated dopamine response to systemic carbi-DOPA administration after probe implantation as measured by voltammetry
Voltammetry was used to record evoked DA release in the striatum during electrical stimulation of the ipsilateral MFB. Implantation of a microdialysis probe to a point 220 μm from the tip of the voltammetric electrode decreased the amplitude of the evoked response by 90% (Fig 6). After the first post-probe stimulus, rats received either PBS or carbi-DOPA (150 mg/kg i.p.). Neither treatment further affected the amplitude of the response to subsequent stimuli (Fig 6).
Figure 6.

Electrically evoked DA release decreases by 90% after implantation of a microdialysis probe. However, stimulus responses are not subsequently affected by vehicle solution (PBS) or carbi-DOPA administration.
3.4. Voltammetric response to intrastriatal infusion of kynurenate
Intrastriatal infusion of KYNA via a pipet placed 150 μm from the tip of a voltammetric electrode caused a decrease in ECS DA levels as measured by fast-scan cyclic voltammetry (Fig 7). Two consecutive infusions performed 3.2 hrs apart induced similar responses (Fig 7A). However, implantation of a microdialysis probe 220 μm from the tip of the microelectrode significantly decreased the amplitude of the response to the second infusion (Fig 7B). The histogram in Figure 7C shows the normalized amplitude of the response to the second infusion with respect to the first infusion at the time points indicated by symbols and error bars in Figures 7A and 7B. The pre- and post-probe data are significantly different (ANOVA, f=37.6, p<0.001). Hence, probe implantation significantly decreased the impact of intrastriatal infusion of KYNA on ECS DA as measured by voltammetry near the probe.
Figure 7.

Intrastriatal infusions of kynurenate decrease ECS DA as measured by voltammetry. The traces in this figure are the average of voltammetric signals from four individual animals. Two infusions were performed in each animal. The solid trace with round symbols is the response to the first infusion and the broken trace with square symbols is the response to the second infusion. The symbols indicate the mean and standard deviation of the responses at 200 s intervals. In panel A the two infusions were performed 3.2 hrs apart. In panel B the two infusions were performed 3.2 hrs apart and a microdialysis probe was implanted after the first infusion. Panel C is a histogram that reports the amplitude of the second response normalized with respect to the amplitude of the first infusion at the time points indicated by the symbols in panels A and B. The effect of probe implantation is significant (two-way ANOVA, p<0.001).
4. Discussion
Qualitative images obtained by fluorescence microscopy complement previous quantitative descriptions of the tissue response associated with implanting microdialysis probes (Clapp-Lilly et al., 1999; Zhou et al., 2001). When transcardial perfusion was performed prior to removing the probes from brain tissue, blood vessels near the probe tracks were clearly labeled with antiPECAM but were devoid of the fluorescent nanobeads (Figs 2 and 3). On the other hand, blood vessels in the contralateral striatum, i.e. probe-free tissue sections, were reliably double labeled. The absence of nanobeads in the vicinity of the tracks reveals an ischemic event localized to the probe track. The halo of antiPECAM labeling further indicates the presence of endothelial cell debris at the probe track. These images confirm that vasculature disruption is a component of the acute (4 hr) tissue response to probe implantation.
The use of fluorescent nanobeads to determine patterns of blood flow is an established technology. Jasper and others employed this technology to examine blood flow in tissues as early as 1990 (Jasper et al., 1990; Van Oosterhout et al., 1998). Jasper introduced fluorescent nanobeads into the adrenals by injecting them via the left ventricle of the heart. The adrenals were subsequently excised, fixed in formalin, frozen, and cut into 80 μm sections. The nanobeads were counted manually via fluorescence microscopy and a low count was attributed to low blood flow (Jasper et al., 1990). The carboxylate-modified fluorescent nanobeads that we employed are different from those used by Jasper et al. but are considered suitable for blood flow analysis because they do not have a high attraction for cells or vessel walls (Molecular Probes, 2004). Hence, we interpret the absence of nanobeads near probe tracks as a sign of impaired blood flow.
Performing transcardial perfusion after removing the probes from the tissue produced a different distribution of nanobeads. The nanobeads were absent only from those blood vessels in closest proximity to the probe tracks (Fig 4). These images indicate that the probe itself was obstructing blood flow, possibly by compressing adjacent blood vessels. Removing the probe appears to relieve the obstruction and improve the local perfusion. In this case, however, nanobeads were present in interstitial spaces, i.e. outside blood vessels, indicating leakage from vessels adjacent to the probe track. The antiPECAM halo in Figures 2 and 3 is consistent with the idea that vessels are torn and that endothelial cell debris is present at the probe track. The absence of the halo in Figure 4 suggests that the debris is washed out when perfusion is performed after removing the probe.
The appearance of nanobeads outside blood vessels (Figure 4) raises the possibility that the BBB is opened near the probe track. On the other hand, opening the BBB might be inconsequential if blood flow to the probe is impaired, preventing substances from reaching the site of the leak. To investigate this issue, we administered carbi-DOPA, which normally does not penetrate the brain. Consistent with a prior report (Kaakkola et al., 1992), we observed a rapid increase in carbi-DOPA dialysate levels after systemic administration (Figure 5), confirming that carbi-DOPA crossed the BBB. This confirms that substances can reach the site of the leak.
We were somewhat surprised to discover carbi-DOPA in the dialysate, since florescence microscopy shows that the nanobeads did not reach the probe track. So, the question arises as to why carbi-DOPA molecules reach the probe while the nanobeads do not. There is an obvious difference in the physical properties of carbi-DOPA and the nanobeads, carbi-DOPA being a small, water soluble molecule and the nanobeads being suspended particles. Hence, we conclude that the flow of the suspended nanobeads into blood vessels near the probes is suppressed but that dissolved molecules, entrained in plasma or serum, do reach the probe track. Thus, the blockage of blood vessels occurs in a size-selective manner, consistent with a sieving effect created by a porous substance, potentially a fibrinogen net or a blood clot, rather than an impervious or total blockage. This explains how small molecules, including nutrients such as glucose and small-molecule drugs, continue to reach the tissues surrounding probes despite the ischemic event. Hence, our suggestion of probe-induced ischemia is compatible with the well-established fact that small-molecule drugs affect the dialysate level of neurotransmitters and that small-molecule drugs such as cocaine can be recovered from brain tissue by microdialysis (Menacherry et al., 1992).
Our conclusion that the BBB is open near microdialysis probe tracks contradicts prior reports on this topic. One of these prior reports, however (Tossman et al. 1983), makes only a brief comment about the BBB and provides few details. Another used a radiotracer method (Benveniste et al. 1984): we do not know exactly why our results are different except to say that there are several methodological differences between the two studies (size of the probe, duration of the implant, etc.). However, in a later report these authors noted extravasated blood cells near probe tracks, a sign of probe-related injury (Benveniste, 1989). Furthermore, our suggestion that the perfusion of blood cells to probe tracks is inhibited while perfusion of serum or plasma continues is in line with the report that the probes partially, but not completely, inhibit blood flow (Benveniste et al., 1987).
Carbi-DOPA is an inhibitor of aromatic amino acid decarboxylase (also sometimes referred to as DOPA decaboxylase), the enzyme that catalyzes the rate-determining step of DA biosynthesis. Despite the appearance of carbi-DOPA in dialysate, systemic administration of carbi-DOPA did not affect dialysate DA levels (Fig. 5) or evoked dopamine release as measured by voltammetry near the probe (Fig. 6). This stands in contrast to the well known ability of α-methyl-p-tyrosine, an inhibitor of tyrosine hydroxylase that readily crosses the BBB, to decrease dialysate DA levels and the amplitude of evoked DA release (Stefano et al., 1976; Ewing et al., 1983; Peters and Michael, 1998; Watanabe et al., 2005). That carbi-DOPA did not affect evoked release near the probe is consistent with the idea that the drug crossed the BBB only in the small annular region surrounding the probe where leaking vessels were observed. In that case, carbi-DOPA would have to diffuse from the site of the leaking vessels out into surrounding tissue in order to affect evoked DA release. The diffusion process would lead to dilution of the drug, which would be further exacerbated by the extraction of drug from the tissue via the probe. Hence, at the site of the carbon fiber microelectrode, it is likely that the carbi-DOPA concentration was simply too low to affect evoked dopamine release. Thus, at least in the case of carbi-DOPA, it appears that leakage across the BBB near probe tracks is not an effective route of drug delivery.
Previously, we reported that intrastriatal infusions of KYNA cause a TTX-insensitive, nomifensine-sensitive decrease in ECS DA levels as measured by voltammetry (Borland and Michael, 2004). This observation supports the conclusion that a TTX-insensitive mode of DA release, presumably reverse DA transport, contributes to basal ECS DA in the striatum. This conclusion, however, is unexpected in light of reports that basal dialysate DA levels are completely TTX-sensitive (Westerink and deVries, 1988; Westerink et al., 1989). However, the implantation of a microdialysis probe significantly diminished the effect of KYNA infusions on ECS DA as measured by voltammetry near microdialysis probes (Fig. 7). This observation indicates that a suppression of reverse DA transport might also be a component of the DAergic alterations associated with the tissue response to microdialysis probes. Reverse transport is a well-established mechanism of DA release (Leviel 2001; Sulzer et al., 2005; Fleckenstein et al., 2007) and has long been accepted as the mechanism by which amphetamine elevates dialysate DA levels (Westerink et al., 1987). Nevertheless, except in cases such as amphetamine treatment, the TTX-insensitive dialysate DA is attributed to the tissue damaging effects of implanting the probe. For this reason, the majority of microdialysis protocols include a wait-time of roughly 24 hrs after probe implantation before samples are collected for analysis. The wait-time is understood to be necessary to washout any DA released due to physical injury of DA terminals near the probe site. While injury-derived DA release is likely to be TTX-insensitive, it has not been established that all TTX-insensitive DA release is injury-related. Indeed, several studies have suggested that reverse DA transport might be a physiologically relevant phenomenon independent of amphetamine (Lonart and Zigmond, 1991; Cowell et al., 2000; Leviel 2001). Hence, the findings of the present study suggest that the contribution of reverse DA transport to basal DA release deserves further investigation and consideration.
Overall, this study contributes to a body of evidence showing that the implanting microdialysis probes into the rat striatum triggers a generalized injury response (Benveniste et al. 1987; Benveniste 1989; Clapp-Lilly et al., 1999; Zhou et al., 2001). Specifically, our study contributes evidence that the tissue response is associated with an ischemic event and disruption of the BBB. The ischemic events observed here spread out from the probe to distances of about 1 mm, which is similar, although slightly less, than the distance at which Clapp-Lilly et al. (1999) reported signs of disruption (ca. 1.4 mm in their case). However, the fact that they used a larger probe and a longer implant might explain the larger extent of damage they reported. Furthermore, the present study provides complimentary evidence for probe-induce changes in DAergic neurochemistry. In previous studies we noticed alterations in depolarization-dependent DA release (Lu et al., 1999; Yang et al., 1998; Borland et al., 2005; Yang and Michael 2007), whereas herein we also present evidence for probe-induced disruption of a DA release process that fits the profile of reverse DA transport. The present study was not designed to establish any specific cause-and-effect relationship between probe-induced tissue damage and neurochemical alterations but rather to establish that two coexist and are therefore correlated. In doing so, this study adds important insights into the nature and extent of the differences between measures of ECS DA based on microdialysis and voltammetry.
Acknowledgements
This work was supported by the NIH (grants nos. DA13661, MH075989).
References
- Abercrombie ED, Keefe KA, DiFrischia DS, Zigmond MJ. Differential effect of stress on in vivo dopamine release in striatum, nucleus accumbens, and medial frontal cortex. J. Neurochem. 1989;52:1655–8. doi: 10.1111/j.1471-4159.1989.tb09224.x. [DOI] [PubMed] [Google Scholar]
- Bartley J, Soltau T, Wimborne H, Kim S, Martin-Studdard A, Hess D, Hill W, Waller J, Carroll J. BrdU-positive cells in the neonatal mouse hippocampus following hypoxic-ischemic brain injury. BM.C. Neuroscience. 2005;6:15–23. doi: 10.1186/1471-2202-6-15. [DOI] [PMC free article] [PubMed] [Google Scholar]
- Benveniste H, Drejer J, Schousbe A, Diemer NH. Regional cerbral glucose phosphorylation and blood flow after insertion of a microdialysis fiber through the dorsal hippocampus in the rat. J. Neurochem. 1987;49:729–734. doi: 10.1111/j.1471-4159.1987.tb00954.x. [DOI] [PubMed] [Google Scholar]
- Benveniste H. Brain microdialysis. Journal of Neurochemistry. 1989;52:1667–79. doi: 10.1111/j.1471-4159.1989.tb07243.x. [DOI] [PubMed] [Google Scholar]
- Benveniste H, Drejer J, Schousbe A, Diemer NH. Elevation of the extracellular concentrations of glutamate and aspartate in rat hippocampus during transiet cerebral ischemia monitored by intracerebral microdialysis. J. Neurochem. 1984;43:1369–74. doi: 10.1111/j.1471-4159.1984.tb05396.x. [DOI] [PubMed] [Google Scholar]
- Borland LM, Michael AC. Voltammetric study of the control of striatal dopamine release by glutamate. J. Neurochem. 2004;91:220–9. doi: 10.1111/j.1471-4159.2004.02708.x. [DOI] [PubMed] [Google Scholar]
- Borland LM, Shi G, Yang H, Michael AC. Voltammetric study of extracellular dopamine near microdialysis probes acutely implanted in the striatum of the anesthetized rat. J. Neuroscience Methods. 2005;146:149–58. doi: 10.1016/j.jneumeth.2005.02.002. [DOI] [PubMed] [Google Scholar]
- Bungay PM, Newton-Vinson P, Isele W, Garris PA, Justice JB., Jr Microdialysis of dopamine interpreted with quantitative model incorporation probe implantation trauma. J. Neurochem. 2003;86:932–946. doi: 10.1046/j.1471-4159.2003.01904.x. [DOI] [PMC free article] [PubMed] [Google Scholar]
- Clapp-Lilly KL, Roberts RC, Duffy LK, Irons KP, Hu Y, Drew KL. An ultrastructural analysis of tissue surrounding a microdialysis probe. J. Neuroscience Methods. 1999;90:129–42. doi: 10.1016/s0165-0270(99)00064-3. [DOI] [PubMed] [Google Scholar]
- Cookson MR. The biochemistry of Parkinson's disease. Ann. Rev. Biochem. 2005;74:29–52. doi: 10.1146/annurev.biochem.74.082803.133400. [DOI] [PubMed] [Google Scholar]
- Cowell RM, Kantor L, Hewlett GHK, Frey KA, Gnegy ME. Dopamine transporter antagonists block phorbol ester-induced dopamine release and transporter phosphorylation in striatal synaptosomes. Eur. J. Pharmacol. 2000;389:59–65. doi: 10.1016/s0014-2999(99)00828-6. [DOI] [PubMed] [Google Scholar]
- DiChiara G, Tanda G, Carboni E. Estimation of in-vivo neurotransmitter release by brain microdialysis: The issue of validity. Behav. Pharmacol. 1996;7:640–57. [PubMed] [Google Scholar]
- Ewing AG, Bigelow JC, Wightman RM. Direct in vivo monitoring of dopamine released from two striatal compartments. Science. 1983;221:169–170. doi: 10.1126/science.6857277. [DOI] [PubMed] [Google Scholar]
- Fleckenstein AE, Volz TJ, Riddle EL, Gibb JW, Hanson GR. New insights into the mechanism of action of amphetamines. Ann. Rev. Pharmacol. Toxicol. 2007;47:681–698. doi: 10.1146/annurev.pharmtox.47.120505.105140. [DOI] [PubMed] [Google Scholar]
- Garris PA, Kilpatrick M, Bunin MA, Michael D, Walker QD, Wightman RM. Dissociation of dopamine release in the nucleus accumbens from intracranial self-stimulation. Nature. 1999;398:67–69. doi: 10.1038/18019. [DOI] [PubMed] [Google Scholar]
- Groto Y, Otani S, Grace AA. The Yin and Yang of dopamine release: a new perspective. Neuropharm. 2007;53:583–587. doi: 10.1016/j.neuropharm.2007.07.007. [DOI] [PMC free article] [PubMed] [Google Scholar]
- Heien MLAV, Khan AS, Ariansen JL, Cheer J, Phillips PEM, Wassum KM, Wightman RM. Real-time measurement of dopamine fluctuations after cocaine in the brain of behaving rats. Proc. Natl. Acad. USA. 2005;102:10023–10028. doi: 10.1073/pnas.0504657102. [DOI] [PMC free article] [PubMed] [Google Scholar]
- Ivanova SY, Storozhuk MV, Melnick IV, Kostyuk PG. Chronic treament with ionotropic glutamate receptor antagonist kynurenate affects GABAergic synaptic transmission in rat hippocampal cell cultures. Neurosci. Letts. 2003;341:61–64. doi: 10.1016/s0304-3940(03)00154-x. [DOI] [PubMed] [Google Scholar]
- Jasper MS, McDermott P, Gann DS, Engeland WC. Measurement of blood flow to the adrenal capsule, cortex and medulla in dogs after hemorrhage by fluorescent microshperes. J. Auton. Nerv. Syst. 1990;30:159–68. doi: 10.1016/0165-1838(90)90140-e. [DOI] [PubMed] [Google Scholar]
- Jones SR, Gainetdinov RR, Caron MG. Application of microdialysis and voltammetry to assess dopamine functions in genetically altered mice: correlation with locomotor activity. Psychopharmacology. 1999;147:30–32. doi: 10.1007/s002130051137. [DOI] [PubMed] [Google Scholar]
- Jones SR, Gainetdinov RR, Jaber M, Giros B, Wightman RM, Caron MG. Profound neuronal plasticity in response to inactivation of the dopamine transporter. Proc. Natl. Acad. Sci. USA. 1998;95:4029–4034. doi: 10.1073/pnas.95.7.4029. [DOI] [PMC free article] [PubMed] [Google Scholar]
- Jung MC, Munro S, Shi G, Michael AC, Weber SG. Use of tris(2,2’-bipyridine)osmium as a photoluminescence-following electron-transfer (PFET) reagent for postcolumn detection in capillary high performance liquid chromatography. Anal. Chem. 2006a;78:1761–8. doi: 10.1021/ac051182o. [DOI] [PMC free article] [PubMed] [Google Scholar]
- Jung MC, Shi G, Borland LM, Michael AC, Weber SG. Simultaneous determination of biogenic monoamines in rat brain dialysates using capillary high-performance liquid chromatography with photoluminescence-following electron-transfer. Anal. Chem. 2006b;78:1755–60. doi: 10.1021/ac051183g. [DOI] [PMC free article] [PubMed] [Google Scholar]
- Kaakkola A, Tuomainen P, Wurtman RJ, Mannisto PT. Effects of systemic carbidopa synthesis in a rat hypothalamus and striatum. J. Neural Transm. 1992;4:143–54. doi: 10.1007/BF02251477. [DOI] [PubMed] [Google Scholar]
- Kawagoe KT, Zimmerman JB, Wightman RM. Principles of voltammetry and microelectrode surface states. J. Neurosci. Meth. 1993;48:225–240. doi: 10.1016/0165-0270(93)90094-8. [DOI] [PubMed] [Google Scholar]
- Koob GF, Bloom FE. Cellular and molecular mechanisms of drug dependence. Science. 1988;242:715–23. doi: 10.1126/science.2903550. [DOI] [PubMed] [Google Scholar]
- Kulagina NV, Zigmond MJ, Michael AC. Glutamate regulates the spontaneous and evoked release of dopamine in the rat striatum. Neuroscience. 2001;102:121–8. doi: 10.1016/s0306-4522(00)00480-2. [DOI] [PubMed] [Google Scholar]
- Leviel V. The reverse transport of DA: what physiological significance? Neurochem. Int. 2001;38:83–106. doi: 10.1016/s0197-0186(00)00076-0. [DOI] [PubMed] [Google Scholar]
- Lonart G, Zigmond MJ. High glutamate concentrations evoke Ca++-independent dopamine release from striatal slices: a possible role of reverse dopamine transport. J. Pharm. Exp. Ther. 1991;256:1132–1138. [PubMed] [Google Scholar]
- Lu Y, Peters JL, Michael AC. Direct comparison of the response of voltammetry and microdialysis to electrically evoked release of striatal dopamine. J. Neurochem. 1998;70:584–93. doi: 10.1046/j.1471-4159.1998.70020584.x. [DOI] [PubMed] [Google Scholar]
- Martinez-Leon NC. Psychopathology of attention deficit/hyperactivity disorder (AD/HD). International Journal of Clinical and Health Psychology. 2006;6:379–99. [Google Scholar]
- Menacherry S, Hubert W, Justice JB., Jr In vivo calibration of microdialysis probes for exogenous compounds. Anal. Chem. 1992;64:577–583. doi: 10.1021/ac00030a003. [DOI] [PubMed] [Google Scholar]
- Molecular Probes Working with Fluorspheres Fluorescent Microspheres. 2004 http://probes.invitrogen.com/media.pis/mp05001.pdf.
- Pellegrino LJ, Pellegrino As, Cushman AJ, editors. A stereotaxic atlas of the rat brain. 2nd edition Plenum Press; New York: 1979. [Google Scholar]
- Peters JL, Michael AC. Modeling voltammetry and microdialysis of striatal extracellular dopamine: The impact of dopamine uptake on extraction and recovery ratios. J. Neurochem. 1998;70:594–603. doi: 10.1046/j.1471-4159.1998.70020594.x. [DOI] [PubMed] [Google Scholar]
- Peters JL, Miner LH, Michael AC, Sesack SR. Ultrastructure at carbon fiber microelectrode implantation sites after acute voltammetric measurements in the striatum of anesthetized rats. J. Neurosci. Methods. 2004;137:9–23. doi: 10.1016/j.jneumeth.2004.02.006. [DOI] [PubMed] [Google Scholar]
- Qian J, Wu Y, Yang H, Michael AC. An integrated decoupler for capillary electrophoresis with electrochemical detection: application to analysis of brain microdialysate. Anal. Chem. 1999;71:4486–92. doi: 10.1021/ac990338f. [DOI] [PubMed] [Google Scholar]
- Smith AD, Justice JB. The effect of inhibition of synthesis, release, metabolism and uptake on the microdialysis extraction fraction of dopamine. J. Neurosci. Methods. 1994;54:75–82. doi: 10.1016/0165-0270(94)90161-9. [DOI] [PubMed] [Google Scholar]
- Stefano GB, Catapane E, Aiello E. Dopaminergic agents: influence on serotonin in the molluscan nervous system. Science. 1976;194:539–41. doi: 10.1126/science.973139. [DOI] [PubMed] [Google Scholar]
- Sulzer D, Sonders MS, Poulson NW, Galli A. Mechanisms of neurotransmitter release by amphetamines: A review. Prog. Neurobio. 2007;75:406–433. doi: 10.1016/j.pneurobio.2005.04.003. [DOI] [PubMed] [Google Scholar]
- Szarowski DH, Andersen MD, Retterer S, Spence AJ, Isaacson M, Craighead HG, Turner JN, Shain W. Brain responses to micro-machined silicon devices. Brain Res. 2003;983:23–35. doi: 10.1016/s0006-8993(03)03023-3. [DOI] [PubMed] [Google Scholar]
- Tossman U, Erikson S, Delin A, Hagenfeldt L, Law D, Ungerstedt U. Brain amino acids measured by intracerebral dialysis in portacaval shunted rats. J. Neurochem. 1983;41:1046–51. doi: 10.1111/j.1471-4159.1983.tb09049.x. [DOI] [PubMed] [Google Scholar]
- van Duuren E, van der Plasse G, van der Blom R, Joosten RNJMA, Mulder AB, Pennartz CMA, Feenstra MGP. Pharmacological manipulation of neuronal ensemble activity by reverse microdialysis in freely moving rats: a comparative study of the effects of tetrodotoxin, lidocaine, and muscimol. J. Pharm. Exp. Ther. 2007;323:61–69. doi: 10.1124/jpet.107.124784. [DOI] [PubMed] [Google Scholar]
- Van Oosterhout MFM, Prinzen FW, Sakurada S, Glenny RW, Hales JRS. Fluorescent microspheres are superior to radioactive microspheres in chronic blood flow measurements. Am. J. Physiol. Heart Circ. Physiol. 1998;275:110–5. doi: 10.1152/ajpheart.1998.275.1.H110. [DOI] [PubMed] [Google Scholar]
- Watanabe S, Fusa K, Takada K, Aono Y, Saigusa T, Koshikawa N, Cools AR. Effects of alpha-methyl-p-tyrosine on extracellular dopamine levels in the nucleus accumbens and the dorsal striatum of freely moving rats. Journal of Oral Science. 2005;47:185–90. doi: 10.2334/josnusd.47.185. [DOI] [PubMed] [Google Scholar]
- West AR, Grace AA. Opposite influences of endogenous dopamine D1 and D2 receptor activation on activity states and electrophysiological properties of striatal neurons: studies combining in vivo intracellular recordings and reverse microdialysis. J. Neurosci. 2002;22:294–304. doi: 10.1523/JNEUROSCI.22-01-00294.2002. [DOI] [PMC free article] [PubMed] [Google Scholar]
- West AR, Moore H, Grace AA. Direct examination of local regulation of membrane activity in striatal and prefrontal cortical neurons in vivo using simultaneous intracellular recording and microdialysis. J. Pham. Exp. Ther. 2002;301:867–877. doi: 10.1124/jpet.301.3.867. [DOI] [PubMed] [Google Scholar]
- Westerink BHC, deVries JB. Characterization of in vivo dopamine release as determined by brain microdialysis after acute and subchronic implantations: methodological aspects. J. Neurochem. 1988;51:683–7. doi: 10.1111/j.1471-4159.1988.tb01798.x. [DOI] [PubMed] [Google Scholar]
- Westerink BHC, Hofsteede RM, Tuntler J, DeVries JB. Use of calcium antagonism for the characterization of drug-evoked dopamine release from the brain of conscious rats determined by microdialysis. J. Neurochem. 1989;52:722–9. doi: 10.1111/j.1471-4159.1989.tb02514.x. [DOI] [PubMed] [Google Scholar]
- Westerink BHC, Tuntler J, Damsma G, Rollema H, de Vries JB. The use of tetrodotoxin for the characterization of drug-enhances dopamine release in conscious rats studied by brain dialysis. Naunyn-Schemiederg's Arch Pharmacol. 1987;336:502–507. doi: 10.1007/BF00169306. [DOI] [PubMed] [Google Scholar]
- Wightman RM, Heien MLAV, Wassum KM, Sombers LA, Aragona BJ, Khan AS, Ariansen JL, Cheer JF, Phillips PEM, Carelli RM. Dopamine release is heterogeneous within microenvironments of the rat nucleus accumbens. Eur. J. Neurosci. 2007;26:2046–2054. doi: 10.1111/j.1460-9568.2007.05772.x. [DOI] [PubMed] [Google Scholar]
- Wu H-Q, Rassoulpour A, Schwarcz R. Kynurenic acid leads, dopamine follows: A new case of volume transmission in the brain? J. Neural Transm. 2007;114:33–41. doi: 10.1007/s00702-006-0562-y. [DOI] [PubMed] [Google Scholar]
- Yang H, Michael AC. In vivo fast-scan cyclic voltammetry of dopamine near microdialysis probes. In: Michael AC, Boland LM, editors. Electrochemical Methods for Neuroscience. CRC Press; Boca Raton , FL: 2007. pp. 489–501. [PubMed] [Google Scholar]
- Yang H, Peters JL, Michael AC. Coupled effects of mass transfer and uptake kinetics on in vivo microdialysis of dopamine. J. Neurochem. 1998;71:684–92. doi: 10.1046/j.1471-4159.1998.71020684.x. [DOI] [PubMed] [Google Scholar]
- Zhou F, Shu X, Castellani RJ, Stimmelmayr R, Perry G, Smith MA, Drew KL. Hibernation, a model of neuroprotection. American Journal of Pathology. 2001;158:2145–51. doi: 10.1016/S0002-9440(10)64686-X. [DOI] [PMC free article] [PubMed] [Google Scholar]