

Abstract
Published studies of the prognostic value of left ventricular (LV) hypertrophy and LV geometric pattern in African-Americans have been based on referred or hospitalized patients with hypertension or CHD. We determined all-cause mortality rates and survival associated with LV geometric pattern determined by echocardiography in a population-based sample of middle-aged and elderly African-American men and women. During the third (1993-1995) visit of the Atherosclerosis Risk in Communities Study, echocardiography was performed at the Jackson field center (Mississippi) on the cohort of 2,445 African-Americans, 49 to 75 years of age. M-mode LV echocardiographic measurements were available for 1,722 persons. Mortality data were available through December 31, 2003. During the follow-up period (median 8.8 years, maximum 10.4 years), 160 deaths were identified. In men, the multivariable-adjusted hazard ratio (HR) for all-cause mortality (compared to men with normal LV geometry) was 1.75 (95% CI:0.71-4.33) in those with concentric LV hypertrophy, 0.38 (95% CI:0.08-1.88) in those with eccentric LV hypertrophy, and 0.79 (95% CI:0.41-1.54) in those with concentric remodeling. In women, the multivariable-adjusted HR for all-cause mortality (compared to women with normal LV geometry) was 1.17 (95% CI:0.48-2.84) in those with concentric LVH, 1.23 (95% CI:0.46-3.28) in those with eccentric LVH, and 1.17 (95% CI:0.60-2.28) in those with concentric remodeling. In conclusion, in this population-based cohort of middle-aged and elderly African-Americans free of CHD, adjustment for baseline differences in CVD risk factors and LV mass greatly attenuated the strength of the association between LV pattern and all-cause mortality risk in women; in men, an association between concentric LV hypertrophy and mortality risk remained.
Keywords: Left ventricular mass, left ventricular hypertrophy, left ventricular geometry, echocardiography, African-Americans
Introduction
To our knowledge there are no published data from population-based epidemiologic studies on LV geometric patterns and prognosis in African-Americans. We analyzed data from the Atherosclerosis Risk in Communities (ARIC) Study to determine the all-cause and coronary heart disease mortality rates and survival associated with echocardiographically defined LV mass index, LV hypertrophy, and LV geometric pattern in a population-based sample of African-American adults free of coronary heart disease at the time of the echocardiogram. Our study expands earlier work from the ARIC Study1 which examined the relation of LV hypertrophy to cardiovascular disease (CVD) events, by extending the follow-up to 10 years and by examining the mortality rates associated with the different LV echocardiographic patterns. We wanted to determine the independent contribution of LV pattern to prognosis, after adjusting for baseline differences among groups in LV mass and CVD risk factors. We were particularly interested in the prognosis of persons with the geometric pattern of non-hypertrophic concentric remodeling, which is known to be highly prevalent in African-Americans.2-5
Methods
Subjects and study design
The Atherosclerosis Risk in Communities (ARIC) Study is a prospective study, begun in 1987, designed to investigate the etiology and natural history of CVD in four U.S. communities. The study design and procedures have been reported extensively.6 At the Jackson field center (Mississippi) only African-Americans were recruited. During the third ARIC examination (1993-1995), a full-scale echocardiographic examination was performed at the Jackson field center on 2,445 middle-aged and elderly African-American men and women, 51 to 70 years of age. After excluding 83 subjects with echocardiographic valvular disease (definite aortic or mitral stenosis, moderate-severe aortic or mitral regurgitation), 595 subjects with missing LV measurements (for septal thickness, posterior wall thickness, and internal diameter), and 142 subjects with prevalent CHD or congestive heart failure or low (<35%) LV ejection fraction, 1,722 subjects were eligible for the present study.
Compared to the study group, the group with missing LV measurements had a higher mean age and body mass index and a higher frequency of diabetes and hypertension. Assuming that these data had a nonignorable missing pattern, the missing LV values were imputed using the MCMC method (SAS PROC MI and PROC ANALYZE),7 with 5 iterations. Analysis of the full data set including the imputed data changed the outcome estimates only very slightly. Therefore, we present here the results from the analysis on the 1,722 persons with original LV data.
Echocardiography measurements
An Acuson XP128/10c echo machine (Siemens Medical, Iselin, NJ) was used for image acquisition. Two-dimensional directed M-mode and pulsed Doppler echocardiographic examination followed a standardized protocol.8 Computer screen readings were performed by two cardiologists specializing in echocardiography at the core reading center using an off-line image digital analysis system (Freeland Systems Cine View, Westfield, IN). Echocardiogram readers were blinded to participants' clinical data. The reliability assessment of the ARIC echocardiographic reading center has been previously reported.9
Left ventricular internal diameter (LVID), LV posterior wall thickness (PWT), and ventricular septal thickness (VST) were measured in diastole on the M-mode echocardiogram using the American Society of Echocardiography criteria.10 Relative wall thickness (RWT) was calculated as the ratio of the sum of PWT and VST to the LVID. LV mass was calculated from the formula of Troy11 and then corrected for overestimation as described by Devereux et al:12
LV mass (g) = 0.8{1.04[(LVID + VST + PWT)3 - (LVID)3]} + 0.60.
To correct for influences due to body size, LV mass index was calculated by normalizing LV mass by height2.7, as recommended.13 Based on previous work in this study population, LV hypertrophy was defined by the same LV mass index threshold (>51 g/m2.7) established in predominantly white cohorts.14 Based on LV hypertrophy and RWT, 4 LV patterns were defined: normal (non-LV hypertrophy, RWT ≤0.45), concentric remodeling (non-LV hypertrophy, RWT >0.45), concentric LV hypertrophy (LV hypertrophy, RWT >0.45), and eccentric LV hypertrophy (LV hypertrophy, RWT ≤ 0.45).15,16
Covariate measurements and definitions
During the baseline and follow-up visits, interviews and standardized measurements were conducted following a strict protocol. Covariate measurements were made at the time of the echocardiographic exam. Diabetes was defined as fasting glucose ≥126 mg/dL or self-reported use of hypoglycemic medication in the 2 weeks prior to the clinic exam, or a history of physician diagnosis. Three blood pressure (BP) measurements were taken using a random-zero sphygmomanometer, and the average of the last two values was computed. Hypertension was defined as systolic BP ≥140 mmHg or diastolic BP ≥90 mmHg or self-reported use of anti-hypertensive medication within the 2 weeks before the exam, or a history of physician diagnosis. Body mass index (BMI) was calculated as weight (kg) / height (m)2. Smoking status, defined by self-report, was categorized into 2 levels (current, former/never). Self-reported information on education level was categorized into 3 levels (less than high school graduate, high school graduate/ vocational school, college or graduate school).
Follow-up Information
Mortality event ascertainment in the ARIC study has been previously described.6,17 The Automated Classification of Medical Entities (ACME) was used to assign underlying cause of death, which was coded using the rules of the International Classification of Diseases 9th (ICD-9) or10th version (ICD-10), as appropriate. The follow-up period was defined as the time elapsed from the date of the echocardiographic examination to the date of death or to December 31, 2003, if no death was detected.
Statistical analysis
Data are presented as mean ± SD for continuous variables and percentages for categorical variables. A p value < 0.05 was used as the cut point to assess statistical significance. To allow comparisons with previously published results, which have shown sex differences in LV indices, separate analyses were performed for men and women. For the primary analysis the outcome was death from any cause. Crude mortality rates by LV geometric pattern are expressed as events per 1,000 person-years at risk (PYAR). The Kaplan-Meier product-limit method was used for estimation of survival functions by LV geometric pattern; group differences were compared with the log-rank test. Cox proportional hazards regression was used to adjust the relation of LV geometric pattern to survival for baseline differences among groups in the distribution of covariates. Results are expressed as hazard ratios (HR) and 95% confidence intervals. Covariates considered for inclusion in the regression models included age, education level, smoking status, diabetes, hypertension, systolic and diastolic blood pressure, body mass index, total serum cholesterol:HDL ratio, serum LDL, serum triglyceride, and LV mass index. (LV mass index was entered as a log-transformed covariate, because of its positively skewed distribution.) Interaction terms were examined but none met the criterion (p <0.25) for retention. The proportional hazards assumption was evaluated graphically; there was no evidence of violation. All statistical analyses were performed using SAS version 8 (SAS Institute, Cary, NC). Because of small numbers and lack of power, analysis of CHD mortality was limited to the calculation of mortality rates; survival analysis was not performed.
Results
Study Population Characteristics
The study cohort consisted of 1,118 women with a median age of 58.7 years (minimum 49 years, maximum 73 years) and 604 men with a median age of 58.8 years (minimum 50 years, maximum 75 years) at the time of the echocardiogram. The most common LV geometric pattern was concentric remodeling, present in 414 (37.0%) women and 232 (38.4%) men. LV hypertrophy was present in 444 (39.7%) women, including 329 (29.4%) with concentric LV hypertrophy and 115 (10.3%) with eccentric LV hypertrophy. LV hypertrophy was present in 215 (35.6%) men, including 165 (27.3%) with concentric LV hypertrophy and 50 (8.3%) with eccentric LV hypertrophy.
The demographic and clinical characteristics and the main LV echocardiographic indices are summarized in Tables 1a (men) and 1b (women), by LV geometric pattern. There were statistically significant differences among the LV patterns in mean age, mean systolic and diastolic blood pressures, mean body mass index, mean total cholesterol:HDL ratio (women only), and mean triglyceride (women only) and in the frequency of higher education (women only), diabetes, hypertension, and smoking (men only). The differences among groups in the echocardiographic indices are as expected from the definitions used for each LV pattern. Mean LV mass was similar in the concentric and eccentric LV hypertrophy groups, and markedly higher than in the normal and concentric remodeling groups. Mean relative wall thickness was highest in the concentric LV hypertrophy group, followed closely by the concentric remodeling group; mean relative wall thickness was similar in the normal and eccentric LV hypertrophy groups. Mean LV internal diameter was greatest in the eccentric LV hypertrophy group, followed by, in order, the normal, concentric LV hypertrophy, and concentric remodeling groups. It should be noted that within each LV pattern there was a broad range of LV mass index: the minimum-maximum spread, in g/m2.7, was 35 in the normal group, 31 in the concentric remodeling group, 58 in the eccentric LV hypertrophy group, and 90 in the concentric LV hypertrophy group. The distribution of LV mass index in each group was highly skewed, and natural log transformation was applied to normalize LV mass index values before including them in the regression analyses.
Table 1.
| Table 1a. Participant Characteristics by Left Ventricular Pattern: Men | |||||
|---|---|---|---|---|---|
| Non-LV Hypertrophy (N = 389) | LV Hypertrophy (N = 215) | ||||
| Variable | Normal (N = 157) Mean(SD) or % | Concentric Remodeling (N = 232) Mean(SD) or % | Eccentric (N = 50) Mean(SD) or % | Concentric (N = 165) Mean(SD) or % | P value for difference among 4 LV patterns |
| Clinical Characteristics. | |||||
| Age (years) | 57.5 (5.8) | 58.3 (6.0) | 59.5 (5.7) | 60.4 (5.8) | 0.0001 |
| Education, ≥high school graduate | 71% | 64% | 58% | 57% | 0.07 |
| Current smoker | 23% | 27% | 14% | 34% | 0.02 |
| Diabetes | 20% | 13% | 18% | 28% | 0.003 |
| Hypertension | 39% | 48% | 76% | 78% | <.0001 |
| Systolic blood pressure (mmHg) | 124 (15) | 126 (17) | 138 (18) | 143 (25) | <.0001 |
| Diastolic blood pressure (mmHg) | 77 (10) | 77 (10) | 82 (11) | 82 (13) | <.0001 |
| Body mass index (kg/m2) | 27.2 (4.1) | 27.2 (4.2) | 30.4 (5.5) | 29.5 (4.9) | <.0001 |
| Total cholesterol:HDL ratio | 4.4 (1.6) | 4.4 (1.6) | 4.0 (1.1) | 4.3 (1.4) | 0.44 |
| Low density lipoprotein (mmol/L) | 3.3 (0.8) | 3.2 (0.9) | 3.1 (0.9) | 3.3 (0.9) | 0.61 |
| [mg/dl] | [126.5 (31.7)] | [122.8 (34.4)] | [121.6 (32.9)] | [126.0 (34.4)] | |
| Triglyceride (mmol/L) | 1.4 (1.1) | 1.4 (1.2) | 1.2 (0.7) | 1.4 (0.9) | 0.79 |
| [mg/dl] | [123.3 (98.4)] | [119.8 (101.8)] | [107.9 (58.1)] | [120.5 (80.3)] | |
| Echocardiographic Measurements. | |||||
| LV mass (g) | 182.1 (38.0) | 191.3 (35.0) | 285.3 (47.1) | 286.7 (64.5) | <.0001 |
| LV mass index (g/m2.7) | 38.7 (7.5) | 40.6 (6.7) | 62.7 (9.6) | 64.2 (13.2) | <.0001 |
| LV mass index minimum, maximum | 18.1 – 50.9 | 24.1 – 50.9 | 51.3 – 91.0 | 51.0 – 140.7 | -- |
| Ventricular septal thickness (cm) | 0.97 (0.12) | 1.19 (0.16) | 1.16 (0.12) | 1.46 (0.26) | <.0001 |
| LV posterior wall thickness (cm) | 1.00 (0.11) | 1.19 (0.14) | 1.17 (0.12) | 1.42 (0.23) | <.0001 |
| Relative wall thickness | 0.39 (0.04) | 0.55 (0.09) | 0.41 (0.04) | 0.61 (0.15) | <.0001 |
| LV internal diastolic diameter (cm) | 5.02 (0.40) | 4.41 (0.40) | 5.77 (0.40) | 4.80 (0.48) | <.0001 |
| Table 1b. Participant Characteristics by Left Ventricular Pattern: Women | |||||
| Non-LV Hypertrophy (N = 674) | LV Hypertrophy (N = 444) | ||||
| Variable | Normal (N = 260) Mean(SD) or % | Concentric Remodeling (N = 414) Mean(SD) or % | Eccentric (N = 115) Mean(SD) or % | Concentric (N = 329) Mean(SD) or % | P value for difference among 4 LV patterns |
| Clinical characteristics. | |||||
| Age (years) | 57.7 (5.7) | 58.9 (5.7) | 58.4 (5.3) | 59.3 (5.5) | 0.01 |
| Education, ≥high school graduate | 69% | 71% | 59% | 57% | 0.0001 |
| Current smoker | 13% | 15% | 14% | 16% | 0.78 |
| Diabetes | 10% | 22% | 27% | 35% | <.0001 |
| Hypertension | 49% | 52% | 66% | 80% | <.0001 |
| Systolic blood pressure (mmHg) | 126 (17) | 126 (19) | 134 (17) | 140 (22) | <.0001 |
| Diastolic blood pressure (mmHg) | 74 (9) | 75 (10) | 77 (9) | 78 (11) | <.0001 |
| Body mass index (kg/m2) | 29.3 (5.8) | 29.3 (5.1) | 35.3 (7.1) | 34.1 (6.4) | <.0001 |
| Total cholesterol:HDL ratio | 3.6 (1.2) | 3.8 (1.3) | 3.9 (1.3) | 4.0 (1.3) | 0.002 |
| Low density lipoprotein (mmol/L) | 3.2 (1.0) | 3.3 (1.0) | 3.3 (1.0) | 3.3 (0.9) | 0.34 |
| [mg/dl] | [123.7 (37.0)] | [129.0 (38.6)] | [125.6 (37.5)] | [126.9 (36.5)] | |
| Triglyceride (mmol/L) | 1.2 (0.6) | 1.3 (0.7) | 1.2 (0.5) | 1.4 (0.7) | 0.01 |
| [mg/dl] | [104.4 (53.6)] | [114.5 (65.5)] | [105.8 (46.4)] | [119.9 (64.6)] | |
| Echocardiographic measurements. | |||||
| LV mass (g) | 148.0 (27.4) | 155.9 (28.1) | 233.9 (41.1) | 239.2 (51.6) | <.0001 |
| LV mass index (g/m2.7) | 38.6 (6.6) | 41.2 (6.5) | 61.0 (10.2) | 64.8 (13.4) | <.0001 |
| LV mass index minimum, maximum | 16.2 – 50.9 | 20.2 – 50.9 | 51.1 – 108.5 | 51.0 – 130.7 | -- |
| Ventricular septal thickness (cm) | 0.90 (0.10) | 1.11 (0.14) | 1.07 (0.11) | 1.35 (0.21) | <.0001 |
| LV posterior wall thickness (cm) | 0.94 (0.10) | 1.10 (0.13) | 1.08 (0.10) | 1.31 (0.18) | <.0001 |
| Relative wall thickness | 0.39 (0.04) | 0.54 (0.08) | 0.41 (0.03) | 0.58 (0.11) | <.0001 |
| LV internal diastolic diameter (cm) | 4.69 (0.36) | 4.13 (0.36) | 5.32 (0.36) | 4.60 (0.44) | <.0001 |
SD, standard deviation; LV, left ventricular.
Crude Mortality Rates
The median follow-up time for the whole study group was 8.8 years (maximum 10.4 years). During follow-up, 160 deaths were identified, of which 26 were CHD deaths. Crude all-cause and CHD mortality rates and rate ratios pattern are presented in Tables 2 (men) and 3 (women). In men and women, the crude all-cause mortality rate in the concentric LV hypertrophy group was more than twice that in the normal group. In men, the rate in the eccentric LV hypertrophy group was lower than that in the normal group but this was based on only 3 deaths and the rate ratio was not statistically significantly different from 1.0. The rate in concentric remodeling subgroup was very similar to that in the normal group and again the rate ratio was not statistically significantly different from 1.0 (Table 2a). In women, the rates in both the eccentric LV hypertrophy and concentric remodeling groups were higher than that in the normal group but the rate ratios were not statistically significantly different from 1.0 (Table 3a).
Table 2.
Mortality by Left Ventricular Geometric Pattern: Men
| LV pattern | Deaths | Crude mortality rate per 1,000 PYAR* | Mortality rate ratio (95% CI) | |
|---|---|---|---|---|
| Table 2a. All-cause mortality (n=75 deaths) | ||||
| Non-LV hypertrophy | Normal | 16 | 11.5 | Reference |
| Concentric remodeling | 22 | 11.0 | 0.96 (0.50 – 1.82) | |
| LV hypertrophy | Eccentric | 3 | 7.0 | 0.61 (0.18 – 2.08) |
| Concentric | 34 | 25.2 | 2.19 (1.21 – 3.97) | |
| Table 2b. Coronary heart disease mortality (n=15 deaths) | ||||
| Non-LV hypertrophy | Normal | 3 | 2.2 | Reference |
| Concentric remodeling | 2 | 1.0 | 0.46 (0.08 – 2.78) | |
| LV hypertrophy | Eccentric | 0 | 0.0 | 0.00 |
| Concentric | 10 | 7.4 | 3.44 (0.95 – 12.50) | |
PYAR, person-years at risk.
LV, left ventricular.
Table 3.
Mortality by Left Ventricular Geometric Pattern: Women
| LV pattern | Deaths | Crude mortality rate per 1,000 PYAR* | Mortality rate ratio (95% CI) | |
|---|---|---|---|---|
| Table 3a. All-Cause Mortality (n=85deaths) | ||||
| Non-LV hypertrophy | Normal | 13 | 5.6 | Reference |
| Concentric remodeling | 27 | 7.5 | 1.35 (0.70 – 2.62) | |
| LV hypertrophy | Eccentric | 10 | 10.2 | 1.83 (0.80 – 4.16) |
| Concentric | 35 | 12.7 | 2.27 (1.20 – 4.29) | |
| Table 3b. CHD Mortality (n=11deaths) | ||||
| Non-LV hypertrophy | Normal | 1 | 0.4 | Reference |
| Concentric remodeling | 3 | 0.8 | 1.95 (0.20 – 18.77) | |
| LV hypertrophy | Eccentric | 1 | 1.0 | 2.37 (0.15 – 37.94) |
| Concentric | 6 | 2.2 | 5.06 (0.61 – 42.06) | |
PYAR, person-years at risk.
LV, left ventricular.
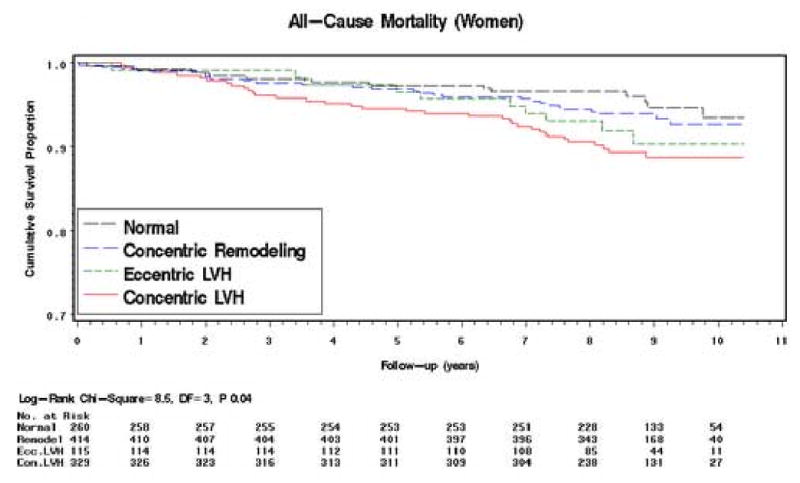
Meaningful interpretation of the CHD mortality rates is limited by the small numbers of deaths in each group. In both men and women the mortality rate ratios in the concentric LVH group are markedly raised but in no group are they statistically significant (Tables 2b and 3b). Survival Analysis (all-cause mortality only). The Kaplan-Meier survival curves for all-cause mortality by LV geometric pattern are shown in Figures 1 (men) and 2 (women). In men, the survival curve for the concentric LV hypertrophy group showed increasing divergence from the other curves after 3 – 4 years of follow-up (log-rank test: P=0.002) (Figure 1). The curves for the concentric remodeling and normal groups remained close and almost parallel throughout. Interpretation of the course of the eccentric LVH group curve is limited by the smaller numbers at risk in this group, but the curve follows more closely the curves of the concentric remodeling and normal groups. In women, the survival curve for the concentric LV hypertrophy group showed divergence from the other curves after 2 - 3 years of follow-up (log-rank test: P=0.04), but to a lesser extent than in men (Figure 2). The curves for the other 3 groups remained close and almost parallel for the first 5 years of follow-up; thereafter, the curves diverged with that for the eccentric LV hypertrophy group running intermediate between the concentric remodeling/normal groups and the concentric LV hypertrophy group.
Figure 1. Kaplan–Meier Survival Curves by LV Geometric Pattern.
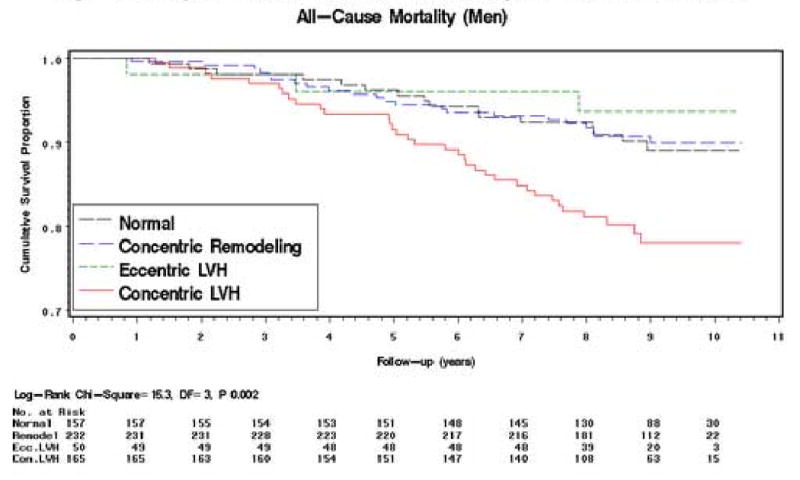
Figure 2. Kaplan–Meier Survival Curves by LV Geometric Pattern.
Regression Analysis (all-cause mortality only)
In men, concentric LV hypertrophy was associated with an increased hazard of all-cause mortality, whereas eccentric LV hypertrophy and concentric remodeling were not (Table 4a). Compared to men with normal LV pattern, men with concentric LV hypertrophy had an age-adjusted HR of 1.88 (95% CI: 1.03-3.44) for all-cause mortality. In the multivariable model the HR was attenuated to 1.75 (95% CI: 0.71-4.33) with an interval estimate too imprecise to reach statistical significance. Compared to men with normal LV pattern, men with eccentric LV hypertrophy had an age-adjusted HR of 0.54 (95% CI: 0.16-1.86) for all-cause mortality, which was attenuated to 0.38 (95% CI: 0.08-1.88) in the multivariable model. Men with concentric remodeling had an age-adjusted HR for all-cause mortality close to unity (0.92; 95% CI: 0.48-1.75), which was attenuated to 0.79 (95% CI: 0.41-1.54) in the multivariable model.
Table 4.
Hazard Ratio Estimates (95% CI) for All-Cause Mortality by Left Ventricular Geometric Pattern
| LV Geometric Pattern | ||||
|---|---|---|---|---|
| Model | Normal | Concentric Remodeling | Eccentric LV Hypertrophy | Concentric LV Hypertrophy |
| Table 4a. Men | ||||
| Unadjusted | Reference | 0.95 (0.50-1.81) | 0.60 (0.18-2.06) | 2.20 (1.22-3.99) |
| Age adjusted | Reference | 0.92 (0.48-1.75) | 0.54 (0.16-1.86) | 1.88 (1.03-3.44) |
| Model 1* | Reference | 0.79 (0.41-1.53) | 0.36 (0.08-1.62) | 1.69 (0.88-3.26) |
| Model 2† | Reference | 0.79 (0.41-1.54) | 0.38 (0.08-1.88) | 1.75 (0.71-4.33) |
| Table 4b. Women | ||||
| Unadjusted | Reference | 1.36 (0.70-2.63) | 1.84 (0.81-4.20) | 2.29 (1.21-4.33) |
| Age adjusted | Reference | 1.24 (0.64-2.40) | 1.80 (0.79-4.11) | 2.07 (1.09-3.91) |
| Model 1* | Reference | 1.19 (0.61-2.32) | 1.46 (0.62-3.45) | 1.44 (0.73-2.85) |
| Model 2† | Reference | 1.17 (0.60-2.28) | 1.23 (0.46-3.28) | 1.17 (0.48-2.84) |
Model 1: Adjusted for age, education, hypertension, systolic blood pressure, smoking status, diabetes, body mass index, and total cholesterol:HDL ratio.
Model 2: Model 1 + LV mass index.
LV, left ventricular.
In women, both concentric and eccentric LV hypertrophy and, to a lesser degree, concentric remodeling, were associated with an increased hazard of all-cause mortality (Table 4b). Compared to women with normal LV pattern, women with concentric LV hypertrophy had an age-adjusted HR of 2.07 (95% CI: 1.09-3.91) for all-cause mortality. This was markedly attenuated to 1.17 (95% CI: 0.48-2.84) in the multivariable model, with an interval estimate too imprecise to reach statistical significance. Compared to women with normal LV pattern, women with eccentric LV hypertrophy had an age-adjusted HR of 1.80 (95% CI: 0.79-4.11) for all-cause mortality, which was attenuated to 1.23 (95% CI: 0.46-3.28) in the multivariable model. Women with concentric remodeling had an age-adjusted HR for all-cause mortality of 1.24 (95% CI: 0.64-2.40), which was attenuated slightly to 1.17 (95% CI: 0.60-2.28) in the multivariable model.
Causes of death
The ICD code for the primary (underlying) cause of death was available for 156/160 (97.5%) of the deaths (these codes were not verified by study investigators). In both men and women, the main category of cause of death, accounting for 57.7% of all deaths, was “Other (non-CVD)”. 54 (60.0%) of the 90 deaths in this category were due to malignant neoplasm. Of the 74 ICD-coded deaths in men, 45 (60.8%) were due to “Other (non-CVD)”; only 11 (14.9%) were due to ischemic heart disease (and 2 of these were not classified as fatal CHD by the ARIC Morbidity and Mortality Classification Committee (23)). Of the 82 ICD-coded deaths in women, 45 (54.9%) were due to “Other (non-CVD)”; only 8 (9.8%) were due to ischemic heart disease (and 5 of these were not classified as fatal CHD by the ARIC Morbidity and Mortality Classification Committee (23)) (Table 5).
Table 5.
Number (%) of Deaths in Each Main Category of Primary (Underlying) Cause, Based on International Classification of Diseases Codes.
| Category | Men | Women | Total |
|---|---|---|---|
| Coronary heart disease | 11 (15%) | 8 (10%) | 19 (12%) |
| Other heart disease | 7 (10%) | 13 (16%) | 20 (13%) |
| Stroke | 0 (0%) | 9 (11%) | 9 (6%) |
| Other cardiovascular disease | 11 (15%) | 7 (9%) | 18 (12%) |
| Other (non-cardiovascular disease) causes | 45* (61%) | 45† (55%) | 90 (58%) |
including 24 with malignant neoplasm.
including 30 with malignant neoplasm.
Discussion
African-Americans bear a disproportionate burden of the CV morbidity and mortality in the U.S.. The reasons for the disparities in CV outcomes between whites and African-Americans have not been fully explained, but LV hypertrophy, highly prevalent in the African-American population, is a major contributing factor. The attributable risk of LV hypertrophy for all-cause mortality is greater than that of single or multivessel coronary artery disease.18 The association between non-hypertrophic concentric remodeling and mortality is, however, more controversial. 19-23 Most studies examining the prognosis of LV hypertrophy and LV geometry have been based on predominantly white cohorts or on groups of patients referred or hospitalized with CHD and/or hypertension.24 Our study expands the extant literature by virtue of (1) its population-based design, which eliminates referral bias and provides insight to LV hypertrophy-associated risk in the African-American community, and (2) its focus on LV geometry and risk in a population with high rates of concentric remodeling.
The results of our study suggest that, as in whites, concentric LV hypertrophy and (at least in women) eccentric LV hypertrophy are associated with increased all-cause mortality. Our estimates of all-cause mortality risk are broadly consistent with those from other published studies, which also show the greatest risk of mortality in persons with concentric LV hypertrophy, followed by those with eccentric LV hypertrophy. Koren et al reported that in a largely white study population of hypertensive patients referred for echocardiography concentric and eccentric LV hypertrophy were associated with unadjusted all-cause mortality rates (men and women combined) of 24% and 10%, respectively, compared to 1% in the normal group, over an average 10.2 year follow-up (though it should be noted that the number of patients and deaths in each group was small).19 In the only other published study of LV geometric patterns and prognosis in African-Americans (referred for coronary angiography for presumed CHD), concentric and eccentric LV hypertrophy were associated with adjusted hazard ratios for all-cause mortality of 2.60 and 2.28, respectively (men and women combined; no sex-specific estimates were given).23 A more useful comparison is with the Framingham study, a population-based study of predominantly white Americans, in which concentric LV hypertrophy was associated with adjusted hazard ratios for all-cause mortality of 2.1 and 1.5 in men and women, respectively,22 compared to our corresponding estimates of 1.7 and 1.4. Comparison of estimates associated with eccentric LV hypertrophy in men is difficult because of the small number of male deaths in this group in our study, but in women, the adjusted hazard ratio for all-cause mortality in Framingham was 1.3, compared to our estimate of 1.5. Exact comparison is limited by the different method of LV mass calculation and indexation and slightly different choice of risk factor adjustments in the regression models used in the two studies.
Our results also show that the adjusted risk for all-cause mortality associated with concentric remodeling is only slightly increased in women and slightly decreased in men, compared to normal. In the study of Ghali et al concentric remodeling was associated with an adjusted hazard ratio for all-cause mortality of 0.97 (men and women combined; no sex-specific estimates were given).23 In the Framingham study, concentric remodeling was associated with adjusted hazard ratios for all-cause mortality of 1.3 and 1.1 in men and women, respectively,22 compared to our corresponding estimates of 0.8 and 1.2. However, the study of Koren et al19 and two European studies20,21 have shown concentric remodeling to be an independent predictor of worse prognosis in largely white hypertensive populations. As mentioned above, the small numbers and referral nature of the study population limit the generalizability of Koren's results. Pierdomenico et al reported that concentric remodeling was associated with an adjusted rate ratio for fatal and nonfatal CV events of 1.78 (95%: 1.02 – 3.1). 21 Verdecchia et al showed that concentric remodeling independently predicted fatal and nonfatal CV events with an adjusted relative risk of 2.56 (95% CI: 1.20 – 5.45).20 Both European studies were conducted in hypertensive populations and included nonfatal CV events as outcome measures as well as deaths. It is possible, therefore, that the excess risk associated with concentric remodeling reported in both of these studies is largely due to nonfatal CV events associated with longstanding hypertension. In our study, no more than 15% of deaths in men and 10% in women could be attributed to CHD causes; more than half of the deaths were due to non-CVD causes, with malignant neoplasm being the single largest category.
In both men and women in our study, there was a clear trend of attenuation of mortality risk associated with each LV pattern when adjustment was made for baseline differences in CVD risk factors and LV mass, which agrees with Krumholz et al.22 In women, adjustment greatly attenuated the strength of the association between LV pattern and all-cause mortality risk; in men, an association between concentric LVH and mortality risk remained. In women at least, knowledge of LV geometry appears to provide little prognostic information about subsequent all-cause mortality beyond that available from LV mass and traditional CV risk factors.
The relatively low number of CHD deaths did not allow detailed analysis of CHD mortality. Longer follow-up with ascertainment of more CHD events will be required for more precise estimates of CHD mortality (ARIC follow-up is continuing). Another limitation is that coronary angiography was not used to define pre-existing CHD at baseline. Persons were excluded from the study on the basis of CHD defined by physician diagnosis or self-report only. However, there was no reason to believe that this occurred differentially in the different groups. The limitations of using M-mode echocardiography for measurement of LV dimensions and classification of LV geometry are well recognized. However, systematic errors are unlikely as echocardiographic measurements were made by operators without knowledge of prognosis.
Acknowledgments
The authors thank the staff and participants of the ARIC study for their important contributions.
The Atherosclerosis Risk in Communities Study is carried out as a collaborative study supported by National Heart, Lung, and Blood Institute contracts N01-HC-55015, N01-HC-55016, N01-HC-55018, N01-HC-55019, N01-HC-55020, N01-HC-55021, and N01-HC-55022. HAT, HH, TNS, ERF, DKA, and THM are also partly funded by the Jackson Heart Study (supported by NIH contracts N01-HC-95170, N01-HC-95171, and N01-HC-95172 provided by the National Heart, Lung, and Blood Institute and the National Center for Minority Health and Health Disparities).
Footnotes
Publisher's Disclaimer: This is a PDF file of an unedited manuscript that has been accepted for publication. As a service to our customers we are providing this early version of the manuscript. The manuscript will undergo copyediting, typesetting, and review of the resulting proof before it is published in its final citable form. Please note that during the production process errors may be discovered which could affect the content, and all legal disclaimers that apply to the journal pertain.
References
- 1.Nunez E, Arnett DK, Benjamin EJ, Oakes JM, Liebson PR, Skelton TN. Comparison of the prognostic value of left ventricular hypertrophy in African-American men versus women. Am J Cardiol. 2004;94:1383–1390. doi: 10.1016/j.amjcard.2004.08.012. [DOI] [PubMed] [Google Scholar]
- 2.Koren MJ, Mensah GA, Blake J, Laragh JH, Devereux RB. Comparison of left ventricular mass and geometry in black and white patients with essential hypertension. Am J Hypertens. 1993;6:815–823. doi: 10.1093/ajh/6.10.815. [DOI] [PubMed] [Google Scholar]
- 3.Zabalgoitia M, Ur Rahman SN, Haley WE, Oneschuk L, Yunis C, Lucas C, Yarows S, Krause L, Amerena J. Impact of ethnicity on left ventricular mass and relative wall thickness in essential hypertension. Am J Cardiol. 1998;81:412–417. doi: 10.1016/s0002-9149(97)00925-9. [DOI] [PubMed] [Google Scholar]
- 4.Olutade BO, Gbadebo TD, Porter VD, Wilkening BP, Hall WD. Racial differences in ambulatory blood pressure and echocardiographic left ventricular geometry. Am J Med Sci. 1998;315:101–109. doi: 10.1097/00000441-199802000-00006. [DOI] [PubMed] [Google Scholar]
- 5.Kizer JR, Arnett DK, Bella JN, Paranicas M, Rao DC, Province MA, Oberman A, Kitzman DW, Hopkins PN, Liu JE, Devereux RB. Differences in left ventricular structure between blacks and white hypertensive adults: The Hypertension Genetic Epidemiology Network Study. Hypertension. 2004;43:1182–1188. doi: 10.1161/01.HYP.0000128738.94190.9f. [DOI] [PubMed] [Google Scholar]
- 6.The Atherosclerosis Risk in Communities (ARIC) Study: design and objectives. The ARIC investigators. Am J Epidemiol. 1989;129:687–702. [PubMed] [Google Scholar]
- 7.SAS OnlineDoc 9.1.3. SAS Institute; Cary, NC: [11/1/06]. Available at: http://support.sas.com/onlinedoc/913/docMainpage.jsp. [Google Scholar]
- 8.ARIC Manual of Operations—Echocardiography. Bethesda, MD: National Heart, Lung, and Blood Institute, National Institutes of Health; 1993. [Google Scholar]
- 9.Skelton TN, Andrew ME, Arnett DK, Burchfiel CM, Garrison RJ, Samdarshi TE, Taylor HA, Hutchinson RG. Echocardiographic left ventricular mass in African-Americans: the Jackson cohort of the Atherosclerosis Risk in Communities Study. Echocardiography. 2003;20(2):111–120. doi: 10.1046/j.1540-8175.2003.03000.x. [DOI] [PubMed] [Google Scholar]
- 10.Sahn DJ, DeMaria A, Kisslo J, Weyman A. Recommendations regarding quantitation in M-mode echocardiography: results of a survey of echocardiographic measurements. Circulation. 1978;58:1072–1083. doi: 10.1161/01.cir.58.6.1072. [DOI] [PubMed] [Google Scholar]
- 11.Troy BL, Pombo J, Rackley CE. Measurement of left ventricular wall thickness and mass by echocardiography. Circulation. 1972;45:602–611. doi: 10.1161/01.cir.45.3.602. [DOI] [PubMed] [Google Scholar]
- 12.Devereux RB, Reichek N. Echocardiographic determination of left ventricular mass in man. Anatomic validation of the method. Circulation. 1977;55:613–618. doi: 10.1161/01.cir.55.4.613. [DOI] [PubMed] [Google Scholar]
- 13.de Simone G, Devereux RB, Daniels SR, Koren MJ, Meyer RA, Laragh JA. Effect of growth on variability of left ventricular mass: assessment of allometric signals in adults and children and their capacity to predict cardiovascular risk. J Am Coll Cardiol. 1995;25:1056–1062. doi: 10.1016/0735-1097(94)00540-7. [DOI] [PubMed] [Google Scholar]
- 14.Nunez E, Arnett DK, Benjamin EJ, Liebson PR, Skelton TN, Taylor H, Andrew M. Optimal threshold value for left ventricular hypertrophy in blacks: the Atherosclerosis Risk in Communities Study. Hypertension. 2005;45:58–63. doi: 10.1161/01.HYP.0000149951.70491.4c. [DOI] [PubMed] [Google Scholar]
- 15.Ganau A, Devereux RB, Roman MJ, de Simone G, Pickering TG, Saba PS, Vargiu P, Simongini I, Laragh JH. Patterns of left ventricular hypertrophy and geometric remodeling in essential hypertension. J Am Coll Cardiol. 1992;19:1550–1558. doi: 10.1016/0735-1097(92)90617-v. [DOI] [PubMed] [Google Scholar]
- 16.Savage DD, Garrison RJ, Kannel WB, Levy D, Anderson SJ, Stokes J, 3rd, Feinleib M, Castelli WP. The spectrum of left ventricular hypertrophy in a general population study: the Framingham Study. Circulation. 1987;75:I26–33. [PubMed] [Google Scholar]
- 17.White AD, Folsom AR, Chambless LE, Sharret R, Yang K, Conwill D, Higgins M, Williams OD, Tyroler HA, and the ARIC Investigators Community surveillance of coronary heart disease in the Atherosclerosis Risk in Communities (ARIC) Study: methods and initial two years' experience. J Clin Epidemiol. 1996;49:223–233. doi: 10.1016/0895-4356(95)00041-0. [DOI] [PubMed] [Google Scholar]
- 18.The Seventh Report of the Joint National Committee on Prevention, Detection, Evaluation, and Treatment of High Blood Pressure (JNC7) [11/1/06]; doi: 10.1161/01.HYP.0000107251.49515.c2. Available at: www.nhlbi.nih.gov/guidelines/hypertension/jnc7full.pdf. [DOI] [PubMed]
- 19.Koren MJ, Devereux RB, Casale PN, Savage DD, Laragh JH. Relation of left ventricular masss and geometry to morbidity and mortality in uncomplicated essential hypertension. Ann Intern Med. 1991;114:345–352. doi: 10.7326/0003-4819-114-5-345. [DOI] [PubMed] [Google Scholar]
- 20.Verdecchia P, Schillaci G, Borgioni C, Ciucci A, Battistelli M, Bartoccioni C, Santucci A, Santucci C, Reboldi G, Porcellati C. Adverse prognostic significance of concentric remodeling of the left ventricle in hypertensive patients with normal left ventricular mass. J Am Coll Cardiol. 1995;25:871–876. doi: 10.1016/0735-1097(94)00424-O. [DOI] [PubMed] [Google Scholar]
- 21.Pierdomenico S, Lapenna D, Bucci A, Manente B, Cuccurullo F, Mezzetti A. Prognostic value of left ventricular concentric remodeling in uncomplicated mild hypertension. Am J Hypertens. 2004;17:1035–1039. doi: 10.1016/j.amjhyper.2004.06.016. [DOI] [PubMed] [Google Scholar]
- 22.Krumholz HM, Larson M, Levy D. Prognosis of left ventricular geometric patterns in the Framingham Heart Study. J Am Coll Cardiol. 1995;25:879–884. doi: 10.1016/0735-1097(94)00473-4. [DOI] [PubMed] [Google Scholar]
- 23.Ghali JK, Liao Y, Cooper RS. Influence of left ventricular geometric patterns on prognosis in patients with or without coronary artery disease. J Am Coll Cardiol. 1998;31:1635–1640. doi: 10.1016/s0735-1097(98)00131-4. [DOI] [PubMed] [Google Scholar]
- 24.Vakili BA, Okin PM, Devereux RB. Prognostic implications of left ventricular hypertrophy. Am Heart J. 2001;141:334–341. doi: 10.1067/mhj.2001.113218. [DOI] [PubMed] [Google Scholar]