

Abstract
Instrumentation used in infrared microspectroscopy (IR-MSP) permits the acquisition of spectra from samples as small as 100 pg (10−10 g), and as small as 1 pg for Raman microspectroscopy (RA-MSP). This, in turn, allows the acquisition of spectral data from objects as small as fractions of human cells, and of small regions of microtome tissue sections. Since vibrational spectroscopy is exquisitely sensitive to the biochemical composition of the sample, and variations therein, it is possible to monitor metabolic processes in tissue and cells, and to construct spectral maps based on thousands of IR spectra collected from pixels of tissue. These images, in turn, reveal information on tissue structure, distribution of cellular components, metabolic activity and state of health of cells and tissue.
Introduction
This paper presents a review of the first decade of vibrational micro-spectral imaging of human cells and tissue. Efforts to analyze tissue spectroscopically, with the aim of detecting disease, date back over 50 years. These earliest efforts by Blout and Mellors,1 and Woernley,2 who investigated IR spectra of tissue homogenates in search for indicators of disease, were carried out using single beam, manually scanned instruments, which required milligram quantities of sample, and exhibited poor sensitivity and reproducibility. Furthermore, since the framework for interpreting the observed spectra had not been developed, the field was abandoned.
The 1950’s and 1960’s saw enormous advances in instrumentation for vibrational spectroscopy, and acceptance of these methods in analytical laboratories. In addition, methods for the interpretation of vibrational spectra of model bio-molecules (peptides, proteins, nucleic acids and phospholipids) were developed, and detailed studies on structure–spectra correlation in both infrared and Raman spectroscopy were reported. These exciting decades resulted in thousands of papers on bio-vibrational spectroscopy, establishing vibrational spectroscopy as a sensitive method to probe secondary structure, dynamics and solvation of biomolecules, and the interactions between them. These results are summarized in a number of extensive monographs, and have spawned several international conferences on this subject.3–5
Armed with this knowledge, and the general acceptance of Fourier transform (FT) methodology into the field of IR spectroscopy, researchers in the late 1980’s started investigations on living systems again.6 The goal of these early studies was to develop a spectroscopic system for classification and identification of bacterial and fungal pathogens. The combination of modern FT-IR instrumentation, which allowed high quality spectra to be obtained from macroscopic samples of bacteria, and sophisticated methods of multivariate statistics to analyze the spectra, created a method capable of distinguishing bacteria to the strain level. Furthermore, distinction of gram positive from gram negative bacteria, and of drug sensitive and drug resistant strains of the same species, is possible.
By the early 1990’s, research aimed at detecting disease in human cells and tissue was started by Wong at the NRC in Ottawa. These efforts were based on macroscopic acquisition of spectral data from pellets of cells containing in excess of 106 cells. Since homogeneity of the cellular samples was not assured, many of the results reported were spurious.7 Similarly, for the analysis of tissue sections, data were collected for areas of several square millimeters. Thus, the focal character of early cancerous disease was not accounted for, and an accurate correlation between the histopathology of the area sampled and the corresponding spectra was not possible. Therefore, some of the early tissue results were spurious as well.8
The chances of identifying spectral indicators of disease are much more favourable when micro-spectroscopic methods (IR-MSP and RA-MSP) are used. In these methods, spectra are collected through a microscope, along with high quality visual images of the exact spot from which spectra were acquired. Thus, a detailed histopathological correlation between spectra and disease stage is possible. These micro-spectroscopic methods, which are barely ten years old at this point in time, bypass the aforementioned issue of tissue heterogeneity.9
Maximal information for cells and tissue can be obtained by sampling spectral data in a mapping or imaging approach in which 1000’s or 10,000’s of spectra are collected for individual “pixels” (spatial elements). Analysis of such spectral “hypercubes” (consisting of pixel coordinates, wavelength and intensity information) yields astounding information on tissue architecture, and presence/absence of disease.10,11 Such tissue maps permit a direct correlation between the spectral map and the sample histopathology; in fact, spectral imaging (or mapping) reproduces the tissue architecture in both normal and diseased tissue samples. An example of a very early tissue map of a section of cervical epithelium, collected manually in 1997 with a spatial resolution of about 80 μm, is shown in Fig. 1. The data contained in this figure, although primitive by today’s standard, refuted earlier mis-interpretations of spectral changes observed in the detection of cervical disease, and pointed out the necessity of collecting data in a spatially resolved mode.
Fig. 1.
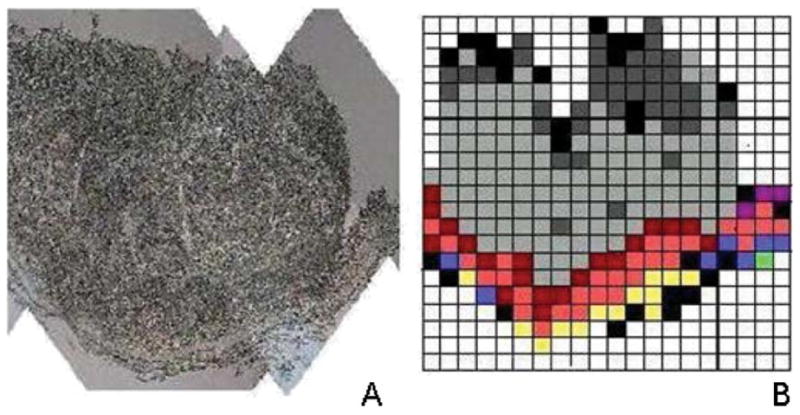
Photomicrograph (A) and early tissue map (ca. 1997, B) of a section of cervical epithelium, collected manually. Data acquisition: 80 μm spatial resolution, >24 hours, ca. 350 pixels. Data processing using a pattern recognition algorithm.
Materials and methods
1. Experimental methods
The infrared spectral results for tissues and cells reported in this review were collected using one of three IR-MSP instrument in the authors’ laboratory: a Bruker (Billerica, MA) IRScope II coupled to a Vector22 FT-IR bench, a Perkin-Elmer (Shelton, CT) Spectrum One/Spotlight 300 imaging system, or a SensIR (Danbury, CT) IlluminatIR instrument. Details of all three spectrometers can be obtained from the manufacturers, and from published literature.12 Raman spectral maps were collected using a LabRam (JY Horiba, Edison, NJ) system equipped with a HeNe laser and a computer controlled microscope stage.
IR-MSP data can be collected in transmission or in reflection microscopy. In the former case, samples are mounted on IR-transparent microscope slides made from materials such as CaF2, BaF2 or ZnSe. These slides are transparent in the visible range as well, and can be used for standard histopathology. However, these sample substrates are expensive, and may have undesirable mechanical and optical properties. For reflection measurements, glass slides coated with a thin layer of silver atoms, and overcoated with tin oxide, can be used (Kevley Technologies, Chesterland, OH). These slides are sufficiently transparent in the visible range to allow standard histopathology, and give excellent “reflection–absorption” spectra. This term was coined to describe the fact that the signal arises from a double pass (after reflection from the silver surface) of the beam through the sample. Raman maps were collected from cells grown onto CaF2 slides.
2. Sample preparation
Tissue sections are typically cut from fixed, paraffin-embedded tissue blocks using a microtome, and mounted on the optical windows described above. The tissue sections were reconstituted by a process of washing in solvents of increasing polarity, ending with water. Tissue sections between 5 and 6 μm thick were used. Tissue sections can be stained (hematoxylin and eosin, H&E, or more specific stains) after infrared data acquisition for visual imaging and pathological examination.
Single cells, grown under standard cell culture protocol, can be grown directly onto the sample substrate, or can be transferred from the cell culture, after appropriate washing steps, onto a substrate as suspensions in buffered saline (BSS). Generally, the cells and tissue sections adhere so strongly to the substrate that the entire microscope slide can be treated chemically to remove certain components to facilitate the assignment of certain spectral components.
3. Computational procedures
For the analysis of spectral mapping data sets, which may contain up to 40,000 spectra and may be as large as 400 MB, novel methods of spectral interpretation were employed. We utilized unsupervised, hierarchical cluster analysis (HCA), which had previously been applied very successfully for the spectral identification of micro-organisms,6 to analyze the spectral data sets. HCA determines the similarity of spectra in a data set by well-established algebraic methods of spectral recognition (see below), and assigns “cluster membership” based on this similarity. The pseudo-color maps, based on the spectral similarity only, do not require any a priori knowledge of tissue type, state of disease, or composition. Hence, HCA is referred to as an “unsupervised” method.
A uniform data pre-processing protocol was used for all computational procedures. First, the data set is cropped in both spatial and spectral dimension (typically between 1800–800 cm−1). Next, pixels with too high or too low absorbance values, or with poor signal/noise ratio, are removed from the data set. The remaining spectra are then smoothed/derivatized using a Savitsky–Golay algorithm, and base line corrected within this region. Finally, all spectra were vector normalized between 1800 and 800 cm−1.
After preprocessing, the covariance matrix CLM is calculated for all spectra in the data set. This matrix, defined by eqn. (1),
| (1) |
expresses the similarity, or “distance”, between each spectrum and all other spectra of the data. Each element of the covariance matrix (also known as the correlation coefficient between the spectra) is obtained by forming the inner product of two normalized spectral vectors L and M, which are represented by 1-dimensional columns of N absorbance (or derivative) values. The symbols and represent the mean values for each spectral vector. Since all spectra are normalized, identical spectra exhibit a correlation coefficient of unity.
The resulting covariance matrix CLM contains P2 entries, where P is the total number of spectra within the data set. However, since the matrix is symmetric, only P(P − 1)/2 spectral distance elements CLM need to be computed. Nevertheless, for large data sets, the size of the covariance matrix may exceed the address space of Pentium IV-class processors, and the computational problems to be described next are rather unyielding.
Subsequently, the two most similar spectra in the hypercube, i.e., the spectra whose correlation factor is closest to unity, are merged into a new object. A new column of the covariance matrix column is calculated for the new object and all existing spectra. The process of merging spectra or clusters into new clusters is repeated, and the CLM matrix is re-calculated, until all spectra have been combined into a few clusters. This process combines the most similar spectra into the same cluster, while keeping track of which spectra have been incorporated into each cluster (cluster membership).
Subsequently, pseudo-color maps based on cluster membership are constructed by assigning a color to each spectral cluster, and displaying this color at the coordinates at which each spectrum was collected. Thus, all pixels in a pseudo-color map that have the same color are from closely related spectra. The number of clusters is adjusted such that good correspondence with the pathological images are obtained. The mean cluster spectra can be extracted and used for the interpretation of the chemical or biochemical differences between clusters
A signal-to-noise (S/N) level of better than 500:1 is preferable for good clustering, but data with somewhat higher noise (S/N ~ 100) still produce good spectral images. In this respect, cluster analysis is more stable than other methods of multivariate analysis such as principal component analysis (PCA), in which an increasing amount of noise is accumulated in higher-numbered principal components.
Cluster analysis was performed by importing data hypercubes in native instrument data format into the CytoSpec™ FTIR imaging software package.13 The maps were processed on personal computers equipped with 2.4 GHz Pentium IV processors, or on a workstation built around a 2.2 GHz Athlon 64-bit processor and 8 GB of RAM.
Results and discussion
1. Tissue
We shall present a number of examples of tissue spectral maps, which demonstrate the progress on both experimental as well as interpretational fronts. We believe that spectral imaging methods are on the verge of being introduced into medical arenas for fast screening of tissue biopsies.
Fig. 2 shows results collected for cervical epithelium. We include this result since it demonstrates the sensitivity of IR-MSP toward different tissue types normally found in a biopsy, and since it refutes the approach taken by a number of researchers for the interpretation of exfoliated cervical cells.7,14
Fig. 2.
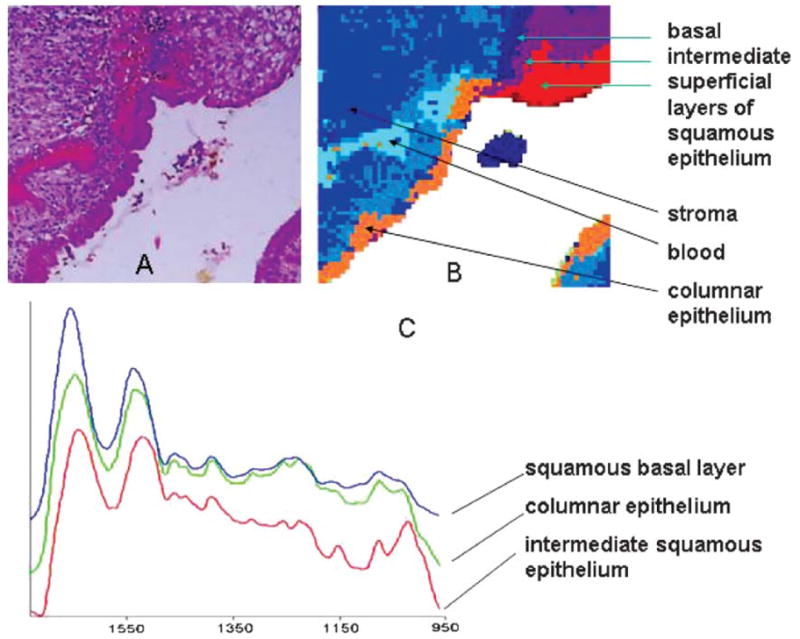
(A) Photomicrograph of stained cervical tissue section containing the squamous-columnar junction (SCJ). Section was stained after spectral data acquisition. (B) Spectral map of the section shown in (A). Data acquisition: ca. 20 μm spatial resolution, 6 h, ca. 3,000 pixels. Data processing via hierarchical cluster analysis. (C) Means cluster spectra of three distinct tissue types from the map in (B)
Epithelial tissue is particularly important in histopathology, since many common forms of cancer (breast, colon, prostate, cervix, skin, etc) are either adenocarcinomas of glandular epithelium, or carcinomas of squamous epithelium such as basal cell carcinomas. Since epithelial tissue covers the surface of organs, and therefore, is exposed to a broad range of aggressive chemical or physical conditions, adenocarcinomas and squamous carcinomas are among the most common forms of cancer.
In the human cervix, for example, a ca. 0.2 mm thick layer of squamous epithelium covers the connective tissue of the ectocervix. The squamous epithelium is constantly being renewed in a process in which new cells are created by cell division of an innermost (basal) layer of the squamous tissue. The resulting daughter cells differentiate and migrate to the surface of the squamous tissue, where they will eventually die and be shed off. We have demonstrated that this maturation process can be monitored by IR-MSP.15–17
Fig. 2A shows a photomicrograph of a H & E stained section, 500 μm × 500 μm in size, of the ectocervical and endocervical epithelium and the squamo-columnar junction (SCJ) along with red blood cells underlying the epithelium. Fig. 2B shows a pseudo-color map based on unsupervised hierarchical cluster analysis of the same tissue section, acquired before staining the tissue section. An inspection of Fig. 2 reveals excellent agreement between the cluster demarcations, and the visually observable tissue features, including the superficial layer of squamous epithelium shown in red, the intermediate layer (green) and the basal/parabasal layer (dark blue), as well as columnar cells (orange). The medium blue regions correspond to stromal (connective) tissue, and the light blue areas to red blood cells. Fig. 2C shows three of the mean cluster spectra extracted from the analysis. The red and green traces are for intermediate squamous and glandular epithelium, respectively. Similar spectra were reported earlier in single-point IR-MSP measurements for cervical tissue. The triad of peaks in the red trace at 1151, 1078 and 1028 cm−1 have been assigned to glycogen peaks (see below), whereas the two peaks at 1081 and 1049 cm−1 have been assigned to glycoproteins typically found in mucin-producing glandular cells. The blue trace in Fig. 2C is that of basal cells in the squamous tissue.
The next example is from a lymph node excised during colon cancer surgery, which contains metastatic colon adenocarcinoma cells. However, the section used to obtain the infrared image did not contain any abnormal cells, and is presented here to illustrate the ability of this technique to differentiate tissue architecture and morphological features. Fig. 3, Panel A, shows the visual image of the undisturbed part of the lymph node, about 4.5 mm × 1.6 mm in size. This visual and infrared images were acquired using the Perkin Elmer instrument, by quilting together about 70 individual, rectangular 400 × 300 μm2 microscopic exposures through the CCD camera. Portions of the capsule of the lymph node, the medullary cords and secondary cortical follicles are clearly visible.
Fig. 3.

(A) Photomicrograph of stained lymph node section, 5 × 1.5 mm2. (B) Infrared spectral image of section adjacent to that shown in (A). Data acquisition: 25 μm spatial resolution, 40 min, ca. 12,000 pixels. Data processing via hierarchical cluster analysis. (C) Dendrogram of clustering process for the map shown in (B). (D) Mean 2nd derivative cluster spectra extracted from the data set depicted in (B) for the follicular and paracortical areas (lymphocytes), and different regions of connective tissue.
Fig. 3B shows a pseudo-color spectral map collected from of an adjacent section of the same lymph node, obtained from ca. 11,500 individual infrared spectra by using hierarchical cluster analysis. The two lymph node sections shown in Fig. 3A and 3B are aligned slightly differently on the slides; consequently, the two sections shown in Fig. 3 are rotated with respect to each other by a few degrees. Nevertheless, the corresponding anatomical features are easily recognizable.
The spectral hypercube was analyzed as described before for the cervical tissue sections: the spectral range was restricted to 850 to 1900 cm−1, 2nd derivatives were calculated and the spectra were vector-normalized. At this point, univariate intensity maps are totally nondescript, since factors such as sample thickness are eliminated. Next, the data were subject to hierarchical cluster analysis (HCA). In the 7-cluster pseudo-color map (Fig. 3B) obtained for this tissue section, the light blue, yellow and yellowish-green regions correspond to the primary and secondary lymphoid follicles of the cortex. The paracortex is shown as the dark blue regions. The medullary cords, separating the lymphoid follicles, appear in red, whereas the residue of the fibrous capsule, which in this sample contained fatty tissue, is clearly discernible. Fig. 3C, shows the dendrogram from the cluster analysis. This display shows that distinctive features exist between the spectra, and that seven clusters represents a reasonable endpoint of the clustering process.
The differentiation between lymphoid follicles and cortical areas by unsupervised HCA is particularly impressive, since these regions contain mostly B and T cells, respectively. Furthermore, the spectra suggest that activated and non-activated lymphocytes can be distinguished. For individual cells, such differences within the lymphoid system have not yet been reported, but the preliminary results shown here suggest that such a distinction may be possible. This may eventually lead to spectral diagnostic methods to determine the abundance of different leukocytes and lymphocytes in smears of peripheral blood for screening purposes.
Finally, we show in Fig. 3D some of the mean cluster spectra extracted from the imaging data. These spectra are shown as 2nd derivative traces, since the spectral differences in the original absorbance spectra are too small to be detectable by eye. However, the 2nd derivative spectra show clear differences between connective tissue of the capsule and medullary cords; furthermore, we see small differences due to B- and T-lymphocytes.
At this point, it is clear that IR-MSP is exquisitely sensitive to small differences in spectral properties of the tissue types found in the sample section. It is also obvious that a database of tissue spectra can be constructed that permits the unsupervised analysis of tissue types. Differences between normal and abnormal (cancerous) tissue types in a sample are about the same magnitude as are differences between different tissue types;18 thus, the notion of utilizing IR-MSP as an unsupervised methods for diagnosis seems well justified.
In our laboratory, the biochemical reason for the discriminatory power of IR-MSP has been a major research focus. To this end, we have used two different approaches. First, biochemical digestion methods were employed to selectively remove certain components from the tissue samples, and monitoring the spectral changes associated with these digestions. To our knowledge, we reported the first spectroscopic results of such digestions in human tissue and cells.19 These studies, in turn, have explained the biochemical reasons underlying the spectral differentiation between normal and diseased tissue. Second, we have investigated the spectral characteristics of individual cells in order to interpret the spectral changes in tissue.
Next we shall briefly summarize the results of the digestion studies. Details can be found in the original literature.19 Originally we concentrated our efforts to identify the spectral contributions of nucleic acids in samples of normal and cancerous tissue via enzyme digestions. Previously, Benedetti20 reported enhanced symmetric and antisymmetric phosphate vibrations of nucleic acids (1080 and 1230 cm−1) for cancerous samples. We demonstrated that this increase is largely due to DNA vibrations through successive RNAse and DNAse digestion of cancerous liver and cervical tissues. Secondly, we studied the digestion of glycogen from tissues, such as liver and mature cervical squamous epithelium. The spectrum of pure glycogen can be easily identified by peaks at 1151, 1078 and 1028 cm−1 (cf. Fig. 2C) due to coupled C–O and C–C stretching and C–O–H deformations motions. When glycogen-containing tissue is treated with α-amylase, this triad of peaks disappears, and this disappearance was correlated with a decrease in intensity of glycogen-specific stains used in standard histopathology. The advantage of IR microspectroscopy, however, is the inherent quantitative nature of the method and the ability to measure the disappearance quantitatively, without the use of any stains.21
Large variations in glycogen content of cervical cells were reported early in efforts of utilizing IR microspectroscopy as a screening tool for cervical disease.15 Although the absence of glycogen is frequently found in dysplastic or cancerous samples of cervical cells, this glycogen depletion is non-specific: many normal, superficial squamous cells in the final stage of their life cycle completely deplete their glycogen storage, but rapidly proliferating cells also deplete their glycogen. Thus, the glycogen content should not be used as an indicator for disease.
2. Cells
Efforts to observe vibrational spectra of individual cells date back to the mid-1990s when the sensitivity of IR-MSP spectrometers was sufficient to provide results in a few minutes of acquisition time.22 Using present (non-synchrotron) instrumentation, the spectra of nuclear and cytoplasmic regions of a cell can be collected in a few seconds at about 10 μm spatial resolution.
We demonstrated previously that the IR spectra of the nucleus and the cytoplasm of a cell are nearly identical in inactive cells with pyknotic nuclei.23 Furthermore, we found that these spectra are nearly completely dominated by protein features, and virtually no DNA signal was observed from the nuclear region. In actively dividing, or otherwise metabolically active cells, RNA spectral features, due most likely to ribosomal RNA, were found in the cytoplasm. These RNA signals can vary enormously, depending on the cell’s activity. As expected, these signals disappeared upon RNAse digestion, which demonstrates unambiguously that the signals are due to RNA, and not due to DNA or phospholipids.
Although DNA signatures are absent in metabolically inactive, non-proliferating cells, actively dividing or metabolically active cells show DNA features in the nuclei. In these cells, DNA peaks at 1080 and 1250 cm−1 were observed from the nuclear regions after RNAse digestion.24
We have previously reported25 the effect of the stage of the division cycle on the spectra of cells. This was accomplished by separation of cells by elutriation and established the phase by flow cytometry. Here, we wish to report the first observations of maps, collected in both Raman and infrared spectroscopy, of cells arrested in different stages of mitosis. High quality Raman images of cells have been reported in the literature before.26
Fig. 4 shows visible, IR and Raman spectral images of a cell in the metaphase of mitosis. At this stage of the cell division, the genome has been completely duplicated, and the chromosomes are lined up before separation occurs. Although the chromosomes contain the entire nuclear DNA, they are also very high in protein (histones). This can be seen in Fig. 4B, which shows an infrared spectral map based on the integrated intensity in the amide I band. This panel, taken at the best spatial resolution (ca. 10 μm at 1650 cm−1) available in the authors’ laboratory, shows the highest protein content (brown) at the location of the chromosomes, and lower protein content in the nucleus and cytoplasm (red and light blue). The superior resolution of the Raman images permits further distinction of the nuclear components. A map of the total protein content is presented in Fig. 4D. This panel clearly shows that the protein content is highest in the chromosomes (yellow), lower in the nucleus (red) and even lower in the cytoplasm (light blue and green). When the intensity of spectral features due to protein (1650 cm−1) and DNA (780 cm−1) are ratioed, panel Fig. 4E is obtained, which shows in exquisite detail the DNA of the chromosomes in the nucleus (pink). Although the signal-to-noise ratio of the Raman spectra used to construct the maps in Panels 4D and E is significantly lower than that of corresponding IR spectra, the better spatial resolution achievable with Raman imaging makes this latter technique an excellent alternative for high resolution imaging studies of cells.
Fig. 4.

Infrared and Raman spectral images of a HeLa cell in the metaphase of mitosis. (A) Visual image taken through infrared microscope (B) infrared spectral map, based on amide I intensity (6.25 μm nominal spatial resolution), (C) visual image taken through Raman microscope, (D) Raman spectral image based on amide I intensity, (E) Raman spectral image based on nucleic acid intensity. Spatial resolution ca. 1 μm.
Conclusions
We demonstrate in this contribution that vibrational spectral imaging of cells and tissue has made enormous progress over the past decade. In the case of tissue analysis, imaging spectrometers that allow the acquisition of thousands of spectra in a few minutes, coupled with modern methods of data analysis, permit the mapping of large tissue sections and the identification of tissue abnormalities. Single cells can be analyzed in both Raman and IR mapping experiments, and the distribution and identification of biological components in the cell can be performed. These advances will undoubtedly propel vibrational imaging techniques into biomedical and biological laboratories to provide valuable new insight into biochemical processes, and detection of disease.
Acknowledgments
Partial support of this research through grants from the National Institutes of Health (CA 81675 and GM 60654 to MD) are gratefully acknowledged. A “Research Centers in Minority Institutions” award RR-03037 from the National Center for Research Resources of the NIH, which supports the infrastructure of the Chemistry Department at Hunter College, is also acknowledged.
Biography

Max Diem was born in Karlsruhe, Germany, in 1947. After receiving his BS (Vordiplom) in chemistry from the Universität Karlsruhe in 1970, he enrolled at the University of Toledo, Ohio, and received both his MS and PhD degrees in physical chemistry from there. Both his PhD research and subsequent postdoctoral work at Syracuse University with Larry Nafie were in the area of vibrational optical activity. He has been at Hunter College of the City University of New York since 1979, where he is Professor of Chemistry. After spending 20 years researching infrared circular dichroism and Raman optical activity, Prof. Diem’s interests have moved into the field of Raman and IR micro-spectroscopy of human cells and tissues to develop methods of optical diagnosis.
Footnotes
Presented at the 82nd International Bunsen Discussion Meeting on “Raman and IR Spectroscopy in Biology and Medicine”, Jena, Germany, February 29–March 2, 2004.
References
- 1.Blout ER, Mellors RC. Infrared spectra of tissues. Science. 1949;110:137–138. doi: 10.1126/science.110.2849.137. [DOI] [PubMed] [Google Scholar]
- 2.Woernley DL. IR absorption curves for normal and neoplastic tissues and related biological substances. Cancer Res. 1952;12:516–523. [PubMed] [Google Scholar]
- 3.Spiro TG, editor. Biological Applications of Raman Spectroscopy. John Wiley and Sons; New York: 1987. [Google Scholar]
- 4.Clark RJH, Hester RE, editors. Advances in Infrared and Raman Spectroscopy. Vol. 1 John Wiley and Sons; New York: 1975. [Google Scholar]
- 5.European Conference on Spectroscopy of Biological Molecules (ECSBM); Szeged, Hungary. 2003; Prague, Czech Republic. 2001; Enschedde, The Netherlands. 1999; etc. [Google Scholar]
- 6.Helm D, Labischinski H, Schallen G, Naumann D. Classification and identification of bacteria by FT-IR spectroscopy. J Gen Microbiol. 1991;137:69–79. doi: 10.1099/00221287-137-1-69. [DOI] [PubMed] [Google Scholar]
- 7.Wong PTT, Wong RK, Caputo TA, Godwin T, Rigas B. IR spectroscopy of exfoliated human cervical cells; evidence of extensive structural changes during carcinogenesis. Proc Natl Acad Sci USA. 1991;88:10988–10992. doi: 10.1073/pnas.88.24.10988. [DOI] [PMC free article] [PubMed] [Google Scholar]
- 8.Rigas B, Morgello S, Goldman IS, Wong PTT. Human colorectal cancers display abnormal Fourier-transform infrared spectra. Proc Natl Acad Sci USA. 1990;87(20):8140–8144. doi: 10.1073/pnas.87.20.8140. [DOI] [PMC free article] [PubMed] [Google Scholar]
- 9.Diem M, Boydston-White S, Chiriboga L. IR spectroscopy of cells and tissues: Shining light onto an unsettled subject. Appl Spectrosc. 1999;53(4):148A–161A. [Google Scholar]
- 10.Diem M, Chiriboga L, Yee H. Infrared spectroscopy of human cells and tissue. VIII. Data collection and analysis strategies for infrared mapping of tissue. Biopolymers: Biospectroscopy. 2000;57:282–290. doi: 10.1002/1097-0282(2000)57:5<282::AID-BIP50>3.0.CO;2-R. [DOI] [PubMed] [Google Scholar]
- 11.Lasch P, Naumann D. FT-IR microspectroscopic imaging of human carcinoma in thin sections based on pattern recognition technique. Cell Mol Biol. 1998;44(1):189–202. [PubMed] [Google Scholar]
- 12.Diem M, Romeo M, Miller L, Lasch P. Comparison of Fourier transform infrared (FTIR) spectra of individual cells acquired using synchrotron and conventional sources. Infrared Phys Technol. 2004;45:331–338. [Google Scholar]
- 13.http://www.CytoSpec.com.
- 14.Sindhuphak R, Issaravanich S, Udomprasertgul V, Srisookho P, Warakamin S, Sindhuphak S, Boonbundarlchai R, Dusitsin N. A new approach for the detection of cervical cancer in Thai women. Gynecol Oncol. 2003;90:10–14. doi: 10.1016/s0090-8258(03)00196-3. [DOI] [PubMed] [Google Scholar]
- 15.Chiriboga L, Xie P, Yee H, Zarou D, Zakim D, Diem M. Infrared spectroscopy of human tissue. IV. Detection of dysplastic and neoplastic changes of human cervical tissue via infrared microscopy. Cell Mol Biol. 1998;44(1):219–229. [PubMed] [Google Scholar]
- 16.Chiriboga L, Xie P, Yee H, Vigorita V, Zarou D, Zakim D, Diem M. Infrared spectroscopy of human tissue. I. Differentiation and maturation of epithelial cells in the human cervix. Biospectroscopy. 1998;4(1):47–53. doi: 10.1002/(SICI)1520-6343(1998)4:1%3C47::AID-BSPY5%3E3.0.CO;2-P. [DOI] [PubMed] [Google Scholar]
- 17.Wood BR, Chiriboga L, Yee H, Quinn MA, McNaughton D, Diem M. FTIR mapping of the cervical transformation zone, squamous and glandular epithelium. Gynecol Oncol. 2004;93(4):59–68. doi: 10.1016/j.ygyno.2003.12.028. [DOI] [PMC free article] [PubMed] [Google Scholar]
- 18.Lasch P, Haensch W, Lewis N, Kidder LH, Naumann D. Characterization of colorectal adenocarcinoma sections by spatially resolved FT-IR microspectroscopy. Appl Spectrosc. 2002;56:1–9. [Google Scholar]
- 19.Chiriboga L, Yee H, Diem M. Infrared spectroscopy of human cells and tissue. VII. FT-IR microspectroscopy of DNase and RNase treated normal, cirrhotic and neoplastic liver tissue. Appl Spectrosc. 2000;54(4):480–485. [Google Scholar]
- 20.Benedetti E, Bramanti E, Papineschi F, Rossi I, Benedetti E. Determination of the relative amount of nucleic acids and proteins in leukemic and normal lymphocytes by means of Fourier transform IR microspectroscopy. Appl Spectrosc. 1997;51:792–797. [Google Scholar]
- 21.Chiriboga L, Yee H, Diem M. Infrared spectroscopy of human cells and tissue. VI. A comparative study of histopathology and infrared microspectroscopy of liver tissue. Appl Spectrosc. 2000;54(1):1–8. [Google Scholar]
- 22.Jamin N, Dumas P, Moncuit J, Fridman WH, Teillaud JL, Carr GL, Williams GP. Chemical imaging of nucleic acids, proteins and lipids of a single living cell. Application of synchrotron IR microspectrometry in cell biology. Cell Mol Biol. 1998;44(1):9–14. [PubMed] [Google Scholar]
- 23.Lasch P, Pacifico A, Diem M. Spatially resolved IR microspectroscopy of single cells. Biopolymers: Biospectroscopy. 2002;67:335–338. doi: 10.1002/bip.10095. [DOI] [PubMed] [Google Scholar]
- 24.Pacifico A, Chiriboga L, Lasch P, Diem M. Infrared spectroscopy of cultured cells. II. Spectra of exponentially growing, serum-deprived and confluent cells. Vib Spectrosc. 2003;32:107–115. [Google Scholar]
- 25.Boydston-White S, Gopen T, Houser S, Bargonetti J, Diem M. Infrared spectroscopy of human tissue: V. IR spectroscopic studies of Myoeloid Leukemia (ML-1) cells at different phases of the cell cycle. Biospectroscopy. 1999;5:219–227. doi: 10.1002/(SICI)1520-6343(1999)5:4<219::AID-BSPY2>3.0.CO;2-O. [DOI] [PubMed] [Google Scholar]
- 26.Uzunbajakava N, Lenferink A, Kraan Y, Willekens B, Vrensen G, Greve J, Otto C. Non-resonant Raman Imaging of the protein distribution in single human cells. Biopolymers: Biospectroscopy. 2003;72:1–9. doi: 10.1002/bip.10246. [DOI] [PubMed] [Google Scholar]