

Abstract
Regulatory T cells (Tregs) play a pivotal role in the maintenance of homeostasis between immune response and immune tolerance. The transcription factor Foxp3 and the surface protein CD25 are the two key molecules characterizing Tregs. In autoimmune and various other chronic inflammatory diseases, the expression of Foxp3 is severely down-regulated. However, the molecular mechanism underlying the down-regulation of Foxp3 is not understood yet. Because IL-12p40 homodimer (p402) is markedly up-regulated in response to various inflammatory stimuli, the present study was undertaken to explore the role of p402 in the regulation of Foxp3 in naïve mouse splenocytes. IL-12p402 dose-dependently inhibited the expression of Foxp3 and CD25, but not CD4. Interestingly, this inhibition was absent in splenocytes of IL-12Rβ1 (−/−), but not IL-12Rβ2 (−/−), mice. Moreover, suppression of Foxp3 in wild type and IL-12Rβ2 (−/−) splenocytes was accompanied by production of NO. Consistently, L-NIL, an inhibitor of iNOS, and PTIO, a scavenger of NO, restored the expression of Foxp3 and CD25 in p402-stimulated splenocytes and p402 was unable to down-regulate Foxp3 and CD25 in splenocytes from iNOS (−/−) mice. Furthermore, NO, but not p402, was able to inhibit Foxp3 in purified CD4+CD25+ T cells in the absence of iNOS-expressing cells. Hence, our results clearly demonstrate that p402 induces NO production via IL-12Rβ1 and that NO subsequently suppresses Tregs in naïve mouse splenocytes. This study, therefore, delineates an unprecedented biological function of p402 in the regulation of Foxp3 via IL-12Rβ1-mediated NO production.
Keywords: Regulatory T cells, IL-12 p40 homodimer, Nitric oxide, IL-12Rβ1, IL-12Rβ2
Introduction
Interleukin-12 (IL-12) plays a key role in immune modulation by favoring polarization of T-helper-1 (Th1) cells (1). Particularly, in the early stages of autoimmune diseases and infections, IL-12-mediated Th1 hyperactivity promotes uncontrolled CNS infiltration and subsequent inflammation in CNS leading to further pathophysiological manifestations of the diseases (2–5). Structurally, IL-12 is a heterodimer of heavy chain subunit p40 and light chain subunit p35, which are covalently linked by disulfide bonds to form bioactive cytokine p70 (IL-12) (6). To be functionally active as a cytokine, p40 and p35 subunits must be co-expressed (1) However, there are evidences that p40 and p35 are differentially expressed. According to several reports (7–9), in the CNS of MS and EAE, mRNA level of p40 was significantly higher than the control subjects whereas there was no difference in the mRNA level of p35 among patients and controls. Predominance of p40 in normal monocytes is evidenced by secretion of 5 to 500 fold excess of p40 relative to IL-12 (10, 11). Moreover, approximately, 20 to 40% of the p40 in the serum of normal and endotoxin-treated mice is in the form of p40 homodimer (p402) indicating the existence of possible biological role of this homodimer (12). We have recently demonstrated that, p402, the IL-12p40 homodimer, induces the production of NO and the expression of iNOS in mouse microglia and macrophages via activation of NF-κB, therefore implying a suspected role of p402 in immune regulation as well as in CNS inflammation (13). In addition, Th1 polarization was enhanced in allografted IL-12p35 deficient, but not in allografted IL-12p40 deficient, mice (1) further supporting a possible role of p402 in immune regulation. However, the exact mechanism of p402-mediated immune regulation is not understood yet.
On the other hand, regulatory T cells (Tregs), a special subset of T cells, serve as a primary regulator for immune response that maintains homeostasis between immune response and immune suppression. Misguided and excessive immune response against self and non-self antigens is physiologically harmful and may underlie the development of various chronic inflammatory and autoimmune diseases. Tregs suppress activation and proliferation of self-reactive T cells and thereby inhibit immune response of self-reactive T cells against self-antigens (14, 15). Tregs, according to their sources, broadly belongs to two classes, which are naturally occurring thymic-derived Tregs and adaptive or inducible Tregs (16). Naturally occurring Tregs are generated in the thymus during the development T lymphocytes (15, 16). These Tregs, constituting 5–10 % of total T lymphocytes, then enters peripheral circulation and are widely distributed in peripheral reservoirs lymph nodes and spleens (17, 18). On the contrary, adaptive or inducible Tregs are developed in the periphery from naïve T cells or naturally-occurring Tregs under the influence of various inductive signals, most importantly TGF-β (19). Although controversial, TCR stimulation may also take part in the development of Foxp3 (20, 21). Tregs are primarily characterized by CD4+Foxp3+ or CD4+CD25+Foxp3+ T cells and Foxp3 has been considered as a master-regulatory transcription factors for Tregs (14, 15). Among the other major surface markers, glucocorticoid-induced TNF-receptor-related protein (GITR) and cytotoxic T lymphocyte antigen-4 (CTLA-4) are the most important with respect to development and function of Tregs (22, 23).
Tregs are critically important in the regulation of various autoimmune diseases, allergy, graft rejection, inflammatory bowel disease and cancer (15, 16). In autoimmune disorders, self-reactive T cells get relief of Treg-mediated suppression and as a result undergo uncontrolled activation and proliferation leading to disease pathophysiology. Foxp3 gene knock-out mice develop scurfy-mouse phenotype with aggressive lymphoproliferative autoimmune syndrome lacking CD4+CD25+Tregs (24, 25). There are many evidences that support numerical and functional deficiency of Tregs in MS (26, 27). Recently, Venken et al, have shown that, number of peripheral CD4+CD25+Foxp3+ T cells and Foxp3 expression level are significantly low in relapsing-remitting MS patients compared to normal individual (28). However, the exact molecular mechanism of modulation of Tregs with respect to disease pathophysiology is not clearly understood.
We herein report the first evidence that p402, the IL-12p40 homodimer, down-regulates regulatory T cell marker Foxp3 in naïve splenocytes via IL-12Rβ1. We further demonstrate that, p402 induces production of NO via IL-12Rβ1 and that NO subsequently inhibits the expression of Foxp3.
Materials and methods
Reagents
Fetal bovine serum (FBS) and RPMI 1640 medium were from Invitrogen (Carlsbad, CA). Recombinant mouse p40 homodimer and mouse regulatory T cell isolation kit were obtained from R & D systems (Minneapolis, MN). L-N6-(1-Iminoethyl)-lysine hydrochloride (L-NIL) and carboxy-PTIO were obtained from BIOMOL Research Laboratories (Plymouth Meeting, PA). Rat anti-Foxp3, mouse regulatory T cell staining kit, FITC-labeled anti-mouse CD4, APC-labeled anti-mouse CD25, and PE-labeled anti-mouse Foxp3 were purchased from eBioscience (San Diego, CA). Rabbit anti-iNOS was purchased from Calbiochem (San Diego, CA). Annexin V-FITC apoptosis detection kit was purchased from BioVision (Mountain View, CA). FITC-conjugated rat anti-mouse interleukin-2 receptor alpha (CD25) monoclonal antibody and rat anti-CD11b were purchased from Chemicon international. PE-labeled rat anti-CD4 monoclonal antibody was purchased from Santa Cruz Biotechnology (Santa Cruz, CA).
Isolation of splenic T cells
Specific pathogen-free female SJL/J mice (4 – 6 weeks old) were purchased from Harlan Sprague-Dawley, Inc. B6.129 iNOS (−/−), B6.129 IL-12Rβ1 (−/−) and B6.129 IL-12Rβ2 (−/−) and their littermate controls were purchased from Jackson laboratories. Heterozygous B6.129 iNOS (+/−) mice were screened after F1-cross between littermate controls and pure homozygous iNOS (−/−). Briefly, spleens were collected from these mice, and single cell suspension was prepared in RPMI 1640 medium containing 10% fetal bovine serum, 2 mM L-glutamine, 50 μM β1-mercaptoethanol, 100 units/ml penicillin, and 100 μg/ml streptomycin. splenocytes cultured at a concentration of 0.5 – 1.0 × 10⁶ cells/ml in twelve-well plates were incubated with of p402 alone or together with L-NIL or PTIO or without p402 for 24 hours. The non-adherent splenic T cells were collected and used for RNA isolation and FACS analysis.
Treatment of mice with p402 and L-NIL
Groups of mice received intraperitonial injection of p402 (150 ng/mouse) alone or together with L-NIL (5 mg/kg body wt), while the control group received saline only. After 2 days, mice were perfused as described later for immunohistochemical studies.
Assay for NO Synthesis
Synthesis of NO was determined by assay of culture supernatants for nitrite, a stable reaction product of NO with molecular oxygen. Briefly, supernatants were centrifuged to remove cells, and 400 μl of each supernatant was allowed to react with 200 μl of Griess reagent (29) and incubated at room temperature for 15 min. The optical density of the assay samples was measured spectrophotometrically at 570 nm. Fresh culture media served as the blank. Nitrite concentrations were calculated from a standard curve derived from the reaction of NaNO2 in the assay.
Semi-quantitative RT-PCR Analysis
Total RNA was isolated from splenic T cells by using RNeasy mini kit (Qiagen) following manufacturer’s protocol. To remove any contaminating genomic DNA, total RNA was digested with DNase. Semi-quantitative RT-PCR was carried out as described earlier (30, 31) using a RT-PCR kit from Clontech. Briefly, 1 μg of total RNA was reverse transcribed using oligo(dT)12–18 as primer and MMLV reverse transcriptase (Clontech) in a 20 μl reaction mixture. The resulting cDNA was appropriately-diluted, and diluted cDNA was amplified using Titanium Taq DNA polymerase and following primers. Amplified products were electrophoresed on a 1.8% agarose gels and visualized by ethidium bromide staining as follows: Foxp3: sense, 5′-CAGCTGCCTACAGTGCCCCTAG-3′ and antisense, 5′-CATTTGCCAGCAGTGGGTAG-3′ CD25: sense, 5′-AGCCAAGTAGGGTGTCTCTCAACC-3′ and antisense, 5′-GCCCAGGATACACAGTGAAGAACG-3′ CD4: sense, 5′-GAGAGTCAGCGGAGTTCTC-3′ and antisense, 5′-CTCACAGGTCAAAGTATTGTTG-3′ IFN-γ: sense, 5′-GCTGTTACTGCCACGGCACA-3′ and antisense, 5′-GGACCACTCGGATGAGCTCA-3′ GAPDH: sense, 5′-GGTGAAGGTCGGTGTGAACG3′ and antisense, 5′-TTGGCT CCACCCTTCAAGTG-3′.
Real-time PCR Analysis
It was performed using the ABI-Prism7700 sequence detection system (Applied Biosystems) as described earlier (32, 33). All primers and FAM-labeled probes for mouse genes and GAPDH were obtained from Applied Biosystems. The mRNA expressions of respective genes were normalized to the level of GAPDH mRNA. Data were processed by the ABI Sequence Detection System 1.6 software and analyzed by ANOVA.
Flow Cytometry
Surface co-expression of CD4 and CD25 on splenic T cells, Tregs and CD4+CD25− T cells were checked by two-color flow cytometry, as described previously (34–36). Approximately, 1 × 10⁶ cells suspended in RPMI 1640 medium/FBS were incubated in the dark with appropriately diluted FITC-labeled Abs to CD25 and PE-labeled Abs to CD4 at 4°C for 1 h. The cells were then analyzed through FACS (BD Biosciences). A minimum of 10,000 cells was accepted for FACS analysis. Cells were gated based on morphological characteristics. Apoptotic and necrotic cells were not accepted for FACS analysis. Intracellular staining of Foxp3 or CTLA4 along with surface staining for CD4 or CD25 was performed according to manufacturer’s protocol. Approximately, 1 × 10⁶ splenic T cells suspended in flow staining buffer were incubated at 4° C with appropriately-diluted FITC-labeled Abs to either CD4 or CD25 for 30 minutes, washed and resuspended in fixation/permealization solution. Following incubation in dark for 30 minutes, cells were washed, blocked with test Fc block (anti-mouse CD16/32) in permealization buffer and subsequently incubated with appropriately-diluted PE-labeled Abs to Foxp3 or CTLA4 at 4° C in the dark. After incubation, cell suspension was centrifuged, washed thrice and resuspended in appropriate volume of flow staining buffer. The cells were then analyzed as mentioned earlier. For intracellular staining of Foxp3 along with surface staining of both CD4 and CD25 (tri-color), approximately, 1 × 10⁶ splenic T cells suspended in flow staining buffer were incubated at 4° C with appropriately diluted FITC-labeled Ab to CD4 and APC-labeled Ab to CD25 for 30 and subsequently stained with appropriately diluted PE-labeled Foxp3 as mentioned above. For analysis, CD4+ cells were gated first and based on CD4+ gated cells, population of CD25 and Foxp3 were analyzed.
For Annexin V-FITC staining along with intracellular Foxp3, 1 × 10⁶ cells suspended in 1X binding buffer were incubated under the same condition with appropriately diluted Annexin V-FITC according to manufacturer’s protocol. Following incubation, the cell suspension was centrifuged, washed three times, and resuspended in fixation/permealization solution followed by intracellular staining with appropriately diluted PE-labeled Ab to Foxp3 as described above. The cells were then analyzed as mentioned earlier.
Immunofluoroscence Analysis
Immunofluorescence analysis was performed as described earlier (37, 38). Briefly, 4to 6 week old naive SJL/J mice were perfused intracardially with PBS (pH 7.4), and then with 4 % (w/v) paraformaldehyde solution in PBS. Dissected spleens were post-fixed in 4 % formaldehyde/PBS for 2–5 days and cryoprotected in 20 % sucrose/PBS overnight at 4 C. Splenic tissues were then embedded in OCT (TissueTek, Elkhart, IN) at −50 C, and processed for conventional cryosectioning to obtain frozen longitudinal sections (8 μm) and stored at −80 C. Frozen sections were then allowed to cool to at room temperature for 1.5 – 2 h, washed six times each for 5 minutes in 1X PBS, blocked in 2 % BSA in 1 X PBS with 0.5 % Triton at room temperature and incubated with rabbit anti-iNOS (1:400) along with rat anti-Foxp3 (1:400), or rat anti-CD11b (1:200) for overnight at room temperature for dual immunohistochemistry. Sections were then washed six times in 1X PBS and further incubated with Cy2 and Cy5 (Jackson ImmunoResearch Laboratories, West Grove, PA) for 1.5 h at room temperature followed by overnight drying. Next, the sections were rinsed in distilled water, dehydrated successively in ethanol and xylene and mounted and observed under an Olympus fluorescence microscope using a 40X objective.
Isolation of CD4+CD25+ (Tregs) T cells and CD4+CD25− T cells
The CD4+CD25+ (Tregs) T cells and CD4+CD25− T cells were isolated by using MagCellect mouse CD4+CD25+ Regulatory T cell isolation kit from R&D Systems. Briefly, at the first stage, enriched CD4+ T cells were obtained from splenocytes by negative selection. Next, the CD4+CD25+ Tregs were isolated by positive selection, where CD4+ T cells were reacted with anti-mouse CD25 biotinylated antibody, followed by incubation with ferrofluid and isolation of magnetically tagged wanted cells by using the MagCellect magnet. The tagged cells were then resuspended in RPMI media and used for subsequent experiments. The untagged cells that were CD4+CD25−, were also collected and resuspended in RPMI media for subsequent experimental studies.
Results
IL-12p40 homodimer (p402) down-regulates the expression of Foxp3 as well as decreases Foxp3+ naïve mouse T cells
Increased mRNA level of p40 in the CNS of MS and EAE strongly suggests that IL-12p40 itself might have a potential role in immunomodulation. Moreover, existence of 20 to 40 % of the p40 in the form of homodimer in endototoxin-treated mouse serum further suggests that IL-12p40 homodimer (p402) might have a predominant role in immunomodulation. Because Tregs are most important immunomodulatory subtype of T lymphocytes, we first investigated whether exogenous p402 had any effect on the expression of the regulatory T cell marker Foxp3 in splenic T cells isolated from naïve female SJL/J mice. Semi-quantitative and real-time PCR analysis shows that p402 down-regulated the expression of Foxp3 and even at a concentration of 25 ng/ml, there was significant decrease in the expression of Foxp3 compared to control (Fig. 1A & 1B). On the other hand, p402 had no effect on the mRNA expression of CD4 (Fig. 1A). Because Foxp3+ T cells usually express CD25, the expression of CD25 was also analyzed. Similar to Foxp3, the p402 dose-dependently reduced the expression of CD25 as evident from our semi-quantitative RT-PCR (Fig. 1A). However, the reduction of CD25 was not as sharp as that of Foxp3. It is most likely because of the facts that, not only the Foxp3+ Tregs, but also the activated T cells express CD25 and the observed reduction of CD25 is probably limited to Foxp3+ T cells. Recent reports suggest that, Foxp3 might play a critical role in the expression of CD25 (39). Consistently, we have also found that anti-sense-knockdown of Foxp3 abrogates sodium benzoate-triggered upregulation of CD25 in MBP-primed T cells (data not shown).
Fig. 1. Suppression of Foxp3 in naïve mouse T cells by IL-12p40 homodimer (p402).

Splenocytes isolated from naïve female young SJL/J mice were treated with different doses of p402 for 24 h followed by isolation of splenic T cells and mRNA analysis for expressions of Foxp3, CD4 and CD25 by semi-quantitative RT-PCR (A) and Foxp3 only by Real-time PCR (B). Data are mean ±SD of three different experiments. ap < 0.001 vs control. Normal control and p402–treated splenic T cells after 48 h of culture were incubated with appropriately-diluted PE-conjugated anti-CD4 and FITC-conjugated anti-CD25 Abs (C) as described in ‘Materials and Methods’ followed by FACS analysis. The percentage of cells in various quadrants has been mentioned. (D) The mean fluorescence intensity (MFI) of CD25 in CD4+CD25+ population was calculated by using CellQuest software. (E–G), Normal controls and p402 –treated splenic T cells, were incubated with appropriately diluted PE-conjugated anti-Foxp3 Ab and either FITC-conjugated anti-CD4 Ab as described in ‘Materials and Methods’ followed by FACS analysis. Percentage of cells in various quadrants has been mentioned. The mean fluorescence intensity (MFI) of total Foxp3 was calculated by using CellQuest software (F). (G) Normal control and p402-treated splenic T cells after 48 h of culture were incubated with appropriately diluted FITC-labeled anti-CD4 Ab, APC-labeled anti-CD25 Ab and PE-labeled anti-Foxp3 Ab as described in ‘Materials and Methods’ followed by FACS analysis. Dot plot analysis for CD25 and Foxp3 were performed based on gated CD4+ population. Results represent three independent experiments. ap < 0.001 & bp < 0.05 vs control.
There are many reports that show evidences of inverse correlation between Tregs and Th1 cells. Recently, Cao et al., have demonstrated that decrease in Foxp3 level in mice is associated with increased production of IL-12, IFN-γ, and TNF-α and the author suggested that this enhanced Th1 response is possibly due to down-regulation of Tregs (40). Here we also wanted to examine whether decrease in Foxp3 by p402 is also associated with increase in IFN-γ, the prototypic Th1 cytokine. Our semi-quantitative RT-PCR analysis reveals that in sharp contrast to the inhibition of Foxp3, p402 upregulated the mRNA level of IFN-γ in naïve mouse T cells (Fig. 1A). This observation implicates a functional significance of p402-mediated down-regulation of Foxp3+ Tregs.
As most of the Foxp3+ T cells are phenotypically characterized by surface co-expression of CD4 and CD25, we analyzed the effect of p402 on the proportion of CD4+CD25+ T cell population. Expectedly, there was significant reduction in CD4+CD25+ population of T cells by p402 as evident from FACS dot plot (Fig. 1C). A parallel decrease in mean fluorescence intensity (MFI) of CD25 in CD4+CD25+ population strongly validates our FACS interpretation (Fig. 1D). Here also we believe that decrease in CD25 is because of down-regulation of Foxp3 by IL-12p402.
However, it is possible that other T cell populations are altered by p402 treatment giving the impression that the Foxp3+ T cells are decreasing. To rule out the possibility, we performed intracellular staining of Foxp3 along with surface staining for CD4. As evident from figure 1E, p402 treatment markedly reduced Foxp3+ T cells. MFI calculation in figure 1F also shows that p402 treatment resulted in significant decrease in Foxp3. We further observed that there were no significant changes in percentage of Foxp3+ cells between the cells before the start of the culture (0h) and after 24 h of culture (Fig. 1E. left and middle panel), suggesting that reduction in Foxp3 is purely due to the effect of p402 and not due to any alteration in other parameters. To confirm that there is real decrease in Foxp3+ population after p402 treatment, the absolute numbers of total splenocytes, CD4+CD25+ cells, CD4+CD25− cells and the Foxp3+ cells were counted. Table-1 reveals that the numbers of Foxp3+ cells as well as CD4+CD25+ cells decreased markedly after the treatment with p402 (Table 1). Interestingly, although low in proportion, but a significant population of CD4−Foxp3+ cells has been noticed in figure 1E (upper left quadrant). At this point it is difficult to characterize this population, but, it could be CD8+. Recently, a set CD8+Foxp3+ Tregs has also been reported (41). Moreover, along with Foxp3 in CD4+ cells, Foxp3 in CD4− cells was also decreased by p402 clearly suggesting that the effect of p402 on Foxp3 is independent on the phenotypic nature of Foxp3+ T cells.
Table 1.
Absolute number of cells recovered from each treatment group
| Groups | Cell number (× 105) | |
|---|---|---|
| 0 h | 24 h | |
| Control splenocytes | 29.3 ± 2.5 | 28.5 ± 2.1 |
| Splenocytes + p402 | 29.3 ± 2.5 | 30.9 ± 1.9 |
| CD4+CD25+ cells present in control splenocytes | 0.92 ± 0.08 | 1.09 ± 0.15 |
| CD4+CD25+ cells present in p402-treated splenocytes | 0.92 ± 0.08 | 0.42 ± 0.02a |
| CD4+CD25− cells present in control splenocytes | 4.14 ± 0.32 | 4.85 ± 0.22 |
| CD4+CD25− cells present in p402-treated splenocytes | 4.14 ± 0.32 | 6.53 ± 0.5 |
| Foxp3+ cells present in control splenocytes | 0.515 ± 0.052 | 0.495 ± 0.09 |
| Foxp3+ cells present in p402- treated splenocytes | 0.515 ± 0.052 | 0.17 ± 0.03a |
The same numbers of splenocytes [(2.93 ± 0.25) × 106] were placed in culture for each group at the start of the experiment in the presence or absence of 50 ng/ml p402 for 24 h. From some groups, CD4+CD25+ T cells and CD4+CD25− T cells were isolated from control and p402-treated splenocytes at 0 h and 24 h by using MagCellect mouse CD4+CD25+ Regulatory T cell isolation kit (R&D Systems) and counted by trypan blue exclusion. In other groups, cells were stained with Foxp3 along with surface staining of CD4 followed by FACS analysis and quantifying of absolute numbers of Foxp3+ cells by using CellQuest software. Results are mean ± SD of three separate experiments.
p < 0.001 vs control-24 h.
Because a significant number of Foxp3+ cells also express CD25, we also studied the effect of p402 on the Foxp3+CD4+CD25+ cells by triple labeling. We performed intracellular staining of Foxp3 along with surface staining of CD4 and CD25. Expectedly, p402 treatment markedly reduced the population of Foxp3+CD4+CD25+ as well as Foxp3+CD4+CD25− cells (Fig. 1G).
IL-12p402 reduces the population of CTLA-4-positive cells in naïve mouse T cells
Cytotoxic T lymphocyte antigen 4 (CTLA4) is an important marker of Tregs that is suspected to play a major role in the suppression of proliferation of effecter T lymphocytes by inducing indolamine 2,3-dioxygenase (22). Moreover, CTLA4 is also likely to be positively regulated by Foxp3 (39). Because p402 down-regulated critical Treg marker Foxp3 as well as CD4+Foxp3+ and CD25+Foxp3+ T cells, we also wanted to examine the effect of p402 on the level of CTLA4. Therefore, we performed intracellular staining of CTLA4 along with surface staining of CD4. Expectedly, our FACS analysis shows that parallel to a reduction of Foxp3+ T cells, p402 also caused significant decrease in population of CTLA+ cells (Fig. 2A). This finding further supports the fact that p402 down-regulates Treg population.
Fig. 2. IL-12p402 reduces the population of CTLA4+ cells in naïve mouse T cells.

Splenocytes were treated with p402 for 24 hours followed by incubation of splenic T cells with appropriately-diluted FITC-conjugated anti-CD4 and following fixation and permeabilization PE-conjugated anti-CTLA4 (For intracellular CTLA4) for 1 h and FACS analysis (A). Splenocytes were treated with p402 for 24 h or with different doses of C2-ceramide or dihydro-C2-ceramide for 6 h followed by incubation of splenic T cells with appropriately diluted FITC-conjugated Annexin V and PE-conjugated Foxp3 for 1 h and FACS analysis (B). The percentage of cells in various quadrants has been mentioned. Data are mean ± SD of three different experiments.
To examine the possibility if cell death plays any role in p402-mediated suppression of Tregs, we performed dual FACS analysis for annexin V and Foxp3. It is clearly evident from figure 2B (upper panel) that p402 treatment did not cause any cell death as apoptotic cells were not detected at 0 h and 24 h with or without p402. On the other hand, consistent to figure 1, there was significant reduction in proportion of Foxp3+ cells after p402 treatment (Fig. 2B; upper panel). To examine the sensitivity of our assay, we used C2-ceramide, a prototype inducer of apoptosis. As expected, treatment of C2-ceramide resulted in dramatic and dose-dependent increase in population of apoptotic cells whereas dihydro-C2-ceramide, an inactive form of C2-ceramide, did not induce any apoptosis (Fig. 2B; lower panel). These results confirm that p402-mediated reduction in Foxp3 is not due to any apoptosis or cell death.
Down-regulatory effect of IL-12p402 on Foxp3 is via IL-12Rβ1, but not IL-12Rβ2
To understand the mechanism of p402 –mediated down-regulation of Foxp3, we investigated the role of IL-12 receptors (IL-12R). High affinity IL-12R is composed of two subunits, a low affinity IL-12Rβ1 combined with another low affinity IL-12Rβ2 that are responsible for Tyk2/Jak2 activation (1, 42). To determine the role of IL-12R subunits in p402-mediated down-regulation of Foxp3, splenocytes were isolated from wild type (B6.129), IL-12Rβ1 (−/−) and IL-12Rβ2 (−/−) mice and subsequently mRNA level of Foxp3 was examined by semi-quantitative and real-time PCR analysis. Interestingly, p402-mediated down-regulation of Foxp3 was almost completely abrogated in IL-12Rβ1 knockout splenocytes (Fig. 3C & D), while in wild-type and IL-12Rβ2 knockout splenocytes, the mRNA level of Foxp3 was down-regulated in a dose-dependent manner (Fig. 3A, B & E, F). However, greater down-regulation of Foxp3 mRNA by p402 was found in splenocytes of SJL/J mice (Fig. 1A & 1B) than that of B6.129 mice (Fig. 3A & 3B). These evidences strongly suggest that, IL-12Rβ1, but not IL-12Rβ2, is required for p402–mediated down-regulation of Foxp3.
Fig. 3. IL-12 p402 down-regulates Foxp3 via IL-12Rβ1, but not IL-12Rβ2.

Splenocytes isolated from wild-type (A, B), IL-12Rβ1 (−/−) (C, D) and IL-12Rβ2 (−/−) (E, F) mice were treated with different doses of p402 for 24 h followed by isolation of splenic T cells and mRNA analysis for expressions of Foxp3 and CD4 by semi-quantitative RT-PCR (A, C, E) and for Foxp3 by real-time PCR (B, D, F). Data are mean ±SD of three different experiments. ap < 0.001 & bp < 0.05 vs control.
IL-12p402 induces the production of NO in wild-type and IL-12Rβ2 (−/−), but not in IL-12Rβ1 (−/−), mouse splenocytes
NO plays a critical role in immune modulation (43). To understand the role of p402 and the involvement of IL-12R subunits in the induction NO production, we examined the effect of p402 on the production of NO in splenocytes isolated from wild-type and IL-12Rβ1 (−/−) and IL-12Rβ2 (−/−) mice. Interestingly, p402 dose-dependently induced the production of NO in both wild-type (Fig. 4A) and IL-12Rβ2 (−/−) (Fig. 4C) but not in IL-12Rβ1 (−/−) splenocytes (Fig. 4B). These results suggest that p402 is a potent inducer of NO in mouse splenocytes and that p402 induces NO production via IL-12Rβ1, but not IL-12Rβ2.
Fig. 4. Induction of NO production by IL-12 p402 in wild-type, IL-12Rβ1 and IL-12Rβ2 knockout mouse splenocytes.

Splenocytes isolated from wild-type (A), IL-12Rβ1 (−/−) (B) and IL-12Rβ2 (−/−) (C) mice were treated with different doses of p402. After 24 h, supernatants were used for nitrite assay as described under ‘Materials and Methods’. Results represent three independent experiments. ap < 0.001 vs control.
IL-1Lp402 induces iNOS but suppresses Foxp3 in naïve mice spleen in vivo
To further substantiate our findings in vivo in mice, immunohistochemical studies were performed to examine the effect of p402 on the protein level of iNOS and Foxp3 in mouse spleen in vivo. Expectedly, intraperitonial injection of p402 (150 ng/mouse) significantly increased iNOS expression while the expression of Foxp3 was diminished substantially (Fig. 5A). These data demonstrate an inverse relationship between iNOS and Foxp3. Our dual immunohistochemical studies with Foxp3-iNOS further reveal that there was no colocalization between iNOS and Foxp3. To identify the cell type that expresses majority of iNOS in the spleen after p402 treatment, splenic sections were double-immunolabeled for iNOS and CD11b, the marker of macrophages that are major antigen-presenting cells in the immune system. Figure 5B clearly shows that iNOS was markedly induced in spleens of p402-treated mice compared to control mice and that iNOS co-localized with CD11b-expressing cells. These results suggest that iNOS and Foxp3 are expressed by different cell types and that APCs express iNOS.
Fig. 5. Effect of IL-12p402 on the level of iNOS and Foxp3 in vivo in mouse spleen.

Mice (n=5 in each group) were injected i.p. with saline or p402 (150 ng/mouse) and 48 h after injection, splenic sections were double-immunolabeled for iNOS and Foxp3 (A) or iNOS and CD11b (B). Results represent analysis of four separate splenic sections from each of five different mice (n=5).
NO negatively regulates the expression of Foxp3 as well as Foxp3+ T cells
Because NO and Foxp3 were inversely related, we were interested to investigate whether NO regulated the expression of Foxp3. Splenocytes were treated with p402 along with different doses of L-NIL, the inhibitor of iNOS or PTIO, a NO scavenger, and subsequently examined for NO production and expression of Foxp3 by semi-quantitative and real-time PCR analysis. Interestingly, both L-NIL and PTIO dose-dependently restored the expressions of Foxp3 in p402–treated splenic T cells (Fig. 6A & B) while at the same time inhibited p402–induced NO production (Fig. 6C). As mentioned earlier, in Foxp3+ T cells, CD25 may be regulated by Foxp3. Therefore, we also examined the expression of CD25. It is evident from figure 6A that, like Foxp3, both L-NIL and PTIO dose-dependently restored the expression of CD25 in p402–treated splenic T cells. Because Foxp3+ Tregs are generally phenotypically characterized by CD4+CD25+ T cells, proportions of these cells in splenic T cells were also analyzed by FACS. Consistent with mRNA results, our FACS analysis shows that both L-NIL and PTIO were able to restore the proportion of CD4+CD25+ cells in p402-treated splenic T cells (Fig. 7A). To further substantiate the role of NO in the regulation of Foxp3, we analyzed the effect of L-NIL on the Foxp3+ cells in p402-treated splenic T cells by intracellular staining of Foxp3 along with surface staining of CD4. Expectedly, L-NIL markedly restored the proportion of Foxp3+ cells in p402-treated T cells as evident from figure 7B. Our FACS dot plots were further supported by MFI analysis (Fig. 7). We also examined if L-NIL and PTIO were able to modulate CD4+ T cell population. FACS analysis data in figure 8A and 8B clearly indicate that neither p402 nor NO modulators (L-NIL and PTIO) had any effect on CD4+ cells. These results suggest that the regulation of Tregs by p402-NO is not due to any modulation of CD4+ T cells.
Fig. 6. Nitric oxide (NO) negatively regulates the expression of Foxp3 in naïve mouse T cells.

Splenocytes isolated from mice were treated with either p402 alone or along with different doses of L-NIL or PTIO. After 24 h, splenic T cells were isolated followed by mRNA analysis for Foxp3, CD4 and CD25 by semi-quantitative RT-PCR (A) and Foxp3 by real-time PCR (B). (C) After 24 h, supernatants were used for nitrite assay as described under ‘Materials and Methods’. Data are mean ± SD of three different experiments. ap < 0.001 vs p402.
Fig. 7. Negative regulation of CD4+CD25+ as well as CD4+Foxp3+ cell population in naïve mouse T cells by NO.

Splenocytes isolated from mice were treated with either p402 alone or along with L-NIL or PTIO. After 48 h (A) or 24 h (B), splenic T cells were isolated and incubated with appropriately-diluted PE-conjugated anti-CD4 and FITC-conjugated anti-CD25 Abs (A) or PE-conjugated anti-Foxp3 and FITC-conjugated anti-CD4 Abs (B) followed by FACS analysis. (C) The mean fluorescence intensity (MFI) of Foxp3 in splenic T cells was calculated by using Cell Quest software. Data are mean ± SD of three different experiments. ap < 0.001 vs normal & bp < 0.001 vs p402.
Fig. 8. Effect of IL-12p402 on CD4-positive T cell population in the presence or absence of L-NIL and PTIO.

Splenocytes were treated with p402 in the presence or absence of L-NIL and PTIO. (A) After 24 h, splenic T cells were isolated and incubated with appropriately-diluted FITC-conjugated anti-CD4 Abs as described in ‘Materials and Methods’ followed by FACS analysis. (B) Population of CD4-positive T cells were represented quantitatively. Data are mean ± SD of three different experiments.
To further substantiate this finding in vivo, immunohistochemical studies were performed to examine the role of NO on Foxp3 protein level in spleens. Expectedly, the protein level of Foxp3 was significantly restored in mice that received L-NIL injection of 5 mg/kg body wt along with p402 (150 ng/mouse) (Fig. 9). These results clearly indicate that p402-mediated reduction in Foxp3 in vivo also requires NO.
Fig. 9. Negative regulation of the expression of Foxp3 in vivo in mouse spleen by NO.

Mice (n=5 in each group) were injected i.p. with saline, p402 (150 ng/mouse) only or p402 with L-NIL (5 mg/kg of body wt). After 48 h of injection, splenic sections were immunostained for Foxp3. (Magnification x 40) DAPI was used to visualize the nucleus. Results represent analysis of four separate sections from each of five different mice (n=5).
Regulation of Foxp3 in iNOS knockout mouse splenocytes
To confirm that NO is essential for the suppression of Tregs, splenic T cells isolated from wild type, iNOS (−/−) and iNOS (+/−) mice were analyzed for Foxp3 mRNA expression by semi-quantitative and real-time PCR analysis. Expectedly, the expression of Foxp3 was strongly suppressed in a dose-dependent manner by p402 in T cells from wild type (Fig. 10A & 10B), while the suppression of Foxp3 was moderate in heterozygous iNOS (+/−) T cells (Fig. 10D & 10E). On the other hand, p402 did not have any effect on the expression of Foxp3 in homozygous iNOS (−/−) T cells (Fig. 10G & 10H). Corresponding estimation of NO again shows an inverse correlation between Foxp3 and NO (Fig. 10C, 10F & 10I). These results confirm that NO is essential for p402–mediated suppression of Foxp3.
Fig. 10. NO production and expression of Foxp3 in wild-type, iNOS heterozygous and iNOS homozygous knockout mouse splenocytes.

Splenocytes isolated from wild-type (A-C), iNOS (+/−) (D-F), and iNOS(−/−) (G-I) knock-out mice were treated with different doses of p402. (A, D, G) After 24 h, supernatants were used for nitrite assay as described under ‘Materials and Methods’. Data are mean ± SD of three different experiments. ap < 0.001 vs control. Splenic T cells were isolated after 24 h, followed by mRNA analysis of Foxp3 by semi-quantitative RT-PCR (B, E, G) and real-time PCR (C, F, I). ap < 0.001 & bp < 0.05 vs control.
Is IL-12p402 capable of suppressing pure Tregs in the absence of APCs?
Our results that p402 suppresses Tregs via NO (Figs. 1–7) and that iNOS is primarily expressed by APCs (Fig. 5) suggest that p402 should not be able to inhibit Tregs in the absence of APCs. To examine this possibility, we purified CD4+CD25+ Tregs (~ 85% pure) from splenocytes that readily expressed Foxp3 mRNA at 0 h after isolation (data not shown). This purified population of Tregs was treated with p402 and DETA-NONOate (an NO donor) on anti-CD3- and anti-CD28-coated plates for 24 h. Consistent to our hypothesis, p402 was unable to suppress this population of purified CD4+CD25+ Tregs as evident from our FACS analysis (Fig. 11A; middle plot). However, DETA-NONOate treatment led to the suppression of CD4+CD25+ T population (Fig. 11A; right plot). Consistently, DETA-NONOate, but not p402, attenuated the mRNA expression of Foxp3 and CD25 in purified CD4+CD25+ T cells (Fig. 11B). These results further strengthen our hypothesis that NO is required for the down-regulation of Foxp3+ Tregs, that NO suppresses Tregs in the absence of other T cell types and that p402 is unable to attenuate Tregs in the absence of iNOS-expressing cells.
Fig. 11. The IL-12p402 has no effect on pure Treg population as well as pure population of CD4+CD25− T cells whereas NO reduces population of CD4+CD25+ T cells as well as the expression of Foxp3 in pure Tregs.
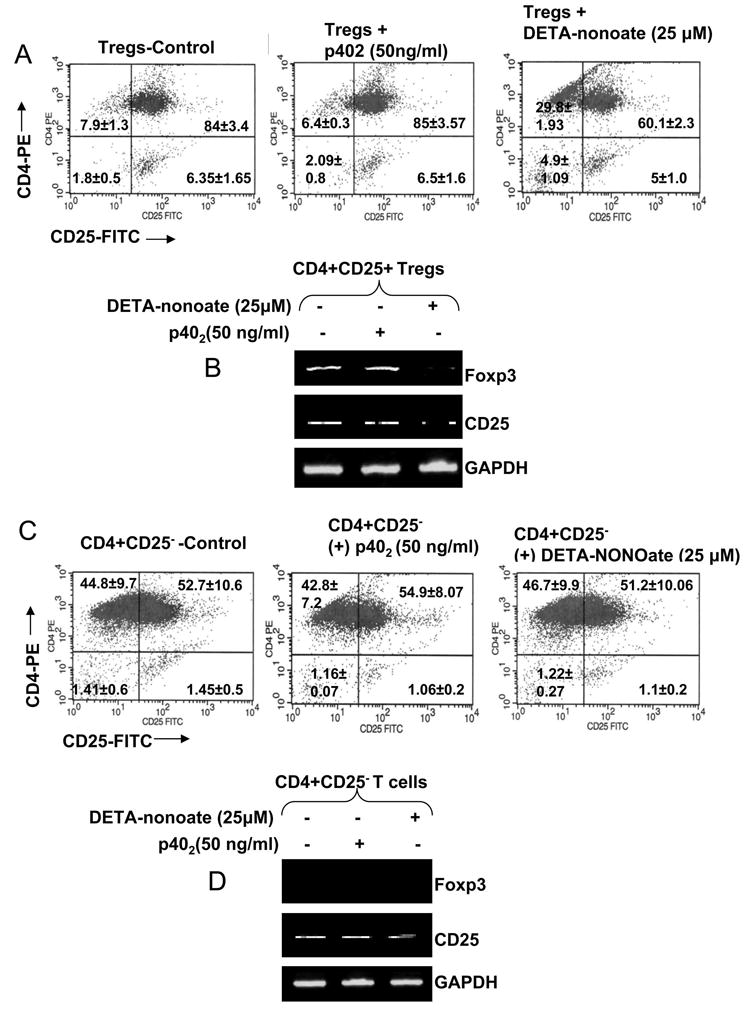
The pure CD4+CD25+ T cells and CD4+CD25− T cells were isolated as described in ‘Material & Methods’. Following isolation, the cells were cultured in twelve-well plates with appropriate concentrations of plate bound anti-CD3 and anti-CD28 with or without p402 (50 ng/ml) or DETA-NONOoate (25 μM). After 24 h, normal control, p402- and DETA-NONOate-treated pure CD4+CD25+ T cells (A) and CD4+CD25− T cells (C) were incubated with appropriately-diluted PE-conjugated anti-CD4 and FITC-conjugated anti-CD25 Abs as described in ‘Materials and Methods’ followed by FACS analysis. After 24 h of treatment, the mRNA expression of Foxp3 and CD25 were analyzed in CD4+CD25+ T cells (B) and CD4+CD25− T cells (D) by semi-quantitative RT-PCR.
Next we examined the effect of p402 and NO on effecter T cells (CD4+CD25−). FACS analysis on CD4+CD25− T cells immediately after isolation shows that very few cells (~0.75%) were CD25+ (data not shown). However, after 24 h of incubation on anti-CD3- and anti-CD28-coated plates, a major portion (~54%) of these cells was differentiated into CD4+CD25+ T cells. Although CD4+CD25− T cells were differentiated into CD4+CD25+ T cells after CD3/CD28 stimulation, we could not detect Foxp3 mRNA in this population of T cells (Fig. 11D). Therefore, it is obvious that these CD4+CD25+ T cells (Fig. 11C) are merely the activated T cells expressing CD25, but not Tregs. Similar to the effect of p402 on purified CD4+CD25+Foxp3+ Tregs (Fig. 11A & B), p402 was also unable to suppress this CD4+CD25+ T cell population that was newly differentiated from CD4+CD25− effecter T cells (Fig. 11C, middle plot). However, in contrast to the inhibitory effect of NO (DETA-NONOate) on CD4+CD25+Foxp3+ Tregs and the mRNA expression of CD25 in purified CD4+CD25+Foxp3+ Tregs, NO was also unable to inhibit this population (Foxp3-CD4+CD25+) of T cells (Fig. 11C; right plot) and to suppress the mRNA expression of CD25 (Fig. 11D) in this population. These results strongly suggest that NO exerts inhibitory effect exclusively on Foxp3+CD4+CD25+, but not Foxp3-CD4+CD25+ T cells. Our results also indicate that, in Foxp3-CD25+ T cells, NO does not suppress the expression of CD25.
Discussion
The IL-12 family of cytokines consists of five cytokines, which are IL-12, IL-12p40 monomer, IL-12p40 homodimer (p402), and IL-23 and IL-27. Among them IL-12, the heterodimer of p40 and p35 subunits, is the most widely studied one. The IL-12, a critical regulator of Th1 and Th2 cells, plays a major role in Th1-mediated autoimmune diseases by favoring polarization of Th0 cells to Th1 phenotype (42, 44). Although the p40 subunit is common to all the members of IL-12 family except IL-27, the biological roles of p40 monomer and p402 are not well studied. Previously it was known that p402 only antagonized the biological activity of p70 (IL-12) but itself did not have any biological role (42, 45, 46). However, Henizel et al have demonstrated a significant increase in p40 homodimer level in the serum of mice following LPS challenge (12). Moreover, several lines of evidences indicate that p40 is expressed in excessive amount in the CNS of different demyelinating diseases such as multiple sclerosis (MS), Guillain-Barre syndrome, and animal model of experimental autoimmune encephalomyelitis and neuritis (8, 10, 42). Therefore it is most likely that p40 plays a crucial role in the pathophysiology of autoimmune diseases and the p402 is the major cytokine involved in it. However, any molecular mechanism supporting the possibility is not understood yet.
The primary regulators of autoimmune diseases are regulatory T cells (Tregs). Tregs play a major role in the regulation of autoimmune Th1 cells by suppressing the activity of those cells (47, 48). Foxp3, the master regulatory transcription factor of Tregs, is essential for their suppressive activity although the surface molecules like CD25, CTLA-4, GITR may also play significant roles (15, 22, 23). Recent evidences suggest a significant decrease in the number of CD4+Foxp3+ T cells as well as the expression level of Foxp3 in relapsing-remitting MS and other lymphoproliferative autoimmune disorders (24–27). However the exact molecular mechanism behind the suppression of Foxp3 and Tregs is unknown. Recently, Dominitizki et al have demonstrated that trans-signaling via soluble IL-6 receptors might play a key role in the regulation of Foxp3 by augmenting the expression of SMAD7, the inhibitor of TGF-β signaling, and hence the Foxp3 expression (49, 50). However, as IL-6 signaling has both proinflammatory and anti-inflammatory roles (50, 51), the direct relevance of this mechanism to inflammatory pathophysiologic environment is not clearly understood. Several lines of evidences presented in this manuscript demonstrate that p402 down-regulates Foxp3 and hence the Tregs via IL-12Rβ1-mediated induction of NO.
Our mRNA analysis clearly demonstrates that in p402–treated splenocytes, the expressions of both Foxp3 and CD25 are significantly less than that of the control. Our FACS analysis further illustrates that down-regulation of Treg markers is exactly correlated to the reduction in the proportion and absolute numbers of Foxp3+ T cells. Because Foxp3+T cells are the functional Tregs, it is therefore evident that decrease in Foxp3+T cell proportion by p402 would result in decline in Treg functions. Because decrease in Tregs may underlie increase in Th1 cells, upregulation of IFN-γ, the prototypic Th1 cytokine, by p402 (Fig. 1A) clearly suggests functional consequence of p402-mediated down-regulation of Foxp3. Functional impairment of Tregs by p402 is further supported by a decrease in CTLA4-positive cells by p402. CTLA-4, an important marker of Tregs, is known to play critical roles in suppression of effecter T cells by inducing the activation of indolamine 2, 3-dioxygenase (IDO) in APCs (22). IDO catalyzes the initial and rate limiting step of tryptophan degradation resulting in tryptophan deficiency that is an essential proliferative stimulus for effecter T cells (22). However, as evident from the FACS data, the population of CD4+CD25+ T cells in control splenocytes are significantly higher (~35%) than CD4+Foxp3+ T cells (~5%) (Fig. 1C & E). This raises a possibility that not all but a subset of CD4+CD25+ T cells that expresses Foxp3, is responsible for Treg functions. This is also in relevance with several other reports that state that Foxp3 is more accurate and specific marker for Tregs than CD25 (21, 28). Moreover, CD25, the interleukin-2 (IL-2) receptor α-chain, is expressed by all activated T cells but may play important roles in generation, survival and function of Tregs (52). Interestingly, our FACS data also identifies a population of CD4−Foxp3+ T cells (~2.6%) (Fig. 1E; left two plots). Although it is difficult to characterize this category of cells, it is likely that these cells would show Treg properties as they are Foxp3+. These cells may belong to CD8+ and CD8+Foxp3+ Treg has also been reported recently (41). However, irrespective of phenotypic property of Foxp3+ T cells, they are attenuated by p402 as evident from our FACS analysis (Fig. 1E) suggesting that, p402 is able to down-regulate Foxp3 in different subsets of Foxp3+ T cells.
Next we addressed mechanisms by which p402 regulates Tregs. IL-12 is known to induce the activation of signal transducer and activator of transcription (STAT-4) in T cells through the IL-12Rβ1/IL-12Rβ2 complex (1). The high affinity IL-12 receptor complex is composed of a low affinity IL-12Rβ1 combined with a low affinity IL-12Rβ2, which are responsible for Tyk2/Jak2 activation (1, 42). In contrast, p402 has been shown to antagonize bioactive IL-12 by binding to the IL-12 receptor complex but does not mediate any biological response (53, 54). Therefore it is intriguing that how p402 regulates Tregs. Recently, Russel et al have shown that p402–dependent macrophage chemotaxis and respiratory viral inflammation are mediated through IL-12Rβ1 (55). In our studies, abrogation of p402–mediated down-regulation of Foxp3 in IL-12Rβ1 (−/−), but not IL-12Rβ2 (−/−), splenocytes strongly suggests that IL-12Rβ1, but not IL-12Rβ2, is essential for regulation of Tregs by p402.
NO, a diffusible free radical, is considered as a primary proinflammatory molecule, mediating inflammatory responses in autoimmune diseases like EAE, MS and X-adrenoleukodystrophy associated with infiltrating mononuclear cells (56, 57). NO may also play a vital role in switching of Th cells, particularly by favoring Th1 differentiation that is critical for Th1-mediated autoimmune diseases (43). Our current data clearly demonstrates that p402 dose-dependently induces the production of NO in mouse splenocytes and this induction of NO requires IL-12Rβ1, but not IL-12Rβ2. Consistently, our immunohistochemical studies also indicate that p402–mediated down-regulation of Foxp3 is associated with increase in iNOS expression. These iNOS-expressing cells did not co-localize with Foxp3-expressing cells. Macrophages are major antigen-presenting cells (APCs) in the periphery that express the surface marker CD11b. Co-localization of iNOS with CD11b suggests that cell types expressing iNOS are different from Foxp3-expressing cells and that macrophages are major producers of iNOS in the spleen. Therefore, it raises a question whether NO plays a role in regulation of Tregs. Interestingly, abrogation of p402-mediated down-regulation of Treg molecules as well as the decrease in Treg population by L-NIL, an iNOS inhibitor and PTIO, a NO scavenger, strongly suggests that NO is critically required for negative regulation of Tregs. In addition, inability of p402 to suppress Foxp3 in iNOS (−/−) splenocytes further corroborates our finding that NO is critical for the regulation of Tregs. Finally, NO alone also inhibited the expression of Foxp3 and suppressed the population of pure CD4+CD25+ Tregs in the absence of any iNOS-expressing APCs. Because Tregs do not produce NO, p402 was unable to suppress pure Tregs in the absence of any iNOS-expressing cells. However, in contrast to the suppressive effect of NO on Foxp3+CD4+CD25+ Tregs, NO was unable to modulate Foxp3-CD4+CD25+ T cells which are primarily the activated T cells.
In summary, our study describes a novel pathway for the regulation of Tregs by IL-12p40 homodimer (p402), the so-called biologically inactive molecule. Here we propose a model in which p402 signals via IL-12Rβ1 expressed on antigen presenting cells (APCs) like macrophages to induce the production of NO that in turn, diffuses into T lymphocytes and ultimately suppresses the expression of Treg-specific molecules (Fig. 12). Interestingly, IL-12Rβ1 is also expressed by T lymphocytes, but our unpublished data show that p402 is unable to induce the expression of iNOS in splenic T cells. Moreover, our immunohistochemical studies also reveal that iNOS and Foxp3 are expressed by different cells types. This could be probably because of any cell-specific difference in the signaling cascade down-stream to IL-12Rβ1. We have previously reported that the activation NF-κB is important for p402-induced expression of iNOS in microglia and peritoneal macrophages (13). Therefore there might be a possibility that p402–induced NF-κB activation is absent in T cells, but not in antigen presenting cells. Alternatively, NF-κB activation may be present in both T cells and APCs, but insufficient for induction of iNOS specifically in T cells in the absence of activation of other transcription factors. However, experimental studies are needed to establish these assumptions.
Fig. 12.

A model showing possible signaling mechanism involved in suppression of Tregs by IL-12 p402
Acknowledgments
This study was supported by grants from NIH (NS39940 and NS48923).
References
- 1.Gately MK, Renzetti LM, Magram J, Stern AS, Adorini L, Gubler U, Presky DH. The interleukin-12/interleukin-12-receptor system: role in normal and pathologic immune responses. Annual review of immunology. 1998;16:495–521. doi: 10.1146/annurev.immunol.16.1.495. [DOI] [PubMed] [Google Scholar]
- 2.Magram J, Connaughton SE, Warrier RR, Carvajal DM, Wu CY, Ferrante J, Stewart C, Sarmiento U, Faherty DA, Gately MK. IL-12-deficient mice are defective in IFN gamma production and type 1 cytokine responses. Immunity. 1996;4:471–481. doi: 10.1016/s1074-7613(00)80413-6. [DOI] [PubMed] [Google Scholar]
- 3.Mattner F, Magram J, Ferrante J, Launois P, Di Padova K, Behin R, Gately MK, Louis JA, Alber G. Genetically resistant mice lacking interleukin-12 are susceptible to infection with Leishmania major and mount a polarized Th2 cell response. European journal of immunology. 1996;26:1553–1559. doi: 10.1002/eji.1830260722. [DOI] [PubMed] [Google Scholar]
- 4.Scharton-Kersten TM, Yap G, Magram J, Sher A. Inducible nitric oxide is essential for host control of persistent but not acute infection with the intracellular pathogen Toxoplasma gondii. The Journal of experimental medicine. 1997;185:1261–1273. doi: 10.1084/jem.185.7.1261. [DOI] [PMC free article] [PubMed] [Google Scholar]
- 5.Cooper AM, Magram J, Ferrante J, Orme IM. Interleukin 12 (IL-12) is crucial to the development of protective immunity in mice intravenously infected with mycobacterium tuberculosis. The Journal of experimental medicine. 1997;186:39–45. doi: 10.1084/jem.186.1.39. [DOI] [PMC free article] [PubMed] [Google Scholar]
- 6.Wolf SF, Temple PA, Kobayashi M, Young D, Dicig M, Lowe L, Dzialo R, Fitz L, Ferenz C, Hewick RM, et al. Cloning of cDNA for natural killer cell stimulatory factor, a heterodimeric cytokine with multiple biologic effects on T and natural killer cells. J Immunol. 1991;146:3074–3081. [PubMed] [Google Scholar]
- 7.Constantinescu CS, Goodman DB, Hilliard B, Wysocka M, Cohen JA. Murine macrophages stimulated with central and peripheral nervous system myelin or purified myelin proteins release inflammatory products. Neuroscience letters. 2000;287:171–174. doi: 10.1016/s0304-3940(00)01184-8. [DOI] [PubMed] [Google Scholar]
- 8.van Boxel-Dezaire AH, Hoff SC, van Oosten BW, Verweij CL, Drager AM, Ader HJ, van Houwelingen JC, Barkhof F, Polman CH, Nagelkerken L. Decreased interleukin-10 and increased interleukin-12p40 mRNA are associated with disease activity and characterize different disease stages in multiple sclerosis. Annals of neurology. 1999;45:695–703. doi: 10.1002/1531-8249(199906)45:6<695::aid-ana3>3.0.co;2-r. [DOI] [PubMed] [Google Scholar]
- 9.Fassbender K, Ragoschke A, Rossol S, Schwartz A, Mielke O, Paulig A, Hennerici M. Increased release of interleukin-12p40 in MS: association with intracerebral inflammation. Neurology. 1998;51:753–758. doi: 10.1212/wnl.51.3.753. [DOI] [PubMed] [Google Scholar]
- 10.Podlaski FJ, V, Nanduri B, Hulmes JD, Pan YC, Levin W, Danho W, Chizzonite R, Gately MK, Stern AS. Molecular characterization of interleukin 12. Archives of biochemistry and biophysics. 1992;294:230–237. doi: 10.1016/0003-9861(92)90162-p. [DOI] [PubMed] [Google Scholar]
- 11.D’Andrea A, Rengaraju M, Valiante NM, Chehimi J, Kubin M, Aste M, Chan SH, Kobayashi M, Young D, Nickbarg E, et al. Production of natural killer cell stimulatory factor (interleukin 12) by peripheral blood mononuclear cells. The Journal of experimental medicine. 1992;176:1387–1398. doi: 10.1084/jem.176.5.1387. [DOI] [PMC free article] [PubMed] [Google Scholar]
- 12.Heinzel FP, Hujer AM, Ahmed FN, Rerko RM. In vivo production and function of IL-12 p40 homodimers. J Immunol. 1997;158:4381–4388. [PubMed] [Google Scholar]
- 13.Pahan K, Sheikh FG, Liu X, Hilger S, McKinney M, Petro TM. Induction of nitric-oxide synthase and activation of NF-kappaB by interleukin-12 p40 in microglial cells. The Journal of biological chemistry. 2001;276:7899–7905. doi: 10.1074/jbc.M008262200. [DOI] [PMC free article] [PubMed] [Google Scholar]
- 14.Hori S, Nomura T, Sakaguchi S. Control of regulatory T cell development by the transcription factor Foxp3. Science (New York, NY. 2003;299:1057–1061. doi: 10.1126/science.1079490. [DOI] [PubMed] [Google Scholar]
- 15.Coffer PJ, Burgering BM. Forkhead-box transcription factors and their role in the immune system. Nature reviews. 2004;4:889–899. doi: 10.1038/nri1488. [DOI] [PubMed] [Google Scholar]
- 16.Sakaguchi S, Powrie F. Emerging challenges in regulatory T cell function and biology. Science (New York, NY. 2007;317:627–629. doi: 10.1126/science.1142331. [DOI] [PubMed] [Google Scholar]
- 17.Maloy KJ, Powrie F. Regulatory T cells in the control of immune pathology. Nature immunology. 2001;2:816–822. doi: 10.1038/ni0901-816. [DOI] [PubMed] [Google Scholar]
- 18.Shevach EM. CD4+ CD25+ suppressor T cells: more questions than answers. Nature reviews. 2002;2:389–400. doi: 10.1038/nri821. [DOI] [PubMed] [Google Scholar]
- 19.Haas J, Fritzsching B, Trubswetter P, Korporal M, Milkova L, Fritz B, Vobis D, Krammer PH, Suri-Payer E, Wildemann B. Prevalence of newly generated naive regulatory T cells (Treg) is critical for Treg suppressive function and determines Treg dysfunction in multiple sclerosis. J Immunol. 2007;179:1322–1330. doi: 10.4049/jimmunol.179.2.1322. [DOI] [PubMed] [Google Scholar]
- 20.Ziegler SF. FOXP3: of mice and men. Annual review of immunology. 2006;24:209–226. doi: 10.1146/annurev.immunol.24.021605.090547. [DOI] [PubMed] [Google Scholar]
- 21.Sakaguchi S. Naturally arising Foxp3-expressing CD25+CD4+ regulatory T cells in immunological tolerance to self and non-self. Nature immunology. 2005;6:345–352. doi: 10.1038/ni1178. [DOI] [PubMed] [Google Scholar]
- 22.Beissert S, Schwarz A, Schwarz T. Regulatory T cells. The Journal of investigative dermatology. 2006;126:15–24. doi: 10.1038/sj.jid.5700004. [DOI] [PubMed] [Google Scholar]
- 23.Shevach EM, Stephens GL. The GITR-GITRL interaction: co-stimulation or contrasuppression of regulatory activity? Nature reviews. 2006;6:613–618. doi: 10.1038/nri1867. [DOI] [PubMed] [Google Scholar]
- 24.Brunkow ME, Jeffery EW, Hjerrild KA, Paeper B, Clark LB, Yasayko SA, Wilkinson JE, Galas D, Ziegler SF, Ramsdell F. Disruption of a new forkhead/winged-helix protein, scurfin, results in the fatal lymphoproliferative disorder of the scurfy mouse. Nature genetics. 2001;27:68–73. doi: 10.1038/83784. [DOI] [PubMed] [Google Scholar]
- 25.Wildin RS, Ramsdell F, Peake J, Faravelli F, Casanova JL, Buist N, Levy-Lahad E, Mazzella M, Goulet O, Perroni L, Bricarelli FD, Byrne G, McEuen M, Proll S, Appleby M, Brunkow ME. X-linked neonatal diabetes mellitus, enteropathy and endocrinopathy syndrome is the human equivalent of mouse scurfy. Nature genetics. 2001;27:18–20. doi: 10.1038/83707. [DOI] [PubMed] [Google Scholar]
- 26.Viglietta V, Baecher-Allan C, Weiner HL, Hafler DA. Loss of functional suppression by CD4+CD25+ regulatory T cells in patients with multiple sclerosis. The Journal of experimental medicine. 2004;199:971–979. doi: 10.1084/jem.20031579. [DOI] [PMC free article] [PubMed] [Google Scholar]
- 27.Huan J, Culbertson N, Spencer L, Bartholomew R, Burrows GG, Chou YK, Bourdette D, Ziegler SF, Offner H, Vandenbark AA. Decreased FOXP3 levels in multiple sclerosis patients. Journal of neuroscience research. 2005;81:45–52. doi: 10.1002/jnr.20522. [DOI] [PubMed] [Google Scholar]
- 28.Venken K, Hellings N, Thewissen M, Somers V, Hensen K, Rummens JL, Medaer R, Hupperts R, Stinissen P. Compromised CD4(+) CD25(high) regulatory T-cell function in patients with relapsing-remitting multiple sclerosis is correlated with a reduced frequency of FOXP3-positive cells and reduced FOXP3 expression at the single-cell level. Immunology. 2007 doi: 10.1111/j.1365-2567.2007.02690.x. [DOI] [PMC free article] [PubMed] [Google Scholar]
- 29.Jana M, Liu X, Koka S, Ghosh S, Petro TM, Pahan K. Ligation of CD40 stimulates the induction of nitric-oxide synthase in microglial cells. The Journal of biological chemistry. 2001;276:44527–44533. doi: 10.1074/jbc.M106771200. [DOI] [PMC free article] [PubMed] [Google Scholar]
- 30.Dasgupta S, Roy A, Jana M, Hartley DM, Pahan K. Gemfibrozil ameliorates relapsing-remitting experimental autoimmune encephalomyelitis independent of peroxisome proliferator-activated receptor-alpha. Molecular pharmacology. 2007;72:934–946. doi: 10.1124/mol.106.033787. [DOI] [PubMed] [Google Scholar]
- 31.Brahmachari S, Pahan K. Sodium benzoate, a food additive and a metabolite of cinnamon, modifies T cells at multiple steps and inhibits adoptive transfer of experimental allergic encephalomyelitis. J Immunol. 2007;179:275–283. doi: 10.4049/jimmunol.179.1.275. [DOI] [PMC free article] [PubMed] [Google Scholar]
- 32.Roy A, Fung YK, Liu X, Pahan K. Up-regulation of microglial CD11b expression by nitric oxide. The Journal of biological chemistry. 2006;281:14971–14980. doi: 10.1074/jbc.M600236200. [DOI] [PMC free article] [PubMed] [Google Scholar]
- 33.Jana M, Jana A, Liu X, Ghosh S, Pahan K. Involvement of phosphatidylinositol 3-kinase-mediated up-regulation of I kappa B alpha in anti-inflammatory effect of gemfibrozil in microglia. J Immunol. 2007;179:4142–4152. doi: 10.4049/jimmunol.179.6.4142. [DOI] [PMC free article] [PubMed] [Google Scholar]
- 34.Dasgupta S, Jana M, Liu X, Pahan K. Myelin basic protein-primed T cells induce nitric oxide synthase in microglial cells. Implications for multiple sclerosis. The Journal of biological chemistry. 2002;277:39327–39333. doi: 10.1074/jbc.M111841200. [DOI] [PMC free article] [PubMed] [Google Scholar]
- 35.Roy A, Liu X, Pahan K. Myelin basic protein-primed T cells induce neurotrophins in glial cells via alpha5beta3 integrin. The Journal of biological chemistry. 2007;282:32222–32232. doi: 10.1074/jbc.M702899200. [DOI] [PMC free article] [PubMed] [Google Scholar]
- 36.Dasgupta S, Jana M, Liu X, Pahan K. Role of very-late antigen-4 (VLA-4) in myelin basic protein-primed T cell contact-induced expression of proinflammatory cytokines in microglial cells. The Journal of biological chemistry. 2003;278:22424–22431. doi: 10.1074/jbc.M301789200. [DOI] [PMC free article] [PubMed] [Google Scholar]
- 37.Brahmachari S, Fung YK, Pahan K. Induction of glial fibrillary acidic protein expression in astrocytes by nitric oxide. J Neurosci. 2006;26:4930–4939. doi: 10.1523/JNEUROSCI.5480-05.2006. [DOI] [PMC free article] [PubMed] [Google Scholar]
- 38.Ghosh A, Roy A, Liu X, Kordower JH, Mufson EJ, Hartley DM, Ghosh S, Mosley RL, Gendelman HE, Pahan K. Selective inhibition of NF-kappaB activation prevents dopaminergic neuronal loss in a mouse model of Parkinson’s disease. Proceedings of the National Academy of Sciences of the United States of America. 2007;104:18754–18759. doi: 10.1073/pnas.0704908104. [DOI] [PMC free article] [PubMed] [Google Scholar]
- 39.Marson A, Kretschmer K, Frampton GM, Jacobsen ES, Polansky JK, MacIsaac KD, Levine SS, Fraenkel E, von Boehmer H, Young RA. Foxp3 occupancy and regulation of key target genes during T-cell stimulation. Nature. 2007;445:931–935. doi: 10.1038/nature05478. [DOI] [PMC free article] [PubMed] [Google Scholar]
- 40.Cao Q, Wang L, Du F, Sheng H, Zhang Y, Wu J, Shen B, Shen T, Zhang J, Li D, Li N. Downregulation of CD4+CD25+ regulatory T cells may underlie enhanced Th1 immunity caused by immunization with activated autologous T cells. Cell research. 2007;17:627–637. doi: 10.1038/cr.2007.46. [DOI] [PubMed] [Google Scholar]
- 41.Chaput N, Louafi S, Bardier A, Charlotte F, Vaillant JC, Menegaux F, Rosenzwajg M, Lemoine F, Klatzmann D, Taieb J. Identification of CD8+CD25+Foxp3+ suppressive T cells in colorectal cancer tissue. Gut. 2008 doi: 10.1136/gut.2008.158824. [DOI] [PubMed] [Google Scholar]
- 42.Wang X, V, Wilkinson L, Podlaski FJ, Wu C, Stern AS, Presky DH, Magram J. Characterization of mouse interleukin-12 p40 homodimer binding to the interleukin-12 receptor subunits. European journal of immunology. 1999;29:2007–2013. doi: 10.1002/(SICI)1521-4141(199906)29:06<2007::AID-IMMU2007>3.0.CO;2-0. [DOI] [PubMed] [Google Scholar]
- 43.Niedbala W, Wei XQ, Campbell C, Thomson D, Komai-Koma M, Liew FY. Nitric oxide preferentially induces type 1 T cell differentiation by selectively up-regulating IL-12 receptor beta 2 expression via cGMP. Proceedings of the National Academy of Sciences of the United States of America. 2002;99:16186–16191. doi: 10.1073/pnas.252464599. [DOI] [PMC free article] [PubMed] [Google Scholar]
- 44.Hsieh CS, Macatonia SE, Tripp CS, Wolf SF, O’Garra A, Murphy KM. Science. Vol. 260. New York, N.Y: 1993. Development of TH1 CD4+ T cells through IL-12 produced by Listeria-induced macrophages; pp. 547–549. [DOI] [PubMed] [Google Scholar]
- 45.Germann T, Rude E, Mattner F, Gately MK. The IL-12 p40 homodimer as a specific antagonist of the IL-12 heterodimer. Immunology today. 1995;16:500–501. doi: 10.1016/0167-5699(95)80035-2. [DOI] [PubMed] [Google Scholar]
- 46.Jana M, Dasgupta S, Saha RN, Liu X, Pahan K. Induction of tumor necrosis factor-alpha (TNF-alpha) by interleukin-12 p40 monomer and homodimer in microglia and macrophages. Journal of neurochemistry. 2003;86:519–528. doi: 10.1046/j.1471-4159.2003.01864.x. [DOI] [PMC free article] [PubMed] [Google Scholar]
- 47.Siegmund K, Feuerer M, Siewert C, Ghani S, Haubold U, Dankof A, Krenn V, Schon MP, Scheffold A, Lowe JB, Hamann A, Syrbe U, Huehn J. Migration matters: regulatory T-cell compartmentalization determines suppressive activity in vivo. Blood. 2005;106:3097–3104. doi: 10.1182/blood-2005-05-1864. [DOI] [PMC free article] [PubMed] [Google Scholar]
- 48.Fantini MC, Becker C, Tubbe I, Nikolaev A, Lehr HA, Galle P, Neurath MF. Transforming growth factor beta induced FoxP3+ regulatory T cells suppress Th1 mediated experimental colitis. Gut. 2006;55:671–680. doi: 10.1136/gut.2005.072801. [DOI] [PMC free article] [PubMed] [Google Scholar]
- 49.Dominitzki S, Fantini MC, Neufert C, Nikolaev A, Galle PR, Scheller J, Monteleone G, Rose-John S, Neurath MF, Becker C. Cutting edge: trans-signaling via the soluble IL-6R abrogates the induction of FoxP3 in naive CD4+CD25 T cells. J Immunol. 2007;179:2041–2045. doi: 10.4049/jimmunol.179.4.2041. [DOI] [PubMed] [Google Scholar]
- 50.Rose-John S, Scheller J, Elson G, Jones SA. Interleukin-6 biology is coordinated by membrane-bound and soluble receptors: role in inflammation and cancer. Journal of leukocyte biology. 2006;80:227–236. doi: 10.1189/jlb.1105674. [DOI] [PubMed] [Google Scholar]
- 51.Mitsuyama K, Toyonaga A, Sasaki E, Ishida O, Ikeda H, Tsuruta O, Harada K, Tateishi H, Nishiyama T, Tanikawa K. Soluble interleukin-6 receptors in inflammatory bowel disease: relation to circulating interleukin-6. Gut. 1995;36:45–49. doi: 10.1136/gut.36.1.45. [DOI] [PMC free article] [PubMed] [Google Scholar]
- 52.Venken K, Hellings N, Thewissen M, Somers V, Hensen K, Rummens JL, Medaer R, Hupperts R, Stinissen P. Compromised CD4+ CD25(high) regulatory T-cell function in patients with relapsing-remitting multiple sclerosis is correlated with a reduced frequency of FOXP3-positive cells and reduced FOXP3 expression at the single-cell level. Immunology. 2008;123:79–89. doi: 10.1111/j.1365-2567.2007.02690.x. [DOI] [PMC free article] [PubMed] [Google Scholar]
- 53.Ling P, Gately MK, Gubler U, Stern AS, Lin P, Hollfelder K, Su C, Pan YC, Hakimi J. Human IL-12 p40 homodimer binds to the IL-12 receptor but does not mediate biologic activity. J Immunol. 1995;154:116–127. [PubMed] [Google Scholar]
- 54.Gillessen S, Carvajal D, Ling P, Podlaski FJ, Stremlo DL, Familletti PC, Gubler U, Presky DH, Stern AS, Gately MK. Mouse interleukin-12 (IL-12) p40 homodimer: a potent IL-12 antagonist. European journal of immunology. 1995;25:200–206. doi: 10.1002/eji.1830250133. [DOI] [PubMed] [Google Scholar]
- 55.Russell TD, Yan Q, Fan G, Khalifah AP, Bishop DK, Brody SL, Walter MJ. IL-12 p40 homodimer-dependent macrophage chemotaxis and respiratory viral inflammation are mediated through IL-12 receptor beta 1. J Immunol. 2003;171:6866–6874. doi: 10.4049/jimmunol.171.12.6866. [DOI] [PubMed] [Google Scholar]
- 56.Bo L, Dawson TM, Wesselingh S, Mork S, Choi S, Kong PA, Hanley D, Trapp BD. Induction of nitric oxide synthase in demyelinating regions of multiple sclerosis brains. Annals of neurology. 1994;36:778–786. doi: 10.1002/ana.410360515. [DOI] [PubMed] [Google Scholar]
- 57.Waters VL, Hirata KH, Pansegrau W, Lanka E, Guiney DG. Sequence identity in the nick regions of IncP plasmid transfer origins and T-DNA borders of Agrobacterium Ti plasmids. Proceedings of the National Academy of Sciences of the United States of America. 1991;88:1456–1460. doi: 10.1073/pnas.88.4.1456. [DOI] [PMC free article] [PubMed] [Google Scholar]