Abstract
Functional network connectivity (FNC) is an approach that examines the relationships between brain networks (as opposed to functional connectivity (FC) that focuses upon the relationships between single voxels). FNC may help explain the complex relationships between distributed cerebral sites in the brain and possibly provide new understanding of neurological and psychiatric disorders such as schizophrenia. In this paper, we use independent component analysis (ICA) to extract the time courses of spatially independent components and then use these in Granger causality test (GCT) to investigate causal relationships between brain activation networks. We present results using both simulations and fMRI data of 155 subjects obtained during two different tasks. Unlike previous research, causal relationships are presented over different portions of the frequency spectrum in order to differentiate high and low frequency effects and not merged in a scalar. The results obtained using Sternberg item recognition paradigm (SIRP) and auditory oddball (AOD) tasks showed FNC differentiations between schizophrenia and control groups, and explained how the two groups differed during these tasks. During the SIRP task, secondary visual and cerebellum activation networks served as hubs and included most complex relationships between the activated regions. Secondary visual and temporal lobe activations replaced these components during the AOD task.
Keywords: causality, brain networks, Granger, connectivity, fMRI, ICA, spectrum, frequency, functional
1 Introduction
Functional connectivity (FC) investigates relationships using the functional MRI (fMRI) activation patterns among individual voxels or regions (Biswal et al., 1995). A recent extension of FC called functional network connectivity (FNC) is a powerful way of characterizing distributed changes in the brain by examining the functional interactions among different correlated brain networks, usually identified using independent component analysis (ICA) (Jafri et al., 2008; Londei et al., 2006).
In order to quantify the strength of interactions between brain regions and to reveal directed interactions of activated brain areas, Goebel et al. (2003) proposed using the Granger causality test (GCT) on fMRI measurements of a selected region of interest. They employed a measure of linear influence between two time series presented by Geweke (1982). In addition to a simulation example, they also used the averaged time-course of voxels in a specified reference region in a Granger causality test with other time courses obtained from each single voxel in the functional volume of the brain. Three parameters (ratios of the variance of noise in the autoregressive (AR) and autoregressive moving average (ARMA) models) presented by Geweke (1982) were evaluated for each reference region chosen. The results revealed a directed influence exerted by the left lateral prefrontal cortex and premotor areas on the left posterior parietal cortex.
Van De Ven et al. (2004) proposed applying spatial ICA to decompose fMRI time series data into maximally independent signals and to find functionally connected brain regions within sensory and motor regions in the resting-state fMRI data. They indicated that selecting seed voxels and correlating fMRI time courses of these with those of all other voxels is biased because the results only showed functional connectivity for that chosen brain region. The results showed that prefrontal and parietal areas were functionally connected during resting state and results were consistent in spatial, temporal and frequency parameters among subjects.
Londei et al. (2006) carried out a similar analysis to Goebel et al. (2003) except the Granger causality test was applied to the timecourses associated with ICA components (or networks). Three different parameters, first presented by Geweke (1982), were used to explain the causal relationships between ICA components based on the reduction of noise in an autoregressive model (Londei et al., 2006).
The results demonstrated the method as a promising approach to detect cognitive and causal relationships in neuroimaging data. It is proposed that spatial and temporal activities of fMRI data could be used first to extract components most correlated with the stimuli, which represented the independent functional activities. Then, GCT could be used to understand the dynamics of higher order processes that are usually difficult to detect and analyze causal relationships of brain activity networks. The empirical demonstration included in the study was useful in terms of explaining the application of GCT on the ICA components but there was no spectral information present.
Spectral analysis of the FC with both task-activation functional MRI and resting-state data were investigated by Cordes et al. (2001) using cross-correlation maps obtained from time courses of voxels. Contributions of low frequency components and physiological noise were examined. Since only low sampling rates were used during regular fMRI image acquisitions, they applied multi-slice acquisitions with a faster sampling rate (TR=0.4s instead of TR=2s) to prevent aliasing and to better be able to observe the effect of physiological noise in the spectrum. It has been found that low-frequency fluctuations (<0.1Hz) constituted more than 90% of the correlation coefficient spectrum. Physiological (respiratory, 0.1Hz to 0.5Hz and cardiac, 0.6Hz to 1.2Hz) noise contributed only 10% of the functional connectivity maps. We believe that investigation the spectral behavior of FNC can also be useful in understanding the complex interactions in the brain and their impact on the neurological disorders. Our approach in this paper is novel in the sense that the GCT approach we use enables us to determine causal information as a function of frequency. Hence we can identify which frequencies are driving the identified relationships between the time courses.
A particularly useful application of FNC would be to examine abnormal relationships among brain networks in psychiatric patients to better understand the neurobiological basis of the disorders. Schizophrenia is a chronic mental illness whose symptoms are thought to have a strong neurobiological basis. Functional segregation (i.e. the brain is an ensemble of functionally segregated areas) and functional integration (i.e. functionally specialized areas are integrated and psychological function are caused by distributed interactions) are two main views on brain functioning and they both find support today with the recent developments in functional neuroimaging (Friston, 1994). Localized pathophysiology of cortical areas in the brain might be sufficient to explain some aspects of schizophrenia, but does not appear sufficient to fully account for all possible symptoms, clinical course, or treatment considerations, which instead may be more related to the (dys)function of distributed networks (Friston and Frith, 1995). Indeed, one hypothesis is that schizophrenia is related to disruption of proper functional integration within key neural circuits in the brain (Friston and Frith, 1995; Friston, 1998).
Based on popular ‘disconnection’ theories in schizophrenia (Friston and Frith, 1995; Friston, 1998; Benes, 2000), we broadly hypothesized that patients with schizophrenia would show disrupted patterns of causal influence among networks. Previous functional neuroimaging literature has identified specific abnormalities in lateral and medial prefrontal cortex regions, along with evidence for disturbance in the integration of activity across a number of brain regions that include auditory cortex (Fletcher et al., 1999; Friston, 1999).
We previously examined FNC differences between schizophrenic and healthy adult control participants (Jafri et al., 2008) using the lag between time courses of independent components obtained via ICA. This approach defined the temporal relationships among ICA component time courses as a measure of functional network connectivity and applied it on the data for patients with schizophrenia and healthy controls. Using fMRI data obtained during an alert, passive “resting state”, it was found that patients with schizophrenia showed higher correlation than healthy controls.
In this study, we present a novel approach to analyze the causal relationships between functional brain networks without being dependent on any brain region to analyze the difference between patients with schizophrenia and healthy controls. There are several key differences between previous work and what we are proposing in this paper. First is the examination of FNC during two active tasks instead of passive rest. Our methodological approach also differs in that after application of ICA to decompose the fMRI data into maximally independent spatial components and corresponding time courses, the time courses are used as input to Granger causality test and spectral responses are presented for different directions, as described in the seminal paper (Granger, 1969). We are presenting the same equations in Section 2.3 for the sake of completeness and the background information on signal processing and statistics can be obtained from various sources (Oppenheim et al., 1996; Stark and Woods, 2001). The causal relationships between functional networks are presented as a spectrum and not just as a scalar to differentiate the low/high frequency responses and to investigate the differing behavior in various frequency bands.
In Section 2, we give detailed information on the data we used and the methods followed. Then, we present example simulations to demonstrate the validity of the technique and results that we obtained using fMRI data of a neurological task in Section 3. Next, we apply to two tasks collected from 155 patients with schizophrenia and healthy controls. In this case, we can identify the best distinguishing causal relationships between the groups by applying a two-sample t-test to the spectra computed from the GCT. Finally, Section 4 presents the concluding remarks and discusses the applicability of the technique.
2 Data and Methods
2.1 Data
We obtained the fMRI data used in this study through the Mind Research Network, which is a research consortium founded to help diagnose mental illnesses and other brain disorders, and to understand the course and neural mechanisms of schizophrenia. The data whose results were presented here were 155 subjects; 57 schizophrenia patients and 98 healthy controls, from two different sites (New Mexico and Iowa).
The data from the New Mexico site included 70 subjects; 34 patients with schizophrenia and 36 healthy controls. Patients with schizophrenia were receiving stable treatment with atypical antipsychotic medications (aripiprazole(7), olanzapine(2), risperidone(1), ziprasidone(1), clozapine(1)). Twenty eight subjects in each class were males. There were no significant between-group differences in age. The healthy controls ranged in age from 18 to 54 years (mean=28.9, SD=12.3). The patients ranged in age from 18 to 60 years (mean=31.4, SD=11.6).
The data from the Iowa site included 85 subjects: 23 patients with schizophrenia and 62 healthy controls. Patients with schizophrenia were receiving stable treatment with atypical antipsychotic medications (aripiprazole(13), olanzapine(7), risperidone(12), ziprasidone(4), clozapine(1), quetiapine(5)). 32 of the healthy controls and 10 of the patients were males. Healthy participants ranged in age from 18 to 57 years (mean=30.2, SD=10.6). Patients ranged in age from 18 to 60 years (mean=32.4, SD=12.3). In the second data set, there was no significant difference in the average ages of the two groups.
Schizophrenia patients in the data set were limited to those with a DSM-IV diagnosis of schizophrenia on the basis of a structured clinical interview and review of the case file (First et al., 1995). The healthy volunteer subjects were recruited from communities through newspaper advertising and carefully screened using a structured interview to rule out medical, neurological, and psychiatric illnesses, including substance abuse. Subjects with history of neurologic or psychiatric disease other than schizophrenia, head injury resulting in prolonged loss of consciousness and/or neurological sequelae, skull fracture, epilepsy, except for childhood febrile seizures, prior neuro-surgical procedure, and IQ less than or equal to 70, based on a standard IQ test or the ANART were excluded from the study. All subjects were fluent in English, provided written, informed, IRB approved consent at the scanning locations and were paid for their participation.
We applied our proposed method on fMRI data sets obtained during two different tasks. Subjects were scanned during performance of a Sternberg item recognition paradigm (SIRP) and auditory oddball (AOD) tasks. Sections 2.1.1 and 2.1.2 describe these tasks briefly. We present information on ICA and GCT that constitute the two consecutive steps in our algorithm in Sections 2.2 and 2.3, respectively.
2.1.1 Sternberg Item Recognition Paradigm (SIRP) Task
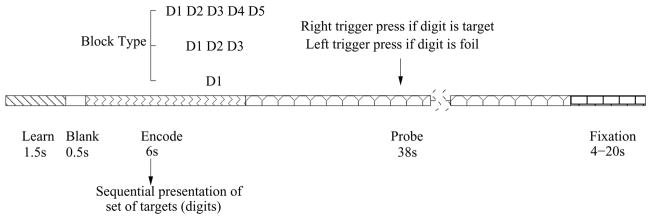
A working memory (WM) deficit is consistent with some of the symptoms of schizophrenia, since performing cognitive operations using WM permits individuals to respond in a flexible manner, to formulate and modify plans, and to base behavior on internally-held ideas and thoughts rather than being driven by external stimuli (Baddeley, 1992). The SIRP task was utilized as it is a choice reaction time task that requires working memory. Participants in the SIRP task are asked to memorize targets (digits) during the “encode” epoch and then are asked to respond by indicating whether the probe is a target (a member of the memorized set) or a foil (not a member of the memorized set). Figure 1 shows one of those blocks during an experiment.
Fig. 1.
Representation of a block in SIRP (Sternberg Item Recognition Paradigm). Two blocks of each of the three conditions with {1, 3, 5} digits (in a pseudorandom order) constitute a run.
Each block is composed of three epochs. During the encode epoch, one of the three possible WM blocks are pseudorandomly selected and the targets (digits) presented sequentially. Subjects are asked to respond to the probes (single digits) presented during the “probe” epoch and asked to respond with a right trigger press if the digit is a target (a member of the memorized set) or a left trigger press if the digit is a foil (not a member of the memorized set). In each of the probe epochs half the probes are targets and half are foils. A “fixation” epoch follows where a point is shown on the screen and subject is asked to relax and get ready for the next trial. The duration of the fixation epochs within a run is random, changing between 4 and 20 seconds. Six blocks (two blocks of each of the 3 conditions in a pseudorandom order) constitute a run and each run lasts approximately 6 minutes requiring the sum of fixation epochs to be 78 seconds.
2.1.2 Auditory Oddball Discrimination (AOD) Task
It is hypothesized that an important deficit in schizophrenia involves information processing (Braff, 1993). Patients with schizophrenia complain that they are subject to more stimuli than they can interpret (McGhie and Chapman, 1961). They misperceive, confuse internal with external stimuli (hallucinations), or do not respond at all to external stimuli. Patients sometimes cannot allocate attentional resources relevant tasks (resource allocation). Alternatively, patients may be unable to suppress irrelevant stimuli (inhibit) in order to focus on more significant ones (Watersa et al., 2003). This is why the auditory oddball task is widely used to assess sensory processing ability (McCarley et al., 1993; Shankardass et al., 2001; Tecchio et al., 2003; Symond et al., 2005).
During auditory oddball tasks, our participants wore sound-insulated earphones (Avotec, Stuart, FL) that present the auditory stimuli while shielding from noise due vibration of the gradient coil. Subjects are asked to respond by pressing a button with their right index finger every time they hear a target stimulus and not to respond to other standard tones or novel computer generated sounds. The same auditory stimuli have been found to be effective in differentiating healthy controls from schizophrenia subjects in previous fMRI studies (Kiehl and Liddle, 2001; Kiehl et al., 2005). Standard stimuli occur with a probability of p = 0.82 and are represented with 1 kHz tones. Target and novel stimuli are infrequent and each occurred with a probability of p = 0.09 (Fig. 2). Target stimuli are represented with 1.2 kHz tones and novel stimuli are computer generated, complex sounds. Each stimulus is presented with a pseudorandom order and last for 200 ms. The interstimulus interval changes randomly in the interval 550–2050 ms with a mean of 1200 ms. A total of four runs were acquired per session and each run comprised 90 stimuli. The sequences for target and novel stimuli were exchanged between runs to balance their presentation and to ensure that the activity evoked by the stimuli were not because of the type of the stimulus used.
Fig. 2.
Auditory Oddball Experiment. Three different stimuli are represented with different colors and unevenly spaced to indicate the pseudorandom generation (Demirci et al., 2008a).
2.1.3 fMRI Data
All scans were acquired at the Mind Research network sites in New Mexico and Iowa on Siemens Sonata 1.5T and Siemens 3T Trio dedicated head scanners equipped with 40mT/m gradients and standard quadrature head coils, respectively. Complementary imaging parameters were employed at both sites to ensure standardization of data collection. The functional scans were acquired using gradient-echo echoplanar-imaging with the parameters: repeat time (TR)= 2s, echo time (TE)= 40ms ((TE)= 30ms for Iowa), field of view= 22cm, acquisition matrix= 64 × 64, flip angle= 90°, voxel size= 3.44 × 3.44 × 4 mm3, gap= 1 mm, 27 slices, interleaved acquisition.
FMRI data were preprocessed using the software package SPM5 (SPM5, 2008). Images were realigned using INRIalign - a motion correction algorithm unbiased by local signal changes (Freire et al., 2002). Data were spatially normalized into the standard Montreal Neurological Institute space (Friston et al., 1995) and slightly sub-sampled to 3 × 3 × 3 mm3, resulting in 53 × 63 × 46 voxels. Next the data were spatially smoothed with a 9 × 9 × 9 mm3 full width at half-maximum Gaussian kernel.
2.1.4 Behavioral Data
Table 1 presents behavioral data for the SIRP test. The presented hit percentages consider all subjects from the two sites, but the reaction times were evaluated using only the subjects from the New Mexico site due to a hardware measurement error at one of the sites.
Table 1.
Comparison of schizophrenia patients and healthy controls in SIRP test using the hit percentages in targets and average reaction times. Both mean and standard deviations are listed.
| All Correct (%) | Target RT All (sec) | Load 1 Target RT (sec) | Load 3 Target RT (sec) | Load 5 Target RT (sec) | ||||||
|---|---|---|---|---|---|---|---|---|---|---|
| Patients | Controls | Patients | Controls | Patients | Controls | Patients | Controls | Patients | Controls | |
| mean | 94.59 | 98.57 | 665.97 | 583.62 | 556.59 | 497.89 | 685.55 | 607.10 | 775.76 | 645.87 |
| std | 5.61 | 0.91 | 92.50 | 62.82 | 65.86 | 60.75 | 89.71 | 61.86 | 135.51 | 77.51 |
Table 1 lists average hit accuracies and average response times of both patients and controls based on runs where three different block types were presented. These behavioral results also show that patients have longer average reaction times and standard deviations compared to controls, and hit accuracies are essentially the same, similar to those obtained in AOD experiment.
Table 2 lists the hit accuracies of the targets and average reaction times of both patients and controls based on four different runs included in an AOD experiment. The results indicate that patients have longer average reactions times and standard deviations compared to controls, and lower accuracies than controls with higher variability.
Table 2.
Comparison of schizophrenia patients and healthy controls in AOD test using the hit percentages in targets and average reaction times. Both mean and standard deviations are listed.
| Hits in Targets (%) | Avg. Reaction time (sec.) | |||
|---|---|---|---|---|
| Petients | Controls | Petients | Controls | |
| mean | 91.92 | 97.58 | 484.36 | 451.66 |
| std | 17.06 | 6.06 | 131.65 | 79.37 |
2.2 Independent Component Analysis (ICA)
Independent component analysis (ICA) has been a fruitful tool in the fMRI field by helping to delineate the spatiotemporal structure of fMRI data. The change in the fMRI signal is factored into a set of time courses and corresponding spatial patterns where either the spatial patterns or the time courses are a priori independent. In spatial ICA, the non-overlapping, temporally coherent brain activation networks are extracted without constraining the temporal domain (McKeown et al., 1998; Calhoun et al., 2001c).
ICA has been used on fMRI data to identify networks associated with schizophrenia. Calhoun et al. (2004) used ICA on fMRI data to identify aberrant localization of hemodynamic coherence in schizophrenia and suggested that abnormal patterns of coherence in temporal lobe cortical regions characterize schizophrenia. Garrity et al. (2007) also employed ICA of fMRI data to identify the default mode component, which is thought to reflect the resting state of the brain, and examined the differences in temporal and spatial aspects of the default mode. Significant spatial and temporal differences were observed between healthy controls and patients with schizophrenia in the default mode component.
We employed a group spatial ICA operation (Calhoun et al., 2001a,b; GIFT, 2008) on the data obtained from all subjects to separate the data into maximally independent sets and identify the networks most related to schizophrenia (Demirci et al., 2008b, 2007; Demirci and Calhoun, 2007; Demirci et al., 2008a). Time progress of voxels during the tasks were factored into 20 independent spatial aggregate components. After the application of ICA, independent spatial components were inspected visually and labeled as the default mode network, temporal lobe network, etc. based on the activation patterns. The time courses of the components were regressed with the designs used in the tasks and independent components were sorted in order of importance accordingly.
The aggregate components and results from the data reduction steps were used to generate single-subject time courses and spatial maps. This specific step is called back-reconstruction (Calhoun et al., 2001b). Figure 3 shows a sample set of spatial independent components with the corresponding time courses produced with an ICA run for a single-subject. Back-projection was used to extract individual Granger causality representations for homologue components across subjects and this approach cannot be used in a single-subject data set at this point, because we develop our statistical comparison using the between-subject variation.
Fig. 3.
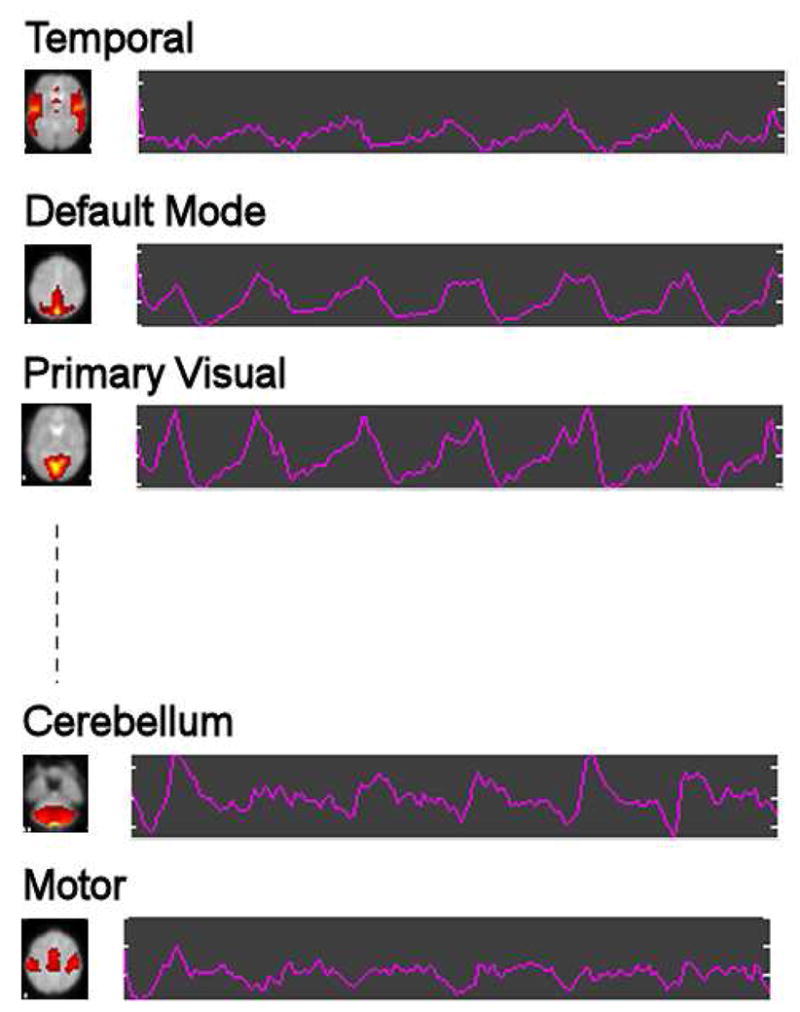
Sample ICA run: Spatial independent components represented with a slice (brain activation networks) and corresponding time courses for a subject.
2.3 Granger Causality Test in Spectral Domain
A spectral method was presented to describe and investigate the causal relationships between two or among more stationary variables for econometric purposes (Granger, 1969). It was stated that cross spectrum between the two variables can be decomposed into two parts and each of these parts represented a single causal direction of the relationship. Two-variable model was described as follows,
| (1) |
| (2) |
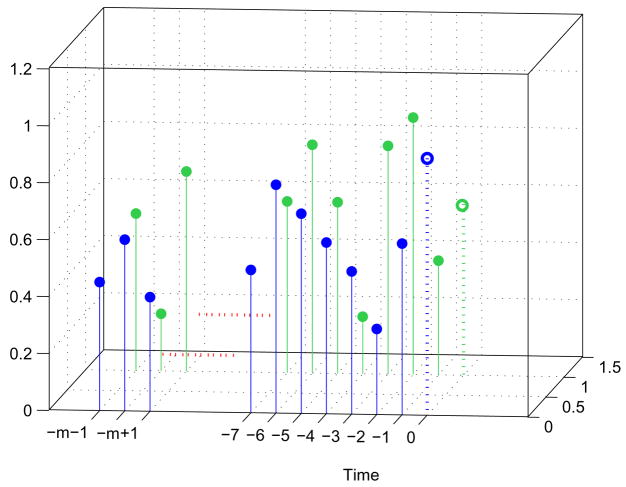
Equations 1 and 2 provide the relationship between two stationary time series Xt and Yt (possibly vectors) using the past “m” values of each other (Figure 4). Although the equations present the model with instantaneous causality, we will assume that present values of Xt and Yt will not be used in the prediction of Yt and Xt, respectively (b0 = c0 = 0). This approximation to the model may not be valid in every application and data set that Granger causality model is used on, but it seems valid for the application to fMRI activation networks taking into account the speed of the blood flow in the brain. We carried out some simulations to test the validity of this assumption and we used both original time courses and their interpolated forms (smaller sampling rates compared to original data) with various interpolation rates to study the impact of the zero-lag correlations. The similarity of the spectral responses for original time courses and the interpolated forms indicated that zero-lag correlations in the fMRI data we used were negligible, and they did not change our conclusions.
Fig. 4.
3D representation of the signals Xt and Yt for clarification. Temporal representation of the signals Xt and Yt. Present value of the signals are indicated with dotted lines. “m” is the order of the model and a variable.
Neglecting instantaneous causality simplifies the solution of the model making it possible to combine the two variables in a vector (Equations 12–13) and thus the equations reduce to a simple causal model making an analytical solution possible. In the future, we are also planning to consider the effect of instantaneous causality on fMRI data and extend the solution with a numerical analysis. In Equations 1 and 2, ak, bk, ck, dk are best fit regressors (matrices when Xt and Yt are vectors of time series), εt and ηt are two zero-mean uncorrelated white-noise series with,
| (3a) |
| (3b) |
| (3c) |
Granger presented a definition of causality feedback utilizing the noise terms (εt and ηt) in Equations 1 and 2 and stated that Y (X) is causing X (Y), Y ⇒ X (X ⇒ Y), if we are better able to predict present value of X (Y) using all available information than if the information apart from Y (X) had been used (Granger, 1969). This can be valid if the variance of the noise term decreases after utilization of past values of Y, Ȳ, in addition to usage of past values of X, X̄, with the best choice of {ak, bk, ck, dk} indicating a better prediction of X. This can be summarized as,
| (4) |
Feedback occurs, X ⇔ Y, if there is a mutual relationship and X is causing Y, too (X ⇒ Y). Not only variance but other possible criteria could also be used to draw conclusions on causality. In this study, we will be following Granger’s approach to investigate the causal relationships between brain networks and use variance of the residuals in the approximations as a measure of causality.
Partial directed coherence (PDC) is a similar measure used to measure the causal directed responses in the frequency domain and is also based on the Granger causality. PDC defines the amount of causal relationships in a similar but a different way. Considering a vector of two variables (x and y), Granger causality determines directed causal relationships in the frequency domain by the decomposition of the cross spectrum (Cr(w)) and normalization is done by autocorrelation functions (fx(w) and fy(w), power spectrum densities of individual functions of the vector variable). As it is stated by Schelter et al. (2005), PDC chooses the amount of causal relationships based on the frequency domain picture of the cross coefficients in the autoregressive model. Normalization is done by the sum of these mutual cross terms. We are planning to use PDC and Granger Causality to investigate not only pairwise but also more complex multi-channel relationships between brain networks in our future work (Kus et al., 2004).
Power spectrum densities of stationary signals Xt and Yt are given as,
| (5) |
| (6) |
where ℱ stands for the Fourier transform, ℛ is the autocorrelation function, Δ = |(1 − a)(1 − d) − bc|2 and , etc (Granger, 1969).
Cross spectrum, which is the Fourier transform of the cross correlation between the two signals, can be defined as
| (7) |
, and can be decomposed into two components representing the causality of Y by X (C1(w)) and causality of X by Y (C2(w)) (Granger, 1969).
Measure of the strength of the causality, and , in the frequency spectrum can be rewritten as,
| (8) |
| (9) |
These equations state that measure of feedback from X to Y, , and Y to X, , can be decomposed by frequency and we can talk about causality between the two variables at different frequency bands separately.
To obtain the frequency domain pictures indicated in Equations 8 and 9, we need to solve Equations 1 and 2, for a specific “m” value, and find the set of vectors {ak, bk, ck, dk} that minimize σε and ση.
When b0 = c0 = 0, Equations 1 and 2 turn into the simple causal model,
| (10) |
| (11) |
We can combine Xt and Yt into a new vector and treat the new vector as a new variable.
| (12) |
| (13) |
Combining the two variables into a vector helps us analyze multivariate time series with autoregressive (AR) models.
In Equation 13, “m” is the order of the AR model and Ak’s are the filter coefficients we try to find to best approximate the data, Vt, and to minimize the noise term, γt. γt’s are uncorrelated random vectors with mean zero and covariance matrix  ,
,
| (14) |
We used a Matlab package by Schneider and Neumaier (2001a,b) to analyze the time series corresponding to independent components. The optimal order of AR(m) model, mopt, was selected based on an interval given, [mmin, mmax] and an order selection criterion. We used [mmin = 1, mmax = 20] and preferred Schwartz Bayesian criterion (SBC) to determine mopt and to obtain the smallest mean-squared prediction error of the fitted AR model. mopt was not constant and changed between these values for every mutual relationship. A1, A2, …, Amopt and  were evaluated using the stepwise least square algorithm. These parameters were used in the evaluation of the spectral domain pictures given in Equations 8 and 9.
3 Results and Discussion
In Section 2, we described the fMRI data to be used in our study and presented a model to investigate the causal relationships between signals in time domain. The proposed model included two consecutive steps, ICA and GCT, to decompose the causal relationships between time courses of brain networks in the frequency spectrum. In this section, we present some results obtained with both simulated signals and also fMRI data obtained during two different tasks on 155 subjects.
Based on Fourier’s approach that aperiodic signals can be represented as weighted integrals of sinusoids with certain conditions, we can construct any signal as a linear combination of basic signals. This is why we first would like to examine Granger causality test using simple sum of sinusoids to simplify the initial findings, investigate the method’s validity and help clarify further results. Simple analysis of the technique will help us understand the causal relationships between time courses of the fMRI components and draw conclusions on the relationships of the activation networks.
3.1 Simulations
In the first part of our study, we used signals that are extremely simple in their spectral nature as input to Granger causality test. The response of the test in the spectral domain was investigated. The time courses that we used in the simulations can be represented in the most general form as,
| (15) |
In Equation 15, S is the sinusoidal signal with amplitude A, attenuation constant k, frequency ω, and phase φ. We assume that A = 1 for simplicity.
Representing the strength of causality in the frequency domain requires a Fourier transformation and the response is symmetric around zero and periodic with 2π. We are presenting the responses in the [−π, π] interval only with units of angular frequency. Regions around zero are low-frequency components and regions closer to −π and π correspond to high-frequency components.
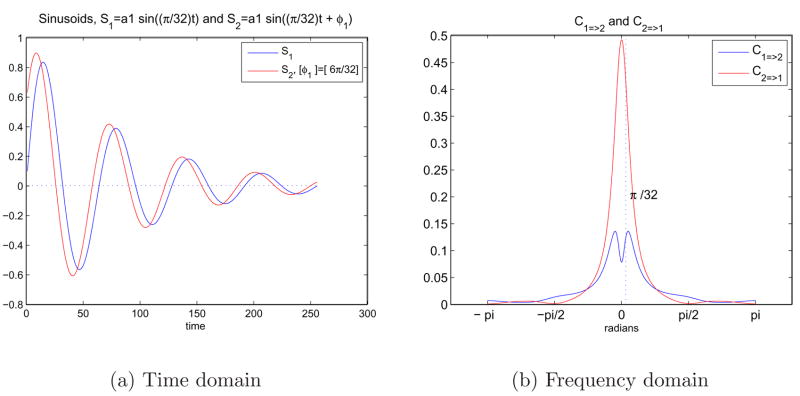
Figure 5(a) shows two exponentially decaying sine waves carrying the same frequency and attenuation constant but a different phase component, φ1. S1 follows S2 with a delay because of the phase difference between the signals. In other words, knowing about S2 at a particular time gives information about the future behavior of S1, and causes or drives it. Both signals have components only at ω1 = π/32 in the spectral domain and zero everywhere else. S1 and S2 were used as input to Granger causality test and Equations 8 and 9 were utilized. In Figure 5(b), C1=>2 (C=>1) shows the measure of causality from S1 (S2) to S2 (S1) at various frequencies.
Fig. 5.
5(a) Two sinusoids in time domain with an exponential decay and a phase difference. S1 = e−at sin(ω1t) and S2 = e−atsin(ω1t + φ1) where ω1 = π/32 and φ1 = 6π/32. 5(b) Representation of the causal relationship between sinusoids in frequency domain using Granger causality test.
The peak around ω1 = π/32 corresponds to the frequency value the two signals carry, and y-axis shows the amount of feedback from one signal to the other. A higher value of C2=>1 than C1=>2 indicates that S2 drives S1 more than S1 does S2. The amount of feedback between the two signals are negligible at the rest of the frequency spectrum, as sinusoids carry only a specific frequency value. The amount of decay due to the exponential terms has no effect on the spectral behavior as these are same for the same signals.
It is important to note here that we are not able to obtain the ideal abrupt jumps in Figure 5(b) due to the fractional nature of the Equations 8 and 9. We have extra responses at the tails around ω1 = π/32 and these cause a nonzero response even at zero frequency. Tails of positive and negative frequency peaks add up at zero and even exceeds the response at π/32 for C2=>1. This effect decreases with higher frequencies and higher phase differences.
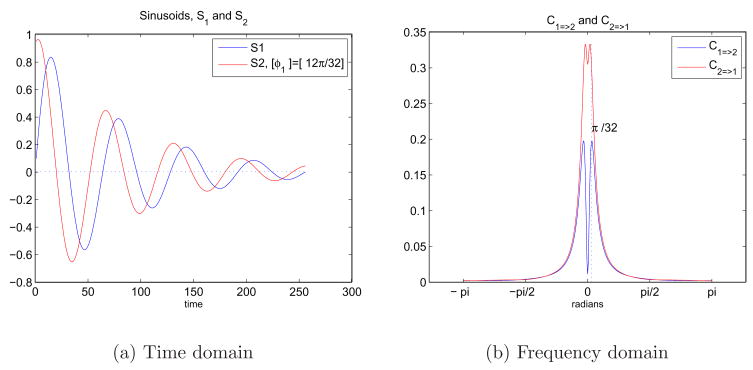
A similar test was employed increasing the phase delay between S1 and S2. These two signals can be seen in Figure 6(a). The corresponding behavior in the spectral domain is given in Figure 6(b). Just as we observed before, we have peaks around ω1 = π/32 and there is negligible causality in the rest of the frequency domain. As C2=>1 decreased, indicating a smaller amount of drive from S2 to S1 (S2 gave us less information about S1 compared to Figure 5), C1=>2 increased. It can be concluded that the measure of feedback will be smaller, and almost equal when the phase delay is π/2.
Fig. 6.
6(a) Two sinusoids in time domain with an exponential decay and a phase difference. S1 = e−at sin(ω1t) and S2 = e−atsin(ω1t + φ2) where ω1 =π/32 and φ2 = 12π/32. 6(b) Representation of the causal relationship between sinusoids in the frequency domain using Granger causality test.
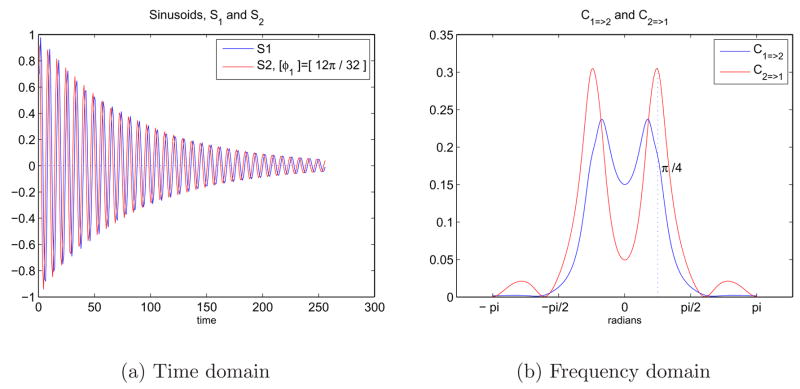
A similar example can be seen in Figures 7 where the sinusoids have higher frequencies and phase difference φ2 = 12π/32. Figure 7(b) shows that the peaks are located at ±ω2. S2 drives S1 at ω2 and frequencies higher than ω2, but S1 drives S2 for the lower frequencies.
Fig. 7.
7(a) Two sinusoids in time domain with an exponential decay and a phase difference. S1 = e−atsin((ω2t) and S2 = e−atsin((ω2t + φ2) where ω2 = π/4 and φ2 = 12π/32. 7(b) Representation of the causal relationship between sinusoids in the frequency domain using Granger causality test.
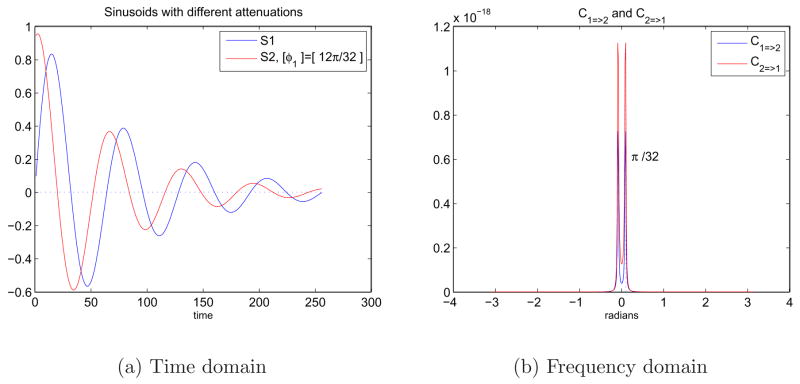
We can also look at the same sinusoids in Figure 6(a) when they have different amount of attenuations, Figure 8(a). Figure 8(b) shows that there are still peaks in the spectral domain around ±ω1 but the amount of causality is very close to zero and negligible. This indicates that signals decaying in different amounts do not cause each other because time frames including constant number of time samples give varying information about the two signals at different times.
Fig. 8.
8(a) Sinusoids in time domain with a phase difference and different exponential decays. S1 = e−atsin(ω1t) and S2 = e−btsin(ω1t + φ2) where a = −0.012, b = −0.015, ω1 = π/32, and φ2 = 12π/32. 8(b) Representation of the causal relationship between sinusoids of different attenuation in the frequency domain using Granger causality test.
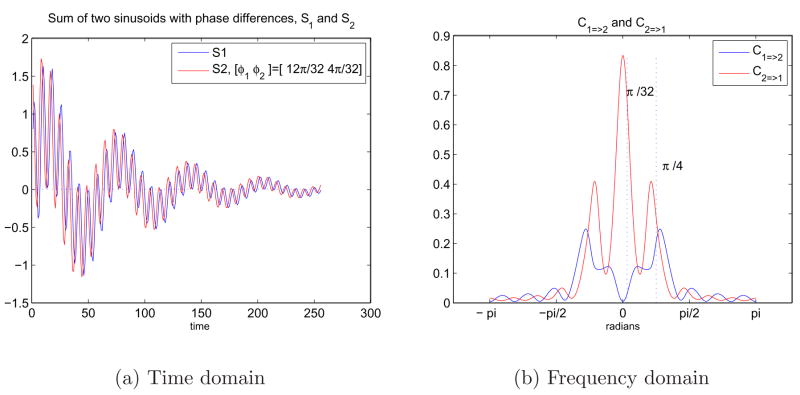
Causal relationships between two signals that are sum of two different sinusoids with a phase difference were also investigated employing Granger causality test. The two frequencies in each of the signals can be observed as slow and fast ripples in Figure 9(a). These two frequencies that sine waves carry can be observed as two different peaks at ω1 and ω2 in Figure 9(b). S2 still drives S1 at these frequencies due to the phase components added to the signals.
Fig. 9.
9(a) Sum of two sinusoids in time domain with an exponential decay and a phase difference. S1 = e−at(sin(ω1t) + sin(ω2t)) and S2 = e−at(sin((ω1t + φ1) + sin((ω2t + φ2))) where ω1 = π/4, ω2 = π/32, φ1 = 12π/32 and φ2 = 4π/32. 9(b) Representation of the causal relationship between sinusoids in the frequency domain using Granger causality test.
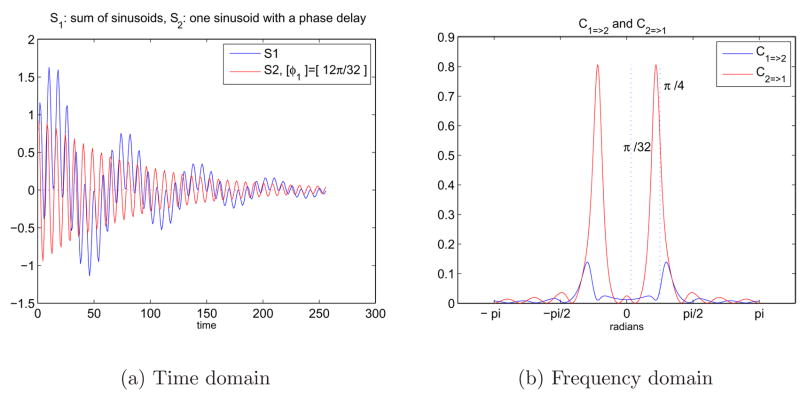
We also believed that a modification that we can apply to the example in Figures 9 might be helpful to understand the causal relationship between signals S1 and S2. We kept the first signal, S1, as earlier and removed one of the frequency components in the second signal, S2. S1 included two frequency components in it, and S2 had only one of these frequencies and a phase component added. As Figure 10(b) clearly shows, the drive between the two signals exist at only the common frequency band that S1 and S2 both have, and the drive in the rest of the spectrum is negligible. S2 still drives S1 due to the delay caused by the phase component, φ1, added.
Fig. 10.
10(a) Sum of two sinusoids in time domain with an exponential decay and a phase difference. S1 = e−at(sin(ω1t) + sin(ω2t)) and S2 = e−atsin((ω1t + φ1) where ω1 = π/4, ω2 = π/32, and φ1 = 12π/32. 10(b) Representation of the causal relationship between sinusoids in frequency domain using Granger causality test.
Although the examples presented here are simple, we believe that they are useful in illustrating the causal relationships between the time courses of independent components and brain networks, comprehend the idea behind the GCT. In Section 3.2, we will be presenting results that we obtained using the fMRI data obtained during two different tasks on a total of 155 subjects from two different sites.
3.2 Application on fMRI data
The method we propose in our study involves the application of ICA on fMRI data obtained during two different tasks (SIRP, AOD). We first decompose the data into spatially independent components and corresponding time courses. The time courses for each of the components represent the progress of the brain activation for that particular network for each individual subject.
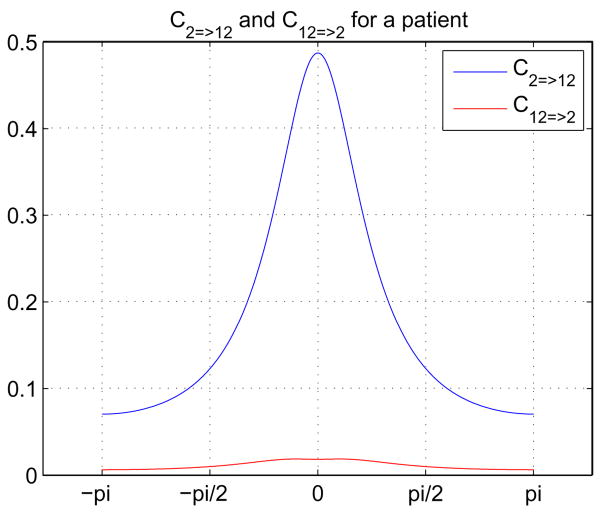
After ICA was run separately on AOD and SIRP fMRI data sets, we sorted the twenty spatially independent components using the regressors of the task and examined these images visually. The components most related to the task with the most important and meaningful activation patterns were determined, ten out of the total twenty components were picked and the remaining ones (which showed obvious artifacts such as those with large signals on the edge of the brain or in the ventricles) were eliminated. Table 3 lists these components for AOD and SIRP tasks together with the one- and two-sample t-values for different conditions. The time courses corresponding to 10 independent components were used as input to Granger causality test and a total of 45 mutual causal relationships between pair of networks were investigated. The analysis was repeated for each individual subject separately. Figure 11 shows the causal relationship between 2nd (default mode) and 12th (cerebellum) independent components from the SIRP task in two directions for one of the patients in the group. Considering the fact that the sampling time (TR) is 2 seconds, maximum frequency in the frequency domain (π) corresponds to 0.25 Hz. The patterns in Figure 11 indicate that default mode component drives the cerebellum for the lower frequencies and the drive from cerebellum to default mode is negligible in the whole spectrum.
Table 3.
List of independent components with meaningful activation patterns obtained using fMRI data of AOD and SIRP tasks. Component numbers indicate how well each independent component is correlated with the regressors of the applied task among 20 independent components. t-values are listed for one-sample (using all 155 subjects) and two-sample (using 98 healthy controls and 57 patients with schizophrenia as two groups, HC-SZ) t-tests on temporal regression parameters for different conditions. Average of three encode and probe conditions (1, 3, and 5) were presented for the SIRP task.
| AOD | SIRP | ||||||||||
|---|---|---|---|---|---|---|---|---|---|---|---|
| # | Component | Targets | Novels | Targets | Novels | # | Component | avg_ENC | avg_PRB | avg_ENC | avg_PRB |
| 1 -sample t-test | 2 -sample t-test | 1 -sample t-test | 2-sample t-test | ||||||||
| 6 | RDL PFC | 12.74 | 11.51 | 4.50 | 3.28 | 6 | Default | −1. 37 | −16.88 | 0.12 | −1.66 |
| 9 | Lateral Occipital (2nd Visual) | 3.16 | −3.31 | 0.93 | −0.03 | 13 | Bilateral Temporal | −11.18 | −9.41 | −2.14 | −0.53 |
| 10 | Motor | 6.20 | −2.55 | −2.64 | −2.61 | 7 | LDL PFC | 12.01 | 15.88 | 0.25 | 0.19 |
| 11 | LDL PFC | 2.17 | 0.41 | 1.29 | 2.04 | 11 | RDL PFC | 1. 95 | 5.51 | −0.55 | −0.04 |
| 5 | Default | −12.95 | −10.78 | −0.96 | −0.99 | 2 | Medial Occipital (1st Visual) | −0.90 | −13.87 | −0.64 | −1.31 |
| 8 | Cerebellum | 16.26 | 6.77 | 4.28 | 3.37 | 3 | Frontal Poles Anterior Cingulate | 14.73 | 17.27 | −0.11 | −0.33 |
| 7 | Medial Prefrontal | −20.09 | −9.97 | −0.40 | −1.75 | 8 | Cerebellum | 17.36 | 10.66 | 2.57 | −0.16 |
| 1 | Frontal Poles Anterior Cingulate | 22.61 | 13.39 | 2.09 | 2.30 | 12 | Motor | 0.00 | 3.76 | −2.19 | −1.35 |
| 2 | Bilateral Temporal | 19.49 | 18.53 | −0.05 | 2.25 | 4 | Medial Prefrontal Posterior Cingulate | −20.35 | −17.38 | −1.01 | −0.46 |
| 4 | Medial Occipital (1st Visual) | 1.70 | −0.66 | −0.47 | −0.43 | 1 | Lateral Occipital (2nd Visual) | 17.20 | −9.35 | −0.14 | −1.56 |
Fig. 11.
Granger Causality Test results for a patient using the SIRP data. The results were obtained between second (default) and twelfth (cerebellum) components. Numbering of the independent components is based on the ICA run. (π) corresponds to 0.25 Hz.
Although causal relationships between components for different subjects were variable in the frequency spectrum, we wanted to investigate the differences between healthy control and schizophrenia patient groups for each pair of independent components. Our approach enables us to study differences that are not observable using previously utilized methods, where the frequency spectrum was not utilized.
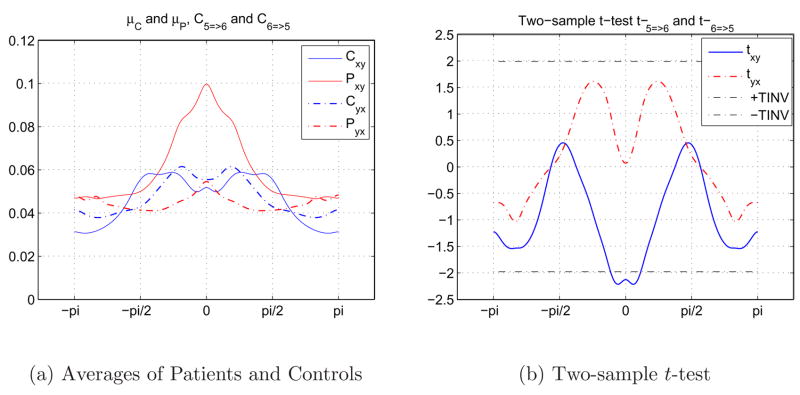
The relationships between pairs of 10 independent components were examined and the investigation was carried out using 45 different pairs of components separately. In Figure 12, we can see the average causal relationship between 5th (Left dorsolateral prefrontal cortex, L DLPFC) and 6th (Right dorsolateral prefrontal cortex, R DLPFC) components during the SIRP task. Figure 12(a) shows the average causal responses of 98 control (μC) and 57 schizophrenia patients (μP) in two different directions, xy (5 → 6) and yx (6 → 5). Although the difference between the average responses of healthy controls and schizophrenia patients for 6 → 5 is small, the difference for 5 → 6 is high for the lower frequencies and patients show a higher causality in this interval of the spectrum.
Fig. 12.
Causal relationships between 5th (L DLPFC) and 6th (R DLPFC) components during SIRP task. 12(a) 12(b).
In order to evaluate the statistical significance of the difference between groups, a two-sample t-test was been applied to the results obtained from individual subjects. t-value spectrum of the two directions for the same pair of independent components and the chosen threshold of t = ±2 are depicted in Figure 12(b). We pay extra attention to regions where the t-values are smaller than −2, or greater than 2, because these regions indicate that the two groups are significantly apart from each other. We examined causal relationships for 45 pairs of components and kept the component pairs that produced t-values ≪ −2 or ≫ 2 in a significant part of the spectrum, which indicated significant separation between healthy controls and schizophrenia patients. For example, causal relationships between 5th (L DLPFC) and 6th (R DLPFC) components were not enough for us to consider the pair in a final evaluation based on Figure 12(b).
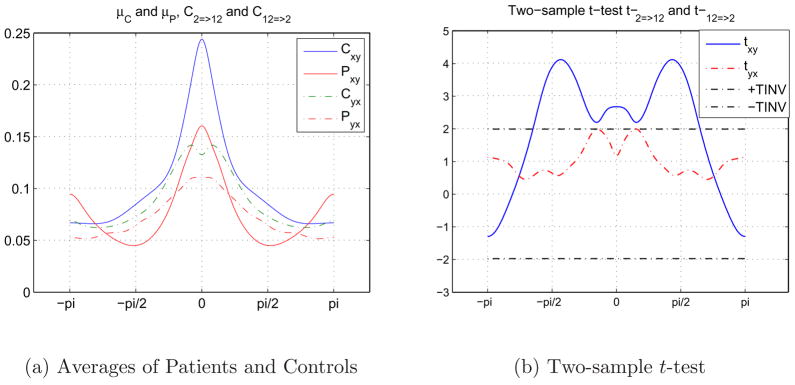
A similar example is presented in Figure 13 for the causal relationship between 2nd (Default) and 12th (Cerebellum) components during the SIRP task. Although the means of the control and patient group samples seem to be similar to each other in both directions in Figure 13(a), the two-sample t-test results in Figure 13(b) indicate that the separation between healthy control and schizophrenia patients is high in a band of frequencies, [π/6,4π/6]. The results indicate that 2nd (Default) component drives the 12th (Cerebellum) component in band of frequencies, which could be the main sinusoidal frequency both time courses have. The drive from the 12th (Cerebellum) component to the 2nd (Default) component is weaker between the groups and lower than the threshold assigned.
Fig. 13.
Causal relationships between 2nd (Default) and 12th (Cerebellum) components during SIRP task. 13(a) 13(b).
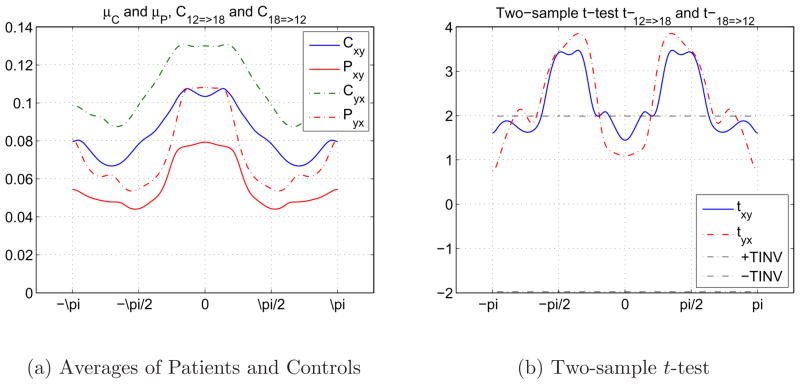
Another interesting relationship between two independent components, 12nd (Cerebellum) and 18th (Temporal), during the AOD task is presented in Figure 14. As we have seen earlier in Figure 14(a), means of the control and patient group samples seem to be similar to each other. But Figure 14(b) shows that the two independent components drive each other equally in a band of frequencies considering the difference between the groups. There is a mutually powerful drive difference betwen the groups between the two independent components.
Fig. 14.
Causal relationships between 12nd (Cerebellum) and 18th (Temporal) components during AOD task. 14(a) 14(b).
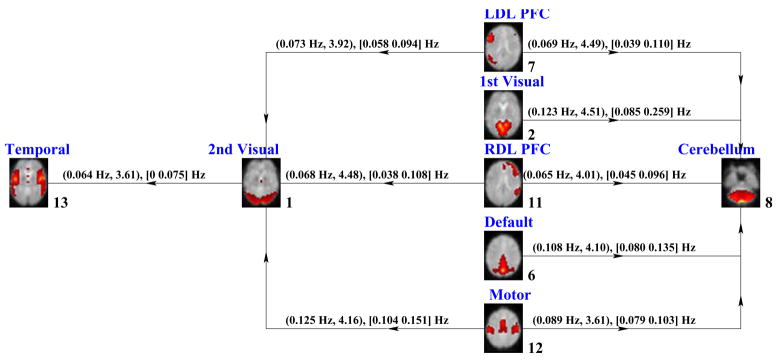
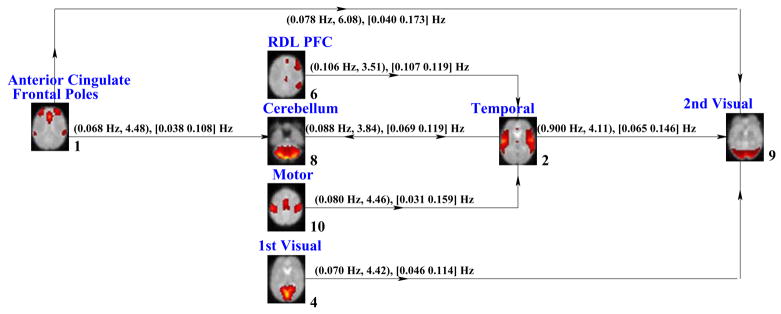
We examined each pair of independent components in both directions similarly using t-value spectrums and generated two diagrams with pairs of higher differences between schizophrenia patients and healthy controls. The differing relationships for schizophrenia patients and healthy controls between brain activation networks for SIRP and AOD tasks are summarized in Figures 15 and 16, respectively.
Fig. 15.
Granger Causality Test results for SIRP data. The connections and their directions between brain networks were depicted. (ftmax, tmax) frequency where maximum t-value is obtained and maximum t-value, [fmin fmax], frequency interval where the causal response is higher than 2, are given.
Fig. 16.
Granger Causality Test results for AOD data. The connections and their directions between brain networks were depicted. (ftmax, tmax) frequency where maximum t-value is obtained and maximum t-value, [fmin fmax], frequency interval where the causal response is higher than 2, are given.
Figure 15 shows the causal relationships between temporal, left dorsolateral prefrontal cortex (L DLPFC), right dorsolateral prefrontal cortex (R DLPFC), primary visual, secondary visual, motor and cerebellum activation networks during the SIRP task. These independent components shown are among the set of components whose mutual relationships show significant differences in causality between schizophrenia patients and healthy controls and the diagram highlights the deficiencies in the causality pathways. The numbers written in the lower right of the components indicate how well the time courses correlated with the regressors of the applied task. The direction on each link between the activation networks show the direction of drive, or which component drives the other one when a certain amount of difference in causality exists between the two groups. For example, when 6th component causes the 2nd, the two groups behave differently at least one interval in the spectrum with t6=>2 > 2. The links also include the frequency where the t-values reach its maximum and maximum t-value obtained at that frequency in parentheses. The square brackets include the frequency interval where the t-values are higher than the assigned threshold, t = 2.
In Figure 15, L DLPFC, R DLPFC, primary visual, default and motor networks can be distinguished from remaining networks as the ones where the two groups differ in causal connectivity compared to other components. In the SIRP task, cerebellum and secondary visual components appear to operate as causal hubs during the complex interactions between activated networks. This suggests that brain regions comprising these two components might play a particularly important role in differentiating patients with schziophrenia from healthy controls during the SIRP task. In particular, the cerebellum has been implicated previously in studies of mental timekeeping, automatic control of behavior, and behavioral adjustment, in part by firing as if in anticipation of input from other systems. This supports proposals that dysfunction in the cerebellum itself or its neural connectivity with other systems may underlie schizophrenia disconnection hypotheses (Andreasen et al., 1999).
Figure 16 summarizes similar relationships between the activation networks during the AOD task. In this case, relationships are significantly different between schizophrenia patient and healthy control groups in components dominated by activity within anterior cingulate/frontal poles, R DLPFC, cerebellum, motor, primary visual, temporal and secondary visual components. Similar to SIRP, the cerebellum, secondary visual and temporal components appear to serve as hubs of causal influence. For the AOD task, there are group differences in the mutual causal relationships between cerebellum and temporal activation networks. This underscores the likely relevance of abnormal neural communication between these two networks in schizophrenia. In addition, the network comprising ACC/frontopolar cortex appears to exert modulatory control over these hubs. Anterior cingulate cortex frequently has been described has having a role in cognitive monitoring of conflict, performance, or errors (Botvinick et al., 2004). The abnormal connectivity of this network to the key nodes within the system described by GCT results raises the possibility that abnormal anatomical connections among networks brain regions engaged for performance monitoring and adjustment may be important to schizophrenia pathophysiology.
These two complementary causal models of schizophrenia dysfunction identify networks of functionally-integrated brain regions that might have considerable importance in explaining with the nature of schizophrenia neurobiological impairment. Both profiles of schizophrenia network causality dysfunction found that temporal lobe, secondary visual and cerebellum networks showed disrupted influence by other networks engaged for task performance. The commonalities of schizophrenia abnormality between the two tasks are striking in recognition that they each engage markedly different cognitive demands. In previous research (Jafri et al., 2008), we observed that functional network connectivity between networks of sensory cortex regions were abnormally coupled with networks of prefrontal brain regions most commonly engaged for higher-order cognition. A similar pattern was found in this study. Abnormal top-down control from lateral prefrontal cortex over sensory cortex was observed in the SIRP indirectly through mediation by the Cerebellum network. In the AOD task, there was disruption of putative top-down influence from lateral prefrontal cortex directly to sensory cortex. Furthermore, despite the SIRP being a visual task and AOD auditory, both paradigms engaged separate auditory and visual networks during task performance and direct relationships between these two sensory modalities was abnormal in schizophrenia. The latter was not observed in our previous study (Jafri et al., 2008). The difference may be due to paradigm characteristics. At rest, functionally-integrated networks likely would not exert mutual causal influences in the same manner as during active task demands. The latter finding may reflect the same problems in inter-regional connectivity as hypothesized for presumed top-down control. However, its novelty raises the possibility that it could represent impairment of a different, perhaps more basic neural mechanism of inter-regional neural communication, similar to recent proposals of corrolary discharge dysfunction (Ford et al., 2007) which recently have been found in both auditory and visual systems (Ford and Mathalon, 2005).
4 Conclusion
Functional MRI technology has been fruitfully used to understand the complex functioning of the brain during various tasks. The hypotheses that schizophrenia patients differ from healthy controls due to the disruption of functional connectivity between distributed cerebral sites and the improper functional integration within the brain suggest the necessity of studying causal relationships between the activation networks utilizing fMRI data. We have demonstrated the utility of an algorithm that employs both ICA and GCT consecutively to depict complex system-wide causal interactions among distributed, functionally-integrated networks. FMRI activations for 155 subjects during SIRP and AOD tasks were analyzed. The activation patterns were first used in ICA and the data were decomposed into spatially independent components and corresponding time courses. These time courses were then used as input to GCT and causal relationships between independent components were investigated over a frequency spectrum rather than with a scalar only. We reported group differences in causal relationships, which were obtained over the whole spectrum of hemodynamic signal change frequencies, as an effort to explain the causal relationships at various frequencies for the first time.
These causal estimates summarize the complex relationships between independent components and might help to explain why patients with schizophrenia show neurocognitive abnormalities during SIRP and AOD task performance. From these results, several broad conclusions can be made. Active fMRI tasks such as the SIRP and AOD integrate complex networks of regions that influence each other in a presumably hierarchical fashion. In addition, there also is evidence that distributed networks are organized in a fashion suggestive of hubs of activity within specific circuits that directly or indirectly influence other neural function. The networks that engaged cerebellum and secondary visual cortex appeared to be important causal hubs for both tasks, while a network of frontopolar and medial-frontal cortex regions appeared to play a key modulatory role for the AOD task. There also is evidence for abnormal functional network connectivity in schizophrenia between networks made up of dorsolateral prefrontal brain region traditionally-thought of as key agents of ‘top-down’ control and networks whose structure suggests they are engaged in primary and secondary sensory processing. Although this method appears suitable for identifying group differences in functional network connectivity, it was not developed to shed light on specific neural mechanisms that contribute to causal interactions. Disruption of causal influences among distributed networks could occur for a variety of reasons, including abnormal white matter connections, disordered organization of cellular layers that are the targets of long-distance neural innervation, or specific problems with aspects of cell function that disrupt a local neuronal population’s ability to achieve the synchrony of activation that is measured by functional connectivity methods. This important line of inquiry has yet to be explored, but the results of this and similar studies will likely serve as the basis for selecting specific mechanisms to test.
Acknowledgments
The data collection was funded by the Department of Energy, grant DE-FG02-99ER62764. The authors would like to thank the MIND Institute staff for their efforts during the data collection process. This work was funded by the National Institutes of Health, under grants 1 R01 EB 000840 and 1 R01 EB 005846. We would like to thank very much
Footnotes
Publisher's Disclaimer: This is a PDF file of an unedited manuscript that has been accepted for publication. As a service to our customers we are providing this early version of the manuscript. The manuscript will undergo copyediting, typesetting, and review of the resulting proof before it is published in its final citable form. Please note that during the production process errors may be discovered which could affect the content, and all legal disclaimers that apply to the journal pertain.
References
- Andreasen NC, Nopoulos P, O’Leary DS, Miller DD, Wassink T, Flaum M. Defining the phenotype of schizophrenia: cognitive dysmetria and its neural mechanisms. Biological Psychiatry. 1999;46(7):908–920. doi: 10.1016/s0006-3223(99)00152-3. [DOI] [PubMed] [Google Scholar]
- Avotec, Stuart, FL: Avotec Inc. 603 N. W. Buck Hendry Way.
- Baddeley A. Working memory. Science. 1992;255(5044):556–559. doi: 10.1126/science.1736359. [DOI] [PubMed] [Google Scholar]
- Benes FM. Emerging principles of altered neural circuitry in schizophrenia. Brain Research Interactive. 2000;31:251–269. doi: 10.1016/s0165-0173(99)00041-7. [DOI] [PubMed] [Google Scholar]
- Biswal B, Yetkin FZ, Haughton VM, Hyde JS. Functional connectivity in the motor cortex of resting human brain using echo-planar mri. Magn Res Med. 1995;34:537–541. doi: 10.1002/mrm.1910340409. [DOI] [PubMed] [Google Scholar]
- Botvinick MM, Cohen JD, Carter CS. Conflict monitoring and anterior cingulate cortex: An update. Trends Cog Sci. 2004;8:539–546. doi: 10.1016/j.tics.2004.10.003. [DOI] [PubMed] [Google Scholar]
- Braff DL. Information processing and attention dysfunctions in schizophrenia. Schizophr Bull. 1993;19:233–259. doi: 10.1093/schbul/19.2.233. [DOI] [PubMed] [Google Scholar]
- Calhoun VD, Adali T, Pearlson GD, Pekar J. Group ica of functional MRI data: Separability, stationarity, and inference. ICA2001; San Diego, CA. 2001a. [Google Scholar]
- Calhoun VD, Adali T, Pearlson GD, Pekar JJ. A method for making group inferences from functional mri data using independent component analysis. Human Brain Mapping. 2001b;14:140–151. doi: 10.1002/hbm.1048. [DOI] [PMC free article] [PubMed] [Google Scholar]
- Calhoun VD, Adali T, Pearlson GD, Pekar JJ. Spatial and temporal Independent Component Analysis of functional MRI data containing a pair of task-related waveforms. Hum Brain Map. 2001c;13:43–53. doi: 10.1002/hbm.1024. [DOI] [PMC free article] [PubMed] [Google Scholar]
- Calhoun VD, Kiehl KA, Liddle PF, Pearlson GD. Aberrant localization of synchronous hemodynamic activity in auditory cortex reliably characterizes schizophrenia. Biol Psychiatry. 2004;55:842–849. doi: 10.1016/j.biopsych.2004.01.011. [DOI] [PMC free article] [PubMed] [Google Scholar]
- Cordes D, V, Haughton M, Arfanakis K, Carew JD, Turski PA, Moritz CH, Quigley MA, Meyerand ME. Frequencies contributing to functional connectivity in the cerebral cortex in “Resting-state” Data. Am J Neuroradiol. 2001;22:1326–1333. [PMC free article] [PubMed] [Google Scholar]
- Demirci O, Calhoun VD. Detection of schizophrenia using fMRI data via projection pursuit. IEEE International Workshop on Machine Learning for Signal Processing; Thessaloniki, Greece. 2007. [Google Scholar]
- Demirci O, Clark V, Calhoun VD. A Projection Pursuit Algorithm to Classify Individuals Using fMRI Data: Application to Schizophrenia. NeuroImage. 2008a;39:1774–1782. doi: 10.1016/j.neuroimage.2007.10.012. [DOI] [PMC free article] [PubMed] [Google Scholar]
- Demirci O, Clark V, Magnotta VA, Andreasen NC, Lauriello J, Kiehl KA, Pearlson GD, Calhoun VD. A Review of Challenges in the use of fMRI for Disease Classification/Characterization and A Projection Pursuit Application from Multi-site fMRI Schizophrenia Study. Brain Imaging and Behavior. 2008b doi: 10.1007/s11682-008-9028-1. in review. [DOI] [PMC free article] [PubMed] [Google Scholar]
- Demirci O, Tyo JS, Ritchie EA. Spatial and Spatiotemporal Projection Pursuit Techniques to Predict the Extratropical Transition of Tropical Cyclones. IEEE Transactions on Geoscience and Remote Sensing. 2007;45:418–425. [Google Scholar]
- First MB, Spitzer RL, Gibbon M, Williams JW. Structured Clinical Interview for Dsm-Iv Axis I Disorders-Patient Edition (Scid-I/P, Version 2.0) Biometrics Research Department, New York State Psychiatric Institute; New York: 1995. [Google Scholar]
- Fletcher P, McKenna PJ, Friston KJ, Frith CD, Dolan RJ. Abnormal cingulate modulation of fronto-temporal connectivity in schizophrenia. NeuroImage. 1999;9:337–342. doi: 10.1006/nimg.1998.0411. [DOI] [PubMed] [Google Scholar]
- Ford JM, Gray M, Faustman WO, Roach BJ, Mathalon DH. Dissecting corollary discharge dysfunction in schizophrenia. Psychophysiology. 2007;44(4):522–529. doi: 10.1111/j.1469-8986.2007.00533.x. [DOI] [PubMed] [Google Scholar]
- Ford JM, Mathalon DH. Corollary discharge dysfunction in schizophrenia: can it explain auditory hallucinations? Int J Psychophysiol. 2005;58(2–3):179–189. doi: 10.1016/j.ijpsycho.2005.01.014. [DOI] [PubMed] [Google Scholar]
- Freire L, Roche A, Mangin JF. What is the best similarity measure for motion correction in fMRI time series? IEEE Trans Med Imaging. 2002;21:470–484. doi: 10.1109/TMI.2002.1009383. [DOI] [PubMed] [Google Scholar]
- Friston K, Ashburner J, Frith CD, Poline JP, Heather JD, Frackowiak RS. Spatial registration and normalization of images. Hum Brain Map. 1995;2:165–189. [Google Scholar]
- Friston KJ. Functional and effective connectivity in neuroimaging: A Synthesis. Human Brain Mapping. 1994;2:56–78. [Google Scholar]
- Friston KJ. The disconnection hypothesis. Schizophrenia Research. 1998;30:115–125. doi: 10.1016/s0920-9964(97)00140-0. [DOI] [PubMed] [Google Scholar]
- Friston KJ. Schizophrenia and the disconnection hypothesis. Acta Psychiatr Scand Suppl. 1999;395:68–79. doi: 10.1111/j.1600-0447.1999.tb05985.x. [DOI] [PubMed] [Google Scholar]
- Friston KJ, Frith CD. Schizophrenia: A disconnection syndrome? Clinical Neuro-science. 1995;3:89–97. [PubMed] [Google Scholar]
- Garrity AG, Pearlson GD, McKiernan K, Lloyd D, Kiehl KA, Calhoun VD. Aberrant “default mode” functional connectivity in schizophrenia. Am J Psychiatry. 2007;164(3):450–457. doi: 10.1176/ajp.2007.164.3.450. [DOI] [PubMed] [Google Scholar]
- Geweke J. Measurement of linear dependence and feedback between multiple time series. Journal of the American Statistical Association. 1982;77:304–316. [Google Scholar]
- GIFT. Group ICA of fMRI Toolbox (GIFT) 2008 http://icatb.sourceforge.net/, Website, http://icatb.sourceforge.net/
- Goebel R, Roebroeck A, Kim E, Formisano D. Investigating directed cortical interactions in time-resolved fMRI data using vector autoregressive modeling and Granger causality mapping. Magnetic Resonance Imaging. 2003;21:1251–1261. doi: 10.1016/j.mri.2003.08.026. [DOI] [PubMed] [Google Scholar]
- Granger CWJ. Investigating causal relations by econometric models and cross-spectral methods. Econometrica. 1969;37:424–438. [Google Scholar]
- Jafri MJ, Pearlson GD, Stevens M, Calhoun VD. A method for functional network connectivity among spatially independent resting-state components in schizophrenia. Psychiatry. 2008 doi: 10.1016/j.neuroimage.2007.11.001. in review. [DOI] [PMC free article] [PubMed] [Google Scholar]
- Kiehl KA, Liddle PF. An event-related functional magnetic resonance imaging study of an auditory oddball task in schizophrenia. Schizophr Research. 2001;48:159–171. doi: 10.1016/s0920-9964(00)00117-1. [DOI] [PubMed] [Google Scholar]
- Kiehl KA, Stevens MC, Celone K, Kurtz M, Krystal JH. Abnormal hemodynamics in schizophrenia during an auditory oddball task. Biol Psychiatry. 2005;57:1029–1040. doi: 10.1016/j.biopsych.2005.01.035. [DOI] [PMC free article] [PubMed] [Google Scholar]
- Kus R, Kaminski M, Blinowska K. Determination of eeg activity propagation: pair-wise versus multichannel estimate. Biomedical Engineering, IEEE Transactions on. 2004;51:1501–1510. doi: 10.1109/TBME.2004.827929. [DOI] [PubMed] [Google Scholar]
- Londei A, D’Ausilio A, Basso D, Belardinelli MO. A new method for detecting causality in fMRI data of cognitive processing. Cogn Process. 2006;7:42–52. doi: 10.1007/s10339-005-0019-5. [DOI] [PubMed] [Google Scholar]
- McCarley RW, Shenton ME, O’Donnell BF, Faux SF, Kikinis R, Nestor PG, Jolesz FA. Auditory p300 abnormalities and left posterior superior temporal gyrus volume reduction in schizophrenia. Arch Gen Psychiatry. 1993;50:190–197. doi: 10.1001/archpsyc.1993.01820150036003. [DOI] [PubMed] [Google Scholar]
- McGhie A, Chapman J. Disorders of attention and perception in early schizophrenia. British Journal of Medical Psychology. 1961;34:103–116. doi: 10.1111/j.2044-8341.1961.tb00936.x. [DOI] [PubMed] [Google Scholar]
- McKeown MJ, Makeig S, Brown GG, Jung TP, Kindermann SS, Bell AJ, Sejnowski TJ. Analysis of fmri data by blind separation into independent spatial components. Hum Brain Map. 1998;6:160–188. doi: 10.1002/(SICI)1097-0193(1998)6:3<160::AID-HBM5>3.0.CO;2-1. [DOI] [PMC free article] [PubMed] [Google Scholar]
- Oppenheim AV, Willsky AS, Hamid S. Signals and Systems. Prentice-Hall Signal Processing Series; 1996. [Google Scholar]
- Schelter B, et al. Testing for directed influences among neural signals using partial directed coherence. Journal of Neuroscience Methods. 2005;152:210–219. doi: 10.1016/j.jneumeth.2005.09.001. [DOI] [PubMed] [Google Scholar]
- Schneider T, Neumaier A. Algorithm 808: ARfit - A Matlab package for the estimation of parameters and eigenmodes of multivariate autoregressive models. ACM Trans Math Softw. 2001a;27:58–65. [Google Scholar]
- Schneider T, Neumaier A. Estimation of parameters and eigenmodes of multivariate autoregressive models. ACM Trans Math Softw. 2001b;27:27–57. [Google Scholar]
- Shankardass A, Nicolson R, Fawcett A. A combined structural-functional classification of schizophrenia using hippocampal volume plus fMRI activation. 5th BDA International Conference; University of York, UK. 2001. [Google Scholar]
- SPM5. Statistical Parametric Mapping (SPM) 2008 http://www.fil.ion.ucl.ac.uk/spm/, Website, http://www.fil.ion.ucl.ac.uk/spm/
- Stark H, Woods JW. Probability and Random Processes with Applications to Signal Processing. Prentice Hall; 2001. [Google Scholar]
- Symond MB, Harris AWF, Gordon EWLM. Gamma synchrony in first-episode schizophrenia: A disorder of temporal connectivity? Am J Psychiatry. 2005;162:459–465. doi: 10.1176/appi.ajp.162.3.459. [DOI] [PubMed] [Google Scholar]
- Tecchio F, Benassic F, Zappasodia F, Gialloretid LE, Palermoe M, Serif S, Rossinig PM. Auditory sensory processing in autism: a magnetoencephalographic study. Biol Psychiatry. 2003;54:647–654. doi: 10.1016/s0006-3223(03)00295-6. [DOI] [PubMed] [Google Scholar]
- Van De Ven VG, Formisano E, Prvulovic D, Roeder CH, Linden DE. Functional connectivity as revealed by spatial independent component analysis of fMRI measurements during rest. Human Brain Mapping. 2004;22:165–178. doi: 10.1002/hbm.20022. [DOI] [PMC free article] [PubMed] [Google Scholar]
- Watersa FAV, Badcockb JC, Mayberya MT, Michiea PT. Inhibition in schizophrenia: association with auditory hallucinations. Schizophrenia Research. 2003;62:275–280. doi: 10.1016/s0920-9964(02)00358-4. [DOI] [PubMed] [Google Scholar]


