Abstract
In addition to increased glucose uptake, insulin action is associated with increased total and microvascular blood flow, and vasomotion in skeletal muscle. The aim of this study was to determine the effect of acute insulin resistance caused by the peripheral vasoconstrictor α-methylserotonin (αMT) on microvascular vasomotion in muscle. Heart rate (HR), mean arterial pressure (MAP), femoral blood flow (FBF), whole body glucose infusion (GIR) and hindleg glucose uptake (HGU) were determined during control and hyperinsulinaemic euglycaemic clamp conditions in anaesthetized rats receiving αMT infusion. Changes in muscle microvascular perfusion were measured by laser Doppler flowmetry (LDF) and vasomotion was assessed by applying wavelet analysis to the LDF signal. Insulin increased GIR and HGU. Five frequency bands corresponding to cardiac, respiratory, myogenic, neurogenic and endothelial activities were detected in the LDF signal. Insulin infusion alone increased FBF (1.18 ± 0.10 to 1.78 ± 0.12 ml min−1, P < 0.05), LDF signal strength (by 16% compared to baseline) and the relative amplitude of the myogenic component of vasomotion (0.89 ± 0.09 to 1.18 ± 0.06, P < 0.05). When infused alone αMT decreased LDF signal strength and the myogenic component of vasomotion by 23% and 27% respectively compared to baseline, but did not affect HGU or FBF. Infusion of αMT during the insulin clamp decreased the stimulatory effects of insulin on GIR, HGU, FBF and LDF signal and blocked the myogenic component of vasomotion. These data suggest that insulin action to recruit microvascular flow may in part involve action on the vascular smooth muscle to increase vasomotion in skeletal muscle to thereby enhance perfusion and glucose uptake. These processes are impaired with this model of αMT-induced acute insulin resistance.
Insulin action in vivo increases limb blood flow and microvascular blood flow (capillary recruitment) in hindlimb muscle of rats (Rattigan et al. 1997). The increase in microvascular flow in rat muscle has been measured by three methods, a reporter biochemical agent (1-methylxanthine) targeted to capillary xanthine oxidase (Rattigan et al. 1997), contrast enhanced ultrasound (Dawson et al. 2002) and laser Doppler flowmetry (Clark et al. 2001a), and proposed by us to enhance delivery and thus increase glucose uptake (e.g. see review Clark, 2008). In addition, by administering a number of agents (e.g. αMT (Rattigan et al. 1999), TNFα (Youd et al. 2000), FFA (Clerk et al. 2002), or glucosamine (Wallis et al. 2005)) that cause acute insulin resistance, a tight link has been shown between insulin-mediated microvascular flow and glucose uptake in muscle (Clark, 2008). Thus insulin-mediated increases in microvascular flow account for approximately half of the insulin-mediated muscle glucose uptake in vivo (Rattigan et al. 1999). Such a relationship raises the possibility that any impairment in microvascular flow may cause a corresponding impairment of muscle glucose uptake by limiting delivery (Clark, 2008).
Insulin-mediated increases in capillary recruitment have also been reported in skin of human subjects, during systemic insulin clamps (Serne et al. 2002), or following direct application to the surface of the skin (Rossi et al. 2005b). To facilitate entry of the insulin into the skin on the human forearm, iontophoresis has been used (Jaap et al. 1996; Serne et al. 2002; Rossi et al. 2005b) and the change in microvascular perfusion measured by LDF. The LDF technique measures red blood cell flux, the product of cell movement (non-vectorial) and cell number. Providing there are no changes in bulk blood flow, an increase in the reflected total LDF signal is thought to be indicative of an increase in microvascular perfusion or capillary recruitment (Serne et al. 2002). A recent notable outcome from LDF studies has been the recent analysis of the subsidiary components of the reflected total LDF signal by either Fourier (de Jongh et al. 2004) or wavelet analysis (Rossi et al. 2005a). Such analysis revealed rhythmic oscillations attributable to a spontaneous rhythmic change of arteriolar diameter. This vasomotion may play an important role in ensuring that tissue, such as muscle, is evenly perfused (Rucker et al. 2000) by periodically redistributing blood from one region of the muscle to another. It has been observed to be most active under conditions of reduced perfusion (Nilsson & Aalkjaer, 2003), but is also readily detectable in skeletal muscle vasculature at rest. Vasomotion is thought to be generated in the vascular wall and not to be a consequence of heartbeat, respiration, or neuronal input (Nilsson & Aalkjaer, 2003).
Several research groups have analysed the reflected LDF signal from human skin to provide indirect assessment of vasomotion (Kvernmo et al. 1998; Stefanovska et al. 1999; Rossi et al. 2005a). The highest (peak) frequency component of the LDF signal reflects the heart beat, which in humans ranges from 0.6 Hz to 1.6 Hz depending on fitness. Respiratory activity peak is the second highest frequency at 0.15 to 0.4 Hz. The third highest frequency component is around 0.1 Hz and is thought to correspond to blood pressure regulation, where the smooth muscle cells in the vessel's walls respond to changes in intravascular pressure, and this is known as the myogenic response (Johnson, 1991). It is this component of the total LDF signal that has been reported to increase predominantly as a result of insulin action in skin (Rossi et al. 2005b). Two additional components are evident at the interval from 0.02 to 0.06 Hz and at around 0.01 Hz and these are thought to derive from neuronal (Kastrup et al. 1989) and endothelial activity (e.g. see Bracic & Stefanovska, 1998; Stefanovska et al. 1999), respectively.
There is one report of an increase in vasomotion in muscle as a result of insulin action where an LDF probe was impaled in the leg of healthy human subjects undergoing a hyperinsulinaemic clamp (de Jongh et al. 2004). Insulin increased the contribution of frequencies between 0.01 and 0.04 Hz (determined by Fourier analysis), which the authors attributed to increased endothelial and neurogenic activity (de Jongh et al. 2004). To date there have been no studies in experimental animals where vasomotion in muscle microvasculature has been determined. Accordingly, the aims of the present study were to assess the effect of insulin on muscle microvascular vasomotion and to determine the effect of acute insulin resistance caused by the peripheral vasoconstrictor α-methylserotonin (αMT) on microvascular vasomotion and its subsidiary components in muscle.
Methods
Ethical approval
The experiments and procedures used were approved by the University of Tasmania Animal Ethics Committee, with animals cared for in accordance with the Australian Code of Practice for the Care and Use of Animals for Scientific Purposes (7th edition, 2004; Australian Government Printing Services, Canberra, Australia). Male hooded Wistar rats weighing 256 ± 2 g were reared in the University of Tasmania animal house (Hobart, Australia) and allowed free access to standard laboratory rat chow (21.4% protein, 4.6% lipid, 68% carbohydrate and 6% crude fibre with added vitamins and minerals) and water ad libitum. All animals were housed at a constant temperature of 21 ± 1°C and kept on a 12 h light–dark cycle.
Surgery
All experiments were conducted using the anesthetised rat model as described previously (Rattigan et al. 1997). Briefly, rats were anaesthetised using pentobarbitone sodium (50 mg (kg body weight)−1i.p.). A tracheostomy tube was inserted to facilitate spontaneous respiration during the experiment. The right carotid artery and both jugular veins were cannulated using polyethylene cannulae (PE-60, Intramedic®). The carotid artery cannula was attached to a pressure transducer (Transpac IV, Abbott Critical Systems, Morgan Hill, CA, USA) allowing constant mean arterial pressure measurements and was also used for arterial sampling throughout the experiment.
The surgical procedure lasted approximately 15 min, after which the animals were maintained under anaesthesia for the remaining surgery and the duration of the experiment with a constant infusion of anaesthetic (0.6 mg min−1 kg−1 pentobarbitone sodium) via the left jugular vein. A small incision was made in the skin overlaying the femoral vessel of each hindleg. The femoral artery was carefully separated from the femoral vein and saphenous nerve, the epigastric vessels were ligated and an ultrasonic flow probe (Transonic Systems, VB series 0.5 mm, Ithaca, NY, USA) was placed around the femoral artery of the right leg distal to the rectus abdominal muscle. The flow probe was interfaced through a flow meter to an IBM compatible computer where femoral blood flow (FBF), mean arterial pressure (MAP) and heart rate (HR) were continuously measured during the experiment using WINDAQ data acquisition software (DATAQ Instruments, Akron, OH, USA). A small incision in the skin and the underlying fascia over the tibialis muscle of one leg was made. A LDF probe (MP-4s, Moor Instruments, Oxford, UK) was carefully inserted into the tibialis muscle parallel to the muscle fibre direction. This was possible due to the blunt nature of the probe, allowing for the separation of muscle fibres during insertion with minimal damage. None of the rats in this study had to be discarded due to bleeding at the insertion site. Indeed, we have shown that only about 2% of experiments have to be discarded due to muscle damage using LDF probes in rat (Clark et al. 2001b). In some experiments there was an initially higher signal immediately following insertion, but this reduced to a stable level within 20 min. The probe is 80 mm long with a 0.8 mm external diameter and has a 0.25 mm fibre separation. The body temperature of the animal was maintained throughout the experiment at 37°C using a water-jacketed platform and a heating lamp positioned above the rat. Surgery was followed by a 60 min equilibration period to allow the FBF, BP and LDF signals to stabilise. At the conclusion of the experiment, rats were killed by manually pushing 75 mg of the pentobarbitone sodium (3 ml) directly into the heart via the left jugular vein.
Experimental procedure
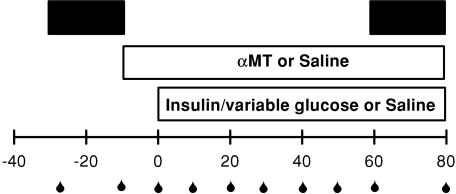
Rats were divided into four groups (n= 8 in each), saline, insulin, αMT or αMT plus insulin, and these infusions were made via the right jugular vein. The experimental protocol (Fig. 1) consisted of a euglycaemic hyperinsulinaemic clamp in which saline (control) or insulin (Humulin R, Eli Lilly, Indianapolis, IN, USA) was infused at a dose of 10 mU min−1 kg−1 for 80 min. During this time a glucose solution (30% w/v) was infused at variable rates to maintain blood glucose levels at 5–5.5 mmol l−1; the amount of glucose infused to maintain euglycaemia was plotted as glucose infusion rate (GIR) expressed in mg min−1 kg−1. αMT (20 μg min−1 kg−1) or saline was infused 10 min before the commencement of insulin (or saline) infusion (Fig. 1) and then throughout. The total volume infused in each experiment was equal and approximated the amount of blood removed over the 110 min experimental period. The total amount of blood removed over the course of each experiment was less than 0.5 ml, which constitutes about 2% of the total blood volume of a 250g rat. Thus while there will be a slight drop in haematocrit, this should have negligible effect on the LDF signal. LDF data were collected under basal conditions (–30 to –10 min) and for the last 20 min of the experiment (60 to 80 min, Fig. 1).
Figure 1. Study design for assessing changes in vasomotion following infusion of insulin (10 mU min−1 kg−1, euglycaemic clamp), α-methylserotonin (αMT, 20 μg min−1 kg−1) or both.
A LDF probe was inserted into the tibialis muscle of the rat during surgery and wavelet analysis of LDF signals were conducted to ascertain changes of the five components of vasomotion. Black bars indicate periods of LDF signal taken for wavelet analysis. Blood samples (for blood glucose determination) were taken at times indicated  .
.
Data analyses
Carotid artery samples were taken throughout for glucose analysis (Fig. 1). Arterial values at the end of the experiment together with values for femoral vein samples at this time were used to determine hindleg glucose extraction. A – V difference multiplied by the recorded FBF at 80 min was used to calculate hindleg glucose uptake, which was expressed as μmol min−1. All data are expressed as means ±s.e.m. (normality was found to be satisfied for all analyses). Mean FBF, HR and MAP were calculated using 5 s subsamples of the data, representing approximately 500 flow and pressure measurements every 15 min.
Wavelet analysis of LDF signals collected over each of the 20 min periods was conducted to ascertain relative changes of the five frequency components. The precise position of each band varied between rats, so it was necessary to select an appropriate range for each experiment based on the order of the peaks. Bands chosen were cardiac (Band I, around 6 Hz), respiratory (Band II, around 1 Hz), myogenic (Band III, around 0.1 Hz), neurogenic (Band IV, 0.05 Hz) and endothelial (Band V, around 0.01 Hz). Wavelet analysis was done using the wavelet toolbox in Matlab (7.7.0.471; The Mathworks, Inc., Natick, MA, USA) running on a Windows XP platform. The complex Morlet wavelet was used as this optimizes resolution in both time and frequency and is better able to capture oscillatory behaviour (Bracic & Stefanovska, 1998; Torrence & Compo, 1998; Addison, 2005). Scales were chosen so that the resulting frequency range was 0.009–12 Hz. The resulting 3D wavelet transform had the first and last 200 s removed (to eliminate edge effects; Bracic & Stefanovska, 1998; Torrence & Compo, 1998). In addition, the 3D transform was time-averaged to obtain the average wavelet transform. The five frequency bands were extracted from the resulting wavelet transform and the average amplitude within each band was calculated as was the relative amplitude (the average amplitude within a band divided by the average amplitude of the entire spectrum). The relative amplitude is a normalization, effectively taking into account the variation in the LDF signal strength between experiments (Bracic & Stefanovska, 1998; Stefanovska et al. 1999). For each intervention, the average and relative amplitudes are reported as a proportion of the baseline values (to limit the inter-animal variation). The frequency which corresponded to the peak of the wavelet transform in each band was also determined. Shifts in frequency peak within each band were then reported as a percent change from baseline.
Statistical analysis
To ascertain differences between treatment groups for HR, MAP and FBF, two-way repeated measure ANOVA was used. One-way ANOVA was used for determining differences between treatments for LDF signal and wavelet analysis at the 80 min time point. Once a difference was detected, the Student–Newman–Keuls post hoc test was used to determine which groups were significantly different. Significance was accepted at a level of P < 0.05. All tests were performed using SigmaStat software (Systat Software Inc., San Jose, CA, USA).
Results
Heart rate, mean arterial pressure and femoral blood flow
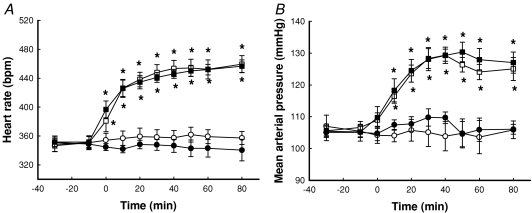
Figure 2A shows the time course for changes in heart rate. Whereas neither saline (control) nor insulin alone had any effect on heart rate, αMT increased the rate significantly by approx. 31% from 349 ± 10 to 459 ± 12 beats min−1 (P < 0.05). This increase was significant by 10 min after addition of the αMT and occurred regardless of whether insulin was present or not (Fig. 2A). MAP was similarly affected and the increase due to αMT was approx. 20 mmHg, whether or not insulin was present (Fig. 2B). The HR and MAP responses to αMT were essentially the same as reported by us previously (Rattigan et al. 1999).
Figure 2. Time course for heart rate (A) and MAP (B) as a result of insulin and/or α-methylserotonin (αMT) infusion.
Data are means ±s.e.m. (n= 8 for each intervention). *Significantly different from saline (P < 0.05). Open circles, saline; filled circles, 10 mU min−1 kg−1 insulin; open squares, αMT; filled squares, αMT + 10 mU min−1 kg−1 insulin.
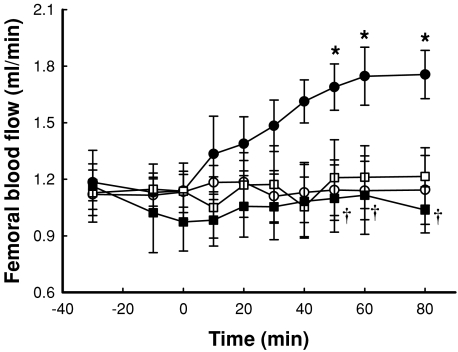
Figure 3 shows the time course for change in femoral blood flow as a result of insulin and/or αMT infusion. Insulin alone significantly increased FBF when compared to saline, but this increase was blocked by αMT, which had no effect on its own (Fig. 3).
Figure 3. Time course for change in femoral blood flow as a result of insulin and/or α-methylserotonin (αMT) infusion.
Data are means ±s.e.m. (n= 8 for each intervention). *Significantly different from saline (P < 0.05); †significantly different from insulin (P < 0.05). Open circles, saline; filled circles, 10 mU min−1 kg−1 insulin; open squares, αMT; filled squares, αMT + 10 mU min−1 kg−1 insulin.
Glucose metabolism
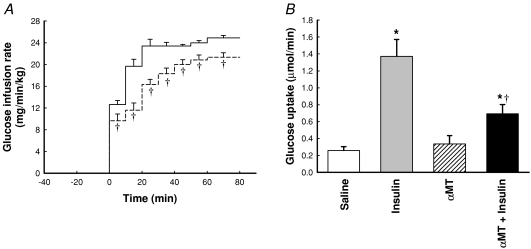
Blood glucose concentration was maintained at a constant (pre-intervention) level throughout the experiment. Thus blood glucose concentration was kept at approx. 5.2 mmol l−1 for all four experimental conditions and was maintained at this value by glucose infusion when insulin clamps were conducted. Corresponding GIRs are shown in Figure 4A for insulin alone and insulin +αMT. When 10 mU min−1 kg−1 insulin was infused GIR increased to 24.9 ± 0.5 mg min−1 kg−1 by 60 min. Infusion of αMT 10 min before and throughout insulin significantly (P < 0.05) decreased GIR to 21.3 ± 0.8 mg min−1 kg−1 by 60 min; the decrease was significant from the commencement of glucose infusion (Fig. 4A).
Figure 4. Time course for glucose infusion rate (A) and hind leg glucose uptake (B) as a result of insulin and/or α-methylserotonin (αMT) infusion.
Data are mean ±s.e.m. (n= 8 for each intervention). *Significantly different from saline (P < 0.05). †Significantly different from insulin (P < 0.05). A, continuous line, 10 mU min−1 kg−1 insulin; dashed line, αMT + 10 mU min−1 kg−1. B, open bar, saline; grey bar, 10 mU min−1 kg−1 insulin; hatched bar, αMT; black bar, αMT + 10 mU min−1 kg−1 insulin.
Figure 4B shows net glucose uptake measured across the hindlimb. Insulin (10 mU min−1 kg−1) alone increased the uptake rate approx. 5-fold, and while αMT alone had no effect, it significantly decreased the stimulation by insulin more than 50%. Taken together the effects of αMT on glucose metabolism are consistent with this agent causing an acute state of insulin resistance, similar to that reported previously (Rattigan et al. 1999).
LDF and wavelet analysis
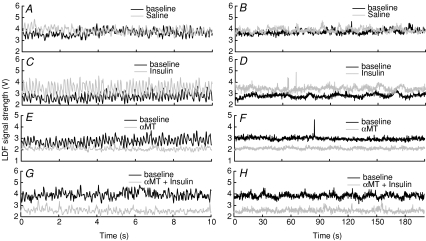
Figure 5 shows typical LDF traces over a short interval (10 s) or long interval (200 s) for the experimental interventions. It is evident that short interval traces reveal the cardiac and respiratory oscillations (Figs. 5A, C, E and G) while long intervals show the lower frequency oscillations that comprise the total compressed signal (Fig. 5B, D, F and H). Saline had little effect when compared to the baseline trace either in the extended (Fig. 5A) or compressed format (Fig. 5B). In contrast, insulin clearly increased the LDF signal and this increase was evident whether the traces were extended (Fig. 5C) or compressed (Fig. 5D). αMT had the opposite effect to insulin and decreased the LDF signal whether or not insulin was present (Figs. 5E–H).
Figure 5. Typical 10 and 200 s sections of LDF traces during baseline and during saline (A and B), 10 mU min−1 kg−1 insulin (C and D), αMT (E and F) or αMT + 10 mU min−1 kg−1 insulin (G and H).
In each panel, the baseline signal is in black, while the treatment signal is in grey.
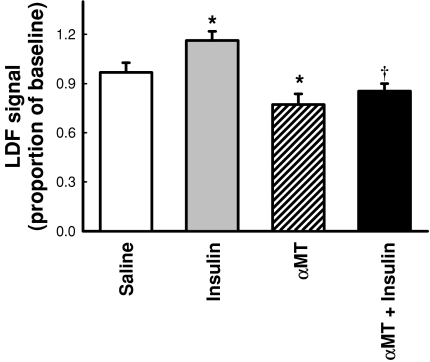
Average values for the total LDF signal (as a proportion of baseline data) are shown in Fig. 6. Insulin significantly (P < 0.05) increased the signal compared to saline by 16%. αMT significantly (P < 0.05) decreased the signal compared to saline by 23%. In the presence of insulin, αMT significantly (P < 0.05) decreased the LDF signal compared to insulin alone and to a level not significantly different to αMT alone (Fig. 6).
Figure 6. Change in LDF signal as a result of insulin and/or αMT infusion.
Values represent the average total LDF signal before subsidiary components were resolved by wavelet analysis and are expressed as a proportion of baseline. Data are means ±s.e.m. (n= 8 for each intervention). *Significantly different from saline (P < 0.05); †significantly different from insulin (P < 0.05). Open bar, saline; grey bar, 10 mU min−1 kg−1 insulin; hatched bar, αMT; black bar, αMT + 10 mU min−1 kg−1 insulin.
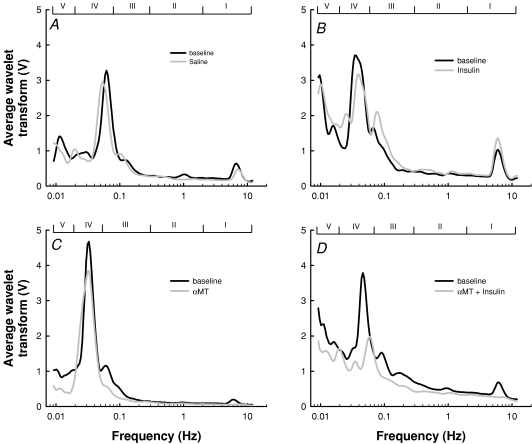
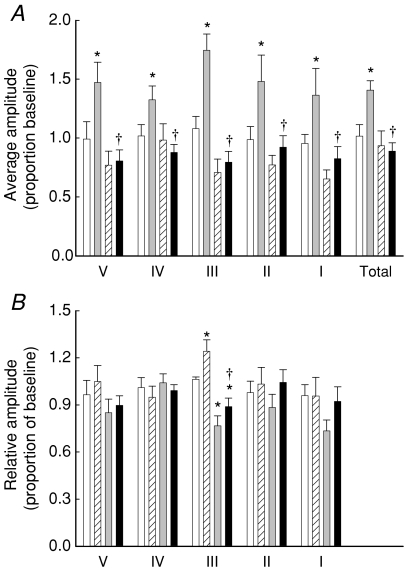
Typical wavelet transforms of the LDF signals are shown in Fig. 7. The range for each band is also shown for each experiment. In some transforms there appeared to be a shift in frequency of the peak in each band. Quantification of these shifts is shown in Table 1 and reveals no significant change overall, except in band I (cardiac). In this band, αMT, whether alone or with insulin, increased the frequency of this peak by about 30% (not significantly different from the heart rate as measured from the femoral flow probe –Fig. 2). The average amplitude and relative amplitude as a proportion of baseline values for each of the five component peaks was then determined and these are shown in Fig. 8. Insulin alone caused a significant increase in average amplitude of all five bands as well as the total average amplitude (Fig. 8A). In all cases, this was blocked by αMT. When the data were normalized to the average amplitude of the whole spectrum (Total), insulin significantly increased the myogenic component (Band III). αMT decreased band III alone and in the presence of insulin (Fig. 8B).
Figure 7. Typical wavelet transform for LDF signals from saline (A), insulin (B), αMT (C) and αMT + insulin (D).
In each panel, the baseline transform is in black, while the treatment transform is in grey. Frequency range for each band is indicated by Roman numerals I–V.
Table 1.
Effect of Insulin and/or αMT infusion on the percentage change in frequency peaks in each band
| Saline | Insulin | αMT | Insulin +αMT | |
|---|---|---|---|---|
| Band I | 3 ± 1% | −5 ± 4% | 30 ± 5%* | 33 ± 5%*† |
| Band II | −1 ± 3% | 5 ± 7% | 16 ± 5% | 6 ± 3% |
| Band III | 8 ± 4% | 4 ± 7% | 11 ± 4% | 6 ± 4% |
| Band IV | 13 ± 10% | −3 ± 4% | 13 ± 5% | 16 ± 5% |
| Band V | 3 ± 16% | 24 ± 15% | −5 ± 6% | 0 ± 17% |
Data are means ±s.e.m. (n= 8 for each intervention).
P < 0.05 vs. Saline;
P < 0.05 vs. Insulin.
Figure 8. Effect of saline, αMT, insulin or αMT + insulin on components of vasomotion.
Data are means ±s.e.m. (n= 8 for each intervention) and were obtained by quantifying average amplitude (A) and relative amplitude (B) of the wavelet transforms such as those shown in Fig. 7. Frequency regions were: entire spectrum (Total), cardiac (I), respiratory (II), myogenic (III), neurogenic (IV) and endothelial (V). *Significantly different from saline (P < 0.05); †significantly different from insulin (P < 0.05). Open bar, saline; grey bar, 10 mU min−1 kg−1 insulin; hatched bar, αMT; black bar, αMT + 10 mU min−1 kg−1 insulin.
Discussion
There are two main findings to emerge from this study. First, this is the first report of insulin acting to increase the myogenic component of vasomotion in muscle, and second, it is the first report of depressed insulin-mediated increase in vasomotion involving the myogenic component in muscle in a model of acute insulin resistance. When the wavelet transforms are analysed in terms of the average amplitude in each band, insulin significantly increased the average amplitude of all bands as well as the average amplitude of the whole spectrum (Fig. 8A) and this is most likely a result of the increase in total FBF during insulin infusion (Fig. 3). This effect was blocked by the addition of αMT (Fig. 8A). When the increase in average amplitude of the entire spectrum is taken into account (to give relative amplitude), Band III is elevated above that due to the increase in total amplitude of the signal in response to insulin. Indeed, it is this relative amplitude increase of Band III that is blocked by αMT down to the same level as αMT alone (Fig. 8B).
The present findings are consistent with results from iontophoresed insulin in human skin where there has been a consistently marked increase in amplitude of the frequency at approx. 0.1 Hz (Rossi et al. 2005b), interpreted to represent the myogenic component of vasomotion. Thus, the present data suggest that insulin acts predominantly to increase oscillations in this tissue. Accordingly, we would propose that the insulin-mediated increase in microvascular perfusion of skeletal muscle that has been detected previously (Rattigan et al. 1997; Dawson et al. 2002) is at least in part due to an increase in intensity of vasomotion of smooth muscle at terminal arterioles. This has the potential to increase delivery of both insulin and glucose to the muscle myocytes (Clark, 2008). However, an effect of insulin on the endothelium (NO dependent or not), which in turn affects adjacent vascular smooth muscle cells, cannot be ruled out. Variation in vessel diameter would be expected to be directly related to Ca2+ oscillations as indeed has been shown (Haddock & Hill, 2005), but the origin of the signals responsible for these oscillations is unknown. The vasoconstrictor αMT, which acts in pump-perfused muscle to increase non-nutritive blood flow at the expense of nutritive flow (Newman & Clark, 1998), may act similarly in vivo to reduce insulin access to vascular smooth muscle insulin receptors at the terminal arterioles, thereby blocking the insulin-mediated increase in smooth muscle vasomotion.
Since this study is particularly concerned with the role of myogenic tone on microvascular perfusion, the use of a smooth muscle agonist has the potential to confound the outcome. αMT is a peripherally acting serotonin agonist (without central effects) and vasoconstricts relatively large feed arteries (Wilmoth et al. 1984; Lamping et al. 1989). In contrast, it is the terminal arterioles that are proposed to be responsible for the myogenic component of vasomotion (Ursino et al. 1996). This would explain why there is no decrease in the total blood flow to muscle (as assessed by femoral blood flow), but the LDF signal decreases with αMT (Fig. 6). The increased blood pressure maintains the femoral blood flow during vasoconstriction. The effect of αMT to redirect the within-muscle blood flow to non-nutritive routes means that the LDF signal decreases. A decrease in LDF signal implies that the vascular volume from which the probe is sampling must be sufficiently small for at least some of the non-nutritive route to be outside the sampling region. This indeed seems to be the case since it has been shown that serotonin itself increases blood flow to septa and tendons of muscle (Newman et al. 1997). Although there is some difficulty in determining the vascular volume sampled by the probe, the penetration depth of the probe can be estimated using mathematical models. Monte Carlo simulations suggest that with a fibre separation of 0.25 mm gives an e−1 sampling depth of 0.2 mm (Larsson et al. 2002), meaning that 63% of the signal is derived from a depth less than 0.2 mm from the probe. Thus an effective tissue sampling volume would be around 0.25 mm3. This would mean that the LDF probe is sampling around 10 capillary units as well as their associated terminal arterioles (Lund et al. 1987).
A further impact on the vascular smooth muscle is the presence of the anaesthetic which has been shown to affect vasomotion (Nilsson & Aalkjaer, 2003). It is likely to affect the vasomotion seen in this study, but to what extent is difficult to determine. Vasomotion has be shown to be diminished in skin during anaesthesia (Colantuoni et al. 1984), in particularly the lower three frequency bands in LDF signals (Landsverk et al. 2007). The effect of anaesthesia may be primarily on larger vessels as the amplitude of vasomotion in small arterioles have been shown to be unaffected by anaesthesia (Hundley et al. 1988). Thus, while anaesthesia may affect the intensity of vasomotion within muscle, the current study shows vasomotion is not abolished completely. It should be pointed out that the anaesthetic has the advantage of preventing movement artefacts in the LDF signal, limiting the inter-animal variation and contributing to low standard errors as seen in this study.
In the present study αMT did not affect the glucose uptake by itself (Fig. 4). This suggests that basal glucose uptake is not limited by glucose delivery. Conversely, it is only when glucose transport in muscle is activated by insulin that glucose delivery becomes limiting in the presence of αMT. It is possible that αMT affects the interstitial concentration of glucose in a similar manner to serotonin in the perfused rat hindlimb (Newman et al. 2002), but not to a sufficient degree to affect glucose utilisation by the myocytes. αMT also showed a decrease in the absolute LDF signal strength (Fig. 6) due to its capacity to redirect blood flow to non-nutritive routes. The effect of αMT with and without insulin were not significantly different on LDF signal strength due to balance of vasoconstrictor and dilator effects. αMT is at a sufficient concentration to bring the insulin-induced LDF signal back to baseline levels but not sufficient to reduce it to the same level as αMT alone. It is however sufficient to bring the relative amplitude of band III down to the same level whether insulin is present or not. The dose of αMT is not supramaximal since a single intravenous dose of 0.5 mg kg−1 has been shown to cause hyperglycaemia and increase plasma insulin levels (Chaouloff et al. 1990). The dose used in this study was a constant infusion of 20μg/min/kg and did not induce hyperglycaemia.
Many of the issues raised here could be addressed in other models of insulin resistance. Of the various models available, one that does not involve a smooth muscle agonist is tumour necrosis factor α (TNFα)-induced insulin resistance. This model shows similar effects to αMT on insulin induced increases in glucose uptake, glucose infusion rate and femoral blood flow (Zhang et al. 2003). TNFα, however has no effect alone on heart rate, blood pressure or femoral blood flow.
In summary, insulin action in muscle in vivo is associated with an increase in vasomotion (detected as an increase in the 0.1 Hz frequency component of the LDF signal). The increase in this frequency of the LDF signal is attributed to increased amplitude of rhythmic contractions of vascular smooth muscle. This is suggestive that insulin directly interacts with insulin receptors on the vascular smooth muscle of the terminal arterioles that control capillary recruitment, although the findings do not rule out indirect effects (for example via endothelial mechanisms) to cause rhythmic contractions and relaxations of vascular smooth muscle. The vasoconstrictor αMT that induces an acute state of insulin resistance blocks these vascular actions of insulin suggesting that vascular dysfunction of insulin resistance may involve a specific loss of insulin to stimulate the vascular smooth muscle contribution to vasomotion in skeletal muscle.
Acknowledgments
The study was supported in part by grants from the NHMRC and ARC of Australia. S.R. is a Senior NHMRC Fellow.
Glossary
Abbreviations
- αMT
α-methylserotonin
- FBF
femoral blood flow
- GIR
glucose infusion rate
- HGU
hindleg glucose uptake
- HR
heart rate
- LDF
laser Doppler flowmetry
- MAP
mean arterial pressure
Author contributions
J.M.B.N. conducted experiments and analysed data with assistance by R.M.D. and P.St-P. All authors contributed to the conception, design or interpretation of data, drafting and revision of manuscript critically for important intellectual content and final approval of the version to be published.
References
- Addison PS. Wavelet transforms and the ECG: a review. Physiol Meas. 2005;26:R155–199. doi: 10.1088/0967-3334/26/5/R01. [DOI] [PubMed] [Google Scholar]
- Bracic M, Stefanovska A. Wavelet-based analysis of human blood-flow dynamics. Bull Math Biol. 1998;60:919–935. doi: 10.1006/bulm.1998.0047. [DOI] [PubMed] [Google Scholar]
- Chaouloff F, Laude D, Baudrie V. Effects of the 5-HT1C/5-HT2 receptor agonists DOI and α-methyl-5-HT on plasma glucose and insulin levels in the rat. Eur J Pharmacol. 1990;187:435–443. doi: 10.1016/0014-2999(90)90370-l. [DOI] [PubMed] [Google Scholar]
- Clark AD, Barrett EJ, Rattigan S, Wallis MG, Clark MG. Insulin stimulates laser Doppler signal by rat muscle in vivo consistent with nutritive flow recruitment. Clin Sci. 2001a;100:283–290. [PubMed] [Google Scholar]
- Clark AD, Youd JM, Rattigan S, Barrett EJ, Clark MG. Heterogeneity of laser Doppler flowmetry in perfused muscle indicative of nutritive and nonnutritive flow. Am J Physiol Heart Circ Physiol. 2001b;280:H1324–H1333. doi: 10.1152/ajpheart.2001.280.3.H1324. [DOI] [PubMed] [Google Scholar]
- Clark MG. Impaired microvascular perfusion: a consequence of vascular dysfunction and a potential cause of insulin resistance in muscle. Am J Physiol Endocrinol Metab. 2008;295:E732–750. doi: 10.1152/ajpendo.90477.2008. [DOI] [PMC free article] [PubMed] [Google Scholar]
- Clerk LH, Rattigan S, Clark MG. Lipid infusion impairs physiologic insulin-mediated capillary recruitment and muscle glucose uptake in vivo. Diabetes. 2002;51:1138–1145. doi: 10.2337/diabetes.51.4.1138. [DOI] [PubMed] [Google Scholar]
- Colantuoni A, Bertuglia S, Intaglietta M. Effects of anesthesia on the spontaneous activity of the microvasculature. Int J Microcirc Clin Exp. 1984;3:13–28. [PubMed] [Google Scholar]
- Dawson D, Vincent MA, Barrett EJ, Kaul S, Clark A, Leong-Poi H, Lindner JR. Vascular recruitment in skeletal muscle during exercise and hyperinsulinemia assessed by contrast ultrasound. Am J Physiol Endocrinol Metab. 2002;282:E714–E720. doi: 10.1152/ajpendo.00373.2001. [DOI] [PubMed] [Google Scholar]
- de Jongh RT, Clark AD, IJzerman RG, Serne EH, de Vries G, Stehouwer CD. Physiological hyperinsulinaemia increases intramuscular microvascular reactive hyperaemia and vasomotion in healthy volunteers. Diabetologia. 2004;47:978–986. doi: 10.1007/s00125-004-1412-9. [DOI] [PubMed] [Google Scholar]
- Haddock RE, Hill CE. Rhythmicity in arterial smooth muscle. J Physiol. 2005;566:645–656. doi: 10.1113/jphysiol.2005.086405. [DOI] [PMC free article] [PubMed] [Google Scholar]
- Hundley WG, Renaldo GJ, Levasseur JE, Kontos HA. Vasomotion in cerebral microcirculation of awake rabbits. Am J Physiol Heart Circ Physiol. 1988;254:H67–71. doi: 10.1152/ajpheart.1988.254.1.H67. [DOI] [PubMed] [Google Scholar]
- Jaap AJ, Shore AC, Stockman AJ, Tooke JE. Skin capillary density in subjects with impaired glucose tolerance and patients with type 2 diabetes. Diabet Med. 1996;13:160–164. doi: 10.1002/(SICI)1096-9136(199602)13:2<160::AID-DIA36>3.0.CO;2-7. [DOI] [PubMed] [Google Scholar]
- Johnson PC. The myogenic response. News Physiol Sci. 1991;6:41–42. [Google Scholar]
- Kastrup J, Bulow J, Lassen NA. Vasomotion in human skin before and after local heating recorded with laser Doppler flowmetry. A method for induction of vasomotion. Int J Microcirc Clin Exp. 1989;8:205–215. [PubMed] [Google Scholar]
- Kvernmo HD, Stefanovska A, Bracic M, Kirkeboen KA, Kvernebo K. Spectral analysis of the laser Doppler perfusion signal in human skin before and after exercise. Microvasc Res. 1998;56:173–182. doi: 10.1006/mvre.1998.2108. [DOI] [PubMed] [Google Scholar]
- Lamping KG, Kanatsuka H, Eastham CL, Chilian WM, Marcus ML. Nonuniform vasomotor responses of the coronary microcirculation of serotonin and vasopressin. Circ Res. 1989;65:343–351. doi: 10.1161/01.res.65.2.343. [DOI] [PubMed] [Google Scholar]
- Landsverk SA, Kvandal P, Bernjak A, Stefanovska A, Kirkeboen KA. The effects of general anesthesia on human skin microcirculation evaluated by wavelet transform. Anesth Analg. 2007;105:1012–1019. doi: 10.1213/01.ane.0000281932.09660.96. [DOI] [PubMed] [Google Scholar]
- Larsson M, Steenbergen W, Stromberg T. Influence of optical properties and fiber separation on laser Doppler flowmetry. J Biomed Opt. 2002;7:236–243. doi: 10.1117/1.1463049. [DOI] [PubMed] [Google Scholar]
- Lund N, Damon DH, Damon DN, Duling BR. Capillary grouping in hamster tibialis anterior muscles: flow patterns, and physiological significance. Int J Microcirc Clin Exp. 1987;5:359–372. [PubMed] [Google Scholar]
- Newman JMB, Clark MG. Stimulation and inhibition of resting muscle thermogenesis by vasoconstrictors in perfused rat hind limb. Can J Physiol Pharmacol. 1998;76:867–872. doi: 10.1139/cjpp-76-9-867. [DOI] [PubMed] [Google Scholar]
- Newman JMB, Rattigan S, Clark MG. Nutritive blood flow improves interstitial glucose and lactate exchange in perfused rat hindlimb. Am J Physiol Heart Circ Physiol. 2002;283:H186–H192. doi: 10.1152/ajpheart.01024.2001. [DOI] [PubMed] [Google Scholar]
- Newman JMB, Steen JT, Clark MG. Vessels supplying septa and tendons as functional shunts in perfused rat hindlimb. Microvasc Res. 1997;54:49–57. doi: 10.1006/mvre.1997.2021. [DOI] [PubMed] [Google Scholar]
- Nilsson H, Aalkjaer C. Vasomotion: mechanisms and physiological importance. Mol Interv. 2003;3:79–89. doi: 10.1124/mi.3.2.79. [DOI] [PubMed] [Google Scholar]
- Rattigan S, Clark MG, Barrett EJ. Hemodynamic actions of insulin in rat skeletal muscle: evidence for capillary recruitment. Diabetes. 1997;46:1381–1388. doi: 10.2337/diab.46.9.1381. [DOI] [PubMed] [Google Scholar]
- Rattigan S, Clark MG, Barrett EJ. Acute vasoconstriction-induced insulin resistance in rat muscle in vivo. Diabetes. 1999;48:564–569. doi: 10.2337/diabetes.48.3.564. [DOI] [PubMed] [Google Scholar]
- Rossi M, Bertuglia S, Varanini M, Giusti A, Santoro G, Carpi A. Generalised wavelet analysis of cutaneous flowmotion during post-occlusive reactive hyperaemia in patients with peripheral arterial obstructive disease. Biomed Pharmacother. 2005a;59:233–239. doi: 10.1016/j.biopha.2004.01.008. [DOI] [PubMed] [Google Scholar]
- Rossi M, Maurizio S, Carpi A. Skin blood flow motion response to insulin iontophoresis in normal subjects. Microvasc Res. 2005b;70:17–22. doi: 10.1016/j.mvr.2005.05.001. [DOI] [PubMed] [Google Scholar]
- Rucker M, Strobel O, Vollmar B, Roesken F, Menger MD. Vasomotion in critically perfused muscle protects adjacent tissues from capillary perfusion failure. Am J Physiol Heart Circ Physiol. 2000;279:H550–558. doi: 10.1152/ajpheart.2000.279.2.H550. [DOI] [PubMed] [Google Scholar]
- Serne EH, Ijzerman RG, Gans RO, Nijveldt R, De Vries G, Evertz R, Donker AJ, Stehouwer CD. Direct evidence for insulin-induced capillary recruitment in skin of healthy subjects during physiological hyperinsulinemia. Diabetes. 2002;51:1515–1522. doi: 10.2337/diabetes.51.5.1515. [DOI] [PubMed] [Google Scholar]
- Stefanovska A, Bracic M, Kvernmo HD. Wavelet analysis of oscillations in the peripheral blood circulation measured by laser Doppler technique. IEEE Trans Biomed Eng. 1999;46:1230–1239. doi: 10.1109/10.790500. [DOI] [PubMed] [Google Scholar]
- Torrence C, Compo GP. A practical guide to wavelet analysis. Bull Am Met Soc. 1998;79:61–78. [Google Scholar]
- Ursino M, Cavalcanti S, Bertuglia S, Colantuoni A. Theoretical analysis of complex oscillations in multibranched microvascular networks. Microvasc Res. 1996;51:229–249. doi: 10.1006/mvre.1996.0023. [DOI] [PubMed] [Google Scholar]
- Wallis MG, Smith ME, Kolka CM, Zhang L, Richards SM, Rattigan S, Clark MG. Acute glucosamine-induced insulin resistance in muscle in vivo is associated with impaired capillary recruitment. Diabetologia. 2005;48:2131–2139. doi: 10.1007/s00125-005-1887-z. [DOI] [PubMed] [Google Scholar]
- Wilmoth FR, Harris PD, Miller FN. Differential serotonin responses in the skeletal muscle microcirculation. Life Sci. 1984;34:1135–1141. doi: 10.1016/0024-3205(84)90084-5. [DOI] [PubMed] [Google Scholar]
- Youd JM, Rattigan S, Clark MG. Acute impairment of insulin-mediated capillary recruitment and glucose uptake in rat skeletal muscle in vivo by TNFα. Diabetes. 2000;49:1904–1909. doi: 10.2337/diabetes.49.11.1904. [DOI] [PubMed] [Google Scholar]
- Zhang L, Wheatley CM, Richards SM, Barrett EJ, Clark MG, Rattigan S. TNF-α acutely inhibits vascular effects of physiological but not high insulin or contraction. Am J Physiol Endocrinol Metab. 2003;285:E654–E660. doi: 10.1152/ajpendo.00119.2003. [DOI] [PubMed] [Google Scholar]


