Summary
Previous reports suggest that parathyroid hormone (PTH) is associated with insulin resistance. This research investigated the effects of PTH on insulin signaling in differentiated 3T3-L1 adipocytes. PTH (10 nM, 24 h) treatment induced a reduction in insulin-stimulated glucose uptake, AKT activity (phosphorylated AKT/total AKT protein expression) and a decrease in GLUT4 and IRS-1 protein expression compared to vehicle treated controls in differentiated adipocytes. PTH treatment also induced increased phosphorylation of IRS-1 on serine 307, which suppresses insulin signaling. In addition, treatment of cells with adenyl cyclase inhibitor SQ52236 ameliorated the effects of PTH on insulin-stimulated glucose uptake, whereas inhibition of phospholipase C α(U73122) did not significantly alter the effects of PTH. Thus, PTH treatment of differentiated 3T3-L1 adipocytes suppresses insulin-stimulated glucose uptake and insulin signaling via cAMP pathway, potentially through the phosphorylation of IRS-1 at serine 307.
Keywords: insulin receptor, insulin receptor substrate-1, glucose, parathyroid hormone
Introduction
The physiological actions of parathyroid hormone (PTH) on bone health (Reeve, 1996) and regulation of blood calcium levels (Brown, 1991) have been extensively described. In this regard PTH is secreted by the parathyroid glands as a polypeptide containing 84 amino acids (Murray et al., 2005) and acts to regulate plasma calcium homoeostasis (Brown, 1991). However, in addition to the classical actions of PTH on calcium metabolism, there is evidence showing that PTH is positively associated with the prevalence of diabetes. For example, an elevated level of PTH is associated with abnormal glucose metabolism (DeFronzo et al., 1983; Kumar et al., 1994). In an epidemiological study (n=1,071, 40–65 yrs), serum PTH was positively correlated with glucose level (Wareham et al., 1997). Further, plasma PTH level is inversely related to insulin sensitivity in 52 healthy subjects (Chiu et al., 2000). Likewise, a two- to four-fold higher prevalence of diabetes mellitus is observed in patients with high levels of PTH (Ljunghall et al., 1983). The relationship between PTH and insulin resistance is also supported by intervention studies as parathyroidectomy, as a well as a reduction in serum PTH concentration in patients with high levels of PTH, served to normalize blood glucose levels (Akmal et al., 1985; Mak, 1985; Mak, 1983). Furthermore, when exogenous PTH is administered to laboratory animals there is an increase in plasma glucose concentrations and greater area under the curve (AUC) during glucose tolerance testing (Perna et al., 1990). These results suggest that PTH may interfere with either the ability of the pancreas to release insulin, the actions of insulin on glucose metabolism, or both.
Several studies have investigated the direct effects of PTH on insulin action in cultured cells. PTH treatment of osteoblast cell type, UMR 106-01, inhibited basal and insulin-stimulated glucose transport coincident with a reduction of glucose transporter 1 (GLUT1) mRNA (Thomas et al., 1995). In rat adipocytes, short term (1 h) PTH treatment decreased insulin stimulated glucose uptake by 30% and concomitantly enhanced phosphorylation of GLUT4 to reduce insulin-stimulated translocation of the transporter to the cell surface (Reusch, 1991). However the mechanism by which PTH suppresses glucose uptake has not been fully explored in differentiated adipocytes, highly insulin responsive cell types. Work described here tests the hypothesis that PTH acts in differentiated adipocytes to suppress insulin signaling via a cAMP mediated pathway.
Materials and Methods
Reagents and Chemicals
Dulbecco’s modified Eagle’s Medium (DMEM), fetal bovine serum (FBS), TRIzol reagent, penicillin-streptomycin mixture, and 0.25% trypsin-EDTA were purchased from Gibco BRL Life Technologies (Rockville, MD). Calf serum was purchased from BioWhittaker (Walkersville, MD) and 2-deoxy- [3H]-glucose (specific activity: 9 µCi/mmol) was from Amersham (Piscataway, NJ). Human PTH-(1–84) was from Bachem (Torrance, CA). 2-deoxy-glucose, cytochalasin B, protease inhibitor cocktail, phosphatase inhibitor cocktail and RIPA buffer were from Sigma (St. Louis, MO). Insulin receptor antibody was from Santa Cruz (Santa Cruz, CA). Antibodies for IRS-1, phospho-IRS-1 (Ser 307), total AKT and phospho-AKT (Ser 473) were from Cell Signaling (Danvers, MA), GLUT1 and GLUT4 from Alpha Diagnostics (San Antonio, Texas). PCR Nucleotide Mix, RNasin Rnase Inhibitor, Oligo dT, Random Primers and MMLV reverse transcriptase were from Promega (Madison, WI). Inhibitors SQ52236 (adenyl cyclase) and U73122 (PLC) were obtained from Biomol (Plymouth Meeting, PA).
Cell Culture
Murine 3T3-L1 cells obtained from American Type Culture Collection (ATCC CL-173; Manassas, VA) were maintained in high glucose DMEM, 10% (vol/vol) calf serum with 100 U/ml penicillin, 100 µg/ml streptomycin at 37°C in 95% air and 5% CO2. Preadipocytes were induced to differentiate with 1 µg/ml human insulin, 0.5 mM 3-isobutyl-1-methylxanthine and 0.25 µM dexamethasone in DMEM containing 10% FBS. After 2 days, the medium was replaced with DMEM containing 10% FBS, antibiotics and insulin and was renewed every two days. When more than 95% of the cells contained lipid droplets, the medium was changed with DMEM containing 10% FBS.
Determination of Insulin-Stimulated Glucose Uptake
Insulin-stimulated glucose uptake experiments were completed as described previously (Sweeney et al., 1999). Briefly, cells were grown in 12-well tissue culture plates and differentiated as described above. Cells were treated with PTH at the indicated times. Differentiated adipocytes were incubated in serum-free DMEM for 3 h prior to uptake experiments. Cell monolayers were washed twice with HEPES-buffered saline (140 mM NaCl, 20 mM Na-HEPES, 2.5 mM MgSO4, 1 mM CaCl2, 5 mM KCl, pH 7.4) and pretreated with insulin (20 min, 100 nM) followed by incubation for 10 min in HEPES-buffered saline (pH 7.4) containing 100 µM unlabeled 2-deoxyglucose and 0.5 µCi/ml 2-deoxy- [3H]-glucose. The reaction was terminated by washing three times with ice-cold 0.9% NaCl (w/v). Nonspecific uptake was determined in the presence of 10 µm cytochalasin B. Cell associated radioactivity was determined by lysing the cells with 0.05 N NaOH, followed by liquid scintillation counting. Total cellular protein was determined by the bicinchoninic acid (BCA) Assay (Pierce, Rockford IL) (Smith, 1989).
mRNA Expression
Isolation of RNA was performed using TRIzol (Invitrogen. Carlsbad, CA) according to the manufacturer's instructions. Total RNA was further purified using RNeasy and RNase-free DNase kits (Qiagen, Valencia, CA). cDNA was prepared using oligoDT and random hexamer primers and the Omniscript cDNA kit from Qiagen, according to the manufacturers protocol. Primers used are shown in Table 2. RT-PCR was carried out using Brilliant SYBR Green QPCR Master Mix (Stratagene, Cedar Creek, TX) in at least triplicate using a thermocycler (Mx3000P, Stratagene) as follows: 95°C for 30 seconds, 55°C for 1 min, and 72°C for 30 to 40 seconds to achieve optimal amplification for each primer pair. Expression levels were determined by the ΔCt method using. Primer sequences for mouse insulin receptor (IR), insulin receptor substrate-1 (IRS-1), GLUT1, GLUT4, CAP and 18S are given in Table 1.
Table 1.
Primers for Real-time RT-PCR
| Gene | Primers |
|---|---|
| IR | ATC CCG AAA GCG AAG ATC CCT TGA (F) |
| GGT TCC TTT GGC TCT TGC CAC ATT (R) | |
| IRS-1 | CCC ACA GCA GAT CAT TAA CC (F) |
| AGA GAC GAA GAT GCT GGT GC (R) | |
| GLUT1 | CAC TGT GGT GCT GTT TGT TGT (F) |
| GGA AGC ACA TGC CCA CAA TGA AGT (R) | |
| GLUT4 | GGG TCC TTA CGT CTT CCT TCT (F) |
| CCT CTG GTT TCA GGC ACT TT (R) | |
| CAP | ACC ACC ATC GTC AAC CCT ACC ATT (F) |
| ACC AGT CCT TCG ATC GCT CGG TAT (R) | |
| 18S | TTA GAG TGT TCA AAG CAG GCC CGA (F) |
| TCT TGG CAA ATG CTT TCG CTC TGG (R) | |
Western Blotting
Relative protein levels were assessed for insulin receptor, phospho-IRS-1, total IRS-1, GLUT1, GLUT4, phospho-AKT and total AKT. Fully differentiated 3T3-L1 cells were treated with PTH (10 nM) at indicated time points with or without insulin stimulation (100 nM, 20 min). Subsequently, cells were washed with ice-cold PBS and lysed in RIPA buffer (50 mM Tris-HCl, 150 mM sodium chloride, 1.0% Igepal CA-630, 0.5 % sodium deoxycholate and 0.1% sodium dodecyl sulfate, pH 8.0) with 1% protease inhibitor and phosphatase inhibitor cocktails (Sigma, St. Louis, MO). Protein concentration was determined by BCA assay. Equal protein levels were loaded in each lane of 5% (insulin receptor, phospho-IRS-1 and total IRS-1) or 10% (GLUT1, GLUT4, phosph-AKT and total AKT) SDS-polyacrylamide gels. Proteins were separated by electrophoresis and transferred to nitrocellulose membrane with Transblot apparatus (Bio-Rad Laboratories Inc., Hercules, California, USA). For immunoblotting, membranes were blocked with 5% bovine serum albumin (BSA) in Tris-buffered saline (TBS; 50 mM Tris, 150 mM NaCl) containing 0.1% Tween (TBS-T) for 1 h, washed twice with TBS-T, and incubated overnight with primary antibodies at 4°C in the blocking buffer. After washing, blots were incubated with horseradish peroxidase–conjugated secondary antibody for 1 h at room temperature. Bound antibody was visualized using Enhanced Chemiluminescence method, according to the manufacturer’s instructions (ECL, Amersham). Density of immunoreactive bands was assessed by Scion Image (Frederick, Maryland); film exposure times were in the linear range of delectability. The results were expressed as fold change compared to vehicle.
To measure AKT activation, membranes were exposed to phospho-Akt (Ser473) antibody (Cell Signaling) followed by incubation with the secondary antibody. The blots were stripped with stripping solution (Chemicon) for 15 min at room temperature and reprobed with specific antibody to total AKT. To determine activation of IRS-1, blots were probed with 1:1000 dilution of phospho-IRS-1 (Ser307) specific antibody (Cell Signaling). After stripping, membranes were reprobed with total IRS-1 antibody. Data are expressed as the ratio of phospho-protein to total protein.
Statistical analysis
Data were analyzed by the ANOVA procedure using the Statistical Analysis System (SAS 9.1) software. Differences among groups were determined using Student-Newman-Keuls procedure at the p<0.05 level. All data are presented as means ± SE.
Results
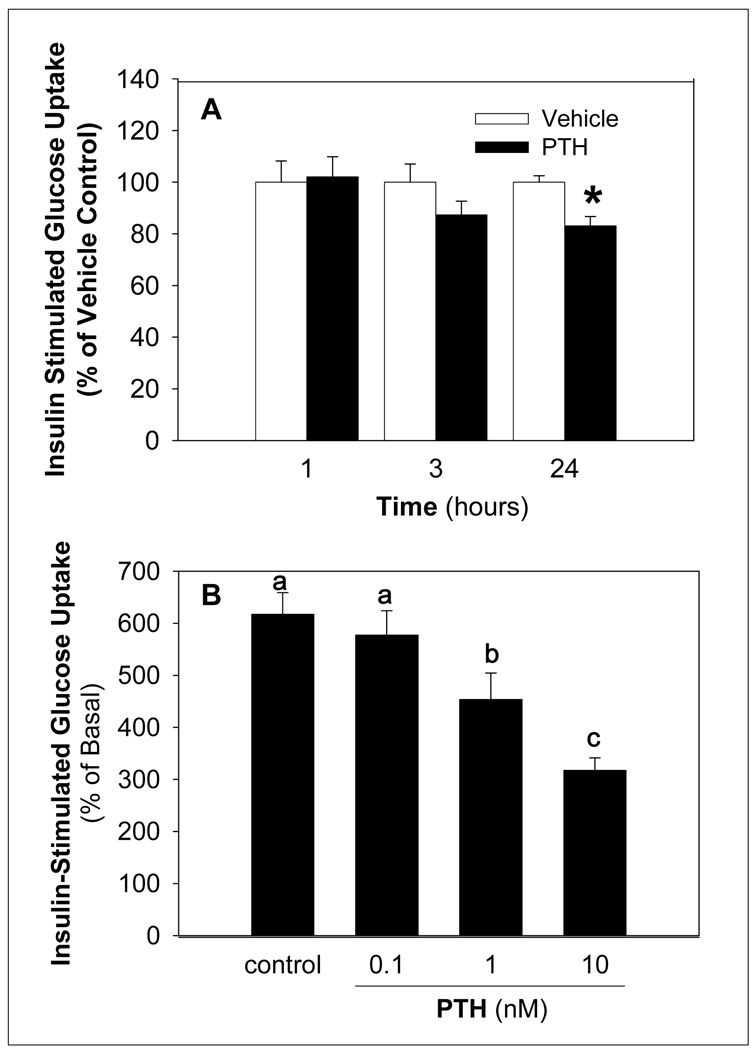
To investigate the impact of PTH on insulin sensitivity, insulin stimulated glucose uptake was determined following treatment of differentiated adipocytes with vehicle or PTH treatment. PTH decreased insulin-stimulated glucose uptake compared to controls in a time and dose-dependent manner with a significant reduction evident at 1 nM PTH (Figure 1). In contrast treatment of differentiated adipocytes with PTH alone did not alter basal glucose uptake (data not shown).
Figure 1. PTH Decreases Insulin-Stimulated Glucose Uptake in a Time and Dose Dependent Manner.
Differentiated adipocytes were treated for the indicated times with 10 nM PTH (A) and at the indicated doses of PTH for 24 h (B). Insulin-stimulated (100 nM for 20 min) uptake of 2-deoxy- [3H]-glucose (100 µM) was determined in differentiated adipocytes (10 min). Nonspecific uptake was determined in the presence of 10 µM cytochalasin B. Results for cytochalasin B samples was subtracted from each value, and results expressed (% of basal) as the percent of the mean of the same treatment (vehicle or PTH) without insulin stimulation (basal). The value of each bar represents the mean ± S.E (n = 4∼6) from at least 3 experiments. Bars with an asterisk (*) are different (p < 0.05) from vehicle control (panel A) and bars with different letters (panel B) differ among PTH treatment groups (p < 0.05).
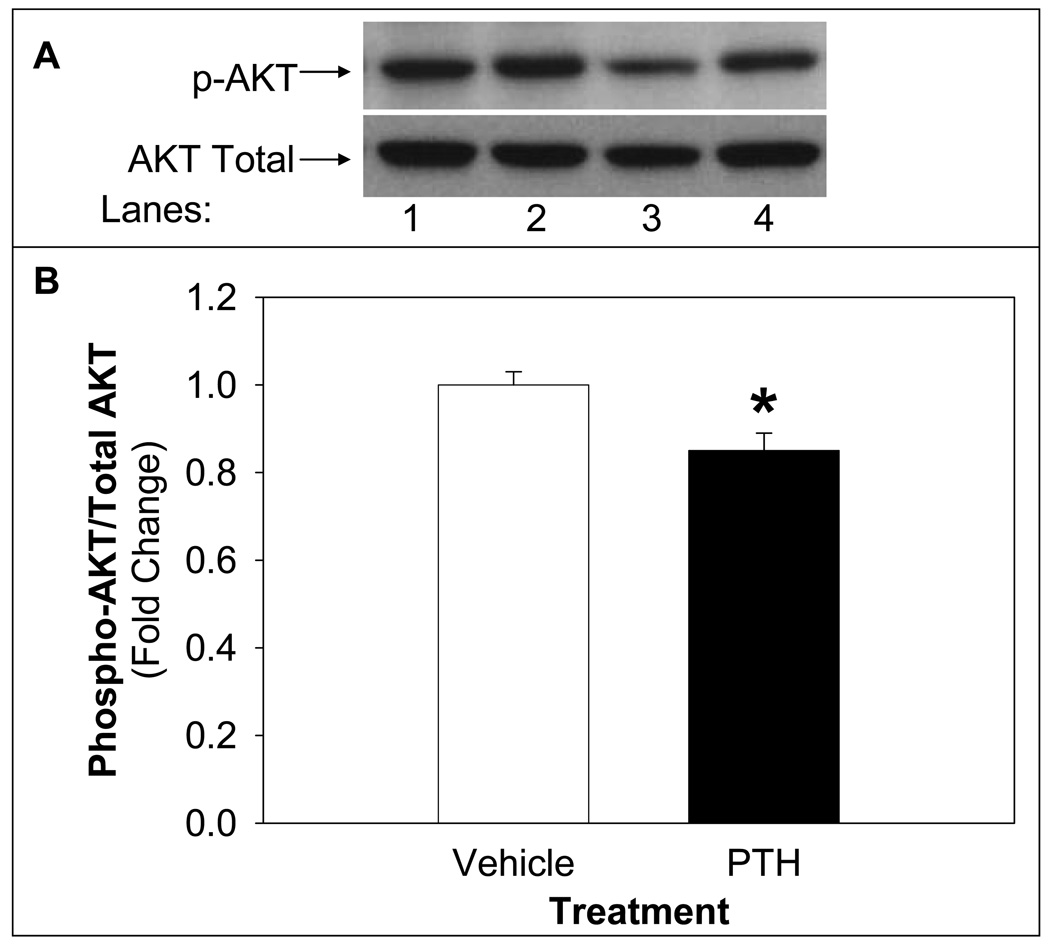
To assess the impact of PTH on insulin signaling, insulin-induced activation of AKT, a downstream target of insulin signaling, was determined. PTH treatment (10 nM) significantly reduced insulin-stimulated AKT activity (12%) in differentiated adipocytes compared to vehicle (Figure 2). The reduced activation of AKT by insulin following PTH treatment is consistent with the effects of PTH to reduce insulin-stimulated glucose uptake.
Figure 2. PTH Treatment Suppresses Insulin-Stimulated AKT Activity.
Differentiated adipocytes were treated with PTH (10 nM) for 24 h followed by insulin stimulation (100 nM) for 20 minutes. Following harvest, lysates were analyzed by Western blotting, probed for phospho-AKT, stripped and reprobed for total AKT. A representative blot of phospho-AKT and total AKT is shown in the upper panel (A) of vehicle treated (lanes 1 and 2) or PTH treated (lanes 3 and 4) of basal (lanes 1 and 3) or insulin stimulated (lanes 2 and 4). Density of signal was quantified (B) and expressed as insulin-stimulated phospho-AKT/total AKT followed by sample/vehicle (mean ± S.E). The experiments were repeated at least three times. Bars with asterisk (*) indicate differences (p<0.05) from vehicle control.
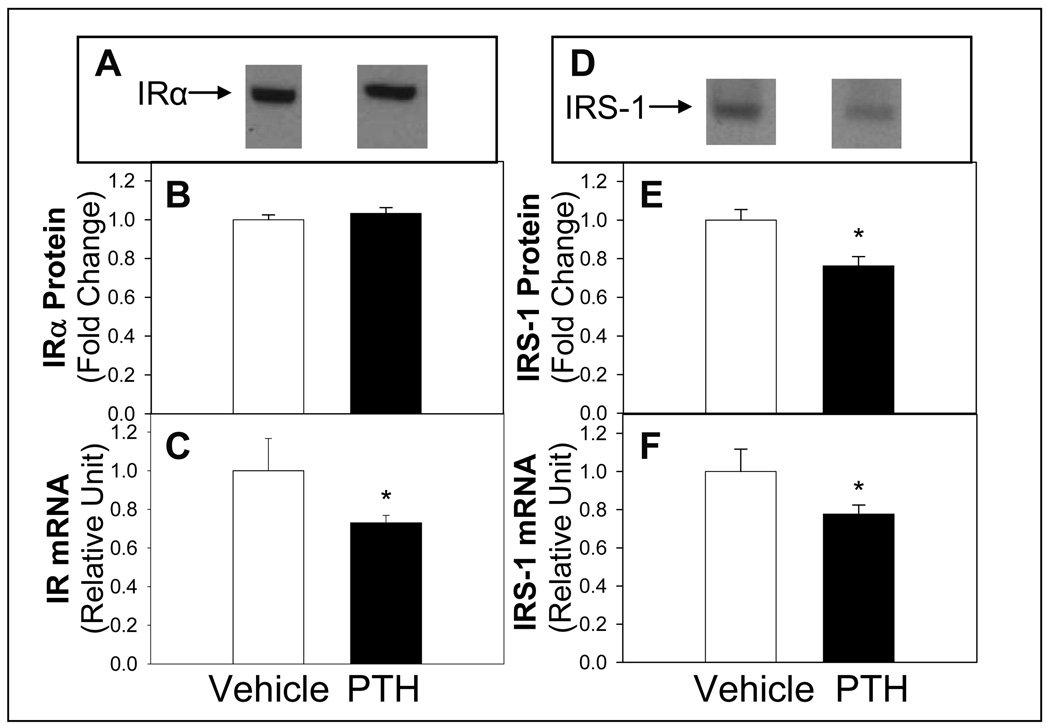
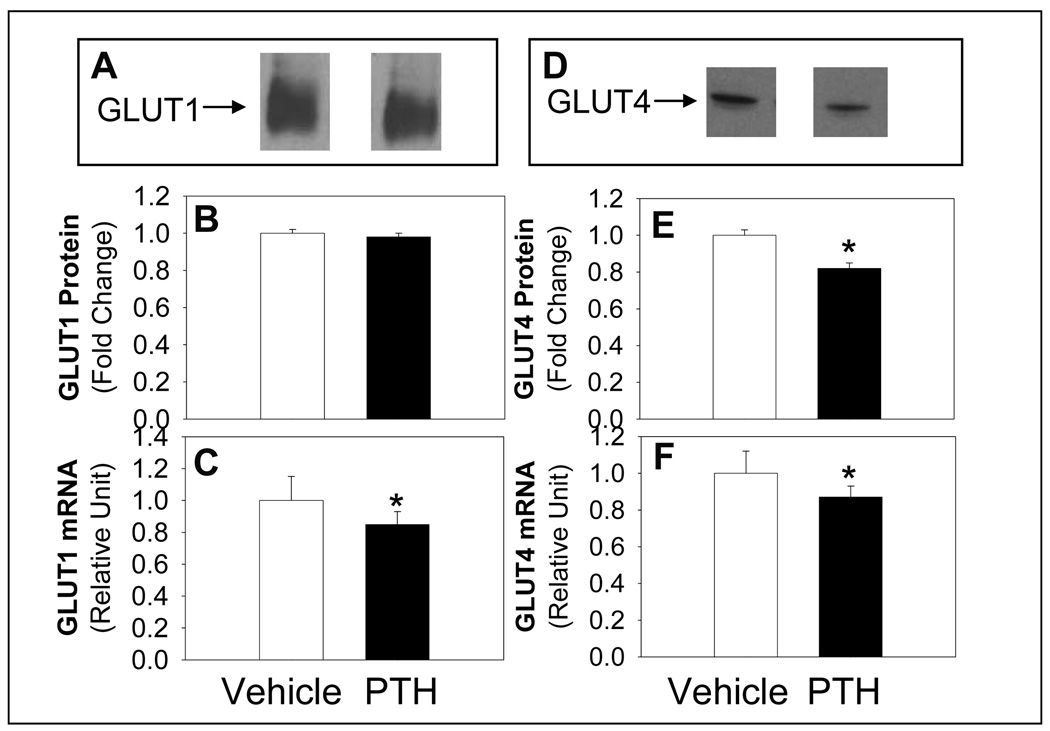
Exposure of differentiated 3T3-LI adipocytes to PTH for 24 h significantly reduced mRNA and protein expression of IRS-1 (Figure 3). Although insulin receptor mRNA abundance was reduced, the abundance of insulin receptor α protein was not altered (Figure 3). In addition, the mRNA and protein abundance of GLUT4 was reduced following PTH compared to vehicle treatment (Figure 4). However, although GLUT 1 mRNA was reduced, protein levels were not altered with PTH treatment (Figure 4). In contrast, the abundance the c-Cbl-associated protein CAP mRNA, was not different with PTH treatment (0.98+0.05) compared to control (1.00+0.07). CAP serves as an adaptor protein recruited to the insulin receptor as a component of the pathway involved in the insulin-stimulated translocation of GLUT4 to the membrane (Kimura et al., 2001). These results support that the change in mRNA expression of insulin receptor, IRS-1, GLUT1 and GLUT4 was specific and not a general cellular effect.
Figure 3. PTH Treatment Effects on Expression of IR and IRS-1.
Differentiated adipocytes were treated with PTH (10 nM) and protein expression by Western blotting for IR (A, representative blot and B, quantification) or IRS-1 (D, representative blot and E) or mRNA levels (C, IR and F, IRS-1) determined by real time RT PCR. Quantitative real-time PCR was normalized for all samples to 18S. Results are expressed as mean ± S.E (n = 8 ∼10) from at least three experiments. Bars with asterisk (*) indicates significant difference from vehicle control, p <0.05.
Figure 4. PTH Treatment Effects on Expression of GLUT1 and GLUT4.
Differentiated adipocytes were treated with PTH (10 nM) and protein expression by Western blotting for GLUT1 (A, representative blot and B, quantification) or GLUT4 (D, representative blot and E) or mRNA levels (C, GLUT1 and F, GLUT4) determined by real time RT PCR. Quantitative real-time PCR was normalized for all samples to 18S. Results are expressed as mean ± S.E (n = 8 ∼10) from at least three experiments. Bars with asterisk (*) indicates significant difference from vehicle control, p <0.05.
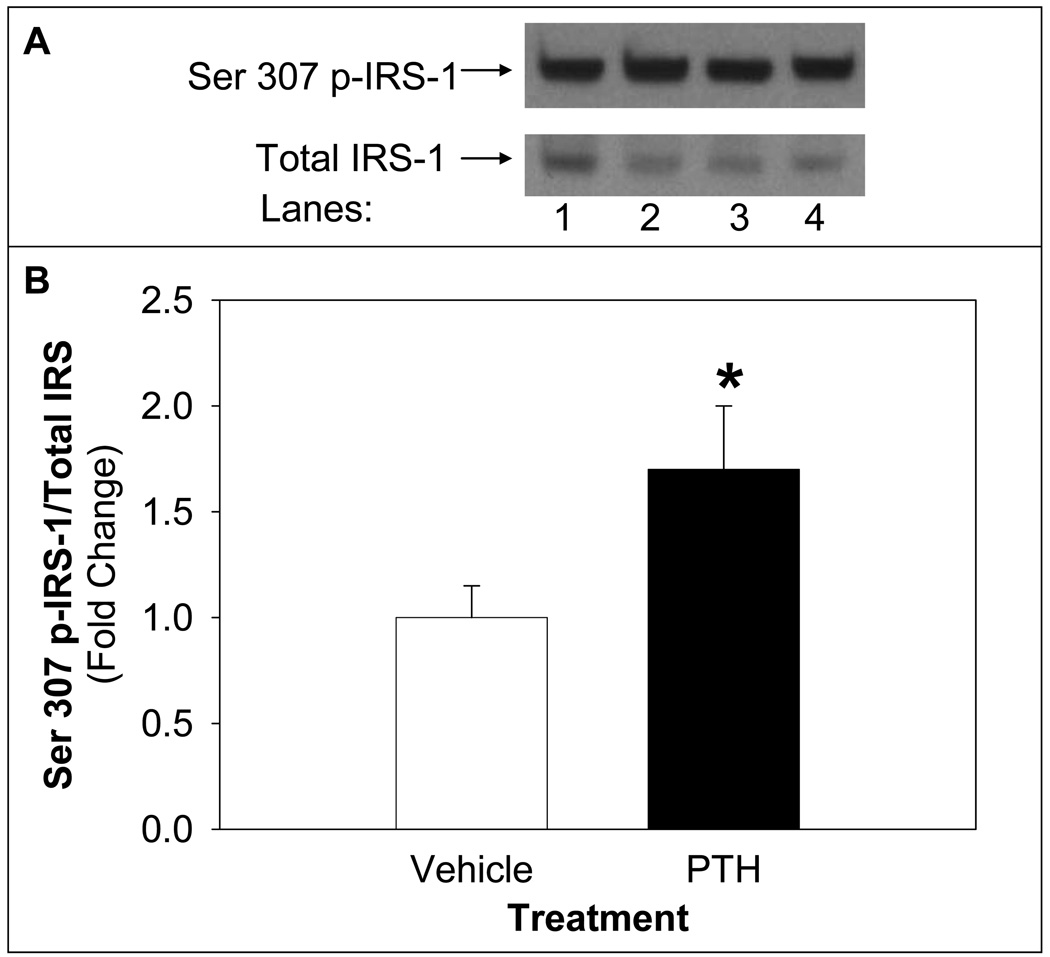
The mechanism by which PTH treatment inhibits insulin-stimulated glucose uptake was explored by assessing the level of phosphorylation of IRS-1 serine 307 site, which inhibits IRS-1 activity. PTH treatment of differentiated adipocytes increased IRS-1 serine 307 phosphorylation:total IRS-1 compared to vehicle-treated control (Figure 5).
Figure 5. PTH Treatment Decreased Phosphorylation of IRS-1 on Serine 307 Site.
Differentiated adipocytes were treated with PTH (10 nM) for 24 h followed by insulin stimulation (100 nM) for 20 minutes. Cell lysates were probed for serine 307 phospho-IRS-1 (Ser 307 p-IRS-1) and blots were stripped and reprobed for total IRS-1 using Western blotting. A representative blot of Ser 307 p-IRS-1 and total IRS-1 is shown in the upper panel (A) of vehicle treated (lanes 1 and 2) or PTH treated (lanes 3 and 4) of basal (lanes 1 and 3) or insulin stimulated (lanes 2 and 4). Density of signal was quantified (B) and expressed as insulin-stimulated Ser 307 p-IRS-1/total IRS-1 followed by sample/vehicle (mean ± S.E, n=9). Bar with asterisk (*) indicates significant difference from vehicle control, p <0.05.
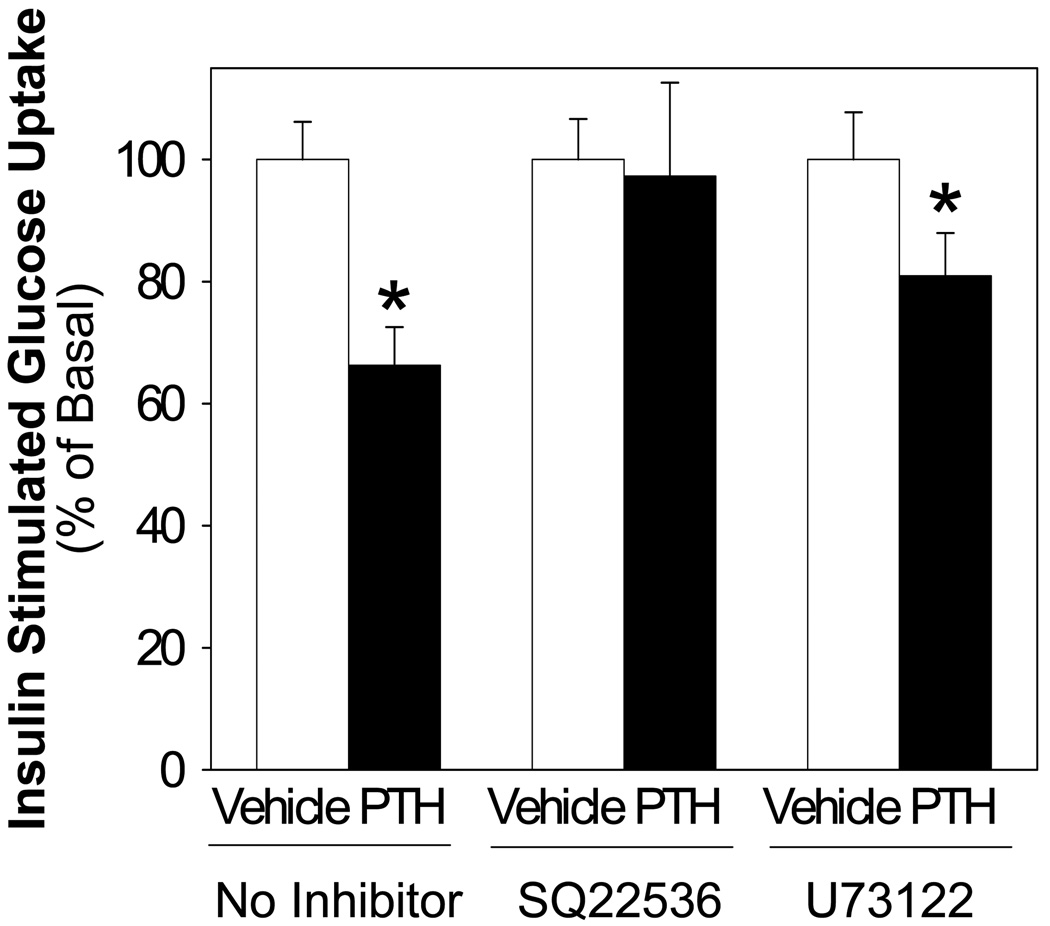
Finally, the role of PTH mediated cAMP or PLC activation on insulin stimulated glucose uptake was assessed. Cells were treated with cAMP inhibitor (SQ22536, 100 uM) or PLC inhibitor (U73122, 10 uM) in the presence and absence of PTH and insulin-stimulated glucose uptake assessed. The action of PTH to inhibit insulin stimulated glucose uptake was ablated when cells were incubated with SQ22536, whereas treatment with U73122 to inhibit of PLC was without effect (Figure 6). These results suggest that PTH mediates a reduction in insulin signaling via adenylate cyclase activity.
Figure 6. PTH Treatment Suppression of Insulin Stimulated Glucose Uptake: Effects of Adenylate Cyclase and PLC Inhibitors.
Differentiated adipocytes were treated with PTH (10 nM) for 24 h and either vehicle, SQ22536 (100 uM, adenylate cyclase inhibitor), or U73122 (10 uM, PLCα inhibitor). Insulin-stimulated (100 nM, 20 min) glucose uptake was determined in differentiated adipocytes employing 100 µM unlabeled 2-deoxyglucoseand 0.5 µCi/ml 2-deoxy- [3H]-glucose (10 min). Nonspecific uptake was determined in the presence of 10 µM cytochalasin B. The value of each bar represents the mean ± S.E (n = 4∼6) from at least two experiments. Asterisk (*) indicates significant difference from vehicle control, p <0.01.
Discussion
Abnormal glucose metabolism (DeFronzo et al., 1983; Kumar et al., 1994) and a high prevalence of diabetes (Ljunghall et al., 1983) have been reported in patients with high blood levels of PTH (Wareham et al., 1997; Chiu et al., 2000; Prager et al., 1983). In the current work, our results demonstrate that PTH inhibits insulin signaling in adipocytes via adenylate cyclase and phosphorylation of IRS-1 on serine 307. These results support the clinical and epidemiological studies demonstrating an association between serum PTH levels and abnormal glucose metabolism or diabetes.
The results of the current study are consistent with previous studies showing that PTH leads to altered glucose homeostasis. PTH treatment leads to a biphasic response in rat osteogenic sarcoma UMR 106-01 cells such that insulin stimulated glucose uptake was increased within 1 h, but was suppressed after 16 h (Thomas et al., 1995). PTH treatment decreased insulin-stimulated glucose uptake within 1 h in rat adipocytes (Reusch, 1991). Cumulatively, these results show that PTH inhibits insulin-stimulated glucose uptake similar to the results shown in the current study.
A downstream component of insulin signaling, the serine/threonine kinase AKT, plays a central role in the metabolic actions of insulin and is a marker for insulin signaling (Farese et al., 2005). For example, AKT activation is reduced in patients with type 2 diabetes (Krook et al., 1998) and overexpression of constitutively active AKT results in increased glucose uptake in 3T3-L1 adipocytes (Tanti et al., 1996). Our results demonstrate that PTH treatment of differentiated adipocytes decreased insulin-stimulated AKT activity at 24 h (Figure 3). These results are consistent with the effects of PTH on insulin-stimulated glucose uptake and support an effect of PTH to inhibit insulin signaling in adipocytes.
PTH treatment decreases mRNA levels of IR, IRS-1, GLUT1, and GLUT4. This effect was specific as the levels of CAP mRNA were not reduced. However, only the protein levels of IRS-1 and GLUT4 were reduced with PTH treatment. Therefore, it is unlikely that the decrease in GLUT1 mRNA plays a role in the decrease in insulin-stimulated glucose uptake. GLUT1 is primarily responsible for basal glucose uptake. The lack of effect of PTH treatment on basal glucose uptake is consistent with the lack of change in GLUT1 protein expression noted in our studies. It is possible that although the expression of IRα protein is not altered with PTH treatment, the expression of IRβ may be altered and therefore may contribute to the reduced insulin signaling. The reduction of IRS-1 and GLUT4 protein expression suggest that these may play a role in the decrease in insulin-stimulated glucose uptake mediated by PTH treatment in adipocytes.
Serine phosphorylation of IRS-1 at residue 307 (pSer307 IRS-1) mediates TNF-α inhibition of insulin signaling (Lorenzo et al., 2008). Phosphorylation of IRS-1 at residue 307 inhibits IR tyrosine kinase activity (Aguirre et al., 2000; Aguirre et al., 2002; Pirola et al., 2004; Sun et al., 1992), which results in insulin resistance in vivo (Ishibashi et al., 2001) and in vitro (Will et al., 2002). Evidence supports that TNF-α mediates this phosphorylation event, at least in part, via activation of inhibitor κB kinases (Lorenzo et al., 2008). Indeed, similar to PTH treatment of adipocytes in the current study, TNFα treatment decreased the concentration of IRS-1 and GLUT4 in adipocytes (Stephens et al., 1997; Wang et al., 1998) and induced serine phosphorylation of IRS-1 (Ruan et al., 2002a,b). PTH stimulated TNF-related activation-induced cytokine (TRANCE) expression in murine bone marrow cultures (Lee and Lorenzo, 1999) and caused dose and time-related increases in NFκB DNA binding in Saos-2 human osteoblastic (hOB) cells similar as the TNFα-induced NFκB activation (Ali et al., 1999). It is intriguing that both PTH and TNF are known to increase the expression of receptor activator of nuclear factor-κ B ligand (RANKL) (Dai et al., 2006), which can activate the nuclear factor κB (Wong et al., 1998). Thus, because PTH and TNFα stimulate NFκB activation, which is known to mediate the TNFα phosphorylation of serine 307 of IRS-1, they may function to induce serine phosphorylation of IRS-1 through similar molecular mechanisms. Further research is needed to delineate the molecular pathway by which PTH induces serine 307 phosphorylation of IRS-1.
Liganded PTH receptors activate G-proteins, leading to stimulation of adenylate cyclase and formation of cAMP (Tovey et al., 2006). Adenylate cyclase is the most commonly studied pathway for cellular responses to PTH, but liganded PTH receptors can also activate phospholipase C, protein kinase C, phospholipase D, and phospholipase A2 (Tovey et al., 2006). In the current study, the addition of a cAMP inhibitor (SQ22536) blunted the PTH-induced decrease in glucose uptake whereas the addition of a PLC inhibitor (U73122) was without effect. Our result implicates a cAMP pathway mediating PTH effects in differentiated adipocytes to reduce insulin-stimulated glucose uptake and inhibit insulin signaling. Further efforts to address a role of PTH-activated cAMP in insulin signaling will contribute to clarify the molecular mechanisms of PTH in insulin resistance.
Finally, the implications of a PTH mediated inhibition of insulin signaling in adipocytes on whole body insulin sensitivity have not been explored specifically. However, there is experimental evidence that links high levels of PTH with abnormal glucose metabolism (DeFronzo et al., 1983; Kumar et al., 1994) or increased risk for diabetes (Ljunghall et al., 1983). Interventions to normalize PTH in patients with elevated PTH levels also improved or normalized blood glucose levels (Akmal et al., 1985; Mak, 1985; Mak et al., 1983). Furthermore, an adipose specific reduction in GLUT4 has been shown to reduce whole body insulin sensitivity in a transgenic mouse model (Abel et al., 2000), demonstrating the impact of reduced glucose uptake in adipocytes on whole body insulin sensitivity. Our results suggest a mechanism by which PTH may impact overall body insulin resistance by reducing insulin signaling in the adipocytes. Further research is needed to determine the existence and implications of this mechanism of PTH action in vivo.
In summary, PTH decreases insulin-induced glucose transport in a dose-dependent and adenylate cyclase dependent manner, reducing protein expression of IRS-1 and GLUT4 and increasing the phosphorylation of IRS-1 on serine 307. Therefore, these cellular events in adipocytes may underlie the association of high serum levels of PTH with insulin resistance and incidence of diabetes.
Acknowledgements
This work was supported by NIH DK069965.
Footnotes
Publisher's Disclaimer: This is a PDF file of an unedited manuscript that has been accepted for publication. As a service to our customers we are providing this early version of the manuscript. The manuscript will undergo copyediting, typesetting, and review of the resulting proof before it is published in its final citable form. Please note that during the production process errors may be discovered which could affect the content, and all legal disclaimers that apply to the journal pertain.
References
- Abel ED, Peroni O, Kim JK, Kim Y-B, Boss O, Hadro E, Minnemann T, Shulman GI, Kahn B. Adipose-selective targeting of the GLUT4 gene impairs insulin action in muscle and liver. Nature. 2000;409:729–733. doi: 10.1038/35055575. [DOI] [PubMed] [Google Scholar]
- Aguirre V, Uchida T, Yenush L, Davis R, White MF. The c-Jun NH2-terminal Kinase Promotes Insulin Resistance during Association with Insulin Receptor Substrate-1 and Phosphorylation of Ser307. J. Biol. Chem. 2000;275:9047–9054. doi: 10.1074/jbc.275.12.9047. [DOI] [PubMed] [Google Scholar]
- Aguirre V, Werner ED, Giraud J, Lee YH, Shoelson SE, White MF. Phosphorylation of Ser307 in Insulin Receptor Substrate-1 Blocks Interactions with the Insulin Receptor and Inhibits Insulin Action. J. Biol. Chem. 2002;277:1531–1537. doi: 10.1074/jbc.M101521200. [DOI] [PubMed] [Google Scholar]
- Akmal M, Massry SG, Goldstein DA, Fanti P, Weisz A, DeFronzo RA. Role of parathyroid hormone in the glucose intolerance of chronic renal failure. J. Clin. Invest. 1985;75:1037–1044. doi: 10.1172/JCI111765. [DOI] [PMC free article] [PubMed] [Google Scholar]
- Ali NN, Gilston V, Winyard PG. Activation of NF-[kappa]B in human osteoblasts by stimulators of bone resorption. FEBS Letters. 1999;460:315–320. doi: 10.1016/s0014-5793(99)01370-8. [DOI] [PubMed] [Google Scholar]
- Brown EM. Extracellular Ca2+ sensing, regulation of parathyroid cell function, and role of Ca2+ and other ions as extracellular (first) messengers. Am. Physiological Soc. 1991:371–411. doi: 10.1152/physrev.1991.71.2.371. [DOI] [PubMed] [Google Scholar]
- Chiu KC, Chuang LM, Lee NP, Ryu JM, McGullam JL, Tsai GP, Saad MF. Insulin sensitivity is inversely correlated with plasma intact parathyroid hormone level. Metabolism. 2000;49:1501–1505. doi: 10.1053/meta.2000.17708. [DOI] [PubMed] [Google Scholar]
- Dai JC, He P, Chen X, Greenfield EM. TNFa and PTH utilize distinct mechanisms to induce IL-6 and RANKL expression with markedly different kinetics. Bone. 2006;38:509–520. doi: 10.1016/j.bone.2005.10.007. [DOI] [PubMed] [Google Scholar]
- DeFronzo RA, Smith D, Alvestrand A. Insulin action in uremia. Kidney Int Suppl. 1983;16:S102–S114. [PubMed] [Google Scholar]
- Farese RV, Sajan MP, Standaert ML. Insulin-Sensitive Protein Kinases (Atypical Protein Kinase C and Protein Kinase B/Akt): Actions and Defects in Obesity and Type II Diabetes. SEBM. 2005:593–605. doi: 10.1177/153537020523000901. [DOI] [PubMed] [Google Scholar]
- Ishibashi KI, Imamura T, Sharma PM, Huang J, Ugi S, Olefsky JM. Chronic endothelin-1 treatment leads to heterologous desensitization of insulin signaling in 3T3-L1 adipocytes. J. Clin. Invest. 2001;107:1193–1201. doi: 10.1172/JCI11753. [DOI] [PMC free article] [PubMed] [Google Scholar]
- Kimura A, Baumann CA, Chiang SH, Saltiel AR. The sorbin homology domain: A motif for the targeting of proteins to lipid rafts. Proceedings of the National Academy of Sciences. 2001;98:9098–9103. doi: 10.1073/pnas.151252898. [DOI] [PMC free article] [PubMed] [Google Scholar]
- Krook A, Roth RA, Jiang XJ, Zierath JR, Wallberg-Henriksson H. Insulin-stimulated Akt kinase activity is reduced in skeletal muscle from NIDDM subjects. Diabetes. 1998;47:1281–1286. doi: 10.2337/diab.47.8.1281. [DOI] [PubMed] [Google Scholar]
- Kumar S, Olukoga AO, Gordon C, Mawer EB, France M, Hosker JP, Davies M, Boulton AJ. Impaired glucose tolerance and insulin insensitivity in primary hyperparathyroidism. Clin. Endocrinol. (Oxf) 1994;40:47–53. doi: 10.1111/j.1365-2265.1994.tb02442.x. [DOI] [PubMed] [Google Scholar]
- Lee SK, Lorenzo JA. Parathyroid Hormone Stimulates TRANCE and Inhibits Osteoprotegerin Messenger Ribonucleic Acid Expression in Murine Bone Marrow Cultures: Correlation with Osteoclast-Like Cell Formation 1. Endocrinology. 1999;140:3552–3561. doi: 10.1210/endo.140.8.6887. [DOI] [PubMed] [Google Scholar]
- Ljunghall S, Palmer M, Akerstrom G, Wide L. Diabetes mellitus, glucose tolerance and insulin response to glucose in patients with primary hyperparathyroidism before and after parathyroidectomy. Eur. J. Clin. Invest. 1983;13:373–377. doi: 10.1111/j.1365-2362.1983.tb00116.x. [DOI] [PubMed] [Google Scholar]
- Lorenzo M, Fernandez-Veledo S, Vila-Bedmar R, Garcia-Guerra L, De Alvaro C, Nieto-Vazquez I. Insulin resistance induced by tumor necrosis factor-{alpha} in myocytes and brown adipocytes. J. Anim. Sci. 2008;86:E94–E104. doi: 10.2527/jas.2007-0462. [DOI] [PubMed] [Google Scholar]
- Mak RH. The influence of hyperparathyroidism on glucose metabolism in uremia. J. Clin Endocrinol. Metab. 1985;60:229–233. doi: 10.1210/jcem-60-2-229. [DOI] [PubMed] [Google Scholar]
- Mak RH, Turner C, Haycock GB, Chantler C. Secondary hyperparathyroidism and glucose intolerance in children with uremia. Kidney Int. Suppl. 1983;16:S128–S133. [PubMed] [Google Scholar]
- Murray TM, Rao LG, Divieti P, Bringhurst FR. Parathyroid Hormone Secretion and Action: Evidence for Discrete Receptors for the Carboxyl-Terminal Region and Related Biological Actions of Carboxyl-Terminal Ligands. Endocrine Reviews. 2005;26:78–113. doi: 10.1210/er.2003-0024. [DOI] [PubMed] [Google Scholar]
- Perna AF, Fadda GZ, Zhou XJ, Massry SG. Mechanisms of impaired insulin secretion after chronic excess of parathyroid hormone. American J. Physiol.-Renal Physiology. 1990;259:210–216. doi: 10.1152/ajprenal.1990.259.2.F210. [DOI] [PubMed] [Google Scholar]
- Pirola L, Johnston AM, Van Obberghen E. Modulation of insulin action. Diabetologia. 2004;47:170–184. doi: 10.1007/s00125-003-1313-3. [DOI] [PubMed] [Google Scholar]
- Prager R, Kovarik J, Schernthaner G, Woloszczuk W, Willvonseder R. Peripheral insulin resistance in primary hyperparathyroidism. Metabolism. 1983;32:800–805. doi: 10.1016/0026-0495(83)90110-5. [DOI] [PubMed] [Google Scholar]
- Reeve J. PTH: a future role in the management of osteoporosis? J. Bone Miner. Res. 1996;11:440–445. doi: 10.1002/jbmr.5650110404. [DOI] [PubMed] [Google Scholar]
- Reusch JE. Regulation of GLUT-4 phosphorylation by intracellular calcium in adipocytes. Endocrinology. 1991;129:3269–3273. doi: 10.1210/endo-129-6-3269. [DOI] [PubMed] [Google Scholar]
- Ruan H, Hacohen N, Golub TR, Van Parijs L, Lodish HF. Tumor Necrosis Factor-{alpha} Suppresses Adipocyte-Specific Genes and Activates Expression of Preadipocyte Genes in 3T3-L1 Adipocytes: Nuclear Factor-{kappa}B Activation by TNF-{alpha} Is Obligatory. Diabetes. 2002a;51:1319–1336. doi: 10.2337/diabetes.51.5.1319. [DOI] [PubMed] [Google Scholar]
- Ruan H, Miles PDG, Ladd CM, Ross K, Golub TR, Olefsky JM, Lodish HF. Profiling Gene Transcription In Vivo Reveals Adipose Tissue as an Immediate Target of Tumor Necrosis Factor-{alpha}: Implications for Insulin Resistance. Diabetes. 2002b;51:3176–3188. doi: 10.2337/diabetes.51.11.3176. [DOI] [PubMed] [Google Scholar]
- Smith PK. Measurement of protein using bicinchoninic acid. Anal. Biochem. 1989:76–85. doi: 10.1016/0003-2697(85)90442-7. [DOI] [PubMed] [Google Scholar]
- Stephens JM, Lee J, Pilch PF. Tumor Necrosis Factor-alpha-induced Insulin Resistance in 3T3-L1 Adipocytes Is Accompanied by a Loss of Insulin Receptor Substrate-1 and GLUT4 Expression without a Loss of Insulin Receptor-mediated Signal Transduction. J. Biol. Chem. 1997;272:971–976. doi: 10.1074/jbc.272.2.971. [DOI] [PubMed] [Google Scholar]
- Sun XJ, Miralpeix M, Myers MG, Glasheen EM, Backer JM, Kahn CR, White MF. Expression and function of IRS-1 in insulin signal transmission. J. Biol. Chem. 1992;267:22662–22672. [PubMed] [Google Scholar]
- Sweeney G, Somwar R, Ramlal T, Volchuk A, Ueyama A, Klip A. An Inhibitor of p38 Mitogen-activated Protein Kinase Prevents Insulin-stimulated Glucose Transport but Not Glucose Transporter Translocation in 3T3-L1 Adipocytes and L6 Myotubes. J. Biol. Chem. 1999;274:10071–10078. doi: 10.1074/jbc.274.15.10071. [DOI] [PubMed] [Google Scholar]
- Tanti JF, Gremeaux T, Grillo S, Calleja V, Klippel A, Williams LT, Van Obberghen E, Le Marchand-Brustel Y. Overexpression of a Constitutively Active Form of Phosphatidylinositol 3-Kinase Is Sufficient to Promote Glut 4Translocation in Adipocytes. J. Biol. Chem. 1996;271:25227–25232. doi: 10.1074/jbc.271.41.25227. [DOI] [PubMed] [Google Scholar]
- Thomas DM, Rogers SD, Sleeman MW, Pasquini GM, Bringhurst FR, Ng KW, Zajac JD, Best JD. Modulation of glucose transport by parathyroid hormone and insulin in UMR 106-01, a clonal rat osteogenic sarcoma cell line. J. Mol. Endocrinol. 1995;14:263. doi: 10.1677/jme.0.0140263. [DOI] [PubMed] [Google Scholar]
- Tovey SC, Dedos SG, Taylor CW. Signalling from parathyroid hormone. Biochem. Soc. Trans. 2006;34:515–517. doi: 10.1042/BST0340515. [DOI] [PubMed] [Google Scholar]
- Wang CN, O'Brien L, Brindley DN. Effects of cell-permeable ceramides and tumor necrosis factor-alpha on insulin signaling and glucose uptake in 3T3-L1 adipocytes. Diabetes. 1998;47:24–31. doi: 10.2337/diab.47.1.24. [DOI] [PubMed] [Google Scholar]
- Wareham NJ, Byrne CD, Carr C, Day NE, Boucher BJ, Hales CN. Glucose intolerance is associated with altered calcium homeostasis: a possible link between increased serum calcium concentration and cardiovascular disease mortality. Metabolism. 1997;46:1171–1177. doi: 10.1016/s0026-0495(97)90212-2. [DOI] [PubMed] [Google Scholar]
- Will JC, Williamson DF, Ford ES, Calle EE, Thun MJ. Intentional Weight Loss and 13-Year Diabetes Incidence in Overweight Adults. Am Public Health Assoc. 2002:1245–1248. doi: 10.2105/ajph.92.8.1245. [DOI] [PMC free article] [PubMed] [Google Scholar]
- Wong BR, Josien R, Lee SY, Vologodskaia M, Steinman RM, Choi Y. The TRAF Family of Signal Transducers Mediates NF-κB Activation by the TRANCE Receptor. J. Biol. Chem. 1998;273:28355–28359. doi: 10.1074/jbc.273.43.28355. [DOI] [PubMed] [Google Scholar]


