Abstract
In this paper, we demonstrate an approach by which some evoked neuronal events can be probed by functional MRI (fMRI) signal with temporal resolution at the time scale of tens of milliseconds. The approach is based on the close relationship between neuronal electrical events and fMRI signal that is experimentally demonstrated in concurrent fMRI and electroencephalographic (EEG) studies conducted in a rat model with forepaw electrical stimulation. We observed a refractory period of neuronal origin in a two-stimuli paradigm: the first stimulation pulse suppressed the evoked activity in both EEG and fMRI signal responding to the subsequent stimulus for a period of several hundred milliseconds. When there was an apparent site–site interaction detected in the evoked EEG signal induced by two stimuli that were primarily targeted to activate two different sites in the brain, fMRI also displayed signal amplitude modulation because of the interactive event. With visual stimulation using two short pulses in the human brain, a similar refractory phenomenon was observed in activated fMRI signals in the primary visual cortex. In addition, for interstimulus intervals shorter than the known latency time of the evoked potential induced by the first stimulus (≈100 ms) in the primary visual cortex of the human brain, the suppression was not present. Thus, by controlling the temporal relation of input tasks, it is possible to study temporal evolution of certain neural events at the time scale of their evoked electrical activity by noninvasive fMRI methodology.
Since the introduction of functional magnetic resonance imaging (fMRI) of the human brain in early 1990s, this noninvasive functional neuro-imaging modality has rapidly gained a prominent position in systems level neuroscience research. The most commonly used fMRI approach relies on blood oxygen level dependent (BOLD) contrast (1), which detects changes in regional deoxyhemoglobin content induced by alterations in cerebral blood flow (CBF) and/or oxygen consumption rate (CMRO2) that accompany modulations in neuronal activity. It is also possible to image regional CBF changes directly by magnetic resonance imaging with a little more elaborate data acquisition schemes and to generate functional maps based on CBF alterations alone (2).
The tight coupling between neural activation and changes in CBF and/or CMRO2 that forms the basis of fMRI has been shown to be present mostly under steady state conditions (3–6). Brinker et al. (7) have reported the presence of the tight and highly quantitative coupling between the EEG signal and BOLD signal in their rat model experiments under α-chloralose anesthesia, where the frequency of forepaw stimulation rate was varied under steady state conditions. In the cerebellum of anesthetized rats, the regional CBF increase was also shown to be proportional to the product of the frequency of stimulation and the strength of the evoked local field potential near a Purkenje cell (8). Based on such coupling, two parameters that characterize the fMRI signal, namely the amplitude of the signal intensity change and the time course of this change, have been used extensively to derive detailed spatio-temporal information about the underlying neuronal events.
The amplitude of the fMRI signal intensity change has been used by itself to obtain information beyond simple identification of spatial compartmentalization of brain function by correlating variations in this amplitude with the behavioral response (9–11) or the EEG response (12). During the performance of such tasks, however, the signal-amplitude changes in fMRI are expected to represent some sort of an average of many neuronal events at each activated site of interests. Therefore, extracting information from the modulation of signal intensity that correlates with behavior requires the deconvolution of the compounded fMRI response (13), assuming that fMRI signals are additive. This assumption, however, appears not to be generally valid (14–16).
With respect to temporal evolution of fMRI signals, it has been generally accepted that fMRI is not useful for studying temporal aspects of brain activity at the neuronal time scale of milliseconds. Both CBF and BOLD signals of fMRI are quite slow to respond to variations in neuronal activity because they evolve in seconds rather than in milliseconds (17–19). To this day, neuronal time scale has been accessible noninvasively only by electro- or magneto-encephalographic (EEG or MEG) approaches that monitor some coherent system-activity occurring at the site of activation. However, these approaches suffer from ambiguities in definition of the spatial origin of the activity. Consequently, combination of fMRI with one of these fast event-tracking modalities has been pursued as one way to define the temporal characteristics to the spatial activation sites mapped by fMRI (20).
In analyzing fMRI responses for signal amplitude change and temporal evolution, refractory phenomena stemming from neural (21) as well as vascular (22) origin and/or delayed vascular and metabolic processes (23, 24) must be taken into account. When the task period is relatively long or the task is repeated relatively rapidly, these refractory responses all lead to variations in BOLD signals. The presence of a vascular refractory process during brain activation has previously been demonstrated in optical measurements of vascular as well as electrical signals (22). With a “block” design strategy, this vascular refractory process appears within the task or stimulation period if it exceeds about 10 sec even though the system electrical activity stays constant (22). Similar fMRI responses have also been reported (23, 24). The refractory process of neural origin occurs when a stimulus reduces the systems electrical response to the subsequent stimulus at the same site (21), and this suppression can happen when the inter stimulus interval is less than a few seconds. This process could certainly influence fMRI signal response because of the coupling between the evoked electrical events and the fMRI responses. Event-related fMRI (25) can avoid these problems to a great extent by making task manipulation relatively short and simple while extending the intertask period for each trial. However, if the event period includes even a few tasks executed within a short period, there is a good possibility of involvement of neural refractory responses that result in smaller fMRI signals than expected.
In the present study, using electrical forepaw stimulation in a rat model, we have examined the relationship between BOLD and evoked EEG signals (somatosensory evoked potential, SEP), the latter of which is presumably generated by the coherent electrical activity evoked in the neural system and expected to be a good indicator of the functional activity at the site. We have detected the refractory period of neural origin and also a suppressive cross-hemisphere interaction in the rat brain both in EEG signals and in fMRI signal intensities. We have further observed that the EEG and fMRI responses were reasonably well correlated for these brief stimuli. These observations suggest that fMRI signal intensity has good sensitivity toward the modulation of functional electrical activity under certain circumstances. Based on this finding, we have developed an approach by which the temporal evolution of certain evoked neural events could be followed by fMRI signal intensity even at millisecond time scales.
Materials and Methods
In this study we used only BOLD signals to relate fMRI measurements to neural events. In a rat model, we implanted intra- and/or extra-cranial EEG electrodes to monitor the electrical activity. In human brain studies, we measured fMRI only.
Rat Model.
Female Sprague–Dawley rats (300 to 350 g) were anesthetized with 2% isoflurane in oxygen before surgery to implant electrodes and perform tracheotectomy for artificial ventilation. A recording electrode was implanted intra- or trans-cranially at ≈1–2 mm anterior from the bregma and another at the skull area above the nasal tract for a reference. Electrodes were made of polypropylene tubes stretched to a diameter slightly smaller than 1 mm and several centimeters long. These tubes were filled with conductive agar. The electrodes were fixed with dental cement, and the exposed skull was covered with additional cement. The electrodes were connected with Ag/AgCl electrodes to a differential chip amplifier placed ≈10 cm away from the center of the RF coil inside the magnet. The inputs to the differential amplifier (×1000 amplification, 400 Hz low pass filtering of the output) were set to give the value of the recording electrode potential minus reference electrode potential.
Before data collection, α-chloralose anesthesia was started, initially with an injection of 17 mg/kg in water, and 10 min later the isoflurane level was reduced from the post surgery level of 1% to 0.2%. Soon after that, i.p. infusion of α-chloralose in water was initiated at a rate of 25–30 mg/kg/h. At the same time, intramuscular infusion of pancuronium bromide at a rate of 0.6 mg/kg/h was started. The head position was kept in place by ear bars and a teeth bar. Forepaw stimulation was given by two needle-like electrodes separated by 2 mm on the palm below the middle two digits. The stimulation pulse width was 300 μsec, and the pulsed current (0.4 mA to 1 mA) was measured for each experiment. The rectal temperature was maintained at 37.5°C ± 0.3°C with temperature controlled water circulating through a jacket around the rat body. The arterial CO2 level was usually within 37 ± 2 mmHg with ventilation rate of 71 stroke/min.
fMRI of the rat brain with forepaw stimulation was performed at 7 Tesla by using a Varian (SIS300) NMR system and a 2.5-cm diameter surface coil. The T2* weighted images were acquired with 3 × 3 cm2 field of view, a 64 × 32 matrix size per shot of echo planar imaging (EPI), 1-mm thick slice, and 0.31-sec image repetition. The echo times to central k-space point were 27 msec for single shot imaging. Usually, signal averaging was made over four or five experiments of 200 images, each repeated under the same condition. This data collection took about 4 to 5 min for one condition. The stability of these images as defined by movement of the center of the mass was between ±0.02 to ±0.04 pixels.
After the α-chloralose infusion started, it took more than a few hours before the animal started to show robust BOLD and evoked potential signals. The EEG signal varied with rat preparations from a few hundred μvolts to 700 μvolts by the stimulating current of 0.4–1 mA. The maximum fMRI BOLD response was up to ≈10% signal change. The electrical stimulation was given during quiet periods between the EPI image acquisitions that generated large acoustic noise.
The present study with the rat model described above used three types
of paradigms depicted by a general diagram
below
![]() .
.
In the diagram, Sn is the nth stimulation pulse, n is the number of pulses with interstimulus interval ISI, I-Task-I is the interval between the tasks of n stimuli, N is the overall repetition of the run with two task periods. EPI data acquisition consisted of two hundred images per run at a constant repetition time of ≈310 msec.
Paradigm I: BOLD Signal Additivity Test with Transient Stimulation.
In the diagram, n = 1 to 4, typical value of ISI = 620 msec or 310 msec, I-Task-I = 30 sec, n = 4 or 8. BOLD signals with and without EEG electrodes were measured.
Paradigm II: Detection of Neural Refractory Process.
Two consecutive identical stimuli (n = 2) at one forepaw with varied ISI of 20 to 750 msec were repeated 4–8 times (i.e., n = 4 or 8).
Paradigm III: Detection of Site–Site Interaction.
Both forepaws were stimulated at different time points typically with S1 at the right forepaw and with S2 at the left forepaw. SEP due to S2 was measured at the site contralateral to the left forepaw. The value of ISI was from 0 to 100 msec, and when S1 and S2 were at the left and right paws, respectively, the ISI was assigned to be negative.
These protocols were approved by the institutional animal care and use committee of Bell Laboratories.
Human Subjects.
fMRI measurements were made on a 4T whole body MRI system (Siemens/Varian) using 64 × 64 single-shot EPI data acquisition with 20 × 20 cm2 field of view and echo time of 25 msec to central k-space point. Imaging repetition time was 250 msec for a set of two slices of 5mm thick.
Visual stimulation was provided by a checkerboard light emitting diode (LED) illumination with 10-msec pulse width. At the center of the checkerboard, a dim green LED was always on for eye fixation. After scout imaging with oscillating checkerboard stimulation to select suitable imaging slices, stimulation experiments were performed with either a single light pulse or two pulses with equal width at various ISI as Paradigm II. A set of stimuli was repeated every 30 sec (I-Task-I). Each experimental run consisted of 10 events with an identical stimulation scheme, and each run lasted 5 min. A few seconds before each set of stimulation pulses appeared, subjects were alerted to the impending stimulation by a gentle touch on a finger by a pneumatically controlled rubber bulb.
Data analysis was performed by using stimulate software package¶ after averaging 10 events in each run. The activation map of the visual area obtained by scout imaging with 8-Hz flashing stimulus [cross correlation coefficient 0.5 and P value of 2 × 10⁻⁵ with a set of 100 images (27)] was used as a template of activated sites to compare activation with the two-pulse stimulation paradigm. There was no further thresholding of the data.
All subjects gave informed consent in accordance with the internal review board of the University of Minnesota. The protocols used in this study were approved by the board.
Results
Additivity of BOLD Signal (Paradigm I) and Neural Refractory Period (Paradigm II).
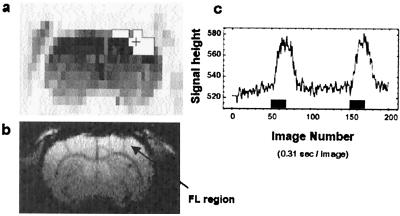
In this study, we were interested in the relationship between the fMRI signal and electrical activity of neuronal origin. Therefore, we avoided the vascular refractory process (22) by making the “activation” period (task period) relatively short and the intertask interval (I-task-I) long. As shown in Fig. 1 of a scout experiment with I-task-I of ≈30 sec and a 5.9-sec-long “activation” period that consisted of twenty equally spaced 300-μsec-wide stimuli at a forepaw of a rat, the vascular refractory effect did not appear in the shape and amplitude of the BOLD response, especially those originating from the second activation task. The I-Task-I of 30 sec with this stimulation was substantially shorter than 80 sec used by Silva et al. (28).
Figure 1.
Somatosensory activation by left forepaw stimulation. (a) An activation map (framed white areas) obtained by scout imaging with 20 stimulation pulses (1 mA current and 300 μsec width) at 310 msec interstimulus interval (t test with P = 0.99). (b) An anatomical image (256 × 64) indicating the FL (forelimb) area in the somatosensory cortex at the slice position 1 mm anterior to the bregma. (c) The time course of the T2* weighted response at one pixel (+ mark in the map shown in a, ≈3.7 mm lateral from the midline) with two events of 20 stimulation pulses 30 sec apart. The BOLD signal was an average of five runs.
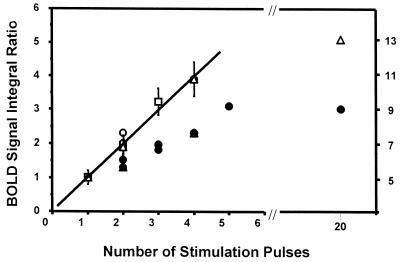
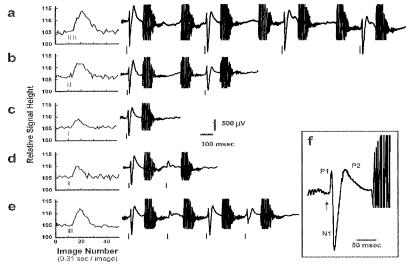
The additivity of the BOLD signal was examined in experiments where the number of the stimuli at one forepaw was increased from one to four with the interstimulus interval at 620 msec (Paradigm I). A pixel or a few adjacent pixels were chosen as the representative activation site in the activated area similar to the pixel indicated by a cross symbol in the activation map shown in Fig. 1. With this paradigm, there was a very simple proportional relation between integrated BOLD signal intensities (calculated by the amplitude times the full width at half maximum) and the number of stimuli up to four (Fig. 2, open symbols). Beyond four stimuli, the BOLD response with 20 stimuli is shown as the ratio to the single stimulus response in Fig. 2. The ratio is substantially smaller than 20. A correlation of BOLD signal to SEP is shown in Fig. 3 a–c. The SEP patterns observed with 620 msec ISI were quite similar and contained P1 (16 msec latency), N1 (25 msec latency), and P2 (Fig. 3f). There might be other SEP responses, but they seemed to lack the synchrony to the stimulation in time-locked averages even in the absence of MRI acquisition.
Figure 2.
BOLD responses to a number of stimulation pulses (Paradigm I) given to the rat forepaw. BOLD signal integrals (height times width at half height) relative to the signal by single stimulus (300-μsec-wide current pulse at 0.4 to 0.8 mA) are plotted as a function of the number of stimuli administered. The open symbols are those measured with 620 msec ISI. The error bars indicate the possible ranges of the uncertainty in estimating the normalized values of BOLD signal changes (four rats). The filled symbols are those with 310 msec ISI (two rats).
Figure 3.
Simultaneous measurements of SEP and BOLD signals evoked by small number of stimulation pulses (Paradigm I) BOLD signals are averages of four runs and also of two trials in a run, total eight trials. SEP signals are averages time locked to the first stimulus in each trial during MRI measurements. The large noises in the SEP traces are due to the switching field gradient for EPI acquisition repeated at every 310 msec. (a) Four stimuli at ISI 620 msec. (b) Two stimuli at ISI 620 msec. (c) One stimulus. (d) Two stimuli at ISI 313 msec. (e) Four stimuli at ISI 313 msec. (f) SEP pattern responding to the first stimulus. The latencies of the SEP peaks are 16 msec for P1 and 25 msec for N1. Small vertical bars in BOLD and SEP signal traces indicate the onset of stimulation pulses.
The proportionality between BOLD and four repeated stimuli did not hold when the length of ISI was shortened to 310 msec (Fig. 2, filled symbols) in the rat model used. The increase in the BOLD response with the stimulus number is less than the case with 620 msec ISI. In Fig. 3 d and e, BOLD responses to a small number of stimuli and the individual SEP to the train of stimulus pulses are shown. The SEP signals induced by the second pulse particularly were highly suppressed.
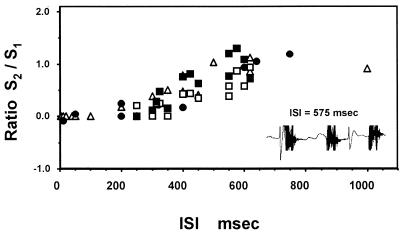
With a paradigm of two-pulse stimulation (Paradigm II) to activate the same site, the suppression of the second SEP by the preceding stimulus, as illustrated in Fig. 3e, was observed with ISI below ≈600 msec. Because the refractory response was seen in SEP, the process had to be of neural origin. The pattern of the reduced SEP did not stay the same. With the refractory suppression, the N1 peak was the first to diminish whereas the P1 peak persisted (Fig. 3d and Fig. 4 Inset). Fig. 4 shows the variation of BOLD response as well as SEP response with ISI. This figure displays BOLD and SEP responses measured either alone or together using the same paradigm. The BOLD response elicited by the second stimulus (ΔS/S)2 was estimated from the response to the two stimuli (ΔS/S)1 + 2 and the response to the single stimulus (ΔS/S)1: (ΔS/S)2 = (ΔS/S)1 + 2 − (ΔS/S)1. It is plotted as the ratio relative to (ΔS/S)1. The accuracy in the BOLD signal ratio estimate was within ±0.25. The value of SEP was taken, rather arbitrarily, as the sum of P1 and N1 peak heights, and the ratio between the second and first stimulus responses is plotted in Fig. 4. If one takes N1 only for SEP signal value, the suppression of SEP response is substantially stronger than the BOLD signal in the midrange of the refractory period. We also observed some interference of MRI acquisition noise to the evoked potential and BOLD signal. The presence of the gradient noise during the interstimulus intervals did not seem to cause appreciable interference under the condition of anesthesia used here.
Figure 4.
Neural refractory process with two stimuli at the same site of activation (Paradigm II). Plotted with ISI are the suppressed responses of BOLD signal (filled symbols) and SEP (open symbols) both to the second stimulus and normalized to the first stimulus response (for BOLD signals see text). The symbols (Δ) are for SEP without MRI; the filled circle symbols are for BOLD signal without EEG electrodes.
Response to Two-Forepaw Stimulation (Paradigm III).
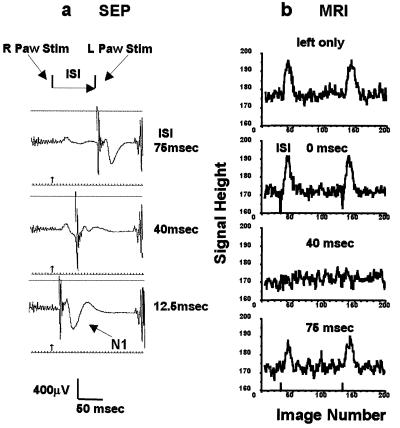
The experiments described above demonstrated the interaction between two neural events occurring at the same cortical site. The interaction between different sites was examined in the case of stimulation at the left and right forepaws of the rat model with a varying interval between the left and right stimuli (Fig. 5a). SEP was monitored only at the somatosensory cortical site contralateral to the left forepaw (Fig. 5a). The evoked potential that appeared at 25 msec after the stimulus pulse at the left forepaw was highly suppressed at the ISI value of ≈30–40 msec (Fig. 5a). This suppression was not present when the left paw stimulation preceded the right paw stimulation. The BOLD signals in the somatosensory cortical site behaved just as the evoked potential. The BOLD signal responses of a rat without EEG electrodes are shown in Fig. 5b. Analogous BOLD responses at the contralateral site to the right paw were also observed, and the suppression appeared when left paw stimulation preceded the right paw stimulation by ≈40 msec.
Figure 5.
Bilateral forepaw stimulation with time delay (Paradigm III). (a) SEP responses at the contralateral somatosensory area to the left forepaw. (Top) ISI 75 msec. (Middle) 40 msec. (Bottom) 12.5 msec. The noises at far right were EPI generated. The sharp spikes at the second stimulation were electrical artifacts. (b) The time courses of BOLD responses (without EEG electrodes) with varied ISI. The pair of stimulations was repeated four times at every 620 msec. Left paw stimulation only, from the top: ISI 0 msec, ISI 40 msec, and ISI 75 msec. The sharp spikes at the onset of stimulation with ISI = 0 msec were due to a small and transient head motion.
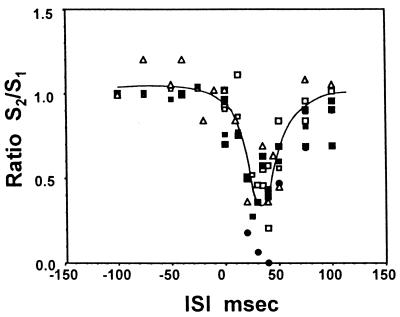
The dependence of SEP and BOLD responses on ISI is plotted in Fig. 6. When the left forepaw stimulation preceded the right, ISI values are expressed with a negative sign. The responses were normalized to the corresponding responses at −100 msec ISI or to the response to a single stimulus at the left paw only. The curve drawn in the figure is just to indicate the general trend of the temporal characteristics of the suppressive process. The degree of the suppression, the depth and width of the tuning curve, varied with different animals that could have had varied degrees of anesthesia. This inhibitive interaction varied from no suppression to complete suppression with the current strength of the preceding stimulus. Although there was a large scattering of data shown in Fig. 6, both SEP and BOLD responses showed the presence of the narrow time window of inhibition. To test a block design paradigm for studying this phenomenon of site–site interaction, a few experiments were performed with a pair of the right and the left stimulation pulses repeated four times every 620 msec (n = 2, n = 4, I-Task-I = 620 msec in the paradigm diagram, Fig. 5b) as a block of stimulation task. The results were similar to the one obtained by single-pair pulse stimulation.
Figure 6.
The time window of suppression of SEP and BOLD responses with the two-forepaw stimulation paradigm as Fig. 5 (Paradigm III). The symbols (Δ) are those of SEP measurements only, and filled circle symbols are those of MRI measurements without EEG electrodes. Open square symbols are SEP, and filled square symbols are BOLD responses in simultaneous measurements. All responses were normalized to the respective values at ISI of −100 msec (left stimulation first), or the values with left simulation only. The curve was drawn to represent the SEP responses.
Suppression of V1 Activation by Preceding Visual Stimulation in the Human Brain (Paradigm II).
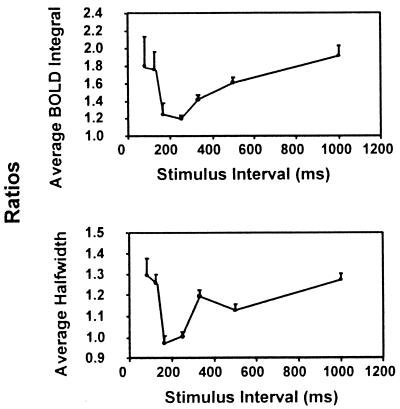
When a binocular visual stimulus of 10 msec duration was applied twice, the fMRI response showed refractory period between 200 msec to 1000 msec of ISI. The BOLD response in the primary visual area was measured by using a template of a collection of activation sites selected by the scouting paradigm of checkerboard stimulation flashing at 8 Hz (5). There was a large intersubject variation in BOLD signal response to this relatively subtle visual stimulation. Among eight subjects examined with this paradigm, the peak height (ΔS/S) with single pulse stimulation varied from 0.7% to 1.6%, the peak width at half height from 3.5 sec to 5.2 sec, and the integrated intensity (peak height times full width at half height) by a factor of 2 between the largest and smallest. However, when the BOLD response at various ISI values was normalized to the response to a single stimulus in each subject, the trend of the interval dependence was clear. There were changes in signal height as well as peak width with the ISI variation. The integrated signal intensity averaged among eight subjects is shown in Fig. 7a, and the peak width at half height is in Fig. 7b. The BOLD response at ≈200 msec ISI was essentially the same as the response to a single stimulation. This suppression of the contribution from the second stimulation slowly diminished with further increase of the interval, showing the refractory response. The response at shorter intervals was quite different from that seen in the forepaw stimulation studies in the rat model. When the interstimulus interval was similar to the latency time of the visual evoked potential [≈100 msec (29)] evoked by the first stimulation pulse, the BOLD response (peak height times full width at half height) for the two stimuli became nearly twice that of the single stimulus response. The BOLD signal response showed increases in both height and width. Behaviorally, subjects reported being able to perceive the presence of two stimuli at all these interstimulus intervals. Although we have not examined the case at much shorter ISI below 50 msec, BOLD response with a single stimulus activation but with longer duration of the light pulse (20 msec to ≈50 msec) did not differ much from the response to a single 10-msec-long stimulation pulse.
Figure 7.
Refractory and nonrefractory BOLD responses in the primary visual area of the human brain to two consecutive short stimulus pulses (10 msec wide each) (Top) The variation of the peak integral intensity (height times width) with the interstimulus interval. (Bottom) The peak width variation in the averaged BOLD signal in V1 area. These ratios (normalized to the single stimulus response) are averages among eight subjects, and error bars indicate the SD.
Discussion
Transient BOLD Signal, Its Additivity, and the Neural Refractory Period.
In this present study, we measured transient BOLD signals in response to fairly short input tasks, as described above. Mechanistically, these BOLD signals may not originate from the same CBF, CBV (cerebral blood volume), and CMRO2 contributions that give rise to the BOLD effect encountered during steady-state stimulation (Fig. 2). As demonstrated in Figs. 2 and 3, however, the transient BOLD response is additive and even proportional to the number of repeated discrete stimulations, provided that the excitatory activation paradigms do not induce neural systems suppression, potentiation, or secondary vascular responses. Under the same conditions, the SEP response, a relevant indicator of the evoked electrical activity, stayed quantitatively the same. One would expect that all functional events associated with such activation, including those not visible in SEP but relevant to BOLD response, stayed the same for the multiple applications of the repeating stimulation. Although we have not measured CBF changes with these transient stimulation paradigms, CBF is expected to be the major factor for the positive BOLD response. The additivity in BOLD response indicates that the dilation of the relevant vascular system by such transient activation is also additive.
The additivity was lost when the neural refractory process was induced by shorter ISI (Figs. 2 and 3). When such refractory suppression occurred, the pattern of SEP in addition to its signal strength was no longer constant. It is reasonable to accept that a different SEP pattern indicates that the electrical events evolved in a different way, and the fMRI response is expected to differ too. The primary SEP signal (Fig. 3f) had P1 and N1 peaks in the present rat model preparation. The major peak N1 appears to represent the system activity because it was sensitive to these inhibitory conditions (Fig. 3 d and e, Fig. 4 Inset, and Fig. 5a) more than P1. The degrees of SEP signal suppression may differ to some extent from that of BOLD. If one takes N1 as the sole SEP response, the discrepancy is quite clear in the region of ISI from 600 msec down to 300 msec. However, we do not know the contribution factors of the SEP components, such as P1 and N1 peaks to the induced CBF change. Therefore, once the pattern of SEP is no longer constant, it is hard to make a quantitative assessment of fMRI signal from SEP. Despite the uncertainty in detailed correlation between BOLD signal and SEP, both showed the suppression during the refractory period.
Suppression by a Remote Activation Site.
With the two sites activation paradigm of bilateral forepaw stimulation in the rat model (Paradigm III), the suppressive interaction at one site by the preceding stimulus at the other paw occurred at inter stimulus interval of ≈30–40 msec. In the absence of known contralateral projections of thalamocortical sites, this suppression was likely to come through the callossal (cross-hemisphere) projection with disynaptic connections (26). Here again, the evoked electrical activity of the observing site monitored by EEG behaved in a similar way to the corresponding BOLD signal at the suppressive time window (Fig. 6). This observation demonstrates that the BOLD response can monitor neural events even though the underlying neural process occurs at the much faster neural time scale.
It is interesting to note that the BOLD signal at the observing site did not show any response to the wrong paw stimulation alone (i.e., right paw stimulation and observation at the contralateral cortical site to the left paw). SEP at the observation site did not show any appreciable change in the 30- to 40-msec time window. The condition for setting up the state to suppress the neural activation by the incoming afferent signal did not change the metabolic or hemodynamic parameters appreciably at the site of inhibition in this paradigm of transient task under the anesthetic condition used here. Although the suppressive condition itself is silent in BOLD signal, its presence can be detected by the observing-stimulus response around the time window (Fig. 6).
The Presence and Absence of V1 Refractory Period in the Human Brain.
With a simple two-stimulus paradigm (Paradigm II equivalent), the activation of the primary visual area in the human brain without anesthesia also showed suppression of the second event by the first. The complete recovery of the BOLD signal from the suppression occurred at ≈1 sec of ISI, which is still shorter than the vascular response time of several seconds in the human brain. Therefore, this refractory period is also likely to be of neuronal origin. It was surprising to observe the near absence of the BOLD signal suppression with the two stimuli when interstimulus interval was reduced to or below the appearance time of the evoked potential because of the first stimulus (≈100 msec). We do not know the exact nature of the evoked potential response from two such stimuli at these ISI values. However, because the BOLD response to the two stimuli was much more than that to single stimuli, the input from the thalamus by the second stimulus was likely at V1, even with these interstimulus intervals. It appeared that the neural suppressive process induced by the first stimulus was not yet operative on the arriving input from the second stimulus. Although the BOLD response seemed to reflect the two events with the increased signal intensity, additional studies are required to understand the phenomenon, especially the details of the width increase that appeared in the time course of the BOLD response.
An Approach to Probe Fast Occurring Neural Events by fMRI.
Despite the slow response time of fMRI signals, their amplitudes can reflect the underlying neuronal processes and could reveal the interactions between different sites or within the same site in the brain. With appropriate paradigm design, it is possible to follow the temporal evolution of these interactions as shown in the simple activation paradigms used in this study. Here, we used a preparatory task and a sampling task to probe the response characteristics of somatosensory and visual systems. By varying one time parameter in the paradigm relevant to the neuronal processes, we were able to probe certain types of neural systems interaction by fMRI at the milliseconds neural time scale. This approach provides an additional temporal axis to describe the dynamic characteristics of the system at the fast time scale. Although the approach increases the fMRI measuring time to a great extent, it is within our reach. This approach is obviously not limited to fMRI but is applicable to any other measuring modalities that depend on such secondary but highly coupled responses to neural activation.
Acknowledgments
We thank Drs. D. W. Tank, and A. Gelperin, M. Fee of Bell Laboratories and Dr. G. Buzsaki of Rutgers University for their helpful discussion. The work performed at the University of Minnesota was supported in part by National Institutes of Health Grant RR08079, a grant from the National Centers for Research Resources division of the National Institutes of Health.
Abbreviations
- fMRI
functional MRI
- EEG
electroencephalograph
- BOLD
blood oxygen level dependent
- CBF
cerebral blood flow
- SEP
somatosensory evoked potential
- ISI
interstimulus interval
- I-task-I
intertask interval
- EPI
echo planar imaging
Footnotes
This paper was submitted directly (Track II) to the PNAS office.
Strupp, J. P. (1996) NeuroImage 3, S607 (abstr.).
References
- 1.Ogawa S, Lee T M, Kay A R, Tank D W. Proc Natl Acad Sci USA. 1990;87:9868–9872. doi: 10.1073/pnas.87.24.9868. [DOI] [PMC free article] [PubMed] [Google Scholar]
- 2.Kim S-G. Magn Reson Med. 1995;34:293–301. doi: 10.1002/mrm.1910340303. [DOI] [PubMed] [Google Scholar]
- 3.Raichle M E. Handbook of Physiology: The Nervous System. Bethesda: American Physiological Society; 1987. pp. 643–674. [Google Scholar]
- 4.Kwong K K, Belliveau J W, Chesler D A, Goldberg I E, Weisskoff R M, Poncelet B P, Kennedy D N, Hoppel B E, Cohen M S, Turner R. Proc Natl Acad Sci USA. 1992;89:5675–5679. doi: 10.1073/pnas.89.12.5675. [DOI] [PMC free article] [PubMed] [Google Scholar]
- 5.Zhu X-H, Kim S-G, Andersen P, Ogawa S, Ugurbil K, Chen W. Magn Reson Med. 1998;40:703–711. doi: 10.1002/mrm.1910400510. [DOI] [PubMed] [Google Scholar]
- 6.Hoge R D, Atkinson J, Gill B, Crelier G R, Marret S, Pike G B. Proc Natl Acad Sci USA. 1999;96:9403–9408. doi: 10.1073/pnas.96.16.9403. [DOI] [PMC free article] [PubMed] [Google Scholar]
- 7.Brinker G, Bock C, Busch E, Krep H, Hossmann K-A, Hoehn-Berlage M. Magn Reson Med. 1999;41:469–473. doi: 10.1002/(sici)1522-2594(199903)41:3<469::aid-mrm7>3.0.co;2-9. [DOI] [PubMed] [Google Scholar]
- 8.Mathiesen C, Caesar K, Akgoeren N, Lauritzen M. J Physiol. 1998;512:555–566. doi: 10.1111/j.1469-7793.1998.555be.x. [DOI] [PMC free article] [PubMed] [Google Scholar]
- 9.Salmelin R, Schnizler A, Parkkonen L, Biermann K, Helenius P, Kiviniemi K, Kuukka K, Schimtz F, Fruend H-J. Proc Natl Acad Sci USA. 1999;96:10460–10465. doi: 10.1073/pnas.96.18.10460. [DOI] [PMC free article] [PubMed] [Google Scholar]
- 10.Gandhi S P, Boynton G M. Proc Natl Acad Sci USA. 1999;96:3314–3319. doi: 10.1073/pnas.96.6.3314. [DOI] [PMC free article] [PubMed] [Google Scholar]
- 11.Tagaris G A, Kim S-G, Strupp J P, Anderson P, Ugurbil K, Georgopoulus A P. J Cogn Neurosci. 1997;9:419–432. doi: 10.1162/jocn.1997.9.4.419. [DOI] [PubMed] [Google Scholar]
- 12.Dehaene S, Spelke E, Penel P, Stanescu R, Tsvikin S. Science. 1999;284:970–974. doi: 10.1126/science.284.5416.970. [DOI] [PubMed] [Google Scholar]
- 13.Glover G H. NeuroImage. 1999;9:416–429. doi: 10.1006/nimg.1998.0419. [DOI] [PubMed] [Google Scholar]
- 14.Boynton G M, Engel S A, Glover G H, Heeger D J. J Neurosci. 1996;16:4207–4221. doi: 10.1523/JNEUROSCI.16-13-04207.1996. [DOI] [PMC free article] [PubMed] [Google Scholar]
- 15.Vazquez M L, Noll D, C. NeuroImage. 1998;7:108–118. doi: 10.1006/nimg.1997.0316. [DOI] [PubMed] [Google Scholar]
- 16.Sidtis J J, Strother S C, Anderson J R, Rottenberg D A. NeuroImage. 1999;9:490–496. doi: 10.1006/nimg.1999.0423. [DOI] [PubMed] [Google Scholar]
- 17.Menon R S, Ogawa S, Hu X, J P, Strupp J P, Anderson P, Ugurbil K. Magn Reson Med. 1995;33:453–459. doi: 10.1002/mrm.1910330323. [DOI] [PubMed] [Google Scholar]
- 18.Konishi S, Yoneyama R, Itagaki H, Uchida I, Nakajima K, Kato H, Okajima K, Koizumi H, Miyashita Y. Neuroreport. 1996;8:19–23. doi: 10.1097/00001756-199612200-00005. [DOI] [PubMed] [Google Scholar]
- 19.Menon R S, Kim S-G. Trends Cogn Sci. 1999;3:207–216. doi: 10.1016/s1364-6613(99)01329-7. [DOI] [PubMed] [Google Scholar]
- 20.Ahlfors S, Simpson G, Dale A, Belliveau J, Liu A, Korvenoja A, Virtanen J, Huotilainen M, Tootell R, Aronen H, Ilmoniemi R. J Neurophysiol. 1999;82:2545–2555. doi: 10.1152/jn.1999.82.5.2545. [DOI] [PubMed] [Google Scholar]
- 21.Budd T W, Barry R J, Gordon E, Rennie C, Michie P T. Int J Psychophysiol. 1998;31:51–68. doi: 10.1016/s0167-8760(98)00040-3. [DOI] [PubMed] [Google Scholar]
- 22.Cannestra A F, Pouratian N, Shomer M H, Toga A W. J Neurophysiol. 1998;80:1522–1532. doi: 10.1152/jn.1998.80.3.1522. [DOI] [PubMed] [Google Scholar]
- 23.Mandeville J B, Marota J J A, Ayata C, Zaharchuk G, Moskowitz M A, Rosen B R, Weisskoff R M. J Cereb Blood Flow Metab. 1999;19:679–689. doi: 10.1097/00004647-199906000-00012. [DOI] [PubMed] [Google Scholar]
- 24.Fransson P, Krueger G, Merbolt K D, Frahm J. Magn Reson Med. 1998;39:912–919. doi: 10.1002/mrm.1910390608. [DOI] [PubMed] [Google Scholar]
- 25.Buckner R L, Bandettini P A, O'Craven K M, Savoy R L, Petersen S E, Raichle M E, Rosen B R. Proc Natl Acad Sci USA. 1996;93:14878–14883. doi: 10.1073/pnas.93.25.14878. [DOI] [PMC free article] [PubMed] [Google Scholar]
- 26.Kandel A, Buzsaki G. J Neurosci. 1997;17:6783–6797. doi: 10.1523/JNEUROSCI.17-17-06783.1997. [DOI] [PMC free article] [PubMed] [Google Scholar]
- 27.Bandettini P A, Jesmanowicz A, Wang E C, Hyde J S. Magn Reson Med. 1993;30:161–173. doi: 10.1002/mrm.1910300204. [DOI] [PubMed] [Google Scholar]
- 28.Silva A C, Lee S-P, Yang G, Iadecola C, Kim S-G. J Cereb Blood Flow Metab. 1999;19:871–879. doi: 10.1097/00004647-199908000-00006. [DOI] [PubMed] [Google Scholar]
- 29.Regan D. Human Brain Electrophysiology. New York: Elsevier; 1989. p. 392. [Google Scholar]


