

Summary
The Bcl-2 family members Bax and Bak are essential regulators of lymphocyte apoptosis, but whether they play a role in viable T cell function remains unclear. Here we report that T cells lacking both Bax and Bak display defects in antigen-specific proliferation due to defects in Ca2+ signaling. bax-/-bax-/- T cells displayed defective TCR- and IP3-dependent Ca2+ mobilization due to altered ER Ca2+ regulation that was reversed by retroviral re-introduction of Bax. The ability of TCR-dependent Ca2+ signals to stimulate mitochondrial NADH production in excess of that utilized for ATP synthesis was dependent on Bax and Bak. Blunting of Ca2+-induced mitochondrial NADH elevation in the absence of Bax and Bak resulted in decreased T cell ROS production required for proliferation. Together the data establish that Bax and Bak, in addition to being critical regulators of apoptosis, play an essential role in the control of T cell proliferation by modulating ER Ca2+ release.
Introduction
Antigenic stimulation of T lymphocytes through the T cell receptor (TCR) initiates a coordinated program of activation, proliferation, and differentiation. This program of expansion and differentiation gives rise to a pool of activated T cells that function to control and clear foreign pathogens. Effective initiation of T lymphocyte activation is critical for proper function of the adaptive immune system (Ohashi, 2002). An equally important step in the T cell response is the elimination of excess effector T cells and the generation of a long-term memory T cell pool following pathogen clearance (Marsden and Strasser, 2003). Defects in apoptosis are the underlying cause of several lymphoproliferative syndromes in mice and humans (Bidere, 2006), suggesting that deregulated T cell survival following activation may lead to the accumulation of excess lymphocytes and the development of autoimmunity.
Members of the Bcl-2 protein family play central roles in the regulation of T cell survival and apoptosis. Bax and Bak – pro-apoptotic members of this family – are required for the induction of mitochondrial-dependent apoptotic pathways in multiple tissue and cell types (Lindsten et al., 2000). Either Bax and/or Bak is required for cytochrome c release from mitochondria in response to apoptotic stimuli (Wei et al., 2000; Cheng et al., 2001), and cells lacking both Bax and Bak are resistant to cell death induced by a variety of stimuli including DNA damage, growth factor withdrawal, and nutrient starvation (Wei et al., 2001). Anti-apoptotic members of this family including Bcl-2 and Bcl-XL antagonize the pro-death functions of Bax and Bak. Concurrent with this model, transgenic overexpression of Bcl-2 or Bcl-XL in the T cell lineage is protective (Sentman et al., 1991; Strasser et al., 1991; Chao et al., 1995), while loss of these proteins through genetic deletion decreases the viability of developing and mature lymphocytes (Veis et al., 1993; Nakayama et al., 1994; Motoyama et al., 1995). bax-/-bak-/- animals display abnormalities in thymopoiesis and peripheral T cell homeostasis marked by enhanced survival of thymocytes and the development of splenomegaly and lymphadenopathy (Lindsten et al., 2000; Rathmell et al., 2002). Together these data suggest that Bax and Bak are key regulators of T cell apoptosis and as such may modulate T cell accumulation during and after an immune response.
Ca2+ is an important second messenger involved in the control of T cell proliferation, apoptosis, differentiation, and metabolism. One of the key signaling events triggered by TCR engagement is the elevation of cytoplasmic Ca2+ concentration ([Ca2+]i). TCR-dependent intracellular Ca2+ flux occurs through two distinct steps. First, inositol 1,4,5-trisphosphate (IP3) generated following TCR ligation promotes the release of Ca2+ from endoplasmic reticulum (ER) stores. Depletion of ER Ca2+ stores promotes the influx of Ca2+ from the extracellular environment through Ca2+ release-activated Ca2+ (CRAC) channels (Venkatachalam et al., 2002). In addition to their role in mitochondrial physiology, Bcl-2 family members also function at the ER to modulate intracellular Ca2+ homeostasis. While the data remain controversial, Bcl-2 family proteins have been shown to affect Ca2+ homeostasis through control of ER Ca2+ leak at least in part by modulating IP3 receptor (IP3R) activity (Chen et al., 2004; Oakes et al., 2005; White et al., 2005). Both pro- and anti-apoptotic members of the Bcl-2 family localize to the ER, and Bcl-XL interacts directly with the IP3R to modulate its sensitivity to IP3 (Zong et al., 2003; White et al., 2005). Bcl-2 has been shown to bind to the IP3R and negatively regulate Ca2+ flux (Chen et al., 2004). Transgenic overexpression of Bcl-2 or Bcl-XL can affect Ca2+ mobilization in T cells (Linette et al., 1996; Li et al., 2002). Whether Bax and/or Bak function at physiological levels to modulate Ca2+ signaling in T cells has not been investigated.
The central role of Bax and Bak in the control of apoptosis is now well established. However, whether these molecules contribute to the normal physiology of viable peripheral T cells remains unclear. To study the function of Bax and Bak in peripheral T cells we generated chimeric mice lacking both Bax and Bak specifically in lymphocytes. Here we report that combined deficiency of Bax and Bak leads to profound defects in T cell proliferation in vitro and in vivo. T cells deficient for both Bax and Bak displayed decreased [Ca2+]i signaling in response to TCR stimulation, which could be restored through re-introduction of Bax. bax-/-bak-/- (DKO) T cells displayed [Ca2+]i oscillations of higher frequency but lower amplitude in response to TCR stimulation that resulted in an overall lower [Ca2+]i signal relative to wild-type T cells. Restoration of Ca2+ signaling through addition of ionomycin rescued this proliferative defect. Bax and Bak were required for the Ca2+-dependent production of mitochondrial NAD(P)H in response to TCR stimulation. This stimulation of mitochondrial NAD(P)H during T cell activation is in excess of the ability of the mitochondrial ATP synthase to convert the NADH into ATP and contributed to a stimulation of cellular ROS production. Ca2+-dependent ROS production was inhibited in DKO T cells. Consistent with recent reports, normal T cell proliferation was blocked when TCR-dependent ROS signals were inhibited, even in the presence of elevated [Ca2+]i. Our studies demonstrate that Bax and Bak are critical regulators of T cell proliferation through regulation of TCR-dependent Ca2+ mobilization, mitochondrial bioenergetics, and ROS production.
Results
Bax and Bak are essential for T cell proliferation and apoptosis
Mice deficient for both Bax and Bak display developmental and homeostatic irregularities in multiple tissues including the haematopoietic system (Lindsten et al., 2000). To study the specific effect of combined deficiency of Bax and Bak on peripheral T cell function we reconstituted lethally irradiated recombination-activating gene-1 (RAG-1)-deficient mice with bone marrow or fetal liver from bax-/-bak-/- (DKO) donors. As observed with bax-/-bak-/- mice, DKO chimeric mice developed homeostatic defects in the peripheral lymphoid organs (splenomegaly, lymphadenopathy) marked by an accumulation of resting T cells with a memory-like phenotype (Figure S1). The resting T cells that accumulate in DKO chimeric mice displayed no significant changes in their T cell repertoire (Figure S2). However, when T cells were isolated from the spleen and lymph nodes of DKO chimeric animals or bax+/+bak+/+ (WT) controls and stimulated with anti-CD3 antibody, the DKO T cells displayed defective proliferation relative to control T cells (Figure 1A). The decreased proliferative response of DKO cells was most evident at lower concentrations (< 5 μg/ml) of anti-CD3 antibody, suggesting that loss of Bax and Bak raises the threshold for T cell activation. The addition of anti-CD28 antibody enhanced but did not correct the proliferative response of DKO T cells (Figure 1B). TCR-dependent proliferation of T cells from animals lacking either Bax or Bak alone was similar to wild-type cells, suggesting that Bax and Bak perform redundant functions with respect to T cell proliferation (Figure S3).
Figure 1.

Bax and Bak are required for T cell activation and apoptosis. (A, B) Proliferation of peripheral T cells isolated from rag1-/- animals reconstituted with wild-type (WT, closed circles) or bax-/-bak-/- (DKO, open circles) bone marrow. T cells were stimulated with plate-bound anti-CD3 antibody alone (A) or in combination with 1 μg/ml anti-CD28 antibody (B), and proliferation was measured on day 3 post-activation. 3[H]-thymidine was added during the last 12 hours of culture. Each data point represents the mean ± s.d. for triplicate cultures, and is representative of four independent experiments. (C) CFSE profile of WT and DKO CD4+ T cells as measured by flow cytometry 3 days following activation with soluble anti-CD3 antibody (0.5 μg/ml). Data are representative of three independent experiments. (D) Surface expression of CD25 and CD69 on WT and DKO CD4+ T cells one day following activation with anti-CD3 (solid line) or anti-CD3 plus anti-CD28 antibodies (broken line) as determined by flow cytometry. CD25 and CD69 surface staining of unstimulated cells is depicted by the gray histogram. Data are representative of two independent experiments. (E) T cell viability under conditions of cytokine withdrawal. WT (filled bars) and DKO (open bars) T cells were activated with anti-CD3 and anti-CD28 antibodies for 3 days, then washed and re-plated in fresh medium with no exogenous cytokines. Cell viability was measured by exclusion of propidium iodide (PI) by flow cytometry. Data represent the mean ± s.d. for samples in triplicate from one of three independent experiments. (F) T cell viability in response to apoptotic stimuli. WT and DKO T cells were activated as in (E) and then subjected to various apoptotic stimuli: γ radiation (500 rad), doxorubicin (2 μg/ml), or H2O2 (100 μM). Untr, untreated. Percent viable cells was determined by PI exclusion and expressed as mean ±s.d. for triplicate cultures.
Analysis of T cell division by CFSE dye dilution revealed that CD4+ T cells from DKO chimeric animals displayed a profound delay in cell division in response to anti-CD3 treatment, with a majority of cells being unable to initiate cell division 3 days following activation (Figure 1C). This decrease in cell division was accompanied by a decreased ability to upregulate the T cell activation markers CD25 and CD69 in DKO T cells in response to anti-CD3 treatment, despite a slightly increased basal expression of these markers in the resting DKO T cells (Figure 1D). Normal upregulation of CD25 and CD69 could not be fully rescued by CD28 costimulation. Together these data reveal a novel requirement for Bax and Bak in the control of T cell activation and proliferation in response to antigen receptor stimulation.
To assess whether DKO T cells remain resistant to apoptosis despite eliciting a defective proliferative response, WT and DKO T cells were cultured in cytokine-free medium following activation and cell viability was measured over time. As seen in Figure 1E, WT T cells progressively lost viability in the absence of cytokine stimulation, while DKO T cells remained viable. Activated DKO T cells also maintained viability when challenged with various apoptotic stimuli including γ radiation, doxorubicin, and hydrogen peroxide (Figure 1F). Thus, deficiency of Bax and Bak confers T cell resistance to apoptosis despite a block in antigen-specific proliferation.
Bax and Bak control T cell responsiveness in vivo
To address whether deficiency of Bax and Bak affects T cell responsiveness in the context of a normal adaptive immune response, we infected WT or DKO chimeric animals with a recombinant variant of the Gram-positive bacterium L. monocytogenes expressing OVA (rLmOVA) (Foulds et al., 2002). Seven days after infection with rLmOVA, spleens from infected WT or DKO animals were analyzed for the expansion of H-2Kb-restricted OVA-specific CD8+ T cells. Expansion of OVA-specific T cells was observed in control chimeric mice but was severely impaired in DKO chimeras (Figure 2A). This impairment was not due to slower kinetics for CD8+ T cell expansion in DKO mice as DKO mice failed to generate a significant number of OVA-specific T cells over the course of rLmOVA infection (Figure 2B). Moreover, loss of Bax and Bak crippled effector cytokine production by CD8+ and CD4+ T cells in response to rLmOVA infection (Figure 2C and data not shown). Collectively, these data suggest that Bax and Bak are required for T cell proliferation and effective cytokine production by T cells against bacterial pathogens in vivo.
Figure 2.

Impaired in vivo T cell responses to L monocytogenes infection in bax -/-bak-/- chimeric mice. (A) Flow cytometry of splenocytes from WT or DKO chimeric animals 7 days following i.v. infection with recombinant L monocytogenes expressing OVA (rLmOVA, 5e4 CFU). Numbers above gate indicate the percent OVA-specific cells as determined by tetramer staining on CD8+ cells. The bar graph indicates the total number of Kb/OVA257-264-specific CD8+ cells per WT (closed bar) or DKO (open bar) spleen (n = 3 per genotype). The data represent one of three independent experiments. (B) Percentage of OVA-specific CD8+ T cells in blood of WT (closed symbols) or DKO (open symbols) animals over time following infection with rLmOVA as determined by tetramer staining and flow cytometry. Each symbol represents one mouse. (C) Cytokine production as assessed by intracellular staining (ICS) and flow cytometry. Splenocytes from day 7 infected WT or DKO animals were restimulated with OVA257–264 or LLO190–201 peptides (for CD8+ and CD4+ T cells, respectively) in the presence of GolgiStop and examined for IFNγ production by ICS and flow cytometry. Numbers above gates indicate percent IFNγ-producing cells in spleen. Bar graphs indicate the total number of IFNγ-producing CD8+ and CD4+ T cells per spleen (n = 3 per genotype). Data represent one of three independent experiments. Statistical significance was determined by paired Student's t-test (* p<0.05, **, p<0.01).
Defective TCR-dependent Ca2+ signaling in bax-/-bak-/- T cells
TCR engagement initiates an organized cascade of signaling events that promote the transition of naïve or memory T cells to activated effector T cells. To investigate possible mechanisms underlying the T cell proliferation defect observed in DKO T cells, the activation of various T cell signaling pathways in WT and DKO T cells was examined following TCR activation. TCR-induced intracellular Ca2+ mobilization was dramatically decreased following anti-CD3 crosslinking of DKO CD4+ T cells relative to wild-type controls (Figure 3A), suggesting a role for Bax and Bak in the control of TCR-regulated Ca2+ homeostasis. No marked difference in other TCR-triggered signaling events, including extracellular receptor activated kinase (ERK) phosphorylation, NF-κB activation, or tyrosine phosphorylation, were observed following stimulation with anti-CD3 antibodies (Figure 3B, and data not shown).
Figure 3.
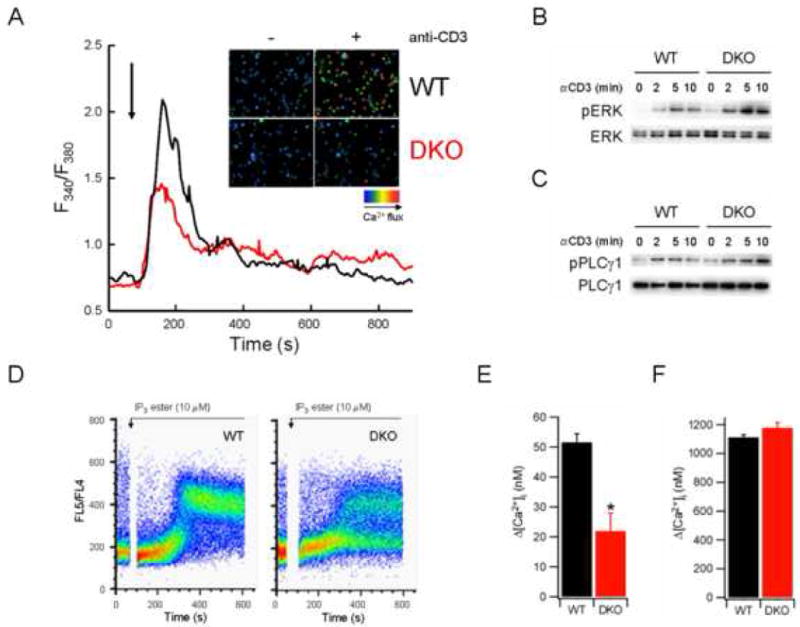
Impaired [Ca2+]i signaling in DKO T cells. (A) [Ca2+]i of WT or DKO T cells following TCR stimulation. CD4+ T cells were incubated with fluo-4 dye and anti-CD3 antibody, washed, and plated on coverslips. Changes in [Ca2+]i were measured by fluorescence microscopy following anti-CD3 crosslinking (indicated by arrow) and expressed as a function of time. Inset, representative fields depicting [Ca2+]i of WT or DKO T cells with (+) or without (-) anti-CD3 crosslinking. (B-C) Immunoblot analysis of phosphorylated Erk (B) or PLCγ1 (C) in lysates from WT or DKO T cells stimulated for the indicated times with anti-CD3 antibody (10 μg/ml). (D) [Ca2+]i of WT or DKO T cells following stimulation with 10 μM IP3 ester. T cells were loaded with indo-1 dye, and [Ca2+]i measured by flow cytometry. (E-F) [Ca2+]i of WT or DKO T cells following thapsigargin (Tg) treatment. [Ca2+]i of CD4+ T cells was measured following application of Tg in Ca2+-free buffer containing 1 mM EGTA (E), then following switching to 1.8 mM Ca2+ solution (F). The data represent mean ± SEM for at least 90 cells from multiple trials.
Increased [Ca2+]i following TCR engagement is mediated by the generation of IP3, which promotes Ca2+ release from the ER through activation of IP3R Ca2+ channels (Lewis, 2001). Depletion of ER Ca2+ stores in turn promotes extracellular Ca2+ entry through CRAC channels in the plasma membrane, leading to a sustained increase in [Ca2+]i. TCR engagement promotes IP3 generation by activating PLCγ1, an enzyme that converts membrane-associated PIP2 to diacylglycerol (DAG) and IP3. Phosphorylation of PLCγ1 was induced in DKO T cells following TCR engagement (Figure 3C), suggesting the Ca2+ signaling defect in DKO T cells occurred downstream of IP3 generation. To assess the responsiveness of WT or DKO T cells to IP3 directly, [Ca2+]i was measured following treatment with a membrane-permeable IP3 ester (Chen et al., 2004). Elevation of [Ca2+]i by the IP3 ester was significantly decreased in DKO T cells relative to controls, with fewer than 50% of DKO T cells responding following treatment (Figure 3D).
The observed decrease in TCR- and IP3-inducible Ca2+ fluxes in DKO T cells may be due to impaired Ca2+ release from ER stores. To test this possibility, WT and DKO T cells were stimulated by anti-CD3 crosslinking in the absence of extracellular Ca2+ and the increase in [Ca2+]i due to intracellular Ca2+ release was measured by flow cytometry. TCR stimulation induced an increase in [Ca2+]i in WT cells that was absent in DKO cells, suggesting a defect in TCR-induced Ca2+ release from intracellular stores (Figure S4). Upon re-addition of extracellular Ca2+, WT cells displayed increased [Ca2+]i, suggesting influx of extracellular Ca2+ through open CRAC channels. This increase in [Ca2+]i was blunted in DKO T cells, suggesting that DKO T cells exhibited incomplete activation of Ca2+ influx by TCR stimulation alone. Together, the data suggest that Bax and Bak act at the level of the ER to control release of intracellular Ca2+ stores in response to TCR-mediated IP3 signals.
To assess ER Ca2+ content, [Ca2+]i of WT and DKO T cells was measured following treatment with thapsigargin (Tg). Tg acts to deplete ER Ca2+ stores by inhibiting the sacroplasmic endoplasmic reticulum Ca2+ ATPase (SERCA) pump, which re-sequesters cytoplasmic Ca2+ to the ER in an ATP-dependent fashion (Thastrup et al., 1990). In the absence of extracellular Ca2+, the Tg-stimulated increase in [Ca2+]i was reduced in DKO T cells relative to WT controls (Figures 3E and S5), suggesting a reduced ER Ca2+ content in DKO T cells. The decreased level of [Ca2+]i observed in DKO T cells in response to Tg was not due to increased Ca2+ efflux across the plasma membrane, as Tg-dependent ER Ca2+ release was also reduced in DKO T cells treated with lanthanum chloride to inhibit plasma membrane Ca2+ pumps (Figure S5). Ca2+ influx following Tg-induced ER store depletion was similar between WT and DKO T cells (Figure 3F). Thus, Ca2+ influx in response to ER store depletion was normal in the absence of Bax and Bak. Collectively these data demonstrate that deficiency of Bax and Bak in T cells lowers ER Ca2+ content. Reduced levels of [Ca2+]ER and decreased IP3-dependent Ca2+ release from the ER result in a reduced [Ca2+]i response to TCR stimulation. Thus, the predominant defect in DKO T cells appears to be decreased IP3-dependent Ca2+ release from intracellular stores that results in insufficient store depletion to fully activate CRAC channels in response to TCR ligation.
Bax and Bak modulate TCR-dependent Ca2+ oscillations
The information conveyed by intracellular Ca2+ signals depends on the frequency and amplitude of [Ca2+]i elevations. T cell receptor stimulation induces both transient and oscillatory [Ca2+]i spikes (Donnadieu et al., 1992a; Donnadieu et al., 1992b). To assess whether combined deficiency of Bax and Bak affects [Ca2+]i signals at the single cell level, we examined changes in [Ca2+]i over time in individual T cells following TCR ligation. CD4+ cells from WT or DKO chimeric animals were loaded with fura-2 dye and activated with anti-CD3 antibody coated on coverslips. [Ca2+]i signals were monitored over 50 minutes following anti-CD3 stimulation. Figure 4A depicts representative single-cell traces of [Ca2+]i oscillations in WT and DKO T cells following TCR ligation. Anti-CD3 stimulation induced transient [Ca2+]i spikes in both WT and DKO T cells; however, DKO T cells displayed a higher frequency of [Ca2+]i spikes than WT cells. Approximately 20% of responding DKO T cells displayed 10 [Ca2+]i spikes or more, while no WT cells responded with more than 8 spikes over the same time period (Figure 4B). In contrast, the amplitudes of the [Ca2+]i spikes induced by anti-CD3 stimulation were lower in DKO T cells relative to WT controls (Figure 4C). Consequently, the integrated [Ca2+]i signal in response to TCR stimulation for the population of cells analyzed was diminished in DKO T cells compared with WT cells, with the maximal integrated [Ca2+]i response of DKO T cells only 30-35% of WT levels (Figure 4D). Together these data suggest that loss of Bax and Bak modifies the nature of TCR-stimulated [Ca2+]i signals: TCR stimulation triggers higher-frequency but lower-amplitude [Ca2+]i oscillations in bax-/-bak-/- T cells, leading to an overall reduction in the integrated antigen-stimulated [Ca2+]i signal.
Figure 4.

DKO T cells display changes in TCR-induced [Ca2+]i oscillations. (A) Representative traces of WT (black) and DKO (red) T cells displaying [Ca2+]i oscillations following stimulation with anti-CD3 antibody. CD4+ T cells were loaded with fura-2 dye, plated onto anti-CD3 coated coverslips, and [Ca2+]I measured by epifluorescence microscopy. Time t=0 represents the point of contact between T cell and coverslip. (B) Scatter plot showing the relationship between mean [Ca2+]i for the spikes observed during a 50 minute observation period and spike frequency for WT (black) or DKO (red) T cells following activation with anti-CD3 antibody. Each data point represents the response of one cell. (C) [Ca2+]i spike amplitude histograms for WT and DKO T cells following anti-CD3 stimulation. (D) Average integrated [Ca2+]i responses for WT or DKO T cells following anti-CD3 stimulation. Data were calculated from traces of 96 WT and 87 DKO T cells that responded to anti-CD3 stimulation with one or more [Ca2+]i spikes over 50 minutes. The data are representative of four independent experiments.
Re-expression of Bax restores Ca2+ signaling in DKO T cells
One possible explanation for the unresponsiveness of bax-/-bak-/- T cells is that lymphocyte development has been altered as a result of the combined deficiency of Bax and Bak, leading to the selection of mature T cells with an altered threshold for Ca2+ signaling. Although resistance to apoptosis in bax-/-bak-/- thymocytes leads to alterations in thymic cellularity in vivo (Rathmell et al., 2002), no significant difference in the Vβ repertoire of peripheral T cells from WT or DKO chimeric animals was observed (Figure S2). To address whether the defect in [Ca2+]i signaling was due to a cell-intrinsic requirement for Bax or Bak, we assessed TCR-induced [Ca2+]i signaling in DKO T cells following re-introduction of Bax. DKO T cells were transduced with control retrovirus (hCD8-Mig) or retrovirus encoding cDNA for mouse Bax. The hCD8-Mig retrovirus drives the co-expression of a cDNA of interest and a functionally inert human CD8 biomarker, which permitted the identification of transduced T cells within the population (Figure 5A). DKO T cells transduced with Bax retrovirus expressed Bax protein to a similar level as that observed in WT T cells (Figure 5B). The effect of Bax re-expression on [Ca2+]i signaling in DKO T cells was measured following TCR stimulation using confocal microscopy. TCR-induced [Ca2+]i mobilization was restored in DKO T cells re-expressing Bax, while DKO T cells transduced with the control vector remained unresponsive (Figure 5C and 5D). Importantly, hCD8-negative cells from Bax-transduced cultures continued to display defective [Ca2+]i mobilization, indicating that the defect in TCR-dependent [Ca2+]i signaling in DKO T cells is due to the cell-intrinsic absence of Bax.
Figure 5.

Re-expression of Bax rescues the Ca2+ mobilization defect of DKO T cells. (A) Transduction of DKO T cells with Bax retrovirus. CD4+ T cells from DKO chimeric mice were transduced with empty hCD8-Mig retrovirus (Vec) or retrovirus encoding Bax. Cells were incubated with fluo-4 dye, PE-tagged antibody against hCD8, and anti-CD3 antibody, washed, and plated on coverslips. A representative field of view from confocal imaging is displayed. (B) Western blot of Bax expression in WT or DKO CD4+ T cells transduced with empty hCD8-Mig retrovirus (Vec) or retrovirus encoding Bax. (C) [Ca2+]i of DKO T cells re-expressing Bax. Changes in [Ca2+]i were measured by confocal microscopy following anti-CD3 crosslinking and expressed as a function of time. The traces represent the [Ca2+]i for the population of non-transduced (hCD8-, black) and transduced (hCD8+, red) cells within one field of view. (D) Quantitation of peak [Ca2+]i following anti-CD3 crosslinking for T cells in (C). The data represent the mean ± SEM for T cells from three independent mice. (E) Viability of DKO T cells re-expressing Bax following cytokine withdrawal. WT (filled bars) and DKO (open bars) T cells transduced with empty hCD8-Mig retrovirus (Vec) or retrovirus encoding Bax were cultured in medium containing no exogenous cytokines. Cell viability was determined by trypan blue exclusion 72 hours following cytokine withdrawal for T cells from two independent DKO chimeric mice. The data represent the mean ± s.d. for samples in triplicate. (F) Ionomycin rescues the proliferative defect of DKO T cells. Proliferation of WT (closed bars) or DKO (open bars) T cells stimulated with anti-CD3 or anti-CD3 plus anti-CD28 antibody (1 μg/ml) in the presence or absence of ionomycin (250 ng/ml). Proliferation was measured 3 days after stimulation by 3[H]-thymidine incorporation. The data are representative of three independent experiments.
To assess whether introduction of Bax could affect the sensitivity of DKO T cells to apoptosis, DKO T cells were transduced with control or Bax-expressing retrovirus, and the viability of transduced cells (hCD8+) cultured in the absence of exogenous cytokines was measured. As seen in Figure 5E, DKO T cells expressing Bax displayed decreased viability in response to cytokine withdrawal, while DKO T cells transduced with control vector remained viable. DKO T cells expressing Bax also displayed decreased viability when treated with γ-radiation or doxorubicin (data not shown).
Ionomycin corrects the proliferative defect exhibited by DKO T cells
We next examined whether the impaired proliferative response of DKO T cells could be solely attributed to the underlying defect in Ca2+ signaling. To address this issue the ability of the Ca2+ ionophore ionomycin to restore the proliferative response of bax-/-bak-/- T cells was examined. WT and DKO T cells were stimulated with anti-CD3 antibody alone or in concert with anti-CD28 antibody in the presence or absence of ionomycin, and proliferation was measured after 48 hours of culture by 3[H]-thymidine incorporation. TCR ligation in the presence of ionomycin resulted in equivalent levels of proliferation of DKO T cells in comparison to wild-type T cells (Figure 5F). Costimulation through CD28 augmented the proliferative response of both populations to an equivalent extent when ionomycin was present.
Bax/Bak-dependent Ca2+ flux stimulates mitochondrial ioenergetics
Ca2+ release from the ER can enhance mitochondrial bioenergetics by stimulating enzymes of the tricarboxylic acid (TCA) cycle to generate ATP and other metabolic intermediates (Krauss et al., 2001). One consequence of Ca2+-dependent stimulation of TCA cycle dehydrogenases is an elevation of mitochondrial NADH levels. NADH acts as an electron donor during mitochondrial respiration; electrons are transferred from NADH to complex I of the mitochondrial electron transport chain, a key step in ATP generation by mitochondria. To assess whether mitochondrial bioenergetics could be stimulated by T cell activation, we measured mitochondrial NAD(P)H fluorescence in CD4+ T cells following anti-CD3 crosslinking. TCR triggering promoted a rapid increase in NAD(P)H fluorescence in WT T cells (Figures 6A and 6B). Most of the NAD(P)H in response to TCR stimulation was generated through TCA cycle production of NADH as the signal almost completely returned to baseline following addition of the mitochondrial electron transport uncoupling agent FCCP (Figure 6A). TCR-induced NADH accumulation was reduced in DKO T cells, and the maximal NADH elevation approached only 30-40% of control levels (Figure 6B). To test whether Ca2+ signals could affect this response, NAD(P)H fluorescence of WT and DKO T cells was measured following ionomycin treatment. As seen in Figure 6C, ionomycin stimulated similar increases in NAD(P)H fluorescence in both WT and DKO T cells. This Ca2+-dependent NAD(P)H production was also due to increased mitochondrial NADH as FCCP completely collapsed the response.
Figure 6.

DKO T cells are defective for TCR-dependent mitochondrial NADH production. (A) NAD(P)H fluorescence of WT (black) or DKO (red) T cells over time following anti-CD3 crosslinking. The mitochondrial uncoupling agent FCCP (1 μg/ml) was added as indicated. (B) Mitochondrial NAD(P)H fluorescence before (-) or after (+) anti-CD3 crosslinking. Data are expressed as fold increase over FCCP-treated T cells. (C) NAD(P)H fluorescence of WT (black) or DKO (red) T cells over time following treatment with ionomycin (250 ng/ml). FCCP was added as indicated.
Bax and Bak are required for TCR-dependent ROS production
One predicted consequence of increased mitochondrial NADH levels is the generation of cellular reactive oxygen species (ROS) from a saturated electron transport chain. ROS are produced in T cells in response to TCR stimulation, a process that depends on TCR-mediated Ca2+ signaling (Devadas et al., 2002). To determine whether TCR-induced ROS production is influenced by Bax and Bak, WT and DKO T cells were stimulated by anti-CD3 crosslinking in the presence of the redox-sensitive dye DCF-DA, and dye oxidation was measured by confocal microscopy. TCR stimulation rapidly induced ROS production in WT T cells, but not DKO T cells (Figure 7A). Approximately 80% of WT T cells responded to TCR stimulation with maximal DCF fluorescence, compared to 5% of DKO T cells. However, DKO T cells displayed a normal ROS response following addition of ionomycin (Figure 7B), suggesting that Ca2+ signals could rescue the defect in ROS production observed in DKO T cells. Consistent with this possibility, re-expression of Bax restored TCR-induced ROS production in DKO T cells, indicating a cell-intrinsic requirement for Bax in this process (Figure 7C).
Figure 7.
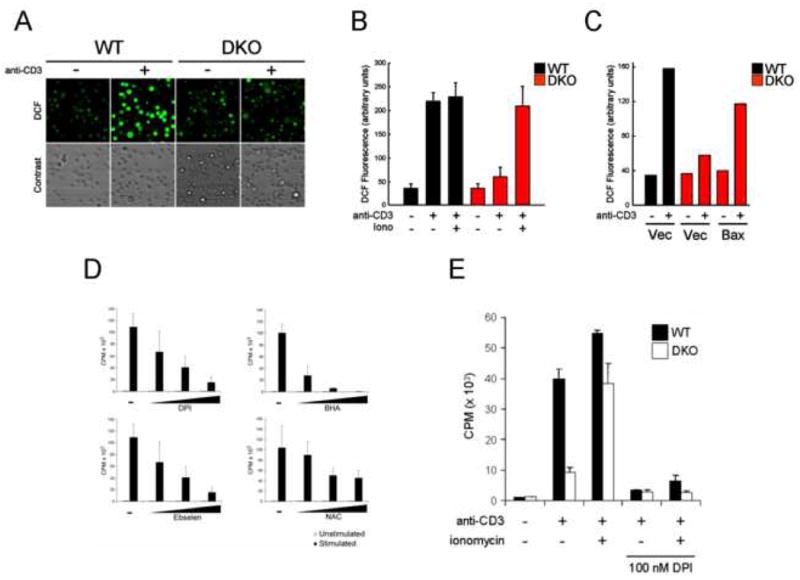
TCR-induced ROS generation is impaired in DKO T cells. (A) Oxidation of the ROS-sensitive dye DCF-DA in WT or DKO T cells following anti-CD3 crosslinking. Top panel displays representative fields of view for cells undergoing DCF oxidation (green) before (-) and after (+) anti-CD3 crosslinking. Phase contrast view for the same field is shown. (B) Quantification of DCF oxidation for WT (black) or DKO (red) T cells following anti-CD3 treatment as in (A). ROS production by T cells was measured following anti-CD3 crosslinking alone or in combination with ionomycin (250 ng/ml). The data represent the mean ± s.d. for triplicate samples, and is representative of three independent experiments. (C) Bax re-expression restores TCR-induced ROS production by DKO T cells. Quantification of DCF dye oxidation following anti-CD3 crosslinking in WT (black) or DKO (red) T cells transduced with empty vector (Vec) or Bax. The data are representative of two independent experiments. (D) Proliferation of T cells in the presence of inhibitors of ROS production. Purified T cells from wild-type animals were left unstimulated or stimulated with anti-CD3 and anti-CD28 antibodies in the presence of increasing concentrations of DPI, BHA, Ebselen, or NAC. Proliferation was measured by 3[H]-thymidine incorporation 48 hours after activation. The data represent the mean ± s.d. for triplicate samples, and is representative of three independent experiments. (E) Proliferation of WT (black) or DKO (white) T cells stimulated with anti-CD3 or anti-CD3 plus ionomycin in the presence or absence of DPI (100 nM). Data are expressed as mean ± s.d. for triplicate samples, and is representative of two independent experiments.
To assess the impact of ROS production on T cell proliferation we measured the proliferative responses of wild-type T cells cultured in the presence of several compounds known to inhibit the generation of TCR-dependent ROS: diphenylene iodonium (DPI), butlyated hydroxyanisole (BHA), Ebselen, and N-acetyl-cysteine (NAC). Each compound induced a dose-dependent decrease in T cell proliferation (Figure 7D). To assess whether enhanced Ca2+ signaling could bypass the requirement for ROS in T cell proliferation, WT and DKO T cells were activated by anti-CD3 and ionomycin stimulation in the presence of DPI. DPI is an inhibitor of flavoprotein dehydrogenases reported to block TCR-induced production of H2O2 and superoxide (Jackson et al., 2004). DPI inhibited the proliferation of WT and DKO T cells, even in the presence of ionomycin (Figure 7E). Together these data demonstrate that Bax and Bak contribute to the ability of TCR- and Ca2+-dependent signaling to induce cellular ROS and subsequent T cell proliferation.
Discussion
The proapoptotic Bcl-2 family members Bax and Bak are required regulators of mitochondrial-dependent apoptotic pathways in lymphocytes. Here we demonstrate a nonapoptotic role for Bax and Bak in the control of T cell proliferation. bax-/-bak-/- T cells display defective proliferation in response to TCR and costimulatory signals in vitro and fail to proliferate or produce effector cytokines in response to the bacterial pathogen L. monocytogenes in vivo. TCR-dependent Ca2+ signaling is impaired in DKO T cells due to reduced ER Ca2+ release following TCR ligation. In comparison to wild type cells, DKO T cells displayed [Ca2+]i oscillations that had higher frequency but lower amplitudes following TCR stimulation that resulted in a reduced TCR-induced rise in [Ca2+]i. Re-expression of Bax in DKO T cells restored TCR-dependent Ca2+ signalling, indicating that the defect in Ca2+ signaling is due to the cell-intrinsic absence of Bax in mature T cells. The decreased Ca2+ signaling is sufficient to account for the hypoproliferative phenotype of Bax/Bak-deficient T cells as restoration of Ca2+ signals with a Ca2+ ionophore restored their ability to proliferate. TCR-dependent [Ca2+]i signals promoted a rapid increase in mitochondrial NADH production and ROS generation, and the normal coupling of these events is mediated by Bax and Bak. Together, the results establish Bax and Bak as critical regulators of not only T cell apoptosis but also T cell proliferation, affecting T cell activation through control of TCR-dependent Ca2+ mobilization and mitochondrial bioenergetics.
The present studies demonstrate that Bax and Bak are essential for T cell activation and proliferation, indicating that these molecules contribute to both apoptotic and proliferative signals. The data, combined with other lines of evidence, suggest that modulators of T cell apoptosis also function to limit T cell responsiveness, indicating that the processes of proliferation and apoptosis are intrinsically linked in lymphocytes. Mice defective for Fas signaling, which triggers apoptosis of activated T cells, also display defects in T cell proliferation (Scholz et al., 1988; Walsh et al., 1998; Salmena et al., 2003; Chau et al., 2005). Similarly, inhibition of caspase activation in the first 24 hours of activation can prevent proliferation (Kennedy et al., 1999). Transgenic overexpression of Bcl-2 or Bcl-XL confers apoptotic resistance to T cells but delays cell cycle entry following TCR stimulation (Linette et al., 1996; Mazel et al., 1996; Li et al., 2002). The present data demonstrate that the proliferative defect observed in those studies is not simply a consequence of overexpression. Loss of physiological levels of Bax and Bak, while ablating susceptibility to apoptosis, reduces the sensitivity of T cells to TCR stimulation. DKO T cells failed to mount an effective T cell response in vivo following infection with a Gram-positive bacterium, L. monocytogenes. As with their effects on T cell viability, Bax and Bak displayed redundant effects on T cell activation, with only their combined loss leading to defects in proliferation. Our data suggest that Bax and Bak function through at least two mechanisms to prevent abnormal lymphocyte expansion: Bax and Bak control the viability of naïve and activated T cells through the initiation of mitochondrial-dependent apoptosis, but they also function to prevent unchecked T cell proliferation by modulating ER Ca2+ release.
A growing body of evidence suggests that Bcl-2 family proteins, in addition to their role in mitochondrial physiology, can influence cellular Ca2+ dynamics through their localization to and action at the ER. Bcl-2 and Bcl-XL physically associate with the IP3R and alter its ability to release Ca2+ from the ER (Chen et al., 2004; White et al., 2005). Conversely, Bax and Bak can promote ER Ca2+ release (Zong et al., 2003). Work using bax-/-bak-/- cell lines has implicated Bax and Bak in the control of cellular Ca2+ homeostasis through reduction of ER Ca2+ levels (Scorrano et al., 2003). Here we demonstrate that defective TCR-dependent Ca2+ signaling underlies the T cell proliferation defect of bax-/-bak-/- T cells. The [Ca2+]i signals generated by TCR stimulation are maintained by the influx of Ca2+ through plasma membrane-associated CRAC channels that open in response to depletion of intracellular Ca2+ stores. The integrated TCR- and IP3-dependent Ca2+ signal is reduced in DKO T cells due to reduced Ca2+ release from the ER, as well as reduced Ca2+ influx from outside the cell. However, store-depletion induced Ca2+ influx appears to be normal in DKO T cells as the intracellular-dependent [Ca2+]i signal following thapsigargin treatment was normal. Together these data suggest that while ER Ca2+ levels are reduced in bax-/-bak-/- T cells, insufficient depletion of ER Ca2+ stores due to low-amplitude [Ca2+]i spiking in DKO T cells may cause reduced influx of Ca2+ through the plasma membrane.
The present results demonstrate that loss of Bax and Bak alters both the magnitude and nature of [Ca2+]i signals triggered by TCR stimulation. The frequency and amplitude of [Ca2+]i elevations dictates the signaling properties of Ca2+ and promotes different biological outcomes (Berridge et al., 2000). TCR stimulation promotes repetitive transient [Ca2+]i spikes which vary in frequency and amplitude (Donnadieu et al., 1992a; Donnadieu et al., 1992b). Multiple lines of evidence suggest that Bcl-2 family proteins modify Ca2+ signaling by altering these [Ca2+]i oscillations. The overexpression of anti-apoptotic members of the Bcl-2 family can promote ligand-induced [Ca2+]i oscillations in haematopoietic cell lines (White et al., 2005; Zhong et al., 2006). Overexpression of either Bcl-2 or Bcl-XL increases the frequency of [Ca2+]i oscillations in response to receptor stimulation, and does so in an IP3R-dependent manner (Zhong et al., 2006). Mechanistically, the binding of Bcl-XL to the IP3R increases its sensitivity to low levels of IP3, resulting in greater frequency of ER Ca2+ release by receptor stimulation; however, Bcl-XL also renders the IP3R more sensitive to inhibition by high Ca2+ (White et al., 2005). The consequence is increased frequency of [Ca2+]i oscillations that have lower amplitudes, resulting in an overall decrease in the integrated [Ca2+]i response. In DKO T cells, where the activity of Bcl-2 or Bcl-XL is not opposed by Bax or Bak, we observed a greater frequency of TCR-induced [Ca2+]i spikes with lower amplitude. The median spike amplitude for DKO T cells is half that observed for wild-type T cells. The consequence of this change in [Ca2+]i oscillations is an overall reduction of the TCR-induced [Ca2+]I signal, which impacts other Ca2+-dependent events such as NADH production and ROS generation.
TCR ligation activates pathways of cellular metabolism for energy production to meet the increased bioenergetic demands of cell growth and proliferation (Krauss et al., 2001; Frauwirth et al., 2002). How does the shuttling of Ca2+ between the ER and mitochondria augment T cell activation and mitochondrial bioenergetics? Ca2+ released from the ER is rapidly taken up by mitochondria located in close proximity (Rizzuto et al., 1993). Periodic release of Ca2+ from the ER stimulates mitochondrial enzymes of the TCA cycle, leading to the maintenance of efficient oxidative phosphorylation and ATP production (Hajnoczky et al., 1995; Duchen, 2000). However, in response to TCR stimulation mitochondrial-dependent NADH production doubles. Thus, the Ca2+-induced increase in mitochondrial NADH is greater than that needed to sustain the mitochondrial respiratory chain. The electron transport chain is limited by the electrochemical potential being generated by the increased NADH available as shown by the ability of the electron transport chain to reduce mitochondrial NADH accumulation when an uncoupling agent (such as FCCP) is given. Enhanced NADH production stimulated by TCR-dependent [Ca2+]i signals leads to an electron-saturated electron transport chain that results in increased mitochondrial ROS production, a process that is blunted in DKO T cells due to a reduced overall [Ca2+]i signal.
What is the importance of Ca2+-dependent ROS generation for T cell activation? Experiments conducted using ROS scavengers have suggested that ROS may be required for T cell proliferation (Chaudhri et al., 1986). TCR-dependent ROS generation can affect MAPK activation and early cytokine production in T cells (Devadas et al., 2002; Jackson et al., 2004). Our data suggest that ROS generation is critical for the initiation of cell division following TCR stimulation, and that TCR-stimulated ROS is dependent on Ca2+ signals regulated by Bax and Bak. The ROS signal that drives proliferation lies downstream of TCR-mediated effects on [Ca2+]i as DPI blocks T cell proliferation of both wild-type and DKO T cells treated with ionomycin. Further experiments must be performed to identify the sources and downstream targets of TCR-dependent ROS generation. It should be noted that while T cells lacking functional NADPH oxidase (p47phox-/- and gp91phox-/-, respectively) display reduced TCR-dependent ROS generation, DPI promotes a further reduction of ROS levels, suggesting that TCR-dependent ROS is generated by additional sources (Jackson et al., 2004). Our results suggest that Ca2+-dependent mitochondrial NADH production may contribute to this process by driving increased rates of mitochondrial respiration. ROS is a natural by-product of mitochondrial respiration when electrons (via NADH) are transferred to O2 during aerobic ATP generation. In this fashion, mitochondrial-derived ROS may function as a signal to the T cell that sufficient energetic conditions exist to support proliferation.
Together the present data indicate that Bax and Bak function to integrate diverse signals that regulate both T cell survival and function. Through their dual effects on proliferation and apoptosis, Bax and Bak control the threshold required for antigen-specific T cell activation and the homeostatic mechanisms that maintain mature T cell viability in vivo. Bax and Bak function at the ER to maintain ER Ca2+ at levels sufficient to support TCR-dependent Ca2+ signaling pathways. One way Bax/Bak-dependent Ca2+ signaling may support T cell proliferation is through rapid effects on mitochondrial energy (NADH) production and ROS generation. Loss of Bax and Bak effectively renders the T cell population inert – T cells are unable to respond to antigenic stimulation but are also unable to die by apoptosis. Consistent with this dual role, the T cell accumulation observed in DKO animals is entirely comprised of small, inert populations of cells (Lindsten et al., 2000). Despite a profound accumulation of T cells in bax-/-bak-/- mice, these animals display no propensity for T cell-mediated autoimmunity. Thus, together Bax and Bak are critical regulators of T cell-mediated immunity by integrating both TCR and apoptotic signals that control T cell proliferation and survival.
Experimental Procedures
Mice
bax-/-bak-/- (DKO) animals have been described previously (Lindsten et al., 2000). Wild-type (WT) or DKO chimeric animals were generated through adoptive transfer of C57BL/6 or bax-/-bak-/- bone marrow or E14-16 fetal liver into lethally-irradiated Rag1-deficient mice. Rag1-deficient and C57BL/6 mice were obtained from the Jackson Laboratory (Bar Harbor, MA).
T cell purification
Total or CD4+ T cells were isolated from the spleen and lymph nodes of WT or DKO chimeric animals 8 to 12 weeks post-reconstitution using positive or negative selection kits (StemCell Technologies, Vancouver, B.C.; Miltenyi Biotec Inc., Auburn, CA) and an AutoMACS cell sorter. T cells were maintained in Iscove's Modified Dulbecco's Medium (IMDM) supplemented with 10% Fetal Bovine Serum, L-glutamine, β-mercaptoethanol, and antibiotics.
T cell stimulation and apoptosis assays
Purified T cells (0.5 – 1 × 10⁶ cells/ml) were stimulated with plate-bound anti-CD3 antibody alone (0.1 – 10 µg/ml), or in combination with anti-CD28 antibody (1 µg/ml) or ionomycin (250 ng/ml). Alternatively, total splenocytes were activated with soluble anti-CD3 (0.1 – 1 µg/ml). T cell proliferation was measured by 3[H]-thymidine incorporation (1 µCi/ml) 48 hours post-activation, or by CFSE dye dilution. T cell ROS production was blocked using diphenylene iodonium (DPI) at 10 – 100 nM. DPI, BHA, Ebselen, and NAC were obtained from Sigma (St. Louis, MO). For apoptosis assays, T cells were activated for 2 days with plate-bound anti-CD3 and anti-CD28 antibodies (5 µg/ml each), washed, and plated in the presence of various apoptotic stimuli (1 × 10⁶ cells/ml). For cytokine withdrawal experiments, T cells were cultured in the presence or absence of recombinant IL-2 (50 U/ml, Peprotech). Viability was measured by propidium iodide (PI) exclusion by flow cytometry.
For Listeria infections, mice were immunized i.v. with a sublethal dose of 5 × 10⁴ CFU of recombinant LM expressing OVA (rLmOVA). The construction of this strain has been described previously (Shen et al., 1995; Foulds et al., 2002). Seven days following infection, splenocytes were harvested and OVA-specific T cells detected using MHC Class I tetramers (Kb/OVA257-264). Alternatively, OVA-specific T cells in the peripheral blood of infected mice were detected over time. For intracellular staining, splenocytes were stimulated for 5 hours in IMDM supplemented with 50 U/ml recombinant human IL-2, 1.0 µl/ml GolgiStop (BD Pharmingen, San Diego, CA), and the presence or absence of OVA257–264 or listeriolysin O190–201 (LLO190–201) peptide. Intracellular staining was performed using a cytoperm/cytofix intracellular staining kit and conjugated antibodies against IFN-γ (clone XMG1.2) (BD Pharmingen). Each experiment was conducted with a minimum of three mice per group.
Retroviral Transduction
Retrovirus for DKO T cell transduction was produced using established methods (Izon et al., 2001). Briefly, 293T cells were cotransfected with pCL-Eco retrovirus packaging vector and either empty hCD8-Mig vector or hCD8-Mig encoding Bax cDNA, and culture supernatant containing high-titer retrovirus was collected 48 hours post-transfection. CD4+ DKO T cells were purified from spleen and lymph nodes and activated for 24 hours with plate-bound anti-CD3 (5 μg/ml) and -CD28 (2.5 μg/ml) antibodies. Activated T cells were cultured in 1 ml retroviral supernatant containing 8 μg/ml polybrene, and centrifuged at 2500 rpm for 90 minutes. Infected T cells were expanded for 3 days in the presence of recombinant IL2 (50 – 200 U/ml). Transduced T cells were identified using PE- or APC-conjugated antibodies against human CD8a (clone RPA-T8, eBioscience). For some experiments transduced cells were purified by positive selection using anti-hCD8 microbeads and magnetic sorting (Miltenyi Biotec).
Biochemistry
Purified T cells (2 × 10⁶ cells/ml) were stimulated with plate-bound anti-CD3 antibody alone (1 µg/ml), or in combination with anti-CD28 antibody (5 μg/ml) or ionomycin (250 ng/ml). Alternatively, T cells were pre-incubated with anti-CD3 antibody (10 μg/ml) at 4°C for 30 minutes, washed twice, and T cell activation induced at 37°C by addition of anti-hamster-IgG (5 μg/ml, Pearce) to crosslink cell-bound anti-CD3. T cells were lysed using RIPA buffer (50 mM Tris-HCl (pH 7.4), 150 mM NaCl, 1 mM EDTA, 1% Triton X-100, 1% sodium deoxycholate, 0.1% SDS) containing PMSF (1 mM), benzamidine (1 mM), Complete protease inhibitors (Roche), and phosphatase inhibitor cocktail (Sigma). Protein lysates were separated on a 10% SDS-PAGE gel, transferred to nitrocellulose, and probed using antibodies against MAPK (total and pT202/Y204), PLCγ1 (total and pY783) (Cell Signaling Technologies), and Bax (N-20, Santa Cruz Biotechnology). Western blots were resolved using enhanced chemiluminescence (Amersham).
Calcium Measurements
For measurements of [Ca2+]i dynamics by flow cytometry, WT or DKO T cells were incubated with anti-CD3 antibody (10 µg/ml), probenicid (4 mM), and indo-1 (2 μg/ml) in RPMI containing 1% FCS for 30 minutes at 30°C, washed, and resuspended in serum-free RPMI. T cell [Ca2+]i signals were induced by addition of anti-hamster-IgG or addition of IP3 ester (10 μM), and measured using an LSR flow cytometer (Becton Dickenson). Thapsigargin (Sigma) was added to cells at 1 uM in the presence or absence of 0.5 mM LaCl3 to block Ca2+ extrusion across the plasma membrane. For [Ca2+]i imaging by fluorescence or confocal microscopy, T cells were pre-incubated with anti-CD3 antibody and loaded with fluo-4, and then seeded on coverslips coated with CellTac adhesive (Becton Dickenson). [Ca2+]i signals were induced by addition of crosslinker. For the study of single-cell [Ca2+]i dynamics, T cells were loaded with fura-2 and applied to coverslips coated with anti-CD3 antibody. Fura-2 was alternately excited at 340 and 380 nm, and the emitted fluorescence filtered at 510 nm was collected and recorded using a CCD-based imaging system running Ultraview software (Perkin Elmer).
NAD(P)H and ROS measurements
WT or DKO T cells were pre-incubated with anti-CD3 antibody (10 µg/ml) for 30 minutes, washed, and resuspended in Hanks' balanced salt solution (4 × 10⁶ cells/ml). T cell activation was induced by addition of anti-hamster-IgG as described above. Autofluorescence of NAD(P)H was monitored at 350/460 nm (excitation/emission) using a multi-wavelength excitation, dual-wavelength emission fluorimeter (Delta RAM, PTI, Birmingham, NJ). ROS measurements were performed as described previously (Madesh et al., 2005). In brief, 2′,7′-dichlorofluorescein diacetate (DCF-DA) was added during the last 15 minutes of pre-incubation, followed by crosslinking with anti-IgG. ROS production was determined by the level of DCF dye oxidation as measured by fluorescence microscopy.
Supplementary Material
Acknowledgments
We thank members of the Pearce, Koretzky, and Reiner laboratories for reagents, J.C. Rathmell, C. Li, and members of Thompson laboratory for critical discussions, and S. Kerns, J. Joh, and D. Baban for administrative assistance. This work was supported by the Cancer Research Institute and the Canadian Institutes for Health Research (to R.G.J.), the Human Frontiers Scientific Program (to C.M.K.), the National Institutes of Health, and the Abramson Family Cancer Research Institute.
Footnotes
Publisher's Disclaimer: This is a PDF file of an unedited manuscript that has been accepted for publication. As a service to our customers we are providing this early version of the manuscript. The manuscript will undergo copyediting, typesetting, and review of the resulting proof before it is published in its final citable form. Please note that during the production process errors may be discovered which could affect the content, and all legal disclaimers that apply to the journal pertain.
References
- Berridge MJ, Lipp P, Bootman MD. The versatility and universality of calcium signalling. Nat Rev Mol Cell Biol. 2000;1:11–21. doi: 10.1038/35036035. [DOI] [PubMed] [Google Scholar]
- Bidere N, Su HC, Lenardo MJ. Genetic disorders of programmed cell death in the immune system. Annu Rev Immunol. 2006;24:321–352. doi: 10.1146/annurev.immunol.24.021605.090513. [DOI] [PubMed] [Google Scholar]
- Chao DT, Linette GP, Boise LH, White LS, Thompson CB, Korsmeyer SJ. Bcl-XL and Bcl-2 repress a common pathway of cell death. J Exp Med. 1995;182:821–828. doi: 10.1084/jem.182.3.821. [DOI] [PMC free article] [PubMed] [Google Scholar]
- Chau H, Wong V, Chen NJ, Huang HL, Lin WJ, Mirtsos C, Elford AR, Bonnard M, Wakeham A, You-Ten AI, et al. Cellular FLICE-inhibitory protein is required for T cell survival and cycling. J Exp Med. 2005;202:405–413. doi: 10.1084/jem.20050118. [DOI] [PMC free article] [PubMed] [Google Scholar]
- Chaudhri G, Clark IA, Hunt NH, Cowden WB, Ceredig R. Effect of antioxidants on primary alloantigen-induced T cell activation and proliferation. J Immunol. 1986;137:2646–2652. [PubMed] [Google Scholar]
- Chen R, Valencia I, Zhong F, McColl KS, Roderick HL, Bootman MD, Berridge MJ, Conway SJ, Holmes AB, Mignery GA, et al. Bcl-2 functionally interacts with inositol 1,4,5-trisphosphate receptors to regulate calcium release from the ER in response to inositol 1,4,5-trisphosphate. J Cell Biol. 2004;166:193–203. doi: 10.1083/jcb.200309146. [DOI] [PMC free article] [PubMed] [Google Scholar]
- Cheng EH, Wei MC, Weiler S, Flavell RA, Mak TW, Lindsten T, Korsmeyer SJ. BCL-2, BCL-X(L) sequester BH3 domain-only molecules preventing BAX- and BAK-mediated mitochondrial apoptosis. Mol Cell. 2001;8:705–711. doi: 10.1016/s1097-2765(01)00320-3. [DOI] [PubMed] [Google Scholar]
- Devadas S, Zaritskaya L, Rhee SG, Oberley L, Williams MS. Discrete generation of superoxide and hydrogen peroxide by T cell receptor stimulation: selective regulation of mitogen-activated protein kinase activation and fas ligand expression. J Exp Med. 2002;195:59–70. doi: 10.1084/jem.20010659. [DOI] [PMC free article] [PubMed] [Google Scholar]
- Donnadieu E, Bismuth G, Trautmann A. Calcium fluxes in T lymphocytes. J Biol Chem. 1992a;267:25864–25872. [PubMed] [Google Scholar]
- Donnadieu E, Cefai D, Tan YP, Paresys G, Bismuth G, Trautmann A. Imaging early steps of human T cell activation by antigen-presenting cells. J Immunol. 1992b;148:2643–2653. [PubMed] [Google Scholar]
- Duchen MR. Mitochondria and calcium: from cell signalling to cell death. J Physiol. 2000;529(Pt 1):57–68. doi: 10.1111/j.1469-7793.2000.00057.x. [DOI] [PMC free article] [PubMed] [Google Scholar]
- Foulds KE, Zenewicz LA, Shedlock DJ, Jiang J, Troy AE, Shen H. Cutting edge: CD4 and CD8 T cells are intrinsically different in their proliferative responses. J Immunol. 2002;168:1528–1532. doi: 10.4049/jimmunol.168.4.1528. [DOI] [PubMed] [Google Scholar]
- Frauwirth KA, Riley JL, Harris MH, Parry RV, Rathmell JC, Plas DR, Elstrom RL, June CH, Thompson CB. The CD28 signaling pathway regulates glucose metabolism. Immunity. 2002;16:769–777. doi: 10.1016/s1074-7613(02)00323-0. [DOI] [PubMed] [Google Scholar]
- Hajnoczky G, Robb-Gaspers LD, Seitz MB, Thomas AP. Decoding of cytosolic calcium oscillations in the mitochondria. Cell. 1995;82:415–424. doi: 10.1016/0092-8674(95)90430-1. [DOI] [PubMed] [Google Scholar]
- Izon DJ, Punt JA, Xu L, Karnell FG, Allman D, Myung PS, Boerth NJ, Pui JC, Koretzky GA, Pear WS. Notch1 regulates maturation of CD4+ and CD8+ thymocytes by modulating TCR signal strength. Immunity. 2001;14:253–264. doi: 10.1016/s1074-7613(01)00107-8. [DOI] [PubMed] [Google Scholar]
- Jackson SH, Devadas S, Kwon J, Pinto LA, Williams MS. T cells express a phagocyte-type NADPH oxidase that is activated after T cell receptor stimulation. Nat Immunol. 2004;5:818–827. doi: 10.1038/ni1096. [DOI] [PubMed] [Google Scholar]
- Kennedy NJ, Kataoka T, Tschopp J, Budd RC. Caspase activation is required for T cell proliferation. J Exp Med. 1999;190:1891–1896. doi: 10.1084/jem.190.12.1891. [DOI] [PMC free article] [PubMed] [Google Scholar]
- Krauss S, Brand MD, Buttgereit F. Signaling takes a breath--new quantitative perspectives on bioenergetics and signal transduction. Immunity. 2001;15:497–502. doi: 10.1016/s1074-7613(01)00205-9. [DOI] [PubMed] [Google Scholar]
- Lewis RS. Calcium signaling mechanisms in T lymphocytes. Annu Rev Immunol. 2001;19:497–521. doi: 10.1146/annurev.immunol.19.1.497. [DOI] [PubMed] [Google Scholar]
- Li C, Fox CJ, Master SR, Bindokas VP, Chodosh LA, Thompson CB. Bcl-X(L) affects Ca(2+) homeostasis by altering expression of inositol 1,4,5-trisphosphate receptors. Proc Natl Acad Sci U S A. 2002;99:9830–9835. doi: 10.1073/pnas.152571899. [DOI] [PMC free article] [PubMed] [Google Scholar]
- Lindsten T, Ross AJ, King A, Zong WX, Rathmell JC, Shiels HA, Ulrich E, Waymire KG, Mahar P, Frauwirth K, et al. The combined functions of proapoptotic Bcl-2 family members bak and bax are essential for normal development of multiple tissues. Mol Cell. 2000;6:1389–1399. doi: 10.1016/s1097-2765(00)00136-2. [DOI] [PMC free article] [PubMed] [Google Scholar]
- Linette GP, Li Y, Roth K, Korsmeyer SJ. Cross talk between cell death and cell cycle progression: BCL-2 regulates NFAT-mediated activation. Proc Natl Acad Sci U S A. 1996;93:9545–9552. doi: 10.1073/pnas.93.18.9545. [DOI] [PMC free article] [PubMed] [Google Scholar]
- Madesh M, Hawkins BJ, Milovanova T, Bhanumathy CD, Joseph SK, Ramachandrarao SP, Sharma K, Kurosaki T, Fisher AB. Selective role for superoxide in InsP3 receptor-mediated mitochondrial dysfunction and endothelial apoptosis. J Cell Biol. 2005;170:1079–1090. doi: 10.1083/jcb.200505022. [DOI] [PMC free article] [PubMed] [Google Scholar]
- Marsden VS, Strasser A. Control of apoptosis in the immune system: Bcl-2, BH3-only proteins and more. Annu Rev Immunol. 2003;21:71–105. doi: 10.1146/annurev.immunol.21.120601.141029. [DOI] [PubMed] [Google Scholar]
- Mazel S, Burtrum D, Petrie HT. Regulation of cell division cycle progression by bcl-2 expression: a potential mechanism for inhibition of programmed cell death. J Exp Med. 1996;183:2219–2226. doi: 10.1084/jem.183.5.2219. [DOI] [PMC free article] [PubMed] [Google Scholar]
- Motoyama N, Wang F, Roth KA, Sawa H, Nakayama K, Nakayama K, Negishi I, Senju S, Zhang Q, Fujii S, et al. Massive cell death of immature hematopoietic cells and neurons in Bcl-x-deficient mice. Science. 1995;267:1506–1510. doi: 10.1126/science.7878471. [DOI] [PubMed] [Google Scholar]
- Nakayama K, Nakayama K, Negishi I, Kuida K, Sawa H, Loh DY. Targeted disruption of Bcl-2 alpha beta in mice: occurrence of gray hair, polycystic kidney disease, and lymphocytopenia. Proc Natl Acad Sci U S A. 1994;91:3700–3704. doi: 10.1073/pnas.91.9.3700. [DOI] [PMC free article] [PubMed] [Google Scholar]
- Oakes SA, Scorrano L, Opferman JT, Bassik MC, Nishino M, Pozzan T, Korsmeyer SJ. Proapoptotic BAX and BAK regulate the type 1 inositol trisphosphate receptor and calcium leak from the endoplasmic reticulum. Proc Natl Acad Sci U S A. 2005;102:105–110. doi: 10.1073/pnas.0408352102. [DOI] [PMC free article] [PubMed] [Google Scholar]
- Ohashi PS. T-cell signalling and autoimmunity: molecular mechanisms of disease. Nat Rev Immunol. 2002;2:427–438. doi: 10.1038/nri822. [DOI] [PubMed] [Google Scholar]
- Rathmell JC, Lindsten T, Zong WX, Cinalli RM, Thompson CB. Deficiency in Bak and Bax perturbs thymic selection and lymphoid homeostasis. Nat Immunol. 2002;3:932–939. doi: 10.1038/ni834. [DOI] [PubMed] [Google Scholar]
- Rizzuto R, Brini M, Murgia M, Pozzan T. Microdomains with high Ca2+ close to IP3-sensitive channels that are sensed by neighboring mitochondria. Science. 1993;262:744–747. doi: 10.1126/science.8235595. [DOI] [PubMed] [Google Scholar]
- Salmena L, Lemmers B, Hakem A, Matysiak-Zablocki E, Murakami K, Au PY, Berry DM, Tamblyn L, Shehabeldin A, Migon E, et al. Essential role for caspase 8 in T-cell homeostasis and T-cell-mediated immunity. Genes Dev. 2003;17:883–895. doi: 10.1101/gad.1063703. [DOI] [PMC free article] [PubMed] [Google Scholar]
- Scholz W, Isakov N, Mally MI, Theofilopoulos AN, Altman A. Lpr T cell hyporesponsiveness to mitogens linked to deficient receptor-stimulated phosphoinositide hydrolysis. J Biol Chem. 1988;263:3626–3631. [PubMed] [Google Scholar]
- Scorrano L, Oakes SA, Opferman JT, Cheng EH, Sorcinelli MD, Pozzan T, Korsmeyer SJ. BAX and BAK regulation of endoplasmic reticulum Ca2+: a control point for apoptosis. Science. 2003;300:135–139. doi: 10.1126/science.1081208. [DOI] [PubMed] [Google Scholar]
- Sentman CL, Shutter JR, Hockenbery D, Kanagawa O, Korsmeyer SJ. bcl-2 inhibits multiple forms of apoptosis but not negative selection in thymocytes. Cell. 1991;67:879–888. doi: 10.1016/0092-8674(91)90361-2. [DOI] [PubMed] [Google Scholar]
- Shen H, Slifka MK, Matloubian M, Jensen ER, Ahmed R, Miller JF. Recombinant Listeria monocytogenes as a live vaccine vehicle for the induction of protective anti-viral cell-mediated immunity. Proc Natl Acad Sci U S A. 1995;92:3987–3991. doi: 10.1073/pnas.92.9.3987. [DOI] [PMC free article] [PubMed] [Google Scholar]
- Strasser A, Harris AW, Cory S. bcl-2 transgene inhibits T cell death and perturbs thymic self-censorship. Cell. 1991;67:889–899. doi: 10.1016/0092-8674(91)90362-3. [DOI] [PubMed] [Google Scholar]
- Thastrup O, Cullen PJ, Drobak BK, Hanley MR, Dawson AP. Thapsigargin, a tumor promoter, discharges intracellular Ca2+ stores by specific inhibition of the endoplasmic reticulum Ca2(+)-ATPase. Proc Natl Acad Sci U S A. 1990;87:2466–2470. doi: 10.1073/pnas.87.7.2466. [DOI] [PMC free article] [PubMed] [Google Scholar]
- Veis DJ, Sorenson CM, Shutter JR, Korsmeyer SJ. Bcl-2-deficient mice demonstrate fulminant lymphoid apoptosis, polycystic kidneys, and hypopigmented hair. Cell. 1993;75:229–240. doi: 10.1016/0092-8674(93)80065-m. [DOI] [PubMed] [Google Scholar]
- Venkatachalam K, van Rossum DB, Patterson RL, Ma HT, Gill DL. The cellular and molecular basis of store-operated calcium entry. Nat Cell Biol. 2002;4:E263–272. doi: 10.1038/ncb1102-e263. [DOI] [PubMed] [Google Scholar]
- Walsh CM, Wen BG, Chinnaiyan AM, O'Rourke K, Dixit VM, Hedrick SM. A role for FADD in T cell activation and development. Immunity. 1998;8:439–449. doi: 10.1016/s1074-7613(00)80549-x. [DOI] [PubMed] [Google Scholar]
- Wei MC, Lindsten T, Mootha VK, Weiler S, Gross A, Ashiya M, Thompson CB, Korsmeyer SJ. tBID, a membrane-targeted death ligand, oligomerizes BAK to release cytochrome c. Genes Dev. 2000;14:2060–2071. [PMC free article] [PubMed] [Google Scholar]
- Wei MC, Zong WX, Cheng EH, Lindsten T, Panoutsakopoulou V, Ross AJ, Roth KA, MacGregor GR, Thompson CB, Korsmeyer SJ. Proapoptotic BAX and BAK: a requisite gateway to mitochondrial dysfunction and death. Science. 2001;292:727–730. doi: 10.1126/science.1059108. [DOI] [PMC free article] [PubMed] [Google Scholar]
- White C, Li C, Yang J, Petrenko NB, Madesh M, Thompson CB, Foskett JK. The endoplasmic reticulum gateway to apoptosis by Bcl-X(L) modulation of the InsP3R. Nat Cell Biol. 2005;7:1021–1028. doi: 10.1038/ncb1302. [DOI] [PMC free article] [PubMed] [Google Scholar]
- Zhong F, Davis MC, McColl KS, Distelhorst CW. Bcl-2 differentially regulates Ca2+ signals according to the strength of T cell receptor activation. J Cell Biol. 2006;172:127–137. doi: 10.1083/jcb.200506189. [DOI] [PMC free article] [PubMed] [Google Scholar]
- Zong WX, Li C, Hatzivassiliou G, Lindsten T, Yu QC, Yuan J, Thompson CB. Bax and Bak can localize to the endoplasmic reticulum to initiate apoptosis. J Cell Biol. 2003;162:59–69. doi: 10.1083/jcb.200302084. [DOI] [PMC free article] [PubMed] [Google Scholar]
Associated Data
This section collects any data citations, data availability statements, or supplementary materials included in this article.