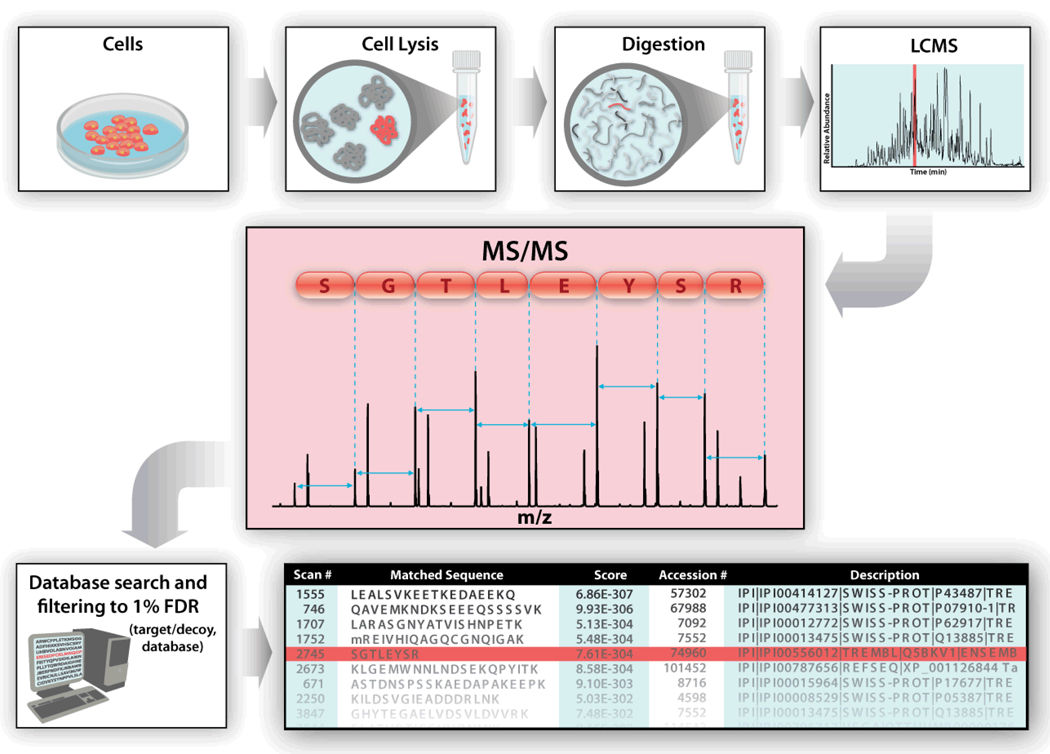
Over the past twenty five years mass spectrometry has become a mainstream analytical tool for protein sequence analysis. The methodology has become so pervasive that most research institutions possess several, if not dozens of mass spectrometers. These instruments, who once had a reputation for being fussy and breakdown-prone, have been transformed into remarkably robust black boxes that no longer require dedicated expert operators. Concurrent to these technological advances, the field has witnessed great evolution in the associated methodology and informatics areas. The result is an established process that can be found in most molecular biology and biochemistry texts (Figure 1). Serving as the centerpiece, tandem MS is a principal component of this scheme. How dissociation is effected determines the upstream sample handling, while the spectral features it produces regulate the downstream informatics approach.
Figure 1.
Overview of contemporary proteomics methodology. Extracted proteins are enzymatically digested to produce highly complex mixtures of peptides that are then sorted with one or multiple dimensions of chromatography. The final stage of chromatography is generally coupled to a mass spectrometer through an electrospray interface. Peptide precursor cations are selected for analysis by MS/MS to produce spectra like the one shown in the red box. The thousands of these spectra collected per hour are then exported to database correlation algorithms where spectra having good matches to peptides present in a database are displayed to the user. The success of this approach, however, relies heavily upon the MS/MS step producing a sufficient number of fragment ions for spectral matching.
For decades now the choice method to impart dissociation has been the collision of peptide cations with rare gas atoms (collision-activated dissociation, CAD).1–3 This method is particularly simple and effective – in a very real sense, it is the scaffold upon which today’s proteomic methodologies are built. Just ten years ago a very different fragmentation technique was discovered, one that relies upon the capture of electrons rather than collisions.4–7 The technique – electron capture dissociation (ECD) – has been widely acclaimed, though it is mainly restricted to instruments that use magnetic fields for ion confinement. Four years ago it was discovered that peptide cations could be dissociated in a similar fashion as ECD when reacted with radical anions.8, 9 This technique, electron transfer dissociation (ETD), provides ECD-like fragmentation, but is readily implemented on the more common ion trapping-type mass spectrometers. Today ETD has been made commercially available by several vendors.10–12 But exactly what does ETD bring to the proteomic table? Further, how does it fit into the current workflow (Figure 1)? For many researchers the answers to these (and other) questions may not be obvious. So, in addition to discussing ETD and its attributes, this feature aims to provide a basis to define the role(s) ETD will play in protein sequence analysis.
Tandem Mass Spectrometry
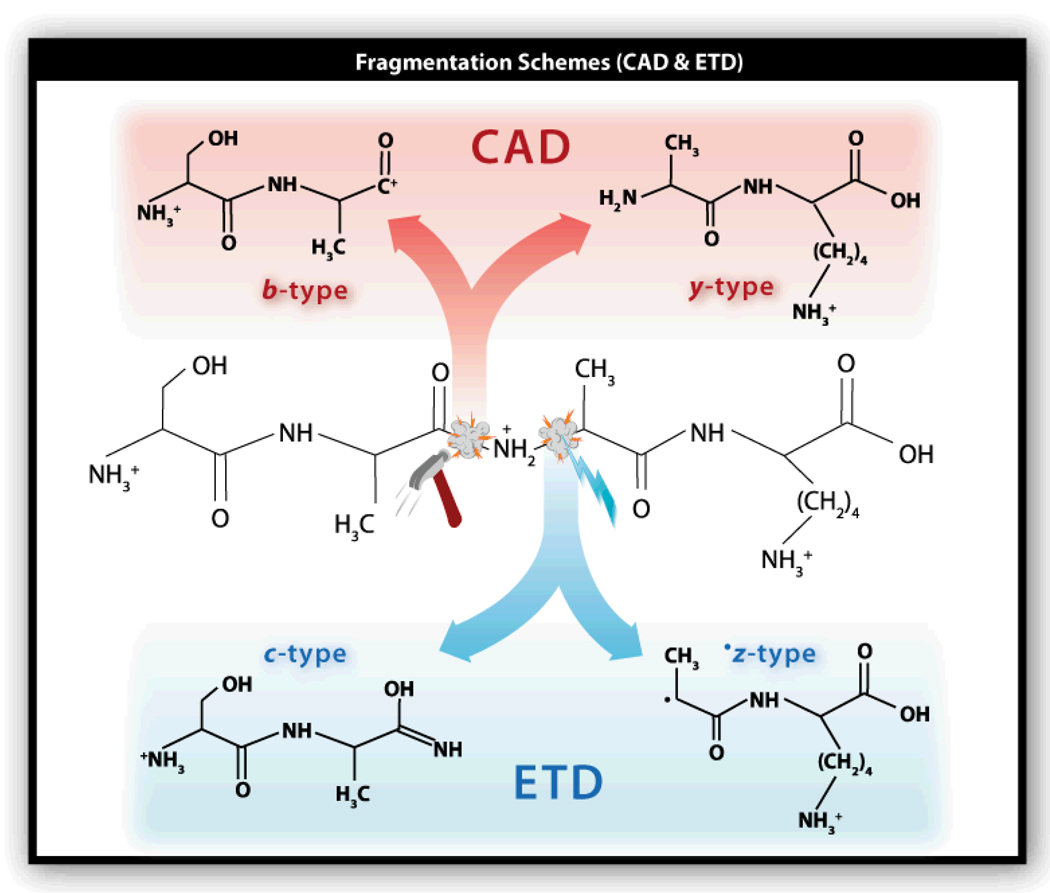
The objective of the MS/MS experiment is to produce a collection of peptide fragment ions that differ in mass by a single amino acid – allowing one to read the amino acid sequence of the precursor peptide (Figure 1, center).13 In CAD, these fragments are generated by subjecting a population of isolated precursor cations to collisions with gas atoms. These collisions supply sufficient internal energy to induce covalent bond breakage. Cleavage of the amide linkage – the favored CAD target – gives rise to b- and y-type fragment ions (Figure 2, top). ETD, on the other hand, follows from reaction of multiply protonated peptide cations with small molecule anions. These reactions proceed by transfer of an electron from the anion to the peptide cation. The result is an odd-electron cation that undergoes free radical-driven cleavage – just as in electron capture dissociation (ECD).4 Unlike CAD, ETD takes aim at the N-Cα bond, generating both even and odd electron product ions (c- and z•-type, Figure 2, bottom).
Figure 2.
Diagram displaying the fragment ion types produced following either CAD or ETD.
From a pragmatic perspective, product ions resulting from amide bond cleavage are worth no more or less than those derived from N-Cα bond dissociation. That is, for spectral interpretation there is no apparent advantage of using b- and y-type vs. c- and z-type product ions (or vice versa). Note the formation of a product ion pair where one series is odd electron and the other is even does offer special opportunities when product ion masses are measured at very high accuracies (vide infra).14 Setting that aside for now, we shall focus our discussion on the defining features of either technique.
Sequence compatibility
The ideal dissociation method randomly cleaves peptide backbone bonds regardless of peptide length, charge (z), mass-to-charge ratio (m/z), amino acid composition or order, and is indifferent to the presence of post-translational modifications (PTMs) – no such method currently exists. Some of these attributes are related, but their collective affect on fragmentation has sculpted virtually every aspect of contemporary proteomics (Figure 1). During collisional-activation, energy is deposited on a relatively slow time-scale (ps to µs) and is redistributed throughout the peptide precursor cation to induce cleavage of the weakest bond(s) – the protonated amide linkages. Ideally, these amide linkages are randomly protonated within the precursor population so that upon collisions, a variety of fragments are made, each differing from the next by the mass of an amino acid. The key to making this happen is to encourage random protonation along the amide backbone linkages. Over the years researchers have come to rely on the enzyme trypsin for this purpose. Trypsin cleaves proteins at lysine (K) and arginine (R) residues so that the resulting peptides contain no internal basic amino acids – that is, upon digestion with trypsin the resulting peptides will not have internal amino acids that are capable of blocking random protonation.15, 16 A side-effect of trypsin use is that the resultant peptides are smallish, averaging ∼ 10 residues in length.
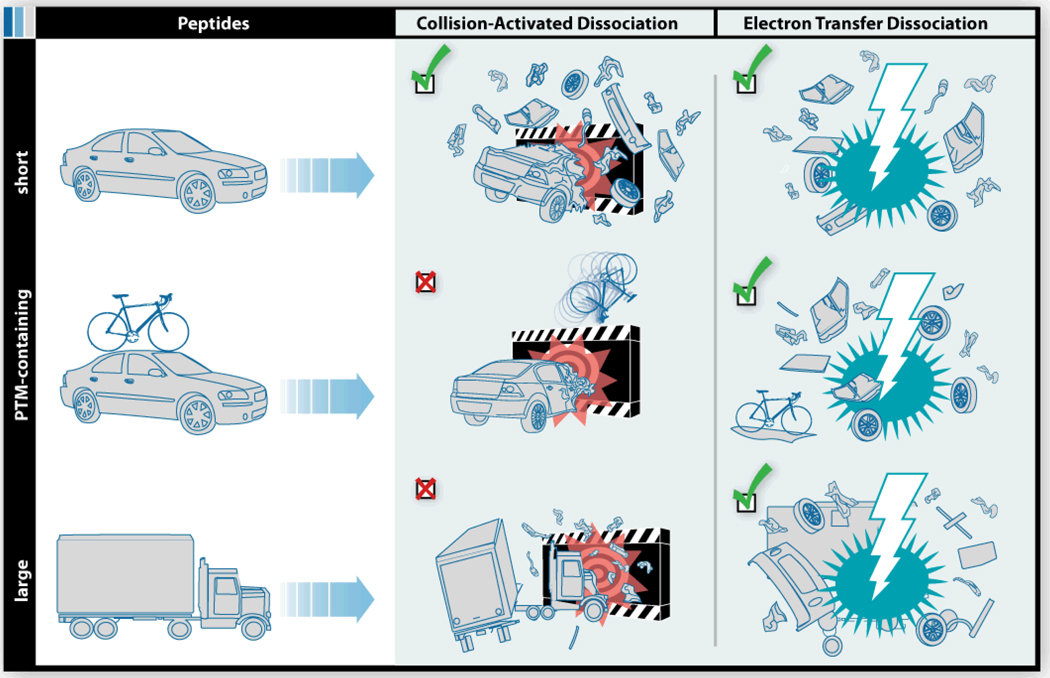
Figure 3 depicts the utility of CAD for sequencing three broad categories of peptides – short (tryptic), post-translational modification-containing (PTM, long or short), and large. Imagine the short peptide undergoing CAD as a small car colliding with a wall, as in a high speed crash test – an admittedly imperfect, but nonetheless useful analogy. From such an experiment we can expect the car to incur significant damage, i.e., breakage into various pieces. But what happens if we hold the trypsin and apply a different protease? Numerous other enzymes result in an increase in average peptide length, relative to trypsin. This increase in size is beneficial in that there are now fewer peptides to sequence per protein; however, many of these peptides contain internal basic residues – remember internal basic residues sequester charge and prevent random backbone cleavages. Back to the car analogy, we can easily recognize that as the size of the vehicle grows, it suffers less damage following an encounter with the wall. Here we see that a tractor-trailer rig undergoes only minor damage, while the bulk remains intact (Figure 3). It is for this reason that trypsin has come to be the preferred enzyme for proteomics.
Figure 3.
Cartoon illustrating three categories of peptide precursors – short, PTM-containing, and large. CAD is highly effective for peptides in the short category, but is generally less effective for those that are either large or PTM-containing. ETD is more or less indifferent to peptide length or the presence of PTMs.
Even if we employ trypsin to force the generation of well-behaving, CAD-friendly peptides, complications still arise. Perhaps the most considerable of these obstacles is the presence of protein post-translational modifications (PTMs). When peptides contain PTMs, e.g., phosphorylation, glycosylation, sulfonation, etc., the preferred CAD dissociation pathways often change.17, 18 In phosphorylated peptides, for example, the phosphoryl group competes with the amide bonds of the backbone as the preferred site of protonation so that upon CAD phosphoric acid is displaced, leaving the backbone bonds intact. To simplify, imagine ramming a car with a bicycle attached to the roof into the wall (Figure 3). The first thing to come off is the weakly attached bicycle. Similarly, CAD spectra of PTM-containing peptides are frequently devoid of the consecutive backbone cleavages necessary for sequence identification.
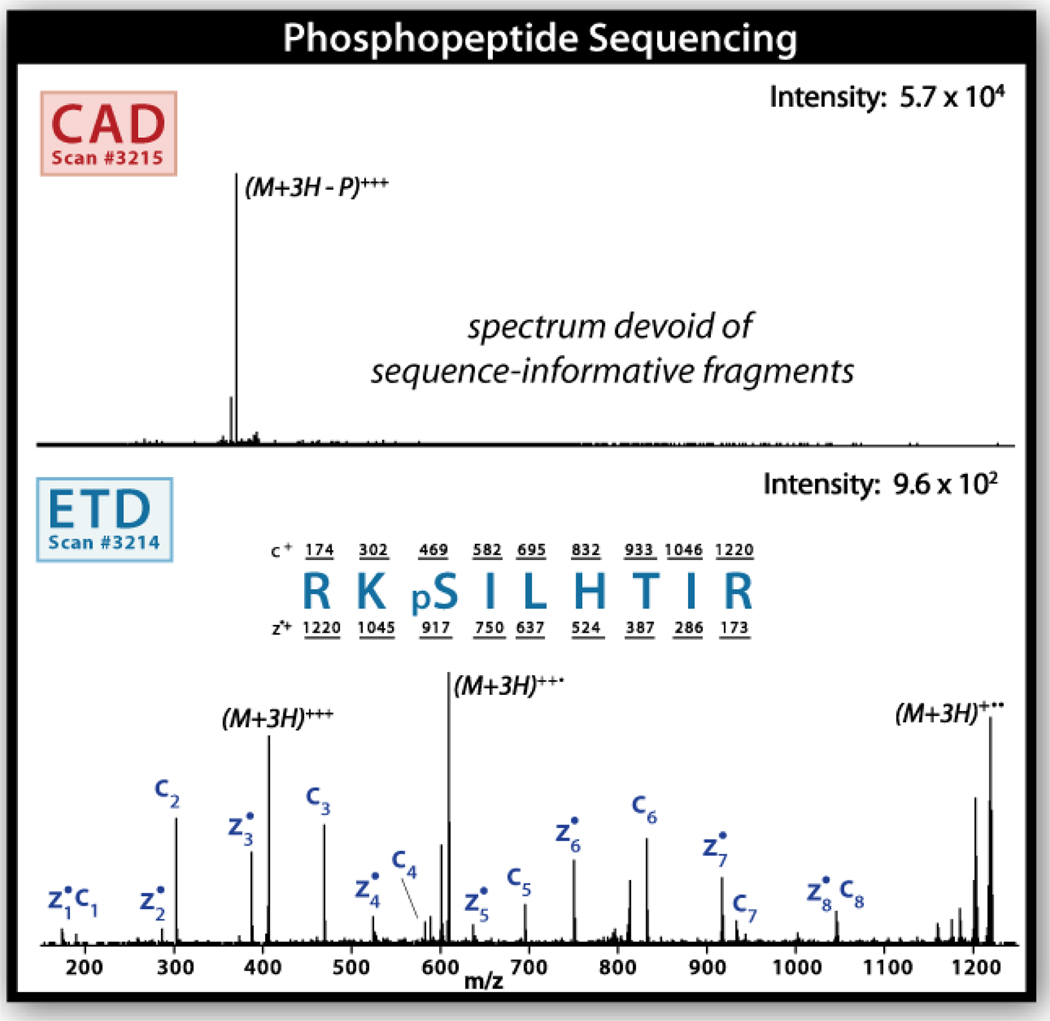
Figure 4 provides a comparison of both CAD and ETD fragmentation methods as applied sequentially to an eluting phosphopeptide. The top panel displays the first MS/MS scan acquired using CAD; the spectrum is characterized by a single m/z that corresponds to the loss of H3PO4 as graphically depicted in Figure 3 with the bicycle. Sequence assignment with this spectrum is therefore impossible. The very next scan utilized ETD and generated the spectrum shown in lower panel. Upon application of ETD, every possible backbone fragment is observed, defining the unknown peptide sequence as RKpSILHTIR (where pS denotes a phosphoserine). And even in cases where CAD does provide enough backbone cleavages for sequence identification, site localization can be difficult. Cleavage between each inter-residue linkage is critical in this regard. Many recent reports describe the use of ETD for phosphorylation, glycosylation, and sulfonation analysis.12, 19–33
Figure 4.
Tandem mass spectra obtained from a phosphopeptide eluted during a nHPLC-MS/MS experiment. The top panel displays the tandem mass spectrum produced following CAD. Note this spectrum is dominated by a single m/z corresponding to loss of a phosphoric acid moiety. No peptide backbone cleavage is observed. Sequence identification is impossible. The lower panel displays the tandem mass spectrum that is produced following ETD fragmentation. Here every single backbone cleavage product is observed. The sequence is easily assigned as RKpSILHTIR. Both panels display single-scan mass spectra.
Instrumentation
Since the first description of ETD in 2004, numerous instrumental configurations to effect the method have been reported. In the initial implementation, a Thermo Scientific linear ion trap mass spectrometer was modified in two ways: (1) a source of reagent anions was added and (2) the linear ion trap was altered to allow concurrent confinement of both anions and cations.8, 9 Such linear ion trap systems offer an advantage in that the unoccupied end of the linear ion trap is accessible and readily modified to accommodate an anionic reagent source, chemical ionization in this case. That design is now the basis for one commercial implementation of the method – the Thermo Scientific LTQ XL ETD (Figure 5). ETD can also be realized within three dimension (3D) ion trap systems in a similar way, except that both anion and cation populations are injected through a single ion pathway, with one exception.34 Two vendors, Agilent and Bruker, have made commercial 3D ion trap ETD systems by addition of a CI source (Figure 5).11, 12 And in just the last few years McLuckey and co-workers have pioneered the development of methods to generate ETD-inducing anions under atmospheric pressure conditions so that the downstream MS system requires minimal modification.35–37 The major aim of such approaches are to (1) not impact peptide cation production and (2) to generate an intense beam of highly efficient ETD-inducing reagents. These approaches show genuine promise and, with continued development, may allow for a more simplified, inexpensive pathway to impart ETD on virtually any MS system.
Figure 5.
Diagram of the four commercial ETD-enabled MS systems.
Linear ion trap mass spectrometers present many advantages over 3D ion traps for peptide analysis – the ETD application is no exception. Linear ion traps offer higher ion capacities, injection efficiencies, detection efficiencies, and are readily coupled with other mass analyzers (e.g., time-of-flight, orbitrap, Fourier transfer ion cyclotron resonance).38 For ETD all of these benefits are relevant. First, ETD is capable of dissociating large peptides and even whole proteins. During such an experiment several dozens or even hundreds of c- and z•-type ion fragments are generated; thus, the ability to start with largest precursor cation population is critical. For example, if you started with 10,000 precursor cations and divided that signal into 200 fragments, assuming all were in one charge state, you would have approximately 50 ions per fragment m/z bin. Now imagine starting with 100,000 precursor cations and doing the same experiment. You no longer have 50 ions per fragment m/z bin, but have 500 – a 10-fold improvement in signal. This means that linear ion traps, which offer 10–50-fold improvement in ion storage capacity over 3D systems, can allow for the direct analysis of large peptides and whole proteins in single scans, whereas 3D systems will often require spectral averaging to compensate for lower S/N spectra.
A second critical attribute that renders linear ion traps particularly useful for conducting ETD experiments is that anionic and cationic populations can be processed and stored separately until the reaction period is initiated. This is important for two reasons: (1) it affords control of reaction duration and (2) it allows for the subsequent reaction with an different type of anion. The Thermo Scientific LTQ XL ETD system, for example, has a linear ion trap that is divided into three separate sections. DC offsets to each section are controlled independently such that anion and cations can be moved from one to the other without interaction. This means that the isolated cation precursor can be stored and maintained separately while the opposite end of the device is being loaded with anionic reagents and during an anion purification step, if necessary. Then, when both populations are ready, the ion/ion reaction is allowed to commence. 3D systems are operated by first capturing and isolating the cation precursor and then filling with the reagent anion. The difference is that during the filling the anions that arrive first already start reacting with the precursor. Thus, there is no way to separate the filling and reacting time into discrete steps.
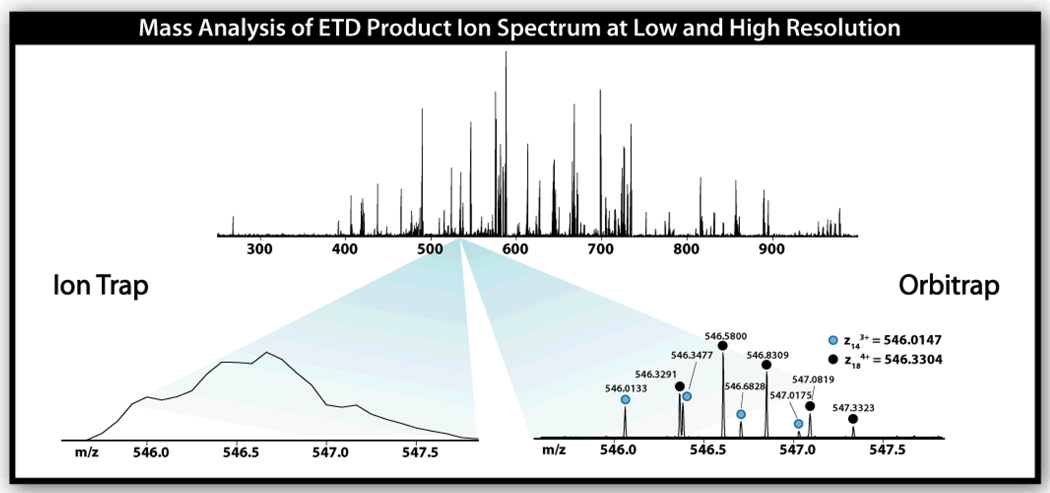
A final benefit enjoyed by linear ion trap systems is that they are easily coupled with a secondary mass analyzer, usually one that provides higher resolving power and mass accuracy. The first coupling of ETD with a hybrid system was described by McLuckey et al.36 There ETD product ions were mass analyzed in a downstream TOF analyzer. Since that time both linear ion trap Fourier transform ion cyclotron resonance mass spectrometry (FT-ICR-MS) and orbitrap hybrids have been modified to perform ETD.39–41 So far only the LTQ Orbitrap XL ETD hybrid (Figure 5) is commercially available, but I suspect the aforementioned systems will likewise come to market in the near future. Figure 6 displays ETD product ion spectra of a 24 residue peptide that were acquired either with a linear ion trap or on an orbitrap analyzer. From the inset it is obvious that the resolving power of the orbitrap can be highly advantageous for assignment of spectra from even modest sized peptides. And, as I discuss below, the benefit of coupling ETD with such an analyzer goes well beyond spectral assignment.
Figure 6.
ETD product ion spectra following dissociation of a 24 residue peptide. Numerous c- and z•-type fragment ions are generated and detected. The insets display a small m/z region when analysis of these products was performed either with the ion trap or orbitrap. Here the mass resolution offered by the orbitrap allows for unambiguous identification of two closely spaced isotopic clusters of z•-type fragment ions. This figure was adapted from reference 40.
ETD for Shotgun Proteomics
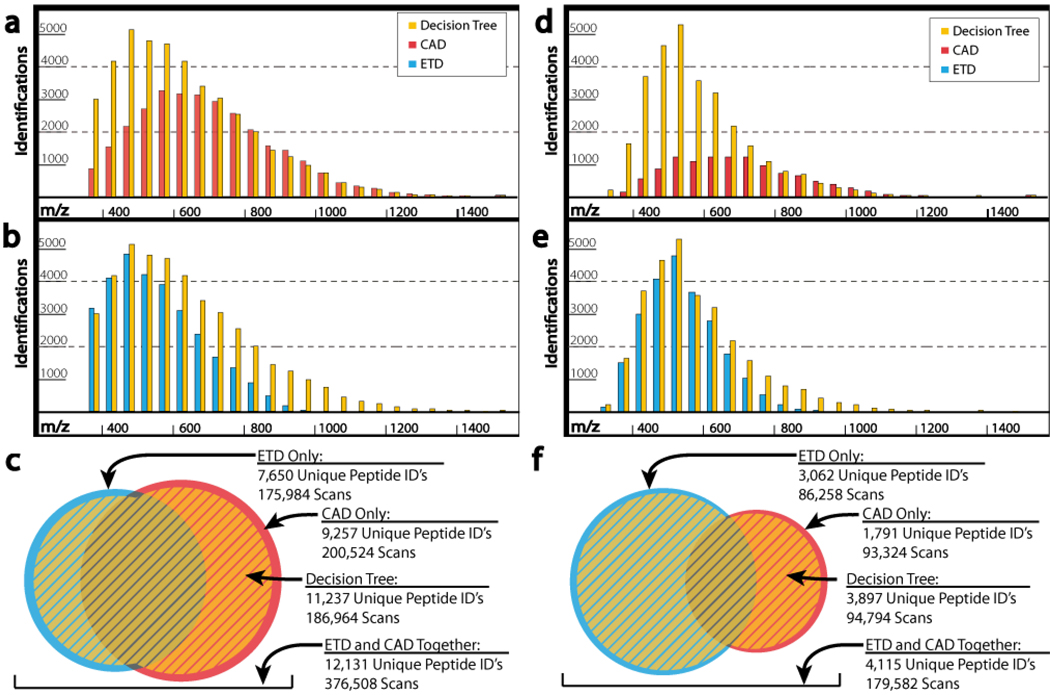
Shotgun proteomic experiments rely on enzymatic digestion of protein mixtures to create highly complex samples containing hundreds of thousands of peptides.42–44 These peptides are chromatographically separated and ultimately sampled by the mass spectrometer for MS/MS analysis. Given the exciting attributes of ETD, presented above, many proteomics groups are now seriously considering whether to invest in ETD-capable instrumentation. For those in search of PTMs the case for ETD is quite clear; but, what about for large-scale shotgun proteomics practitioners where the name of the game is identifying as many unique proteins as possible? This question was the subject of a recent large-scale study performed by my laboratory, which I summarize here.45 To test the impact of either CAD or ETD, peptides from a complex mixture of yeast were analyzed separately by each technique in triplicate. The results of these experiments are shown in Figure 7a–c. First we note that CAD identifies about 1,500 more peptides than ETD, but that overlap is minimal. Further, Figure 7a–b display that CAD has a preference for precursors with a higher m/z while ETD tracks toward lower ones. This trend has been well-documented and is discussed below.46, 47 Combination of one CAD and one ETD analysis, however, resulted in 7,842 unique peptide identifications, topping either duplicate CAD (7,359) or ETD (6,006) analyses (note the statistics shown in Figure 7a–c are the sum of triplicate results). These trends were maintained when a complex mixture of phosphopeptides was analyzed – Figure 7d–f. The major difference here is that ETD has a much higher success rate for these peptides and accounts for nearly twice as many unique identifications as CAD.
Figure 7.
Distribution of identified peptides using either the CAD (red), ETD (blue), or DT (yellow) methods. The grouping on the left (a–c) display the number of identified peptides for each method as a function of precursor m/z ratio for unmodified peptides (yeast) – while the grouping on the right (d–f) show the same for a phosphopeptide dataset. Panels c and f show the redundancy and complementary between the unique peptides identified during the CAD- and ETD-only analyses for the unmodified and PTM-containing datasets, respectively. The yellow area present in each indicates the coverage provided by the DT algorithm, which is > 90 % of that observed upon combination of the CAD- and ETD-only. This figure was adapted from reference 45.
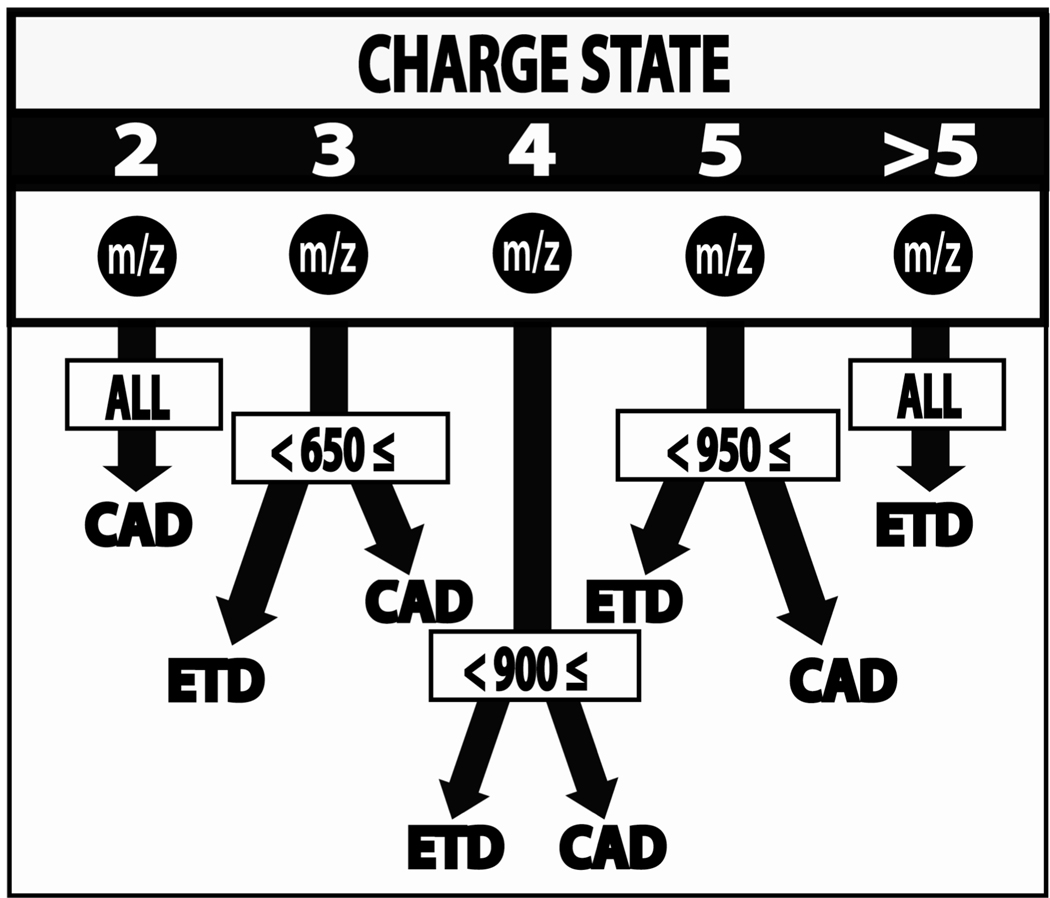
The tendencies of CAD and ETD to favor differing precursor m/z ranges does offer interesting opportunities. On the hybrid ETD-enabled orbitrap system, the high mass resolution offered by the orbitrap can change the game. Namely, precursor charge (z) and m/z ratios are known prior to MS/MS sampling so that only the dissociation method with the highest probability of success is applied. The method, called data-dependent decision tree (DT, Figure 8), was applied to the same yeast peptide and human phosphopeptide mixtures discussed above with excellent results. Implementation of the DT method netted 93% and 95% of the identifications harbored by separate CAD and ETD methods, respectively, and did so with half the sample in half the analysis time. Duplicate application of the DT method on the yeast peptides landed 8,939 unique peptide identifications vs. the 7,842 netted by sequential analysis by CAD and ETD, 7,359 by duplicate CAD, or 6,006 by duplicate ETD analysis. These data provide an exciting glimpse of the future – that yes, multiple dissociation methods are useful for all large-scale proteomic applications and that decisions of which method to apply can be tailored, in a automated-fashion, to each precursor.
Figure 8.
Schematic representation of the probabilistic decision tree (DT) algorithm. Note, m/z is the mass-to-charge ratio of the precursor selected for MS/MS interrogation.
ETD for Top-Down Proteomics
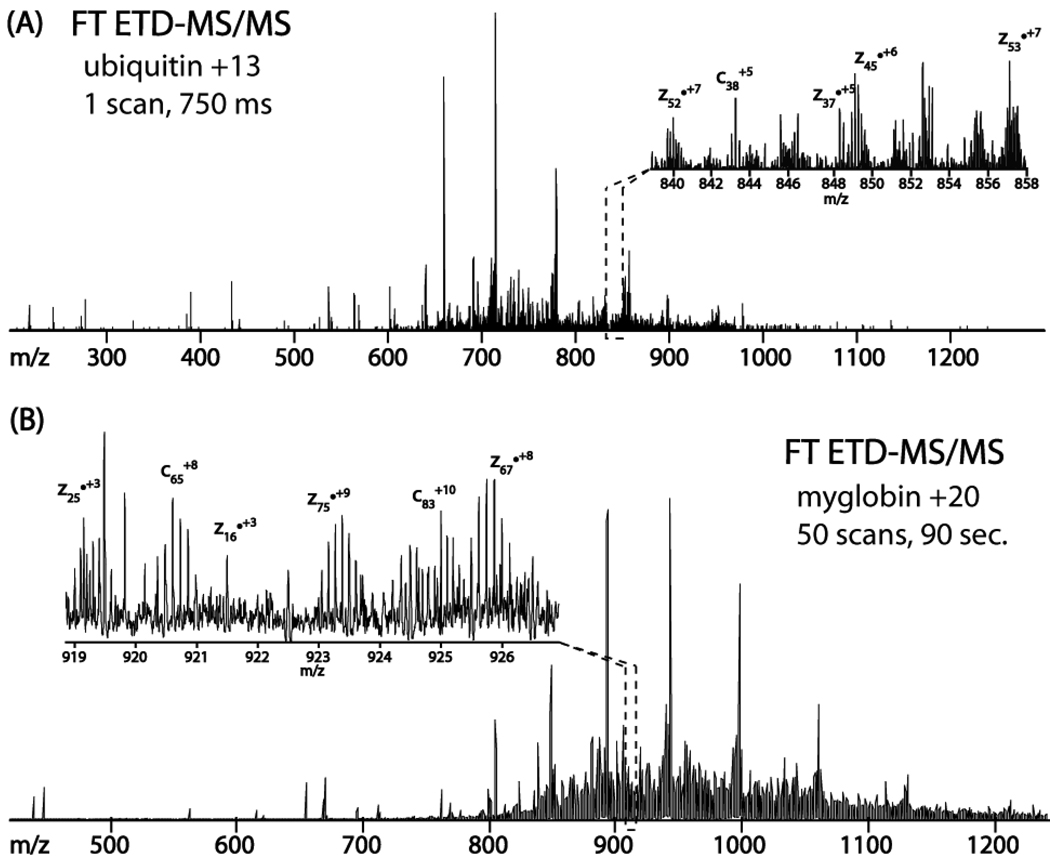
Top down sequencing, an emerging method of protein analysis, seeks to directly examine intact proteins by mass spectrometry.48–51 From an analytical perspective this concept is highly attractive, e.g., post-translational modifications can be examined within the context of one another and alternative splice variants can be discovered.52 Implementation, however, can be challenging as whole proteins are not as easily chromatographed as peptides. Likewise, tandem MS of intact protein cations is less straightforward than for peptides. Whole protein cations possess at least 10 fold more backbone bonds to dissociate and literally hundreds or thousands of different fragment ions to analyze. Ten years ago ECD provided a great boon for the top-down approach – mainly for its ability to randomly cleave bonds across the entire length of the small to modest sized proteins.53, 54 ETD too has been highly effective for directly dissociating large peptides and whole proteins.55 Figure 9 displays the direct dissociation of either intact ubiquitin or myoglobin via ETD followed by m/z analysis with an orbitrap mass analyzer.39 For ubiquitin 112 of 150 possible backbone bond cleavages were observed from this single scan spectrum, which took ∼ 750 ms to collect. Myoglobin, which is about twice the size of ubiquitin, required spectral averaging (50 sec). Still the resulting spectrum contained 127 of 304 possible cleavages.
Figure 9.
Panel A presents a FT ETD-MS/MS single scan spectrum of the ubiquitin +13 precursor (m/z 659). This spectrum was collected in 750 ms and harbored 112 of 150 possible backbone fragments to yield 88% sequence coverage. The +20 charge state of myoglobin, a 17 kDa protein, was subjected to ETD followed by orbitrap m/z analysis. Inspection of the spectra, fifty averaged scans, revealed 127 of 304 possible backbone fragments, translating to 55% sequence coverage. This figure was adapted from reference 39.
High resolution mass analysis is not required to identify the intact proteins following ETD dissociation. In fact, the high sensitivity of the ion trap mass analyzer can allow for the detection of proteins as large as 70 kDa in just a few seconds.55 The lower resolving power of the ion trap, however, can make spectral identification challenging. To settle this, the highly charged c- and z•-type fragments generated from whole protein dissociation via ETD can be deprotonated by a secondary reaction with a protron transfer anion. These sequential ion/ion reactions can be accomplished in just about 100 ms and produce very simple and straightforward ladder of fragment ion to interpret. Some very nice reports using low resolution mass spectrometers with ETD for whole protein analysis have recently been published.56, 57 Whether coupled with low or high resolution mass analysis, ETD stands to play an important role in the developing field of top-down protein analysis.
Informatics and Data Processing
Translating raw tandem mass spectra into peptide sequence is a formidable task – no matter what the dissociation method. The standard approach, pioneered by Yates and co-workers, relies on correlation of spectra to candidate sequences retrieved from protein sequence databases.58 This technology has spawned dozens of algorithms and is the basis for practically all high-throughput proteomic analysis. Each of these programs incorporates various models and methods for peak identification, peak scoring, and match probability assessment. But for all these differences they share a common theme – each was designed around the type of fragmentation observed in CAD. I raise this point to emphasize that virtually all ETD spectra have so far been analyzed by software that is not necessarily optimal. Whichever algorithm is used, SEQUEST, OMSSA, MASCOT, ProSight, etc., ETD compatibility currently means switching from analysis of b- and y-type ions to c- and z•-type. As of today virtually all ETD assessments are made based on the outputs of these programs – including those discussed here. As we move forward, I predict newer search engines built around ETD fragmentation patterns, rather than adapted from a CAD point-of-view, will further improve ETD performance.
The reduced performance displayed by ETD when applied to precursors of high m/z value is another area of informatic prospect. As precursor m/z value increases, there is a general shift toward non-dissociative electron transfer (ETnoD). This is why the decision tree discussed earlier is so effective – ETD and CAD have complementary performance across the broad range of observed precursor m/z values. Recently our laboratory reported on an automated method to gently activate (collisionally) the non-dissociative ET product ion.10 The method, coined ETcaD, is highly effective at inducing the formation of ETD fragments; however, those new fragments often experience H atom loss or gain. Specifically, c-type ions can lose a H atom to become c•-type while z•-type fragments gain the H atom to generate z-type. The net result is that c-type fragments can be as predicted or 1 Da lighter, while z•-type products are possibly 1 Da heavier. When all these ions were considered the mean sequence coverage for ETD went from ∼ 63% to ∼ 89% with ETcaD, which was even superior to CAD (∼ 77%). A problem, however, is that the database search algorithms we employed had difficulty with the 1 Da ambiguity of many newly generated fragment ions. I predict that with further development this search algorithm issue will likely be resolved and we can expect the ETcaD method to offer excellent performance across a very broad precursor m/z range.
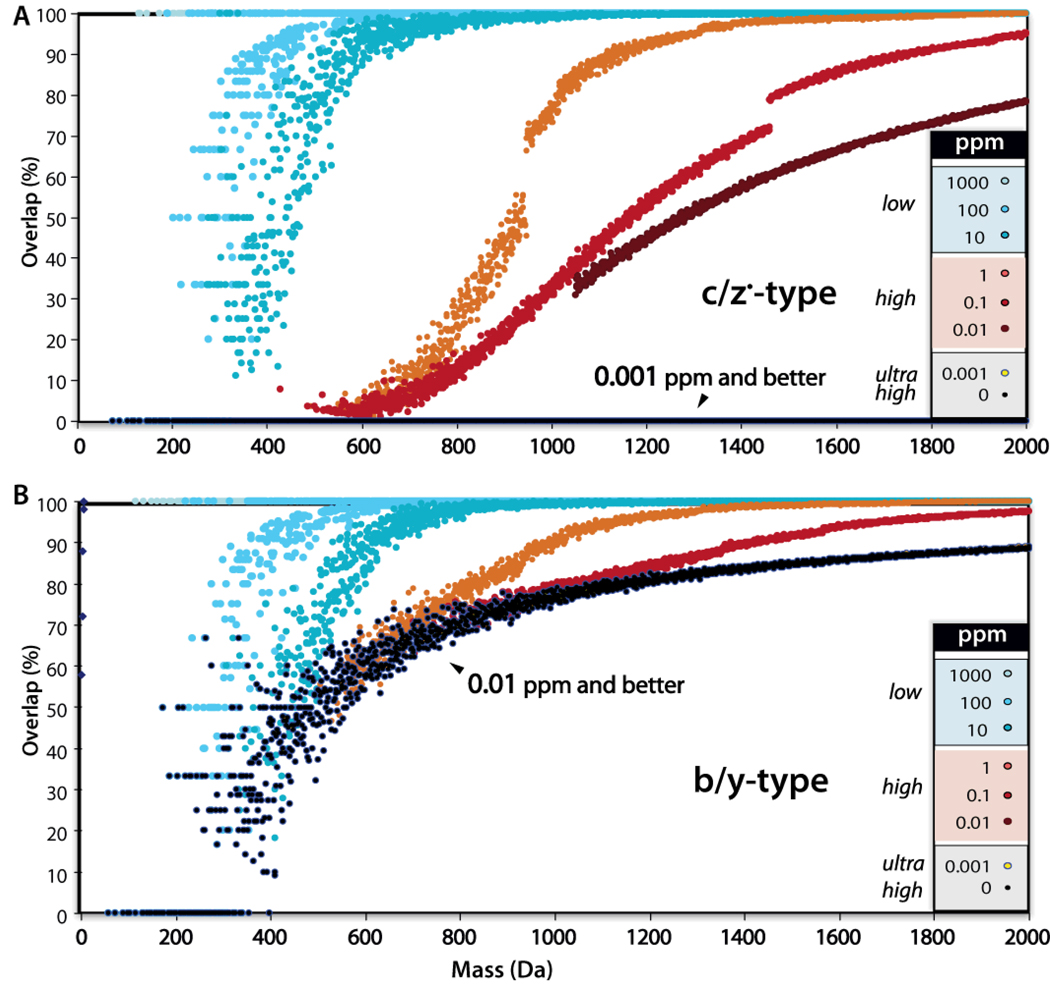
Just this past spring our laboratory reported on a unique feature of c- and z•-type ions that will indeed offer new informatic opportunities.14 Specifically, b-, c-, and y-type fragment ions contain an odd number of atoms with odd valence (e.g., N and H), while z•-type ions contain an even number of atoms with odd valence. We dubbed this phenomenon, an exension of Senior’s rule, the valence parity rule, which dictates that no c-type ion can have the same chemical composition, and by extension mass, as a z•-type ion.59 To illustrate the importance of this we asked how often do peptide fragment ions (all possible amino acid combinations) overlap if we could measure their masses with infinite accuracy (black curves in Figure 10). The result is striking. CAD products, even when measured with perfect accuracy, are often overlapping in m/z; however, the ETD products never have coinciding m/z values. At ∼ 1 ppm measurement accuracy, which is readily achieved on orbitrap and FT-ICR systems, the majority of ETD product ions < 1000 m/z can be readily identified as N- or C-terminal. The ability to easily identify fragment ion peaks by mass alone could be very powerful. These assignments can provide: (1) a method to directly determine amino acid composition, (2) an input for database search algorithms,60 or (3) a basis for de novo sequence analysis.
Figure 10.
Comparative analysis of ambiguity in complementary ion pairs at various mass accuracies. These data demonstrate that with perfect mass accuracy b- and y-type ions often overlap and cannot be distinguished by mass alone; however, c- and z•-type fragment ions are always distinguished with perfect accuracy and even at 1 ppm the majority of peaks below 1000 Da can be assigned an ion type. This figure was adapted from reference 14.
Summary and Outlook
The question posed in the title of this article, “Collisions or Electrons?”, can be answered with one word – yes. A revised version should read, “Collisions and Electrons: Protein Sequence Analysis in the 21st Century“.61 And, with recent commercial development, researchers around the globe are now evaluating ETD for a variety of applications. An exciting outcome of this work is that ETD shows exceptionally strong performance when applied to specific categories of peptides – e.g., PTM-containing, basic, large, etc. These strengths dovetail with weaknesses of CAD that have long limited the methodology and applications amenable to MS-based proteomics. As time passes I predict practitioners of shotgun experiments will rely less heavily on trypsin with favor directed toward proteases who generate larger portions of protein. Such proteases will of course still produce short fragments, perfect for CAD-based sequencing, and larger ones for ETD. Complex mixtures will be less complex, and PTM motifs and patterns will be more readily detected. Dynamic range should likewise improve as the mass spectrometer scan time needed to sequence a 30 residue peptide is equivalent to that of a 10 residue one. In other words, if there are fewer peptides to sequence (because the pieces are longer) the mass spectrometer will have more time to sample lower abundance precursors.
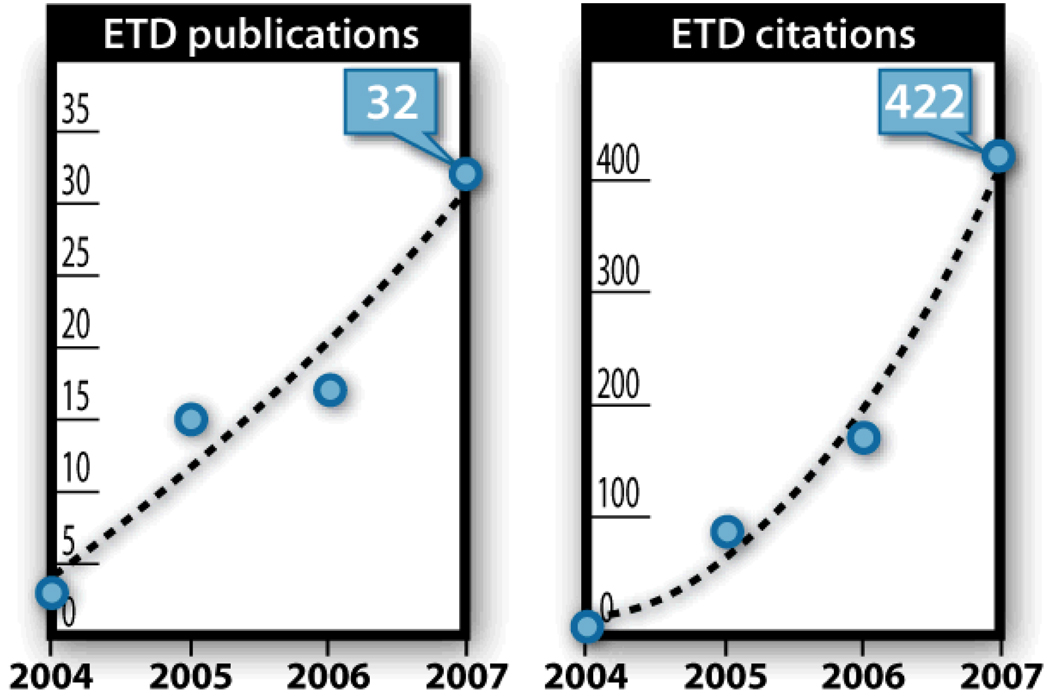
The commercial availability of ETD-enabled hybrid mass spectrometers should continue to expand. The high resolution afforded by these systems enable DT logic that automatically tailors dissociation method to precursor prior to activation. In this way the user need neither a detailed knowledge of peptide fragmentation nor toggle between ETD and CAD on each sample. Bioinformatic opportunities abound for ETD datasets and I anticipate algorithmic innovation over the next several years will result in improvement of ETD performance even further. These advances are likely to touch on all aspects of ETD application. Sequence tag and de novo sequence determination will become much more tractable – both because ETD spectra tend to be rich in information and because of the valence parity rule that allows the separation of c- and z•-type products. Figure 11displays the number of publications employing ETD and the references to those papers over the past few years. Clearly the technique is on the rise and will continue an upward trend. Recognition and pursuit, by the proteomics community, of the limitations and opportunities that ETD affords will determine the rate at which this expansion continues.
Figure 11.
The number of peer-reviewed publications on the subject of ETD (left) and the number of citations garnered by those papers (right).
ACKNOWLEDGEMENTS
I am grateful to my young, energetic, and hardworking group at the University of Wisconsin – David Good, Graeme McAlister, Danielle Swaney, Justin Brumbaugh, Doug Phanstiel, Aaron Ledvina, Jason Russell, Nicole Beauchene, Violet Lee, Amelia Peterson, Craig Wenger, Qiangwei Xia, Paul Grimsrud, and Heather Coon. I thank the University of Wisconsin, the Beckman Foundation, Eli Lilly, the American Society for Mass Spectrometry, Thermo Scientific, the NIH (R01 GM080148 and P01 GM081629), and the NSF (0747990 and 0701846) for financial support of my laboratory.
REFERENCES
- 1.McLafferty FW, Venktaraghavan R, Irving P. Biochemical and Biophysical Research Communications. 1970;39 doi: 10.1016/0006-291x(70)90789-8. [DOI] [PubMed] [Google Scholar]
- 2.Wipf HK, Irving P, McCamish M, Venkataraghavan R, McLafferty FW. Journal of the American Chemical Society. 1973;95 doi: 10.1021/ja00791a048. [DOI] [PubMed] [Google Scholar]
- 3.Hunt DF, Yates JR, Shabanowitz J, Winston S, Hauer CR. Proceedings of the National Academy of Sciences of the United States of America. 1986;83:6233–6237. doi: 10.1073/pnas.83.17.6233. [DOI] [PMC free article] [PubMed] [Google Scholar]
- 4.Zubarev RA, Kelleher NL, McLafferty FW. Journal of the American Chemical Society. 1998;120:3265–3266. [Google Scholar]
- 5.Kruger NA, Zubarev RA, Horn DM, McLafferty FW. International Journal of Mass Spectrometry. 1999;187:787–793. [Google Scholar]
- 6.Kelleher RL, Zubarev RA, Bush K, Furie B, Furie BC, McLafferty FW, Walsh CT. Analytical Chemistry. 1999;71:4250–4253. doi: 10.1021/ac990684x. [DOI] [PubMed] [Google Scholar]
- 7.McLafferty FW, Horn DM, Breuker K, Ge Y, Lewis MA, Cerda B, Zubarev RA, Carpenter BK. Journal of the American Society for Mass Spectrometry. 2001;12:245–249. doi: 10.1016/S1044-0305(00)00223-3. [DOI] [PubMed] [Google Scholar]
- 8.Coon JJ, Syka JEP, Schwartz JC, Shabanowitz J, Hunt DF. International Journal of Mass Spectrometry. 2004;236:33–42. [Google Scholar]
- 9.Syka JEP, Coon JJ, Schroeder MJ, Shabanowitz J, Hunt DF. Proceedings of the National Academy of Sciences of the United States of America. 2004;101:9528–9533. doi: 10.1073/pnas.0402700101. [DOI] [PMC free article] [PubMed] [Google Scholar]
- 10.Swaney DL, McAlister GC, Wirtala M, Schwartz JC, Syka JEP, Coon JJ. Analytical Chemistry. 2007;79:477–485. doi: 10.1021/ac061457f. [DOI] [PMC free article] [PubMed] [Google Scholar]
- 11.Hartmer R, Lubeck M. Lc Gc Europe. 2005:11–13. [Google Scholar]
- 12.Molina H, Horn DM, Tang N, Mathivanan S, Pandey A. Proceedings of the National Academy of Sciences of the United States of America. 2007;104:2199–2204. doi: 10.1073/pnas.0611217104. [DOI] [PMC free article] [PubMed] [Google Scholar]
- 13.Coon JJ, Syka JE, Shabanowitz J, Hunt DF. Biotechniques. 2005;38 doi: 10.2144/05384TE01. 519, 521, 523. [DOI] [PubMed] [Google Scholar]
- 14.Hubler SL, Jue A, Keith J, McAlister GC, Craciun G, Coon JJ. Journal of the American Chemical Society. 2008;130:6388–6394. doi: 10.1021/ja7099985. [DOI] [PMC free article] [PubMed] [Google Scholar]
- 15.Wysocki VH, Tsaprailis G, Smith LL, Breci LA. Journal of Mass Spectrometry. 2000;35:1399–1406. doi: 10.1002/1096-9888(200012)35:12<1399::AID-JMS86>3.0.CO;2-R. [DOI] [PubMed] [Google Scholar]
- 16.Dongre AR, Jones JL, Somogyi A, Wysocki VH. Journal of the American Chemical Society. 1996;118:8365–8374. [Google Scholar]
- 17.Schroeder MJ, Shabanowitz J, Schwartz JC, Hunt DF, Coon JJ. Analytical Chemistry. 2004;76:3590–3598. doi: 10.1021/ac0497104. [DOI] [PubMed] [Google Scholar]
- 18.DeGnore JP, Qin J. Journal of the American Society for Mass Spectrometry. 1998;9:1175–1188. doi: 10.1016/S1044-0305(98)00088-9. [DOI] [PubMed] [Google Scholar]
- 19.Chi A, Huttenhower C, Geer LY, Coon JJ, Syka JE, Bai DL, Shabanowitz J, Burke DJ, Troyanskaya OG, Hunt DF. Proc Natl Acad Sci U S A. 2007;104:2193–2198. doi: 10.1073/pnas.0607084104. [DOI] [PMC free article] [PubMed] [Google Scholar]
- 20.Khidekel N, Ficarro SB, Clark PM, Bryan MC, Swaney DL, Rexach JE, Sun Y, Coon JJ, Peters EC, Hsieh-Wilson LC. Nature Chemical Biology. 2007;3:339–348. doi: 10.1038/nchembio881. [DOI] [PubMed] [Google Scholar]
- 21.Lecchi S, Nelson CJ, Allen KE, Swaney DL, Thompson KL, Coon JJ, Sussman MR, Slayman CW. J Biol Chem. 2007;282:35471–35481. doi: 10.1074/jbc.M706094200. [DOI] [PubMed] [Google Scholar]
- 22.Zhang QB, Frolov A, Tang N, Hoffmann R, van de Goor T, Metz TO, Smith RD. Rapid Communications in Mass Spectrometry. 2007;21:661–666. doi: 10.1002/rcm.2884. [DOI] [PMC free article] [PubMed] [Google Scholar]
- 23.Wu SL, Huehmer AFR, Hao ZQ, Karger BL. Journal of Proteome Research. 2007;6:4230–4244. doi: 10.1021/pr070313u. [DOI] [PMC free article] [PubMed] [Google Scholar]
- 24.Twine SM, Paul CJ, Vinogradov E, McNally DJ, Brisson JR, Mullen JA, McMullin DR, Jarrell HC, Austin JW, Kelly JF, Logan SM. Febs Journal. 2008;275:4428–4444. doi: 10.1111/j.1742-4658.2008.06589.x. [DOI] [PubMed] [Google Scholar]
- 25.Taverna SD, Ueberheide BM, Liu YF, Tackett AJ, Diaz RL, Shabanowitz J, Chait BT, Hunt DF, Allis CD. Proceedings of the National Academy of Sciences of the United States of America. 2007;104:2086–2091. doi: 10.1073/pnas.0610993104. [DOI] [PMC free article] [PubMed] [Google Scholar]
- 26.Taouatas N, Drugan MM, Heck AJR, Mohammed S. Nature Methods. 2008;5:405–407. doi: 10.1038/nmeth.1204. [DOI] [PubMed] [Google Scholar]
- 27.Mohammed S, Lorenzen K, Kerkhoven R, van Breukelen B, Vannini A, Cramer P, Heck AJR. Analytical Chemistry. 2008;80:3584–3592. doi: 10.1021/ac7024283. [DOI] [PubMed] [Google Scholar]
- 28.Medzihradszky KF, Guan S, Maltby DA, Burlingame AL. Journal of the American Society for Mass Spectrometry. 2007;18:1617–1624. doi: 10.1016/j.jasms.2007.06.002. [DOI] [PubMed] [Google Scholar]
- 29.Mayhew MW, Jeffery ED, Sherman NE, Nelson K, Polefrone JM, Pratt SJ, Shabanowitz J, Parsons JT, Fox JW, Hunt DF, Horwitz AF. Journal of Cell Science. 2007;120:3911–3918. doi: 10.1242/jcs.008177. [DOI] [PMC free article] [PubMed] [Google Scholar]
- 30.Han H, Xia Y, Yang M, McLuckey SA. Analytical Chemistry. 2008;80:3492–3497. doi: 10.1021/ac7022734. [DOI] [PMC free article] [PubMed] [Google Scholar]
- 31.Gunawardena HP, Gorenstein L, Erickson DE, Xia Y, McLuckey SA. International Journal of Mass Spectrometry. 2007;265:130–138. [Google Scholar]
- 32.Chen T, Muratore TL, Schaner-Tooley CE, Shabanowitz J, Hunt DF, Macara IG. Nature Cell Biology. 2007;9 doi: 10.1038/ncb1572. 596-U203. [DOI] [PMC free article] [PubMed] [Google Scholar]
- 33.Catalina MI, Koeleman CAM, Deelder AM, Wuhrer M. Rapid Communications in Mass Spectrometry. 2007;21:1053–1061. doi: 10.1002/rcm.2929. [DOI] [PubMed] [Google Scholar]
- 34.Pitteri SJ, Chrisman PA, Hogan JM, McLuckey SA. Analytical Chemistry. 2005;77:1831–1839. doi: 10.1021/ac0483872. [DOI] [PMC free article] [PubMed] [Google Scholar]
- 35.Liang XR, Xia Y, McLuckey SA. Analytical Chemistry. 2006;78:3208–3212. doi: 10.1021/ac052288m. [DOI] [PMC free article] [PubMed] [Google Scholar]
- 36.Xia Y, Chrisman PA, Erickson DE, Liu J, Liang XR, Londry FA, Yang MJ, McLuckey SA. Analytical Chemistry. 2006;78:4146–4154. doi: 10.1021/ac0606296. [DOI] [PMC free article] [PubMed] [Google Scholar]
- 37.Xia Y, Liang XR, McLuckey SA. Journal of the American Society for Mass Spectrometry. 2005;16:1750–1756. doi: 10.1016/j.jasms.2005.07.013. [DOI] [PubMed] [Google Scholar]
- 38.Schwartz JC, Senko MW, Syka JEP. Journal of the American Society for Mass Spectrometry. 2002;13:659–669. doi: 10.1016/S1044-0305(02)00384-7. [DOI] [PubMed] [Google Scholar]
- 39.McAlister GC, Berggren WT, Griep-Raming J, Horning S, Makarov A, Phanstiel D, Stafford G, Swaney DL, Syka JEP, Zabrouskov V, Coon JJ. Journal of Proteome Research. 2008;7:3127–3136. doi: 10.1021/pr800264t. [DOI] [PMC free article] [PubMed] [Google Scholar]
- 40.McAlister GC, Phanstiel D, Good DM, Berggren WT, Coon JJ. Analytical Chemistry. 2007:3525–3534. doi: 10.1021/ac070020k. [DOI] [PMC free article] [PubMed] [Google Scholar]
- 41.Kaplan DA, Hartmer R, Speir JP, Stoermer C, Gumerov D, Easterling ML, Brekenfeld A, Kim T, Laukien F, Park MA. Rapid Communications in Mass Spectrometry. 2008;22:271–278. doi: 10.1002/rcm.3356. [DOI] [PubMed] [Google Scholar]
- 42.MacCoss MJ, McDonald WH, Saraf A, Sadygov R, Clark JM, Tasto JJ, Gould KL, Wolters D, Washburn M, Weiss A, Clark JI, Yates JR. Proceedings of the National Academy of Sciences of the United States of America. 2002;99:7900–7905. doi: 10.1073/pnas.122231399. [DOI] [PMC free article] [PubMed] [Google Scholar]
- 43.Wolters DA, Washburn MP, Yates JR. Analytical Chemistry. 2001;73:5683–5690. doi: 10.1021/ac010617e. [DOI] [PubMed] [Google Scholar]
- 44.Washburn MP, Wolters D, Yates JR. Nature Biotechnology. 2001;19:242–247. doi: 10.1038/85686. [DOI] [PubMed] [Google Scholar]
- 45.Swaney DL, McAlister GC, Coon JJ. Nature Methods. 2008;5:959–964. doi: 10.1038/nmeth.1260. [DOI] [PMC free article] [PubMed] [Google Scholar]
- 46.Good DM, Wirtala M, McAlister GC, Coon JJ. Mol Cell Proteomics. 2007 doi: 10.1074/mcp.M700073-MCP200. [DOI] [PubMed] [Google Scholar]
- 47.Molina H, Matthiesen R, Kandasamy K, Pandey A. Analytical Chemistry. 2008;80:4825–4835. doi: 10.1021/ac8007785. [DOI] [PMC free article] [PubMed] [Google Scholar]
- 48.Loo JA, Edmonds CG, Smith RD. Science. 1990;248:201–204. doi: 10.1126/science.2326633. [DOI] [PubMed] [Google Scholar]
- 49.Breuker K, Jin M, Han XM, Jiang HH, McLafferty FW. Journal of the American Society for Mass Spectrometry. 2008;19:1045–1053. doi: 10.1016/j.jasms.2008.05.013. [DOI] [PMC free article] [PubMed] [Google Scholar]
- 50.Han XM, Jin M, Breuker K, McLafferty FW. Science. 2006;314:109–112. doi: 10.1126/science.1128868. [DOI] [PubMed] [Google Scholar]
- 51.Kelleher NL. Analytical Chemistry. 2004;76:196A–203A. [PubMed] [Google Scholar]
- 52.Good DM, Coon JJ. Biotechniques. 2006;40:783–789. doi: 10.2144/000112194. [DOI] [PubMed] [Google Scholar]
- 53.Zubarev RA, Horn DM, Fridriksson EK, Kelleher NL, Kruger NA, Lewis MA, Carpenter BK, McLafferty FW. Analytical Chemistry. 2000;72:563–573. doi: 10.1021/ac990811p. [DOI] [PubMed] [Google Scholar]
- 54.Kruger NA, Zubarev RA, Carpenter BK, Kelleher NL, Horn DM, McLafferty FW. International Journal of Mass Spectrometry. 1999;183:1–5. [Google Scholar]
- 55.Coon JJ, Ueberheide B, Syka JEP, Dryhurst DD, Ausio J, Shabanowitz J, Hunt DF. Proceedings of the National Academy of Sciences of the United States of America. 2005;102:9463–9468. doi: 10.1073/pnas.0503189102. [DOI] [PMC free article] [PubMed] [Google Scholar]
- 56.Chi A, Bai DL, Geer LY, Shabanowitz J, Hunt DF. International Journal of Mass Spectrometry. 2007;259:197–203. doi: 10.1016/j.ijms.2006.09.030. [DOI] [PMC free article] [PubMed] [Google Scholar]
- 57.Bunger MK, Cargile BJ, Ngunjiri A, Bundy JL, Stephenson JL. Analytical Chemistry. 2008;80:1459–1467. doi: 10.1021/ac7018409. [DOI] [PubMed] [Google Scholar]
- 58.Eng JK, Mccormack AL, Yates JR. Journal of the American Society for Mass Spectrometry. 1994;5:976–989. doi: 10.1016/1044-0305(94)80016-2. [DOI] [PubMed] [Google Scholar]
- 59.Senior JK. American Journal of Mathematics. 1951;73:663–689. [Google Scholar]
- 60.Liu J, Liang XR, McLuckey SA. Journal of Proteome Research. 2008;7:130–137. doi: 10.1021/pr0703977. [DOI] [PubMed] [Google Scholar]
- 61.Zubarev RA, Zubarev AR, Savitski MM. Journal of the American Society for Mass Spectrometry. 2008;19:753–761. doi: 10.1016/j.jasms.2008.03.007. [DOI] [PubMed] [Google Scholar]


