

Abstract
Ribonuclease P (RNase P) is a ribonucleoprotein complex that catalyzes the 5′ maturation of precursor tRNAs. To investigate the mechanism of substrate recognition in this enzyme, we characterize the thermodynamics and kinetics of Bacillus subtilis pre-tRNAAsp binding to B. subtilis RNase P holoenzyme using fluorescence techniques. Time courses for fluorescein-labeled pre-tRNA binding to RNase P are biphasic in the presence of both Ca(II) and Mg(II), requiring a minimal two-step association mechanism. In the first step, the apparent bimolecular rate constant for pre-tRNA associating with RNase P has a value that is near the diffusion limit and is independent of the length of the pre-tRNA leader. Following formation of the initial enzyme–substrate complex, a unimolecular step enhances the overall affinity of pre-tRNA by eight- to 300-fold as the length of the leader sequence increases from 2 to 5 nucleotides. This increase in affinity is due to a decrease in the reverse rate constant for the conformational change that correlates with the formation of an optimal leader–protein interaction in the RNase P holoenzyme–pre-tRNA complex. Furthermore, the forward rate constant for the conformational change becomes rate limiting for cleavage under single-turnover conditions at high pH, explaining the origin of the observed apparent pKa in the RNase P-catalyzed cleavage reaction. These data suggest that a conformational change in the RNase P•pre-tRNA complex is coupled to the interactions between the 5′ leader and P protein and aligns essential functional groups at the cleavage active site to enhance efficient cleavage of pre-tRNA.
Keywords: mechanism, ribonuclease P, transient kinetics
INTRODUCTION
RNase P is an endonuclease that catalyzes the 5′ maturation of precursor tRNA (pre-tRNA), an essential step in tRNA biosynthesis in all domains of life (Evans et al. 2006; Walker and Engelke 2006). In addition to pre-tRNA, bacterial RNase P catalyzes cleavage of a number of other substrates, including pre-4.5S RNA, pre-tmRNA, and various riboswitches (Peck-Miller and Altman 1991; Komine et al. 1994; Li et al. 2003; Haebel et al. 2004; Altman et al. 2005; Seif and Altman 2008). Furthermore, RNase P-catalyzed cleavage has also been suggested to play a role in mRNA degradation and regulation of gene expression in vivo (Li and Altman 2003; Li et al. 2003). In most organisms, RNase P consists of a catalytically active RNA subunit (PRNA) associated with one or more protein cofactors (P proteins) essential for in vivo activity (Hall and Brown 2002; Jarrous 2002; Hsieh et al. 2004; Evans et al. 2006; Walker and Engelke 2006; Gopalan 2007; Jarrous and Reiner 2007). Given the essential and universal role of this enzyme, it is fundamentally important to understand the mechanisms of molecular recognition and catalysis used by RNase P.
Bacterial RNase P is an ideal model system for mechanistic studies of ribonucleoproteins because of its structural simplicity and robust activity that allows facile reconstitution of the subunits. Unlike its eukaryotic counterparts, bacterial RNase P consists of a large PRNA (∼400 nucleotides [nt]) and a single small protein subunit (∼120 amino acids). High-resolution crystallographic structures of full-length bacterial PRNA from Thermotoga maritima and Bacillis stearothermophilus have been solved, in which the core structure of PRNA is formed by coaxially stacked helices and stabilized by long-distance interactions between interhelical regions (Kazantsev et al. 2005; Torres-Larios et al. 2005). Bacterial RNase P is not an obligate ribonucleoprotein enzyme, as bacterial PRNA alone can recognize, bind, and cleave pre-tRNA in vitro in the presence of high monovalent salt and divalent metal ions (Guerrier-Takada et al. 1983; Smith et al. 1992; Smith and Pace 1993; Kurz and Fierke 2002). However, the protein component enhances the activity of RNase P such that efficient cleavage occurs under physiological conditions (Reich et al. 1988; Kurz et al. 1998; Li and Altman 2003; Li et al. 2003). In contrast, archeal and eukaryal PRNA's exhibit low activity in the absence of the protein components (Pannucci et al. 1999; Kikovska et al. 2007). Comparative sequence analysis, site-directed mutagenesis, and phosphorothioate-substitution experiments suggest that the highly conserved helix P4 is critical for catalytic activity, but the exact location of functional groups that comprise the ribozyme active site remains undefined (Waugh and Pace 1993; Haas et al. 1994; Pace and Brown 1995; Christian et al. 2000; Christian et al. 2002; Crary et al. 2002). RNase P is proposed to catalyze the phosphodiester bond cleavage using a metal-hydroxide as the nucleophile (Cassano et al. 2004), although the kinetic and mechanistic details of this reaction are still under investigation.
While the P protein subunit is not essential for the endonucleolytic activity of RNase P, this subunit plays multiple roles in RNase P, including: enhancing PRNA folding (Buck et al. 2005a) and pre-tRNA turnover (Kurz et al. 1998; Buck et al. 2005a; Sun et al. 2006), increasing the affinities of both pre-tRNA and catalytically important divalent metal ions (Reich et al. 1988; Crary et al. 1998; Kurz et al. 1998; Buck et al. 2005a,b; Sun et al. 2006), and contributing to substrate-specific recognition (Sun et al. 2006). In addition, the P protein binds in close proximity (within 10–15 Å) to the P4 helix of PRNA, the putative active site, and to the cleavage site of pre-tRNA, as indicated by affinity cleavage and fluorescence experiments in the RNase P holoenzyme (Tsai et al. 2003; Rueda et al. 2005, 2007). These data indicate that the active site of RNase P is situated at or near the interface between the P protein and PRNA subunits (Niranjanakumari et al. 1998b; Niranjanakumari et al. 2007).
A thorough kinetic characterization has been performed for the B. subtilis PRNA-catalyzed cleavage of pre-tRNA (Beebe and Fierke 1994). This mechanism includes rapid and essentially irreversible binding of pre-tRNA and subsequent irreversible cleavage of the bound pre-tRNA, followed by rapid release of the 5′ RNA fragment and slow dissociation of tRNA (Beebe and Fierke 1994). Lowering the pH and substituting calcium for magnesium decreases the apparent rate constant for cleavage, such that pre-tRNA dissociation is faster than cleavage, simplifying the kinetic analysis (for reviews, see Hsieh et al. 2004; Koutmou et al. 2009). However, the kinetic mechanism of the RNase P holoenzyme-catalyzed cleavage has not been thoroughly characterized. A simplified kinetic scheme consisting of rapid substrate association and rapid substrate cleavage, followed by slow product release (Scheme 1) has been used to analyze the kinetics of this enzyme. Turnover kinetics of modified pre-tRNA substrates and structure-probing studies have led the Pan and Harris laboratories to suggest that the P protein promotes a conformational step before cleavage that involves positioning the active site for efficient catalytic activity (Loria and Pan 1998, 1999; Zahler et al. 2005; Sun et al. 2006). However, no direct kinetic observation of such a conformational change in the holoenzyme during catalysis has been reported.
SCHEME 1.

Minimal kinetic mechanism for RNase P.
To test whether a conformation change step is kinetically observable, we have characterized the kinetic mechanism for binding pre-tRNA to RNase P holoenzyme using fluorescence stopped-flow techniques. Analyses of both binding affinity and kinetic data are consistent with a two-step binding mechanism: RNase P and pre-tRNA initially associate to form a complex in a near diffusion-limited process, which is followed by a unimolecular reaction that we interpret as a conformational change in the enzyme•substrate (E•S) complex. At high pH, this conformational change limits the rate of the single-turnover cleavage kinetics catalyzed by RNase P, explaining the origin of the observed apparent ionization in this reaction. This conformational change enhances the affinity of pre-tRNA and likely includes formation of specific interactions between the pre-tRNA leader and the P protein in the RNase P•pre-tRNA complex. Furthermore, this conformational change is proposed to reorganize the active site of RNase P, enhancing the efficiency and fidelity of cleavage.
RESULTS
Binding affinity of RNase P for fluorescein-labeled pre-tRNA
To characterize the binding properties of RNase P using fluorescent methods, we labeled the pre-tRNA substrate with fluorescein via a 5′-thiophosphate linkage (Rueda et al. 2005). Measurements of binding affinity were carried out under conditions where the apparent cleavage rate constant is <1 × 10⁻⁵ sec−1 (t1/2 > 26 h), substituting Ca(II) for Mg(II) and lowering the pH to 6.0 (Smith et al. 1992; Kurz et al. 1998; Kurz and Fierke 2000). Under these conditions, the equilibrium association of 5′-fluorescein labeled pre-tRNA (Fl-pre-tRNA) with RNase P can be monitored by an increase in fluorescence intensity as the concentration of RNase P varies (Fig. 1).
FIGURE 1.

Binding affinities of RNase P for fluorescein-labeled pre-tRNAAsp. (A) Binding stoichiometry of RNase P and pre-tRNA. 5′-fluorescein-labeled pre-tRNAAsp with a 5-nucleotide leader (20, circle; 50, square; and 100 nM, triangle) was titrated with RNase P (from 0.2 nM to 0.5 μM) in buffer A. The holoenzyme–substrate complex formation is monitored by changes in fluorescence (λex = 488nm; λem = 524 nm; slit width = 5 nm). (B) Fluorescence titration of fluorescein-labeled pre-tRNA with RNase P. 5′-fluorescein-labeled pre-tRNAAsp with a 5-nucleotide leader (1, circle; 2, square; and 3 nM, triangle) was titrated with RNase P (from 0.2 nM to 0.5 μM) in buffer A. The observed fluorescence intensity is normalized to that of the free substrate (see Materials and Methods). The solid lines are the best global nonlinear fits of these titration data to a 1:1 binding model (Scheme 1), yielding an apparent association constant of (2.6 ± 0.1) × 109 M−1. (C) Binding affinity of pre-tRNA as a function of the leader length. The association constant for 5′-Fl-pre-tRNA with varying leader lengths was determined in buffer A at 25°C (triangle) and in buffer B at 37°C (square). For comparison, the affinity of RNase P for 32P-labeled pre-tRNA determined in buffer B at 37°C using spin–column separation techniques, taken from (Crary et al. 1998), is shown using a dashed line.
To validate this method for assaying pre-tRNA binding, we measured the binding stoichiometry and binding affinity of B. subtilis Fl-pre-tRNA with a 6-nt leader (5 nt plus fluorescein as a nucleotide analog) by assaying the fluorescence of the labeled substrate at varied concentrations of RNase P. At the high concentrations of substrate necessary for stoichiometric binding conditions ([Fl-pre-tRNA] = 50–250 × KA−1), the fluorescence increases linearly as a function of the RNase P concentration until the concentration equals that of pre-tRNA (Fig. 1A). This indicates that the binding stoichiometry of RNase P to pre-tRNA is 1:1. To measure the binding affinity, we repeated these titrations using concentrations of Fl-pre-tRNA comparable to the binding affinity (KA−1). An equation describing a simple 1:1 binding scheme that includes calculation of the free concentration of RNase P (see Equation 5 below) was globally fit to the fluorescence titration data, yielding an apparent binding association constant (KA) of (2.6 ± 0.1) × 109 M−1 (Fig. 1B). Using this approach, the affinity of RNase P for 5′ Fl-labeled pre-tRNA with leader lengths varying from 2 to 11 nt (counting fluorescein) was determined (Fig. 1C) in buffer A, including 10 mM CaCl2 (pH 6) at 25°C. For comparison purposes, these titrations were also carried out in the same conditions previously used to measure RNase P affinity for 32P-labeled pre-tRNA using gel filtration centrifuge columns (buffer B, including 10 mM CaCl2 [pH 6] at 37°C) (Fig. 1C, dashed line; Crary et al. 1998; Kurz et al. 1998). Both methods yield identical results when the substrate leader length is greater than 5 nt. However, there is a modest two- to fourfold increase in the binding affinity for Fl-pre-tRNA with total leader lengths of 3 or 4 nt, suggesting that fluorescein interacts slightly better with RNase P than a nucleobase at these positions (Fig. 1C). Therefore, fluorescein labeling has only a modest effect on the binding affinity of pre-tRNA and this fluorescent titration method should be useful for rapidly measuring the affinity of RNase P for a wide variety of substrates.
5′ Fl-pre-tRNA binds to RNase P using a two-step mechanism
The association kinetics for substrates binding to RNase P were determined from the time-dependent changes in the fluorescence intensity upon mixing Fl-pre-tRNA with RNase P holoenzyme under pseudo-first-order conditions ([RNase P] > [5′-Fl pre-tRNA]). To evaluate the effect of the length of the leader on the association kinetics, we measured the apparent association rate constant as a function of RNase P concentration for a series of pre-tRNA substrates in buffer A, including 10 mM CaCl2 (pH 6) at 25°C (Fig. 2). At all concentrations of RNase P, two distinct kinetic phases are observed in the fluorescence time courses that are well described by the sum of two exponentials, yielding two observed rate constants, kobs,1 and kobs,2, for the fast and the slow phases, respectively. The observation of double exponential binding traces indicates that a minimum of two steps occur in the binding pathway.
FIGURE 2.

Stopped-flow kinetic studies of 5′ fluorescein pre-tRNA binding to RNase P. (A) Binding time courses of 5′-fluorescein pre-tRNA with 5-nt leader to RNase P. The binding reaction was initiated by mixing 5′ fluorescein-labeled pre-tRNA with a 5 nt (25 nM) with RNase P (0.1, 0.3, 0.5, and 1 μM) in a stopped-flow apparatus in buffer A at 25°C and monitoring the fluorescence (λex = 488 nm; λem > 500 nm). The smooth curves superimposed on each time course are the best fits of the sum of two exponentials to the data with observed rate constants, kobs,1 and kobs,2. (B) Dependence of kobs,1 on [RNase P]. The linear least-squares fits to the dependence of kobs,1 on the concentration of RNase P yield a slope of (4.27 ± 0.03) × 106 M−1sec−1, and a y-intercept of 0.91 ± 0.01 sec−1. (C) Dependence of kobs,2 on [RNase P]. The value of kobs,2 shows a hyperbolic dependence on the concentration of RNase P. The smooth curve is the best fit of a simple hyperbola to the data; kobs,2 reaches a plateau value of 0.43 ± 0.02 sec−1 and K1/2 of 0.15 ± 0.02 μM. Experimental errors for both observed rate constants are smaller than the size of symbols.
Biphasic kinetic behavior in ligand binding can be explained by kinetic mechanisms that include a conformational change of the reporting macromolecule occurring either before or after the bimolecular collision event (Johnson 1992). To differentiate between these mechanisms, we analyzed the dependence of the observed rate constants for binding pre-tRNA on the RNase P concentration. The value of kobs,1, increases linearly with the concentration of RNase P, indicating that this phase originates from a bimolecular collision event. However, the rate constant for the second phase, kobs,2, shows a hyperbolic dependence on the concentration of RNase P indicative of an unimolecular event at saturating concentrations of RNase P (kobs,2max). At low concentrations, the observed rate depends on the concentration of the RNase P-ligand intermediate. These data are consistent with a mechanism in which RNase P binds pre-tRNA in a biomolecular collision step followed by a conformational change (Scheme 2). Possible alternate mechanisms include: (1) two slowly converting conformers of RNase P or pre-tRNA with different binding kinetics, and (2) a conformational change in either pre-tRNA or RNase P that occurs before a bimolecular binding step. Since these kinetic experiments observe a fluorescence change in labeled pre-tRNA in the presence of excess holoenzyme, it is possible to exclude all mechanisms that include alternate conformers of RNase P that bind pre-tRNA slowly from the absence of a decrease in the amplitude for the second fluorescence phase at high RNase P concentrations (Fig. 2A). We also argue that the observed biphasic behavior is not likely due to two conformers of pre-tRNA since there is no evidence for multiple populations of Fl-pre-tRNA in time-resolved FRET data (data not shown). A minimal mechanism that is consistent with all of the measured data is that RNase P binds to pre-tRNA to form an initial encounter complex followed by a conformation change in the complex (Scheme 2). These data directly measure the kinetics of the proposed isomerization in the RNase P–pre-tRNA complex.
SCHEME 2.

Two-step binding scheme for RNase P.
Under pseudo-first-order conditions, the observed rate constants for the mechanism in Scheme 2 are approximated by the following equations (Johnson 1992; Gutfreund 1995) that allow estimation of values for the microscopic rate constants:
 |
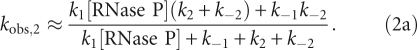 |
At high [RNase P] the plateau value for kobs,2 is
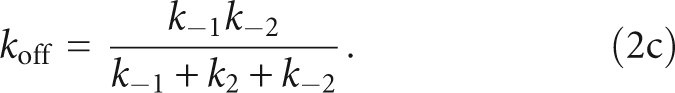
The y-intercept of kobs,2 defines the net dissociation rate (koff) of Fl-pre-tRNA from the RNase P•pre-tRNA complex and is related to the microscopic rate constants in Scheme 2 by
 |
As predicted by Equation 1, the value of kobs,1 is linearly dependent on the concentration of RNase P (Fig. 2B). The slope of this plot reflects the apparent bimolecular association rate constant for RNase P and pre-tRNA (k1 in Equation 1a) with a value of (4.0 ± 0.1) × 106 M−1sec−1. The y-intercept of kobs,1, 0.91 sec−1, reflects a composite value for k−1, k2, and k−2 (Equation 1b). In contrast, the value of kobs,2 increases hyperbolically with increasing RNase P concentration (Fig. 2C), reflecting the buildup of the ES intermediate. At saturating RNase P concentration, the plateau value (kmaxobs,2) is 0.43 ± 0.02 sec−1, reflecting the sum of the rate constants for the isomerization step in Scheme 3 (Equation 2b, k2 + k−2). The value of kobs,2 should yield a positive y-intercept (Equation 2c), but this intercept is too small to obtain reliable estimates from our data sets (∼0.002 sec−1; see below). The value for the rate constant for dissociation of Fl-pre-tRNA from the initial ES complex, k−1 is calculated as 0.48 ± 0.03 sec−1 from the binding data using Equations 1b and 2b. Therefore, these data provide reasonable estimates of the values of k1 and k−1 in the first step and the composite rate constants (k2 + k−2) in the second step in Schemes 2 and 3.
SCHEME 3.

Kinetic mechanism for RNase P.
The pre-tRNA leader–protein interaction decreases the observed dissociation rate of pre-tRNA from the ES* complex
To evaluate which rate constants in this binding scheme contribute to the enhancement of pre-tRNA binding affinity as the length of the leader sequence increases (Fig. 1C), we measured the kinetic binding data for Fl-pre-tRNAAsp varying the leader length from 2 to 8 nt (including fluorescein). Unexpectedly, all of the measured parameters describing the kinetic data (kon, ky-interceptobs,1, and kmaxobs,2) (Table 1) vary by less than threefold for all of these substrates. This difference is not large enough to explain the 50-fold enhancement observed in substrate binding affinity as the leader length increases from 2 to 8 (Fig. 1C). These kinetic data clearly rule out a large effect of the leader length on the value of k1, k−1, and the sum of (k2 + k−2) but they do not pinpoint whether the rate constant for the forward or reverse conformation step is affected by the protein-leader interaction.
TABLE 1.
Rate constants for binding fluorescein-pre-tRNA to RNase Pa

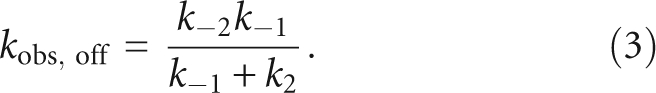
To further address the origins of the enhancement of the binding affinity of pre-tRNA with longer leaders, we measured the rate constant for dissociation of pre-tRNA from the ES* complex as a function of the length of the leader (Fig. 3). Equal concentrations of RNase P and Fl-pre-tRNA were preincubated to form the RNase P•pre-tRNA* complex. This complex was then diluted into excess unlabeled pre-tRNA to prevent the dissociated Fl-pre-tRNA from rebinding to RNase P, resulting in a time-dependent decrease in the fluorescein fluorescence intensity (Fig. 3A). The apparent rate constant for dissociation of the Fl-pre-tRNA from this complex was determined from fitting a single exponential equation to these data. The value of the observed dissociation rate constant, kobs,off, decreases from 0.41 ± 0.04 sec−1 for pre-tRNA with a leader length of 2 to less than ∼0.002 sec− 1 for pre-tRNA substrates with a leader greater than 4 nt (Fig. 3B; Table 1). The observed dissociation rate constant, kobs,off (see Equation 3 below) is a composite of the pre-tRNA dissociation rate constant, k−1, and the isomerization rate constants (k2 + k−2) indicating that at least one of these rate constants is sensitive to the leader length. This 200-fold decrease in the value of kobs,off is more than sufficient to explain the >40-fold increase in the binding affinity of pre-tRNA as the leader length increases.
FIGURE 3.

Observed dissociation rate constant, kobs,off, for the RNase P-5′Fl pre-tRNA complex. (A) Dissociation time courses for pre-tRNA with leader length of 3 and 6 nt. Dissociation kinetics were measured by monitoring fluorescence intensity upon mixing the preformed RNase P•5′Fl pre-tRNA complex (150 nM RNase P and 25–50 nM 5′ Fl-pre-tRNA, final concentration) with a large excess (>500-fold) of unlabeled pre-tRNA to prevent rebinding of 5′Fl pre-tRNA in buffer A at 25°C. These observed dissociation rate constants are the average of at least three independent measurements. (B) Observed dissociation rate constants as the leader length varies from 2 to 8 nt (with fluorescein).
 |
Calculating the microscopic kinetic rate constants for the two-step binding model
To determine which step in the kinetic pathway for binding pre-tRNA is dependent on the leader length, we calculated the microscopic kinetic rate constants (k1, k−1, k2, and k−2) and microscopic equilibrium constants (K1 and K2) for Scheme 2 from the measured observed kinetic rate constants. The bimolecular association rate constant, k1, is determined directly from the dependence of the rate constant of the first phase on the concentration of RNase P (Fig. 2A; Equation 1a). The value of this rate constant is 2.4 ± 0.3 μM−1sec−1 for pre-tRNA with a 2–4 nt leader length and increases to 4.5 ± 0.7 μM−1sec−1 when the leader length increases to 5–8 nt, comparable to previous measurements (Kurz and Fierke 2002). As described above, the value of k−1 can be determined from the difference between the value of ky-interceptobs,1 and kobs,2 (Equations 1b and 2b). This rate constant shows little dependence on the length of the pre-tRNA leader (2–8 nt) with an average value of 0.65 sec−1; the calculated value ranges from a low of 0.38 sec−1 for pre-tRNA with a 3 nt leader to a high of 0.88 sec−1 for an 8 nt leader. These values for k−1 are faster than previous estimates of the pre-tRNA dissociation rate constant assuming a single-step binding mechanism (Kurz and Fierke 2002). The value of the equilibrium constant for formation of the initial complex, K1, is calculated from the ratio of these rate constants, k1/k−1. The association constant for the initial complex formation, K1, has an average value of (6 ± 1) × 106 M−1 and is independent of the leader length. Interestingly, this value is similar to the binding association constant of mature tRNA determined under the same solution conditions [KtRNAA = (2.9±0.3) × 106 M−1] (see Crary et al. 1998; data not shown), suggesting that RNase P recognizes mainly the tRNA moiety in this initial complex.
The value of k−2, the reverse isomerization rate constant, can be estimated from the measured values of kobs,off and ky-interceptobs,1 and the calculated value of k−1 by substituting Equations 1b and 2b into Equation 3 to yield
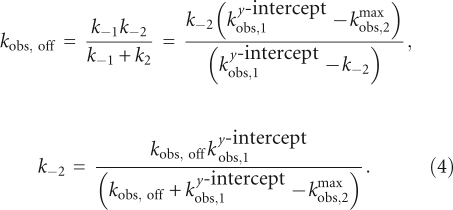 |
Using this calculation, the value of k−2 decreases from 0.51 ± 0.09 sec−1 for pre-tRNA with a 2 nt leader to ∼0.004 sec−1 for pre-tRNA with leaders of 5 nt or longer (Table 2). These values parallel the observed decreases in kobs,off, since k−2 is the main rate-contributing step in substrate dissociation. Finally, since k2 is larger than k−2, the value of k2 is approximated by kmaxobs,2 (Equation 2b) and is constant at 0.40 ± 0.08 sec−1 for all of the substrates, even for pre-tRNA with a 2-nt leader where the values of k−2 and k2 are comparable. Therefore, the main effect of increasing the length of the pre-tRNA leader on the kinetics is to decrease the reverse isomerization rate constant.
TABLE 2.
Equilibrium and kinetic constants for RNase P binding to Fl-pre-tRNAAsp a

In contrast to the limited dependence of the value of K1 on the leader length, the isomerization equilibrium constant, K2, increases from 8 ± 1 with a leader length of 2 nt to a plateau value of ∼300 with a leader length greater than 5 nt (Fig. 4), reflecting a favorable change in free energy for the isomerization equilibrium of ∼2.1 kcal/mol. This enhancement is in good agreement with the increase in the overall pre-tRNA binding affinity when lengthening the pre-tRNA leader from 2 to 5 nt, determined by radioactive assays (Fig. 1, dashed line) ∼2.2 kcal/mol (Crary et al. 1998). Furthermore, these changes in the values of K2 and k−2 correlate with the positions in the leader expected to interact directly with the P protein in the holoenzyme–substrate complex, as suggested by photo-cross-linking and time-resolved FRET results (Niranjanakumari et al. 1998b; Rueda et al. 2005). Together, these results suggest that the observed conformational change of the holoenzyme–substrate complex includes an enhanced interaction between the leader and the P protein in the alternate conformation adopted by the RNase P–pre-tRNA complex.
FIGURE 4.

Equilibrium constants for substrate binding (K1) and isomerization (K2) as a function of the leader length in buffer A at 25°C. The values for these equilibrium constants are calculated as described in Table 2.
Two-step binding mechanism also occurs in buffers with magnesium
All of the kinetic experiments above were carried out in calcium, where pre-tRNA cleavage is slow. However, the cleavage rate constants are significantly higher in the presence of the physiologically important metal cofactor, magnesium. To examine whether the conformational change is also observed in the presence of magnesium, we monitor changes in the fluorescent intensity upon mixing 5′ Fl-pre-tRNA with RNase P at pH 5.5 in buffer A with 20 mM MgCl2 under single-turnover conditions. This fluorescence kinetic trace potentially monitors all of the steps in the kinetic pathway, including pre-tRNA binding, conformation change, cleavage, and product release (Fig. 5A). Three distinct kinetic phases are apparent in the fluorescence kinetic trace: a phase with an increase in fluorescence (t1/2 ∼ 0.1 sec) followed by a rapid quenching phase (t1/2 ∼ 1 sec), and then a much slower quenching phase (t1/2 ∼ 20 sec). Analysis of the kinetic trace indicates that an equation with three exponential phases provides the best fit to the experimental time course. Based on the linear dependence of the observed rate constant on the RNase P concentration (data not shown), we deduce that the fastest phase (kobs,1) reflects the association of Fl-pre-tRNA with RNase P with an apparent bimolecular binding rate constant of (4.5 ± 0.5) × 106 M−1 sec−1, comparable to the association rate constant (k1) measured in the presence of calcium (Table 1). For the third (slowest) kinetic phase, the rate constant (kobs,3) is not dependent on the concentration of RNase P, and this phase disappears when the experiment is performed in buffers containing calcium. Therefore, we attribute this phase to cleavage and/or product release, with an apparent rate constant of ∼0.03 sec−1 at pH 5.5 (Fig. 5A).
FIGURE 5.

Comparison of the time courses of the fluorescence of 5′Fl-pre-tRNA after mixing with RNase P and cleavage of pre-tRNA. (A) The stopped-flow experiments were initiated by mixing 5′ fluorescein pre-tRNA with a 7-nt leader (25 nM) with RNase P (1.5 μM) in buffer A containing 20 mM MgCl2 substituted for CaCl2 at pH 5.5. The fluorescent traces were monitored at λex = 488 nm; λem > 500 nm. The time course for cleavage of 5′ fluorescein pre-tRNA (circle) was measured using a rapid quench instrument under single turnover conditions (50 nM 5′ fluorescein tRNA and 1.5 μM RNase P) in buffer A containing 20 mM MgCl2 at pH 5.5. The fluorescence traces exhibit three phases, as indicated in italics. The solid line overlaying the rapid quench data is the best single exponential fits to the cleavage time course. (B) The pH dependence of the observed cleavage rate constants catalyzed by B. subtilis RNase P. Cleavage of 5′ Fl-pre-tRNA was measured with pH varying from 5.5 (closed circle), 6.5 (open circle), 7.0 (closed square), to 8.0 (open square) (C) The observed cleavage rate constants (open circle) and isomerization constants, k2, (closed circle) as a function of pH. The solid line is the best nonlinear fits of Equation 9 to these data, assuming that protonation/deprotonation is rapid, to obtain a maximum rate of 1.01 ± 0.05 sec−1 and a single apparent pKa, of 6.3 ± 0.1.
To examine the origin of this third phase further, we measured the rate constant for RNase P-catalyzed cleavage of Fl-pre-tRNA using rapid quench methods that assay the formation of the cleaved products (Fig. 5A,B). These rapid quench data nearly overlay the third fluorescent phase, with an observed rate constant of 0.089 ± 0.008 sec−1 for cleavage at pH 5.5 (Scheme 3, k3). Since the observed rate constant for this fluorescent phase (kobs,3) is threefold slower than the cleavage rate constant, it is likely partially rate limited by both the cleavage and product release steps. Therefore, we conclude that this fluorescent phase reflects a combination of pre-tRNA cleavage and product release.
The intermediate phase (kobs = 1.05 ± 0.02 sec−1) in the fluorescent trace is much faster than the cleavage step (Fig. 5A) and is not dependent on the RNase P concentration (data not shown). Furthermore, the value of this rate constant is similar to the conformational change step measured in calcium (within twofold). These data provide evidence that the conformational step after pre-tRNA binding occurs in magnesium, as well as calcium. Together, these results suggest that the conformational change step occurs before the cleavage step in the RNase P-catalyzed reaction (Scheme 3).
To further examine the importance of the conformational transition in RNase P, we compared the stopped-flow fluorescence and rapid quench kinetic traces at several pH values. The observed cleavage rate constants, determined from the rapid quench data in 20 mM MgCl2 at 25°C (Fig. 5B), demonstrate a log–linear pH dependence at low pH, and become pH independent above pH 6.5. These data are well described by a single observed pKa of 6.3 ± 0.1 and a maximum rate constant of 1.01 ± 0.05 sec−1 (Fig. 5C). The values of both the pKa and the kmax are lower than previous measurements at 37°C of 8.2 ± 0.2 and 20 ± 4 sec−1, respectively (Kurz and Fierke 2002). We attribute these differences to the lower experimental temperature and addition of the fluorescein modification in our current study. However, the most significant result of this study is that the observed pKa is much lower than the ionization of a metal-hydroxide, the suggested nucleophile in the reaction (Kurz and Fierke 2002; Cassano et al. 2004).
The pH dependence of the stopped-flow kinetic data in magnesium is more complicated than the rapid quench data since multiple steps are monitored. At low pH, three phases are observed in the stopped-flow traces in Mg2+ (as described above). The apparent association rate constant, k1, is dependent on the concentration of RNase P, but is not dependent on pH with a second-order rate constant of (5 ± 1) × 106 M−1sec−1. The rate constant for the third phase in the fluorescence trace increases modestly as the pH is raised to a constant value of 0.07 ± 0.01 sec−1 above pH 6 (data not shown).
This step does not occur before cleavage since the rate constant is slower than the observed cleavage rate constant, and likely mainly reflects the product release step as determined by assaying the dissociation step using fluorescence resonance energy transfer from Fl-pre-tRNA to a tetramethylrhodamine acceptor on the holoenzyme (data not shown). The measured rate constants for the intermediate phase, reflecting the conformational change, are ∼1 sec−1 and invariant with pH (Fig. 5C, filled circles). The value of the rate constant of this phase is comparable to both the conformational change rate constant in calcium (0.4 ± 0.1 sec−1) and to the cleavage rate constant at high pH. The most reasonable interpretation of these data is that at low pH, the cleavage rate constant is slower than the conformational change, so three kinetic phases are observed. However, as the pH increases, the cleavage rate constant becomes faster than the conformational change; therefore only the rate-limiting conformational change step is observed in both the fluorescence and rapid quench data at high pH.
DISCUSSION
Conformational changes are a common phenomenon in biological catalysts and are particularly prevalent in RNA-based catalysts. Structural changes in an enzyme–ligand complex often increase the substrate affinity by: net gains in hydrogen bonds, burial of hydrophobic surface, rearrangement of functional groups to enhance electrostatic interactions, and/or creation of new metal ion binding sites (Doudna and Cech 2002; Hammes 2002). All of these processes could occur in the observed conformational change that enhances the affinity of B. subtilis RNase P for pre-tRNA. Previous observations of other ribozymes, including the hairpin ribozyme (Walter et al. 1998; Wilson et al. 2005), the SV ribozyme (Pereira et al. 2008), and Group I intron (for a recent review, see Hougland et al. 2006) demonstrate that substrates first bind to the enzyme in a low-affinity initial complex in an “open” conformation, which then isomerizes to a high-affinity conformational state as a “closed” or “docked” state. The fluorescence binding data are the first explicit demonstration that RNase P similarly uses a two-step substrate binding mechanism that enhances both substrate binding and catalysis.
Kinetic mechanism of RNase P
Data in this study indicate that a minimal kinetic mechanism for RNase P (Scheme 3) includes four distinct and ordered steps: (1) RNase P holoenzyme binds pre-tRNA in a near diffusion-limited reaction (between 106 and 107 M−1 sec−1) to form an enzyme–substrate complex (ES); (2) this initial ES complex then undergoes a unimolecular isomerization step (ES*); (3) the phosphodiester bond at the cleavage site of pre-tRNA bound in this conformation is hydrolyzed to form mature tRNA and the cleaved 5′ leader; and (4) these products dissociate from RNase P. Product dissociation is the rate-limiting step for steady-state turnover (kcat) catalyzed by RNase P under many conditions (Reich et al. 1988; Tallsjo and Kirsebom 1993; Kurz et al. 1998; for reviews, see Hsieh et al. 2004; Koutmou et al. 2009). The RNase P-catalyzed rate constant for pre-tRNA cleavage under single turnover conditions is limited by the chemistry step at low pH (Scheme 3, step 3); however, the conformational change step becomes rate limiting (Scheme 3, step 2) at high pH, when the cleavage rate constant becomes faster than the isomerization rate constant. A salient point is that this mechanism is also consistent with previous kinetic measurements. At low pH the cleavage step (k3) is rate limiting, and the conformational change cannot be distinguished from substrate binding using rapid quench methods. At high pH, the conformational change limits the cleavage rate constant so these two steps are indistinguishable by kinetics alone. In fact, Scheme 3 becomes equivalent to the previously developed kinetic scheme for RNase P, Scheme 1, except that the rate-limiting step is the conformational change rather than cleavage.
The pH dependence of these kinetic data provides an explanation for the origin of the pKa observed in the single-turnover cleavage reaction (Fig. 5C). This pKa has been proposed to reflect ionization of a metal-bound hydroxide that might function as the nucleophile in the cleavage reaction (Smith and Pace 1993; Kurz and Fierke 2002; Cassano et al. 2004). However, the observed pKa for single-turnover cleavage catalyzed by either PRNA or RNase P is much lower than the pKa for metal-hydroxide, which is ∼11.4 (Cech and Bass 1986). The kinetic data presented here demonstrate that the step that limits the rate for single turnover cleavage changes as a function of pH. At low pH, the pH-dependent cleavage step is rate limiting, while at high pH the isomerization step becomes rate limiting. Therefore, the observed pKa in this reaction reflects a change in the rate-limiting step rather than ionization of a catalytically pertinent functional group (Fersht 1999).
Conformational change increases the affinity of RNase P for pre-tRNA
A major thermodynamic effect of the P protein subunit of RNase P is to specifically increase the affinity of pre-tRNA compared to tRNA; B. subtilis RNase P binds pre-tRNAAsp 103-fold more tightly than tRNAAsp, while the PRNA subunit alone has only a 10-fold higher affinity for pre-tRNAAsp (Crary et al. 1998; Kurz et al. 1998). There are several hypotheses regarding the driving force for this preference. The dependence of the enhancement of substrate affinity on the length of the pre-tRNA leader correlates with the interaction of the P protein with the leader, as indicated by cross-linking, affinity cleavage, and FRET measurements (Fig. 1; Niranjanakumari et al. 1998b; Rueda et al. 2005; Niranjanakumari et al. 2007). In addition, the substrate binding affinity for RNase P holoenzyme is dependent on the leader sequence (Sun et al. 2006). These correlations suggest that the protein–leader interaction provides the molecular basis for the enhanced pre-tRNA affinity. However, the magnitude of this effect likely varies with the structure of both RNase P and pre-tRNA; Pace and colleagues have observed smaller enhancement of pre-tRNA affinity relative to tRNA for the E. coli RNase P holoenzyme (Buck et al. 2005a). In comparing substrates with different leader lengths we assume that the 5′ leader in pre-tRNA is unstructured, as previously reported (Zuleeg et al. 2001). Consistent with this, the value of K1 is constant for all substrates used in this study indicating that differing substrate conformations do not affect the relative energy difference between the free and bound state for the substrate in forming the initial complex (Fig. 4). Furthermore, the main consequence of longer leader sequences is that the isomerized complex is stabilized relative to the initial complex due to a decrease in the reverse isomerization rate constant (Scheme 2, k−2). In summary, these data suggest that the conformational change after binding is coupled to protein–leader contacts that enhance the pre-tRNA affinity.
Evidence suggesting conformational flexibility in RNase P that is coupled to binding of P protein and pre-tRNA has been previously documented. Phosphorothioate footprinting analyses of bacterial RNase P holoenzymes suggest that P protein binding to PRNA protects conserved elements adjacent to the proposed active site and changes the conformation of PRNA near the tRNA binding site (Buck et al. 2005b). Similarly, the pattern of intermolecular cross-links between PRNA and the N-terminus of P protein alters upon formation of the RNase P•pre-tRNA complex (Niranjanakumari et al. 2007). Furthermore, thermal-melting studies of RNase P have been interpreted as indicating that the binding preference of the holoenzyme for pre-tRNA is due to enhanced interactions with a conformer of PRNA that the P protein stabilizes (Buck et al. 2005a). Specifically, P protein alters the PRNA conformation near the cleavage site that could indirectly affect interactions between PRNA and 5′ leader (Christian and Harris 1999; Buck et al. 2005a; Zahler et al. 2005). Finally, preliminary time-resolved Föster resonance energy transfer measurements indicate a change in the relative distance between P protein and PRNA helices in the B. subtilis RNase P holoenzyme upon pre-tRNA binding (data not shown). These results suggest that the conformational change after pre-tRNA binding includes alterations in the PRNA/P protein and PRNA/pre-tRNA interfaces, as well as the pre-tRNA/P protein interaction. Together, these observations suggest that the enhancement of pre-tRNA affinity includes both a direct contact between the P protein and the 5′ leader and alterations in the structure of RNase P that alter interactions with pre-tRNA. Coupling the leader–P protein interaction to both substrate affinity and holoenzyme conformational changes provides a unifying explanation for the observed data (Fig. 6).
FIGURE 6.

Model for the conformational change in the RNase P holoenzyme•pre-tRNA complex. Here, the holoenzyme consists of PRNA (oval) and P protein (circle), the leader is shown as a dashed line, and tRNA is shown in wire representation. The data indicate that the conformational change that occurs in forming ES* from the initial ES complex is coupled to a direct interaction between P protein and the leader. Additional structural changes in the complex most likely also occur. These conformational changes are proposed to contribute to high cleavage fidelity and optimal catalytic activity.
Conformational change enhances RNase P holoenzyme activity
Importantly, the conformational change in the enzyme–substrate complex could bring the putative active site in PRNA (the P4 helix, J3/4, J5/15, and J18/2), the highly conserved group of positively charged residues in P protein (the RNR motif), and the cleavage site of pre-tRNA in close proximity to enhance catalytic activity (Biswas et al. 2000; Tsai et al. 2003; Buck et al. 2005b; Niranjanakumari et al. 2007). Several groups have previously proposed such an isomerization step for RNase P. Pan and colleagues (Loria et al. 1998) proposed that the conformational change in the RNase P•substrate complex allows optimal interaction of the two independently folded domains of PRNA to position functional groups and catalytically important ions in the active site. Harris and colleagues suggest that the nucleotide base adjacent to the cleavage site in the leader forms hydrogen bonds with a highly conserved A in PRNA; disruption of this interaction (by nucleotide mutation) increases miscleavage (Zahler et al. 2003). In structural models of the RNase P•pre-tRNA complex (Buck et al. 2005b; Niranjanakumari et al. 2007) this contact is not achieved without structural rearrangements suggesting that a conformational change occurs to promote this base pairing in the RNase P•pre-tRNA complex.
Several other properties of the RNase P holoenzyme are also coupled to the protein–leader interaction and, perhaps, are mediated by the conformational change in the RNase P•pre-tRNA complex observed here. First, the interactions between RNase P protein and the 5′ leader of pre-tRNA enhance the ability of RNase P to bind and cleave a wide variety of naturally occurring pre-tRNA substrates with comparable efficiency (Sun et al. 2006). Furthermore, the binding and catalytic enhancements specific to a 5′ leader sequence are transferable between substrates independent of the tRNA sequence. Second, RNase P holoenzyme has enhanced catalytic activity at low divalent ion concentrations, suggesting that the P protein increases the affinity of RNase P for magnesium ions that contribute to substrate binding and catalysis (Kurz and Fierke 2002; Sun and Harris 2007). Biochemical studies indicate that enhancement of the metal affinity is coupled to the P protein–leader contact and occurs by an indirect effect on the RNase P structure, rather than a direct contact with metal ions (Kurz and Fierke 2002). Therefore, the coupling between the protein–pre-tRNA interaction and conformational changes in the RNase P•pre-tRNA complex (Fig. 6) might be important for substrate affinity and selectivity, cleavage site fidelity, and enhanced affinity for catalytically pertinent metal ions, which allows efficient enzyme activity under physiological conditions. This conformational change may be the unifying factor explaining the role of the P protein as a structural linchpin in the RNase P holoenzyme–substrate complex, helping to organize the active site and enhancing reactivity. Further experiments to investigate both the structural and functional alterations that occur in this conformational change are currently underway.
MATERIALS AND METHODS
Chemicals and buffers
Chemicals were purchased from Sigma Chemical Company. Buffers were prepared using deionized water filtered with Milli-Q system (Waters) and degassed before use. Nucleotide triphosphates were purchased from Amersham BioScience. Guanosine 5′ monothiophosphate (GMPS) was synthesized from 2′, 3′ isopropylidene-guanosine (R.I. Chemical) and thiophosphoryl chloride, as described in Behrman (2000). Plasmids encoding the wild-type B. subtilis P protein, the B. subtilis RNase P RNA (PRNA), and pre-tRNAAsp with various leader lengths were prepared as described in Niranjanakumari et al. (1998a). His6-T7 RNA polymerase was overexpressed from a plasmid (pRC9) kindly provided by Professor W.T. McAllister (University of Medicine and Dentistry of New Jersey) and purified by Ni-NTA chromatography (He et al. 1997). 5-(Iodoacetamido)fluorescein (5-IAF) was purchased from Molecular Probes. Buffer A is 10 mM CaCl2, 10 mM imidazole, 150 mM KCl, 20 mM dithiothreitol, 50 mM Tris•HCl, and 50 mM MES (pH 6.0) at 25°C. Buffer B is 10 mM CaCl2, 100 mM NH4Cl, 20 mM dithiothreitol, 50 mM Tris•HCl, and 50 mM MES (pH 6.0) at 37°C. TE buffer is 1 mM EDTA and 10 mM Tris-HCl (pH 8.0) at 25°C. Buffer C is 500 mM NaCl, 1 mM Na3•EDTA, and 10 mM Tris-HCl (pH 8.0) at 25°C. For pH-dependent experiments, the pH was varied using Tris/MES buffer mixtures of constant ionic strength (50 mM Tris, 50 mM MES) over pH 5.0–8.4. The pH of the buffers was adjusted using HCl (Aldrich) or KOH (Sigma Ultra).
RNA and P protein purification and modification
PRNA was generated by in vitro transcription using T7 RNA polymerase (Milligan and Uhlenbeck 1989; Niranjanakumari et al. 1998b). Precursor tRNA containing a 5′-monothiophosphate was transcribed by in vitro transcription in the presence of excess GMPS over GTP, and labeled with 5-IAF, as described by Rueda et al. (2005). RNA was purified by PAGE (6% acrylamide–8 M urea), and eluted from the gel by diffusion (buffer C with 0.05% Na•SDS). RNA solutions were then filtered (Steriflip, Waters), exchanged into buffer C (Amicon Ultra MWCO 10K, Millipore), and precipitated with ethanol. The B. subtilis P protein was prepared by ion exchange chromatography under denaturing conditions (Niranjanakumari et al. 1998b).
Folding of RNA and reconstitution of RNase P holoenzyme
PRNA and pre-tRNA were refolded by heat denaturation at 95°C in TE, followed by incubation at 37°C for 15 min before addition of an equal volume of 2X buffer A, equilibration at 37°C for an additional 30 min, and then cooling to 25°C. B. subtilis RNase P holoenzyme was formed by adding P protein (1.1-fold molar excess) to folded PRNA (1–20 μM final concentration) in buffer A followed by incubation at 37°C for 30 min.
RNA binding affinity by fluorescence titration
Fluorescence titrations were performed by titrating 5′ fluorescein-labeled pre-tRNA with RNase P on an Eclipse spectrofluorometer (Varian Corp) and monitoring the fluorescence intensity of fluorescein (λex = 488 nm, λem = 524 nm; 5 nm bandpass). The fluorescence intensity was corrected for dilution and background fluorescence, then normalized to that of the free substrate, as described (Lohman and Mascotti 1992). Fluorescence titration data were fit to a 1:1 binding model in order to obtain the global association constant, KA. The observed relative fluorescence enhancement, ΔF, as a function of enzyme concentration was fit with a binding isotherm that accounts for changes in both the concentration of pre-tRNA and RNase P:
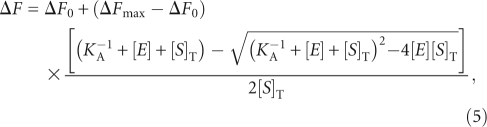 |
where ΔF is the observed change in fluorescein fluorescence; [E] and [S]T are the total enzyme and substrate concentrations, respectively; and ΔF0 and ΔFmax are the fluorescence in the absence of and at saturating holoenzyme concentration, respectively. For each leader length fluorescence titrations were performed at three different [S]T concentrations and these binding isotherms were analyzed simultaneously using Prism (GraphPad Software) to obtain the association constant, KA.
Fluorescence stopped-flow kinetic experiments
Stopped-flow experiments were performed on a KinTek model SF-2001 stopped-flow equipped with 75W Xe arc lamp in two-syringe mode. Fluorescein was excited at 488 nm and its emission was monitored at wavelengths > 500 nm using a cut-on filter (Corion). All kinetic traces are an average of five to eight independent determinations. Sum of exponentials was fit to the transient kinetic time courses, F(t), to obtain the fluorescence amplitude (A) and the observed rate constant, kobs, for each exponential phase where F(0) is the initial fluorescence intensity, and t, time:
Data fitting was performed using KaleidaGraph software (Synergy Software). The reported errors are the asymptotic standard errors.
Analysis of two-step binding thermodynamics
The overall association constant, KA, includes the microscopic equilibrium constants for both steps, as shown in
The values of K2 were calculated from the measured values for KA, k1, and k−1. A two-step binding kinetic and equilibrium scheme is defined in Scheme 2, in which ES and ES* are the enzyme–substrate complexes in two different conformations. Therefore, the microscopic equilibrium constants are defined as
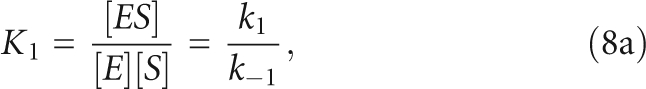 |
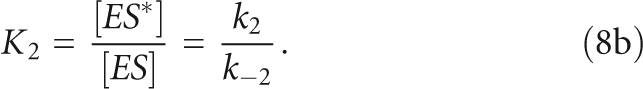 |
Dissociation kinetics of the RNase P–pre-tRNA complex
Dissociation of the RNase P•5′-fluorescein pre-tRNA complex was determined from cold-chase displacement experiments, monitoring changes in fluorescence. In buffer A at 25°C, RNase P and 5′ fluorescein-labeled pre-tRNAAsp were premixed under stoichiometric conditions ([E] > [S] > 10/KA) for at least 10 min before rapidly mixing with a large excess of unlabeled pre-tRNA (the trap, >10-fold higher than [E]) to prevent rebinding of 5′ Fl-pre-tRNA. Time courses were unaffected by altering the concentration of unlabeled pre-tRNA. The observed dissociation rate constant, kobs,off, was calculated from a single exponential fit to the time courses.
Single-turnover kinetics of Fl-tRNA catalyzed by RNase P
RNase P-catalyzed cleavage of Fl-pre-tRNA was performed in buffer A with 10 mM MgCl2 replacing the CaCl2 at 25°C with saturating concentrations of RNase P (1–2 μM) by chemical quench flow techniques, using EDTA and urea (50 mM and 5 M) to stop the reaction (Beebe and Fierke 1994). Progression of the cleavage reaction was followed by denaturing PAGE and fluorescein bands were visualized on a Typhoon multimode scanner (GE Healthcare). The pH dependence of the catalytic rate constant for cleavage of 5′ Fl-pre-tRNA with a 6-nt leader (includes fluorescein) by RNase P was analyzed assuming a single ionization, using
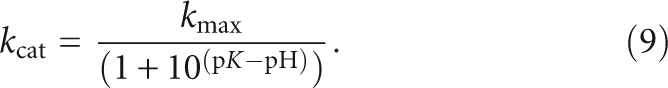 |
ACKNOWLEDGMENTS
We acknowledge the support of the National Institutes of Health (NIH Grant GM-55387). We thank Nathan Zahler and Andy Andrews for stimulating discussions, and members of the Fierke group; especially J. Kristin Koutmou and James Hougland, for insightful comments during the preparation of the manuscript.
Footnotes
Article published online ahead of print. Article and publication date are at http://www.rnajournal.org/cgi/doi/10.1261/rna.1639409.
REFERENCES
- Altman S, Wesolowski D, Guerrier-Takada C, Li Y. RNase P cleaves transient structures in some riboswitches. Proc Natl Acad Sci. 2005;102:11284–11289. doi: 10.1073/pnas.0505271102. [DOI] [PMC free article] [PubMed] [Google Scholar]
- Beebe JA, Fierke CA. A kinetic mechanism for cleavage of precursor tRNAAsp catalyzed by the RNA component of Bacillus subtilis ribonuclease P. Biochemistry. 1994;33:10294–10304. doi: 10.1021/bi00200a009. [DOI] [PubMed] [Google Scholar]
- Behrman E. An improved synthesis of guanosine 5′-monothiophosphate. J Chem Res. 2000;9:446–447. [Google Scholar]
- Biswas R, Ledman DW, Fox RO, Altman S, Gopalan V. Mapping RNA–protein interactions in ribonuclease P from Escherichia coli using disulfide-linked EDTA-Fe. J Mol Biol. 2000;296:19–31. doi: 10.1006/jmbi.1999.3443. [DOI] [PubMed] [Google Scholar]
- Buck AH, Dalby AB, Poole AW, Kazantsev AV, Pace NR. Protein activation of a ribozyme: The role of bacterial RNase P protein. EMBO J. 2005a;24:3360–3368. doi: 10.1038/sj.emboj.7600805. [DOI] [PMC free article] [PubMed] [Google Scholar]
- Buck AH, Kazantsev AV, Dalby AB, Pace NR. Structural perspective on the activation of RNase P RNA by protein. Nat Struct Mol Biol. 2005b;12:958–964. doi: 10.1038/nsmb1004. [DOI] [PubMed] [Google Scholar]
- Cassano AG, Anderson VE, Harris ME. Understanding the transition states of phosphodiester bond cleavage: insights from heavy atom isotope effects. Biopolymers. 2004;73:110–129. doi: 10.1002/bip.10517. [DOI] [PubMed] [Google Scholar]
- Cech TR, Bass BL. Biological catalysis by RNA. Annu Rev Biochem. 1986;55:599–629. doi: 10.1146/annurev.bi.55.070186.003123. [DOI] [PubMed] [Google Scholar]
- Christian EL, Harris ME. The track of the pre-tRNA 5′ leader in the ribonuclease P ribozyme-substrate complex. Biochemistry. 1999;38:12629–12638. doi: 10.1021/bi991278a. [DOI] [PubMed] [Google Scholar]
- Christian EL, Kaye NM, Harris ME. Helix P4 is a divalent metal ion binding site in the conserved core of the ribonuclease P ribozyme. RNA. 2000;6:511–519. doi: 10.1017/s1355838200000042. [DOI] [PMC free article] [PubMed] [Google Scholar]
- Christian EL, Zahler NH, Kaye NM, Harris ME. Analysis of substrate recognition by the ribonucleoprotein endonuclease RNase P. Methods. 2002;28:307–322. doi: 10.1016/s1046-2023(02)00238-4. [DOI] [PubMed] [Google Scholar]
- Crary SM, Niranjanakumari S, Fierke CA. The protein component of Bacillus subtilis ribonuclease P increases catalytic efficiency by enhancing interactions with the 5′ leader sequence of pre-tRNAAsp. Biochemistry. 1998;37:9409–9416. doi: 10.1021/bi980613c. [DOI] [PubMed] [Google Scholar]
- Crary SM, Kurz JC, Fierke CA. Specific phosphorothioate substitutions probe the active site of Bacillus subtilis ribonuclease P. RNA. 2002;8:933–947. doi: 10.1017/s1355838202025025. [DOI] [PMC free article] [PubMed] [Google Scholar]
- Doudna JA, Cech TR. The chemical repertoire of natural ribozymes. Nature. 2002;418:222–228. doi: 10.1038/418222a. [DOI] [PubMed] [Google Scholar]
- Evans D, Marquez SM, Pace NR. RNase P: Interface of the RNA and protein worlds. Trends Biochem Sci. 2006;31:333–341. doi: 10.1016/j.tibs.2006.04.007. [DOI] [PubMed] [Google Scholar]
- Fersht A. Structure and mechanism in protein science: A guide to enzyme catalysis and protein folding. Freeman; New York: 1999. [Google Scholar]
- Gopalan V. Uniformity amid diversity in RNase P. Proc Natl Acad Sci. 2007;104:2031–2032. doi: 10.1073/pnas.0611193104. [DOI] [PMC free article] [PubMed] [Google Scholar]
- Guerrier-Takada C, Gardiner K, Marsh T, Pace N, Altman S. The RNA moiety of ribonuclease P is the catalytic subunit of the enzyme. Cell. 1983;35:849–857. doi: 10.1016/0092-8674(83)90117-4. [DOI] [PubMed] [Google Scholar]
- Gutfreund H. Kinetics for the life sciences: Receptors, transmitters, and catalysts. Cambridge University Press; Cambridge, U.K: 1995. [Google Scholar]
- Haas ES, Brown JW, Pitulle C, Pace NR. Further perspective on the catalytic core and secondary structure of ribonuclease P RNA. Proc Natl Acad Sci. 1994;91:2527–2531. doi: 10.1073/pnas.91.7.2527. [DOI] [PMC free article] [PubMed] [Google Scholar]
- Haebel PW, Gutmann S, Ban N. Dial tm for rescue: tmRNA engages ribosomes stalled on defective mRNAs. Curr Opin Struct Biol. 2004;14:58–65. doi: 10.1016/j.sbi.2004.01.010. [DOI] [PubMed] [Google Scholar]
- Hall TA, Brown JW. Archaeal RNase P has multiple protein subunits homologous to eukaryotic nuclear RNase P proteins. RNA. 2002;8:296–306. doi: 10.1017/s1355838202028492. [DOI] [PMC free article] [PubMed] [Google Scholar]
- Hammes GG. Multiple conformational changes in enzyme catalysis. Biochemistry. 2002;41:8221–8228. doi: 10.1021/bi0260839. [DOI] [PubMed] [Google Scholar]
- He B, Rong M, Lyakhov D, Gartenstein H, Diaz G, Castagna R, McAllister WT, Durbin RK. Rapid mutagenesis and purification of phage RNA polymerases. Protein Expr Purif. 1997;9:142–151. doi: 10.1006/prep.1996.0663. [DOI] [PubMed] [Google Scholar]
- Hougland JL, Piccirilli JA, Forconi M, Lee J, Herschlag D. How the group I intron works: A case study of RNA structure and function. In: Gesteland RF, et al., editors. The RNA world. 3rd ed. Cold Spring Harbor Laboratory Press; Cold Spring Harbor, N.Y: 2006. [Google Scholar]
- Hsieh J, Andrews AJ, Fierke CA. Roles of protein subunits in RNA–protein complexes: lessons from ribonuclease P. Biopolymers. 2004;73:79–89. doi: 10.1002/bip.10521. [DOI] [PubMed] [Google Scholar]
- Jarrous N. Human ribonuclease P: Subunits, function, and intranuclear localization. RNA. 2002;8:1–7. doi: 10.1017/s1355838202011184. [DOI] [PMC free article] [PubMed] [Google Scholar]
- Jarrous N, Reiner R. Human RNase P: A tRNA-processing enzyme and transcription factor. Nucleic Acids Res. 2007;35:3519–3524. doi: 10.1093/nar/gkm071. [DOI] [PMC free article] [PubMed] [Google Scholar]
- Johnson KA. Transient-state kinetic analysis of enzyme reaction pathways. In: Sigman DS, editor. The enzymes. Vol. XX. Academic; New York: 1992. pp. 1–61. [Google Scholar]
- Kazantsev AV, Krivenko AA, Harrington DJ, Holbrook SR, Adams PD, Pace NR. Crystal structure of a bacterial ribonuclease P RNA. Proc Natl Acad Sci. 2005;102:13392–13397. doi: 10.1073/pnas.0506662102. [DOI] [PMC free article] [PubMed] [Google Scholar]
- Kikovska E, Svard SG, Kirsebom LA. Eukaryotic RNase P RNA mediates cleavage in the absence of protein. Proc Natl Acad Sci. 2007;104:2062–2067. doi: 10.1073/pnas.0607326104. [DOI] [PMC free article] [PubMed] [Google Scholar]
- Komine Y, Kitabatake M, Yokogawa T, Nishikawa K, Inokuchi H. A tRNA-like structure is present in 10Sa RNA, a small stable RNA from Escherichia coli. Proc Natl Acad Sci. 1994;91:9223–9227. doi: 10.1073/pnas.91.20.9223. [DOI] [PMC free article] [PubMed] [Google Scholar]
- Koutmou KS, Hsieh J, Fierke CA. Kinetic mechanism of bacterial RNase P. In: Altman S, Liu F, editors. Ribonuclease P. Springer; New York: 2009. [Google Scholar]
- Kurz JC, Fierke CA. Ribonuclease P: A ribonucleoprotein enzyme. Curr Opin Chem Biol. 2000;4:553–558. doi: 10.1016/s1367-5931(00)00131-9. [DOI] [PubMed] [Google Scholar]
- Kurz JC, Fierke CA. The affinity of magnesium binding sites in the Bacillus subtilis RNase P x pre-tRNA complex is enhanced by the protein subunit. Biochemistry. 2002;41:9545–9558. doi: 10.1021/bi025553w. [DOI] [PubMed] [Google Scholar]
- Kurz JC, Niranjanakumari S, Fierke CA. Protein component of Bacillus subtilis RNase P specifically enhances the affinity for precursor-tRNAAsp. Biochemistry. 1998;37:2393–2400. doi: 10.1021/bi972530m. [DOI] [PubMed] [Google Scholar]
- Li Y, Altman S. A specific endoribonuclease, RNase P, affects gene expression of polycistronic operon mRNAs. Proc Natl Acad Sci. 2003;100:13213–13218. doi: 10.1073/pnas.2235589100. [DOI] [PMC free article] [PubMed] [Google Scholar]
- Li Y, Cole K, Altman S. The effect of a single, temperature-sensitive mutation on global gene expression in Escherichia coli. RNA. 2003;9:518–532. doi: 10.1261/rna.2198203. [DOI] [PMC free article] [PubMed] [Google Scholar]
- Lohman TM, Mascotti DP. Nonspecific ligand-DNA equilibrium binding parameters determined by fluorescence methods. Methods Enzymol. 1992;212:424–458. doi: 10.1016/0076-6879(92)12027-n. [DOI] [PubMed] [Google Scholar]
- Loria A, Pan T. Recognition of the 5′ leader and the acceptor stem of a pre-tRNA substrate by the ribozyme from Bacillus subtilis RNase P. Biochemistry. 1998;37:10126–10133. doi: 10.1021/bi980220d. [DOI] [PubMed] [Google Scholar]
- Loria A, Pan T. The cleavage step of ribonuclease P catalysis is determined by ribozyme–substrate interactions both distal and proximal to the cleavage site. Biochemistry. 1999;38:8612–8620. doi: 10.1021/bi990691f. [DOI] [PubMed] [Google Scholar]
- Loria A, Niranjanakumari S, Fierke CA, Pan T. Recognition of a pre-tRNA substrate by the Bacillus subtilis RNase P holoenzyme. Biochemistry. 1998;37:15466–15473. doi: 10.1021/bi9816507. [DOI] [PubMed] [Google Scholar]
- Milligan JF, Uhlenbeck OC. Synthesis of small RNAs using T7 RNA polymerase. Methods Enzymol. 1989;180:51–62. doi: 10.1016/0076-6879(89)80091-6. [DOI] [PubMed] [Google Scholar]
- Niranjanakumari S, Kurz JC, Fierke CA. Expression, purification and characterization of the recombinant ribonuclease P protein component from Bacillus subtilis. Nucleic Acids Res. 1998a;26:3090–3096. doi: 10.1093/nar/26.13.3090. [DOI] [PMC free article] [PubMed] [Google Scholar]
- Niranjanakumari S, Stams T, Crary SM, Christianson DW, Fierke CA. Protein component of the ribozyme ribonuclease P alters substrate recognition by directly contacting precursor tRNA. Proc Natl Acad Sci. 1998b;95:15212–15217. doi: 10.1073/pnas.95.26.15212. [DOI] [PMC free article] [PubMed] [Google Scholar]
- Niranjanakumari S, Day-Storms JJ, Ahmed M, Hsieh J, Zahler NH, Venters RA, Fierke CA. Probing the architecture of the B. subtilis RNase P Holoenzyme active site by crosslinking and affinity cleavage. RNA. 2007;13:512–535. doi: 10.1261/rna.308707. [DOI] [PMC free article] [PubMed] [Google Scholar]
- Pace NR, Brown JW. Evolutionary perspective on the structure and function of ribonuclease P, a ribozyme. J Bacteriol. 1995;177:1919–1928. doi: 10.1128/jb.177.8.1919-1928.1995. [DOI] [PMC free article] [PubMed] [Google Scholar]
- Pannucci JA, Haas ES, Hall TA, Harris JK, Brown JW. RNase P RNAs from some Archaea are catalytically active. Proc Natl Acad Sci. 1999;96:7803–7808. doi: 10.1073/pnas.96.14.7803. [DOI] [PMC free article] [PubMed] [Google Scholar]
- Peck-Miller KA, Altman S. Kinetics of the processing of the precursor to 4.5 S RNA, a naturally occurring substrate for RNase P from Escherichia coli. J Mol Biol. 1991;221:1–5. doi: 10.1016/0022-2836(91)80194-y. [DOI] [PubMed] [Google Scholar]
- Pereira MJ, Nikolova EN, Hiley SL, Jaikaran D, Collins RA, Walter NG. Single VS ribozyme molecules reveal dynamic and hierarchical folding toward catalysis. J Mol Biol. 2008;382:496–509. doi: 10.1016/j.jmb.2008.07.020. [DOI] [PMC free article] [PubMed] [Google Scholar]
- Reich C, Olsen GJ, Pace B, Pace NR. Role of the protein moiety of ribonuclease P, a ribonucleoprotein enzyme. Science. 1988;239:178–181. doi: 10.1126/science.3122322. [DOI] [PubMed] [Google Scholar]
- Rueda D, Hsieh J, Day-Storms JJ, Fierke CA, Walter NG. The 5′ leader of precursor tRNAAsp bound to the Bacillus subtilis RNase P holoenzyme has an extended conformation. Biochemistry. 2005;44:16130–16139. doi: 10.1021/bi0519093. [DOI] [PubMed] [Google Scholar]
- Seif E, Altman S. RNase P cleaves the adenine riboswitch and stabilizes pbuE mRNA in Bacillus subtilis. RNA. 2008;14:1237–1243. doi: 10.1261/rna.833408. [DOI] [PMC free article] [PubMed] [Google Scholar]
- Smith D, Pace NR. Multiple magnesium ions in the ribonuclease P reaction mechanism. Biochemistry. 1993;32:5273–5281. doi: 10.1021/bi00071a001. [DOI] [PubMed] [Google Scholar]
- Smith D, Burgin AB, Haas ES, Pace NR. Influence of metal ions on the ribonuclease P reaction. Distinguishing substrate binding from catalysis. J Biol Chem. 1992;267:2429–2436. [PubMed] [Google Scholar]
- Sun L, Harris ME. Evidence that binding of C5 protein to P RNA enhances ribozyme catalysis by influencing active site metal ion affinity. RNA. 2007;13:1505–1515. doi: 10.1261/rna.571007. [DOI] [PMC free article] [PubMed] [Google Scholar]
- Sun L, Campbell FE, Zahler NH, Harris ME. Evidence that substrate-specific effects of C5 protein lead to uniformity in binding and catalysis by RNase P. EMBO J. 2006;25:3998–4007. doi: 10.1038/sj.emboj.7601290. [DOI] [PMC free article] [PubMed] [Google Scholar]
- Tallsjo A, Kirsebom LA. Product release is a rate-limiting step during cleavage by the catalytic RNA subunit of Escherichia coli RNase P. Nucleic Acids Res. 1993;21:51–57. doi: 10.1093/nar/21.1.51. [DOI] [PMC free article] [PubMed] [Google Scholar]
- Torres-Larios A, Swinger KK, Krasilnikov AS, Pan T, Mondragon A. Crystal structure of the RNA component of bacterial ribonuclease P. Nature. 2005;437:584–587. doi: 10.1038/nature04074. [DOI] [PubMed] [Google Scholar]
- Tsai HY, Masquida B, Biswas R, Westhof E, Gopalan V. Molecular modeling of the three-dimensional structure of the bacterial RNase P holoenzyme. J Mol Biol. 2003;325:661–675. doi: 10.1016/s0022-2836(02)01267-6. [DOI] [PubMed] [Google Scholar]
- Walker SC, Engelke DR. Ribonuclease P: The evolution of an ancient RNA enzyme. Crit Rev Biochem Mol Biol. 2006;41:77–102. doi: 10.1080/10409230600602634. [DOI] [PMC free article] [PubMed] [Google Scholar]
- Walter NG, Hampel KJ, Brown KM, Burke JM. Tertiary structure formation in the hairpin ribozyme monitored by fluorescence resonance energy transfer. EMBO J. 1998;17:2378–2391. doi: 10.1093/emboj/17.8.2378. [DOI] [PMC free article] [PubMed] [Google Scholar]
- Waugh DS, Pace NR. Gap-scan deletion analysis of Bacillus subtilis RNase P RNA. FASEB J. 1993;7:188–195. doi: 10.1096/fasebj.7.1.7678561. [DOI] [PubMed] [Google Scholar]
- Wilson TJ, Nahas M, Ha T, Lilley DM. Folding and catalysis of the hairpin ribozyme. Biochem Soc Trans. 2005;33:461–465. doi: 10.1042/BST0330461. [DOI] [PubMed] [Google Scholar]
- Zahler NH, Christian EL, Harris ME. Recognition of the 5′ leader of pre-tRNA substrates by the active site of ribonuclease P. RNA. 2003;9:734–745. doi: 10.1261/rna.5220703. [DOI] [PMC free article] [PubMed] [Google Scholar]
- Zahler NH, Sun L, Christian EL, Harris ME. The pre-tRNA nucleotide base and 2′-hydroxyl at N(−1) contribute to fidelity in tRNA processing by RNase P. J Mol Biol. 2005;345:969–985. doi: 10.1016/j.jmb.2004.10.080. [DOI] [PubMed] [Google Scholar]
- Zuleeg T, Hansen A, Pfeiffer T, Schubel H, Kreutzer R, Hartmann RK, Limmer S. Correlation between processing efficiency for ribonuclease P minimal substrates and conformation of the nucleotide −1 at the cleavage position. Biochemistry. 2001;40:3363–3369. doi: 10.1021/bi0016974. [DOI] [PubMed] [Google Scholar]