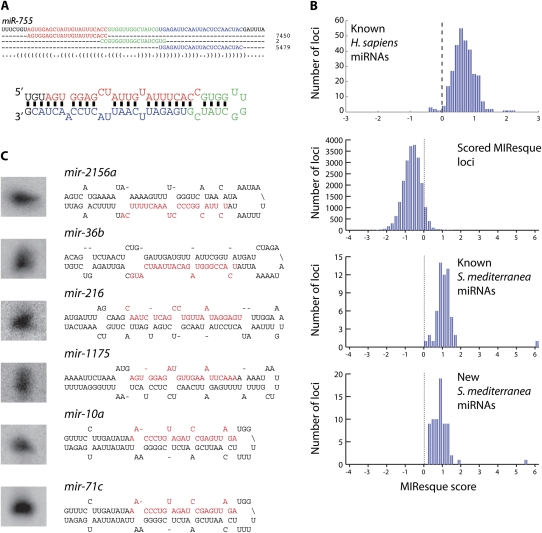
FIGURE 2.
Deep sequencing of planarian miRNAs. (A) Alignment of sequence reads to pre-miR-755. The most frequently obtained mature, loop, and miRNA* strand sequences are highlighted in red, blue, and green, respectively, and the number of total reads obtained for each sequence are shown on the right. The location of these sequences on the secondary structure of the pre-miRNA is depicted below the alignment. (B) Histograms of the MIResque scores for known human miRNAs, all S. mediterranea loci containing clusters of deep sequence reads, known S. mediterranea miRNAs, and new S. mediterranea miRNAs identified in this study. The dotted line indicates the threshold at which a genomic region is considered to be a candidate miRNA locus. (D) Northern blot validation of MIResque predicted miRNAs. The structure for each pre-miRNA is shown on the right.

