

Abstract
The antigen recognition interface formed by T helper precursors (Thps) and antigen-presenting cells (APCs), called the immunological synapse (IS), includes receptors and signaling molecules necessary for Thp activation and differentiation. We have recently shown that recruitment of the interferon-γ receptor (IFNGR) into the IS correlates with the capacity of Thps to differentiate into Th1 effector cells, an event regulated by signaling through the functionally opposing receptor to interleukin-4 (IL4R). Here, we show that, similar to IFN-γ ligation, TCR stimuli induce the translocation of signal transducer and activator of transcription 1 (STAT1) to IFNGR1-rich regions of the membrane. Unexpectedly, STAT1 is preferentially expressed, is constitutively serine (727) phosphorylated in Thp, and is recruited to the IS and the nucleus upon TCR signaling. IL4R engagement controls this process by interfering with both STAT1 recruitment and nuclear translocation. We also show that in cells with deficient Th1 or constitutive Th2 differentiation, the IL4R is recruited to the IS. This observation suggest that the IL4R is retained outside the IS, similar to the exclusion of IFNGR from the IS during IL4R signaling. This study provides new mechanistic cues for the regulation of lineage commitment by mutual immobilization of functionally antagonistic membrane receptors.
Understanding how undifferentiated cells perceive and integrate signals that affect their developmental program is an important task. Specifically, T helper responses are orchestrated by differentiated cells originating from precursors that acquire their final phenotype under the instruction of professional APCs. Our efforts have focused on observing the synapses formed by T helper precursors (Thps), as opposed to differentiated Th cells, in an attempt to reproduce the molecular events at the initiation of adaptive immune responses rather than their reactivation. As extensively demonstrated (1), only Thps have the potential to translate early signaling events in the adaptive immune responses into permanent epigenetic changes that define their cytokine secretion pattern, and therefore their function. Activation and differentiation of Thps require signaling through three major sets of receptors: the antigen recognition receptor (TCR), accessory or costimulatory receptors (e.g., CD28), and certain key cytokine (and perhaps chemokine) receptors. TCR and costimulatory receptors are necessary for activation, but not sufficient for full Th cell differentiation, whereas cytokine instruction is essential to achieve full in vivo Th skewing (1, 2). TCR and CD28 coreceptors are redistributed during activation and organized in a molecular complex at the interface between the T cell and APC, which is designated the immunological synapse (IS) (3–5).
Mature Th1 and Th2 subsets display differences in IS morphology (6, 7). Although assembly of membrane clusters and the IS clearly optimizes signal transduction downstream of the TCR, leading to mature Th cell activation, the mechanisms by which such assembly contributes to the acquisition of helper function (the secretion of cytokines) remain poorly understood. However, recent studies by our group and others have highlighted the importance of receptor clustering and establishment of membrane asymmetry in the acquisition of specific effector (Th1, Th2, and Th17) (8–11) or memory phenotypes (12, 13). Importantly, Chang et al. have shown that in addition to signaling optimization, synapse formation dictates the segregation of receptors by asymmetrical cell division of precursor cells, and therefore the function of the daughter cells (12). Further, Yeh et al. have shown that this functional segregation may be perpetuated by the class I MHC–restricted T cell–associated molecule, an immunoglobulin superfamily transmembrane protein that coordinates Scrib-initiated polarity (10).
In vivo Th1 differentiation depends on signaling through the IFN-γ receptor (IFNGR), the IL-12 receptor (IL12R), and their downstream transcription factors signal transducer and activator of transcription 1 (STAT1) and STAT4, respectively (1, 14). Mice lacking any of these factors fail to generate type 1 immune responses. IL12R is not expressed by Thps, but is crucial for Th1 maintenance and survival, whereas IFNGR is expressed by these cells and initiates a positive feedback loop of Th1 differentiation. Thus, IFN-γ signaling initiates the Th1 differentiation program and IL-12 perpetuates it (14). Similarly, mature Th2 cells arise after occupancy of the IL4R by its ligand and subsequent activation of STAT6 (15, 16). Both the IFN-γ and IL4Rs undergo trans- and cis-tyrosine phosphorylation of their cytosolic domains by receptor-associated Janus kinases (JAKs). These activated JAK molecules phosphorylate STAT1 (on tyrosine 701 and serine 727) (17) or STAT6, inducing their dimerization and translocation to the nucleus to initiate transcriptional regulation of target genes (18).
Among these target genes are the key transcription factors T-bet and GATA3 required for the execution of the Th1 and Th2 differentiation programs, respectively (1, 16). However, these transcription factors and the cytokines that induce them are nearly absent during the activation of Thps. The other cellular component of the IS, the DC, does not secrete detectable levels of IFN-γ or IL-4 (19, 20). Hence, neither the source of early cytokine signaling nor how the Thp perceives the initial stimuli that initiate lineage commitment are well understood.
We addressed this issue by showing that only the pro-Th1 cytokine receptor IFNGR and not the pro-Th2 IL4R is recruited to the IS upon TCR activation. This corecruitment correlates with Th1 maturation (8). Further, we demonstrated that IL4R signaling leads to the blockade of IFNGR1 recruitment to the IS (and Th2 differentiation). This exclusion of IFNGR1 from the IS also provides a biophysical explanation for the well accepted dominance of Th2 over Th1 differentiation in a cytokine milieu where both IFN-γ and IL-4 are present (14). These observations indicate that localization of receptors influences how T cells acquire effector functions during antigen recognition.
In this study, we have identified STAT1 as one of the molecular components of the IS. We show that STAT1 is recruited to the IS upon TCR signaling, similar to its recruitment to the IFNGR upon ligand occupancy. Unexpectedly, we observed that STAT1 is preferentially expressed and serine (727) phosphorylated (pS727-STAT1) in resting Thps, a posttranslational modification known to be required for successful IFNGR signaling (21–23) and STAT1 transcription. The constitutive phosphorylation of STAT1 in the Thp may explain the preferential mobilization of Th1-like signaling components during T cell activation. Remarkably, pS727-STAT1 molecules are required for optimal Th1 differentiation and recruited to the IS, and they translocate to the nucleus upon TCR signaling. Concomitant with IFNGR dynamics, STAT1 and pS727-STAT1 are blocked in the presence of IL-4. Finally, we demonstrate that in mirroring IFNGR exclusion from the IS by IL-4 signaling and Th2 differentiation, the IL4R is excluded from the IS and polarizes with the TCR only in cells with constitutive Th2 differentiation.
RESULTS
STAT1 and IFNGR1 are corecruited to the IS
We have suggested that an alternative pro-Th1 pathway in which the corecruitment of IFNGR1 and TCR to the IS could elicit IFN-γ–like signaling and tip the T helper balance toward Th1 differentiation (8). Although corecruitment does not require IFN-γ or STAT1, mice deficient for STAT1 (stat1−/−) are severely impaired in their ability to mount Th1 responses (24–27). These observations led us to question whether STAT1 might be mobilized and activated as a functional consequence of the cross talk between IFNGR and TCR signaling pathways.
Thps isolated from 4–6-wk-old OTII transgenic mice were sorted using magnetic bead negative separation, followed by FACS sorting of CD4+CD62LhighCD44lowCD25− T cells from LNs and spleen. DCs were purified using a CD11c magnetic bead positive selection and loaded or not with 1 µM of OVA peptide (323–339 ISQAVHAAHAEINEAGR). After eliminating debris by a density gradient and several washes, both cell populations were mixed, spun down to increase their interaction, fixed, and stained for the markers shown in Fig. 1 a. For all the molecules analyzed in this study, negative control stainings were prepared using genetically deficient Thps (from ifngr1−/−, stat1−/−, and il4ra−/− mice; unpublished data). Imaging of these cells using confocal microscopy revealed that 100 of the 113 Thp-DC clusters (89%) in 2 independent experiments displayed accumulations of TCR toward the interface in the presence of OVA-loaded DCs, but not unpulsed, DCs (unpublished data). Strikingly, STAT1 was recruited to the T cell–DC interface and colocalized with the TCR similar to the IFNGR, as previously reported (8).
Figure 1.

Corecruitment of TCR, IFNGR1, and STAT1 to the IS. (a) Thps were purified from the LNs of young animals by magnetic negative separation using antibody-coupled microbeads and the MACS system, followed by FACS sorting of CD4+CD62highCD25-CD44low cells. These Thps from OTII transgenic mice were mixed with OVA peptide-pulsed DCs, fixed, stained, and imaged for the markers indicated. Shown are pictures of two independent experiments. (b) Sorted Thps were stained and activated by TCR cross-linking with a combination of anti-TCRβ (APC) and goat anti-hamster antibodies (Alexa-647). When indicated, 20ng/ml of recombinant mouse IFN-γ or IL-4 was added to the culture. Cells were fixed and stained with monoclonal antibodies directed against the indicated molecules. For every condition indicated, left images represent the middle optical z section of the cell, and the right image represents the maximum projection for all the z sections of that cell. Images in the figures were processed to exclude out-of-focus pixels with the nearest neighbors deconvolution method. Shown are pictures of four independent experiments. Bars, 3 µm.
To circumvent signal noise originating from DCs (that express variable levels of IFNGR and STAT1; unpublished data), as well as any variability in the DC maturation status, subset composition, antigen load, and in situ cytokine secretion, T cells were activated by TCR cross-linking using monoclonal antibodies. In our hands, the cross-linking of TCR molecules on Thps recapitulates with high fidelity the multifocal aggregation of receptors observed in DC-Thp synapses observed in our experiments, while offering a clean system for quantification purposes. The prototypical concentric organization in supramolecular activation complexes is rarely observed in our Thp-DC co-cultures. Accordingly, Brossard et al. (28) have also described that the synapses formed by naive T cells and DCs are different from those formed by mature Th cells and B cells. These and other studies suggest that when antigen presentation is abundant (like in our cultures), synapses formed by Thps are multifocal and very dynamic, with both cellular components being highly motile in complete media, collagen matrixes (unpublished data), and in vivo (28–30).
Fig. 1 b shows a typical example of Thp activation by cross-linking, where the TCR and IFNGR1 are uniformly distributed at 0 min and rearranged in discrete regions of the surface 30 min after activation. Here again, STAT1 was recruited to TCR- and IFNGR1-rich regions of the membrane.
We quantified these images with an improved version of the “linearization” of the cell surface method (8). In our previous study, linearization of the cell surface was achieved by drawing regions around the single middle z axis optical section (z section) to include the plasma membrane and the adjacent cytoplasm of every cell to (line)scan their content within fluorescent markers (Fig. S1). An example of this traditional method is shown in Fig. 2 a (bottom), where the pixel intensities of the given markers (y axis) were plotted according to their position in the region (105 positions at the middle plane; x axis). Before activation (0 min), the distribution of the markers was uniform and the majority of positions scored low pixel intensities. After activation (30 min), the corecruitment of these molecules is translated by the single-peak appearance of the slopes and the condensation of the fluorescence in discrete areas of the histogram. To obtain a quantitative measure of the relationship between the distributions of the different molecules, their correlation coefficient was calculated (ρ; see Materials and methods for a detailed description). The usage of ρ normalizes the variability in expression (or pixel counts) of the different molecules by yielding values independent from scale and origin ranging from −1 to 1 (−1 ≤ ρ ≤ 1). Thereby all z sections, cells, and experiments can be cross-compared. A value of ρ = −1 reflects inverse correlation; ρ = 0 reflects no correlation; and ρ = 1 reflects complete correlation. In Fig. 2 a, ρ was calculated for the distributions of STAT1/IFNGR1, IFNGR1/TCR, and STAT1/TCR before and after activation (0.33, 0.37, 0.32–0.78, 0.80, and 0.89). This traditional linearization analysis corresponded only to the middle z section of the cell (plane z = 20 of 40), thereby excluding large portions of the membrane. Hence, we improved the quantification method to analyze the totality of the cell surface, ∼40 optical z sections (0.5 µm). 41–105 positions were scanned per z section. The bottom and top z sections are smaller and contain fewer scanned positions, whereas the middle z sections are larger. The graphs in Fig. 2 a (top) represent surface scanning of the entire cell in a concatenated view where every 41–105 positions in the x axis represents one z section. Every z section displays a very similar pattern to the z = 20 plane, with uniform low pixel counts for TCR, IFNGR1, and STAT1 before activation and binary distributions after activation, where most positions scored either high or null values of pixel intensities, thus reflecting the polarized nature of the surface of these cells. Notably, the cytoplasm of Thps is extremely small and our analysis most likely includes the majority of it.
Figure 2.

Quantification of TCR, IFNGR1, and STAT1 corecruitment. (a) Linearization of the cell membrane. Schematic representation of the redistribution of membrane receptors on the surface of Thps before and after activation (top). Regions around the cell surface were drawn and scanned using the Metamorph software to obtain the mean pixel intensities of the membrane-bound markers analyzed with their x, y coordinates in all z planes of every cell. Top histograms depict the totality of z sections of one cell where pixel intensities (y axis) were plotted according to their position in a concatenated fashion, with one z section per every 40–100 positions in the x axis. Bottom histograms represent the middle z section of the cell (z = 20) where pixel intensities were plotted according to their position in the region (x axis, 100 positions scanned). STAT1, red; IFNGR1, green; and TCR, purple. (b) Corecruitment analysis by whole cell linearization of the cell surface and correlation plots. In these correlation plots where every dot represents the value of correlation between the distributions of STAT1 and IFNGR1 (left) or STAT1 and TCR (right) in the y axis and TCR and IFNGR1 on the x axis in one z section of a particular cell. This analysis results from combination of four independent experiments.
This improved linearization analysis multiplied the amount of information available from a single cell by ∼200-fold and allowed us to measure ρ for all cell planes (Fig. S2). Fig. 2 b shows the correlation values based on “whole-cell linearization” analysis from four individual experiments accumulating 89–92 cells and 10–40 z sections per cell. Values of ρ are shown as correlation plots, where every point represents one z section (n = 1,840–2,670). In this familiar dot plot–like representation, it is clear that before activation all molecules are independently dispersed as indicated by low correlations in the STAT1/IFNGR1 (y axis) and TCR/IFNGR1 (x axis) distributions. Only 11 and 6% of cell z sections scored ρ ≥ 0.8, respectively. A score of the correlation coefficient >0.8 is generally considered strong, whereas a correlation <0.5 is generally described as weak. For ρ ≥ 0.8, ρ2 = 0.64 (square of the coefficient), which means that 64% of the total variation in the y axis can be explained by the linear relationship between x and y. The association between STAT1 and the TCR before activation is minimal, with only 9% of cell sections with ρ ≥ 0.8 (bottom left). After 30 min, Thps have capped their TCR, IFNGR1, and STAT1 molecules, as reflected by the “double-positive” aspect of the correlation plots where 40, 42, and 46% of z sections scored ρ ≥ 0.8 for STAT1/IFNGR1, STAT1/TCR, and TCR/IFNGR1 distributions, respectively. In the presence of IL-4, this corecruitment is inhibited, and ρ values resemble those obtained before activation (3–9% of cell sections have ρ ≥ 0.8). When averaged on a per cell basis, these correlation plots retain the previously described properties (Fig. S2). This new type of analysis and representation provides a quantitative and statistically rigorous examination of the distribution of receptors in the whole surface of a cell both on an individual and population scale. These results confirm with high confidence the recruitment of IFNGR to the IS and reveal STAT1 as a new member of this macromolecular complex.
Phosphorylation status of STAT1 during T cell development, activation, and differentiation
We showed in a previous work (8), as well as in this study, that IFNGR and STAT1 can be mobilized during T cell activation in the absence of IFN signaling, suggesting that this pro-Th1 stimulus can be triggered by TCR engagement alone. To test whether STAT1 expression and phosphorylation at the two known major sites, tyrosine 701 (pY701-STAT1) and serine 727 (pS727-STAT1), varied during T cell development and differentiation, we compared double-positive thymocytes (DPs), Thps, Th0, Th1, and Th2 cells for the expression of these molecules. DPs were purified by FACS sorting of CD4+CD8+CD11c−CD11b−DX5−γΔTCR−B220−CD19− thymic cells. CD4+CD62LhighCD25− Thps were purified using magnetic negative separation complemented by cytofluorometric sorting (>99% pure). Thps were differentiated in vitro using standard protocols to induce Th0, Th1, and Th2 differentiation (see Materials and methods). Fig. 3 a shows a representative experiment where the levels of expression of STAT1 vary significantly at different stages of T cell development and differentiation (see quantification in Fig. S3). Thps express markedly higher levels of STAT1 than thymic DP precursors or Th subsets (between 1.2- and 170-fold higher). Interestingly, DPs and Th2 cells expressed very low levels of STAT1 (174- and 67-fold less than Thps, respectively) and only prolonged exposures of the blots allowed their visualization (bottom), whereas Th0 and Th1 cells display 30–50% reductions. To our surprise, pS727-STAT1 expression in Thps was detectable and preceded any activation, whereas its presence was barely detectable in DP and Th cells. As negative and positive controls, we used extracts from stat1−/− or wt Thps incubated in the presence of IFN-γ or not (Fig. 2 a and Fig. S4). Although IFN-γ only variably increased pS727-STAT1 levels, it was however, required for STAT1 tyrosine phosphorylation, as expected. The disparity in the capacity of IFN-γ to induce pY701-STAT1 at different T cell activation stages has been observed before and can be explained by the down-regulation of IFNGR expression after T helper differentiation or the increased expression of SOCS inhibitors (31–33). Our sorting strategies for the aforementioned experiments cannot exclude the presence of small numbers of central memory T cells (TCM) among the CD4+CD62LhighCD25− T cells. Further, serine phosphorylation has been demonstrated to be very sensitive to cell stress and manipulation. These considerations raised the possibility that the increased levels of pS727-STAT1 observed in Thps may correspond to contaminating TCM or an artifact resulting from extensive manipulation caused by magnetic and FACS sorting. To circumvent these problems and confirm preferential STAT1 and pS727-STAT1 expression by Thps, we performed intracellular stainings of STAT1 (unpublished data) and pS727-STAT1 on freshly isolated LN cells. These cells were washed once with cold PBS and immediately fixed with PFA and methanol. These procedures were done at 4°C in ∼7 min. Fig. 3 b shows the gating strategy for Thps and the expression of pS727-STAT1 in Thps from both WT and STAT1-deficient mice, confirming that the population of CD4+CD25−CD44lowCD62Lhigh Thps expresses pS727-STAT1. Therefore, T cell maturation does not induce sustained STAT1 activation, but rather is accompanied by a selective loss in STAT1, pS727-STAT1, and IFN-γ–inducible pY701-STAT1 expression, suggesting that only Thps, but not thymocytes or activated Th cells, have the capacity to respond to STAT1-activating stimuli.
Figure 3.

Phosphorylation status of STAT1 during T cell development differentiation and activation. (a) STAT1 and phospho-STAT1 analysis on DP thymocytes, Thp, and Th cells. Cells were isolated from the thymus, spleen, and LNs of young animals. Thps were purified by magnetic bead negative selection and flow cytometry and activated using Th0 (0, with IL-2), Th1 (1, with IFN-γ, IL-2, and anti-IL4), and Th2 (2, with IL-4 and anti-IFN-γ) conditions. In parallel, DPs were sorted by flow cytometry as in Materials and methods. All cell types (except for DPs) were left untreated (–) or incubated with IFN-γ(+) for 30 min before cell lysis. Cells lysates were analyzed by Western blot, and two different time exposures of the blots are shown. The sizes of the corresponding fragments are indicated in parenthesis. Quantification was achieved by densitometric analysis of the blots. The values shown correspond to the percentage relative to the highest density normalized to each individual HSP90 control (see Materials and methods). Shown are blots representative of two independent experiments. (b) Intracellular staining of pS727-STAT1. LN cells were harvested, rapidly fixed, and permeabilized. Cells were labeled for the markers indicated and analyzed using flow cytometry. Shown are blots representative of four independent experiments. (c) STAT1 and phospho-STAT1 analysis on Thps. Thps were purified using the aforementioned method and incubated in complete medium and culture conditions in absence (–) or presence of TCR stimuli (TCR) or IFN-γ (+, 20 ng/ml). Shown are blots representative of three independent experiments.
To study in more detail the origin and regulation of preexisting expression of pS727-STAT1 in Thps, we compared the status of STAT1 in WT, IFNGR1, or IFNAR1-deficient cells. Fig. 3 c shows one representative experiment of three where protein extracts from wt, ifnar1−/−, or ifngr1−/− Thp display comparable STAT1 content. This pattern is not altered by IFN-γ (Fig. S4). Again, pS727-STAT1 was observed before activation and independent of IFN signaling as purified IFNGR1- or IFNAR1-deficient Thps contain levels of this phosphoform equivalent to wt. The variability noted in IFN-γ–inducible pS272-STAT1 may correspond to the use of different mouse control strains B6 (ifngr1−/−) and BALB/c (ifnar1−/−). Finally, TCR signaling did not affect STAT1 phosphoform expression. Hence, Thp activation controls STAT1 through its physical mobilization to the IS and not through controlling its tyrosine or serine phosphorylation status.
Role of IFNGR1, STAT1, and pS727-STAT1 in Th1 differentiation in vitro
The importance of IFN-γ and STAT1 signaling in cellular immune responses has been highlighted in multiple in vivo systems (17, 34). However, it has been suggested that Th1 differentiation can occur in the absence of IFN-γ stimulus (35). Isolating the contribution of IFNGR signaling in Th differentiation during in vivo responses can be challenging, as antigen clearance requires activation of multiple components of both adaptive and innate immune responses that are also dependent on IFNGR signaling (B cells, CD8 T cells, macrophages, etc). In vitro studies using purified naive T cells have clearly established that IFN-γ alone, independent of IL-12 or IL-18, can induce full Th1 differentiation (36, 37). To evaluate the contribution of the IFNGR1, STAT1, and pS727-STAT1 to Thp differentiation in the absence of exogenous cytokines, we isolated Thps from IFNGR1- or STAT1-deficient animals and mice bearing a serine 727 to alanine point mutation of STAT1 (STAT1-S727A) that abolishes STAT1 serine phosphorylation at this site (38). Sorted CD4+CD62LhighCD25−CD44low Thps were activated in vitro using monoclonal antibodies against CD3 and CD28 and assessed for their cytokine secretion potential. Between 60 and 73% of wt T cells secreted robust levels of IFN-γ in vitro after activation. In contrast, only 25–36% of IFNGR1-deficient and STAT1-S727A mutant Thps could differentiate into IFN-γ producers under these conditions (Fig. 4 a). Remarkably, in STAT1-deficient animals the secretion of IFN-γ was completely abolished, showing the impact of this signaling pathway in Th differentiation. Concurrently, a twofold increase in IL-4–producing T cells from Ifngr1−/− LNs was observed when compared with the WT control, whereas Thps from STAT1 mutants and deficient mice did not display any significant differences in IL-4. Although these robust levels of Th1 differentiation were observed in C57BL/6-background Thps and might not be comparable to T cells from other strains, we can conclude that IFNGR1 and pS727-STAT1 signaling accounts for at least half of the Th1 differentiation program of Thps in the absence of exogenous cytokines.
Figure 4.

Role of IFNGR and STAT1 during in vitro Th1 differentiation and pS727-STAT1 involvement in the IS. (a) CD4+CD62LhighCD25− Thps from wt or ifngr1−/− mice were purified by magnetic bead separation, followed by flow cytometric sorting. Plate-bound anti-CD3 and anti-CD28 were used to activate cells, and after 5 d in culture the production of cytokines was evaluated by ICS and flow cytometry. Shown are results representative of six independent experiments. (b) Cells were sorted by negative selection of CD4+ T cells, activated by cross-linking of their TCRs, fixed, and stained as indicated, and images were acquired and treated (deconvolution) as in Fig. 1 (of four experiments; n = 73–83). Bars, 2 µm.
Recruitment to the IS and translocation to the nucleus of pS727-STAT1 upon Thp activation
To exert transcriptional regulation, STAT1 must translocate to the nucleus (36). The analysis of total STAT1 localization revealed very little nuclear translocation in Thps, even in the presence of activating stimuli (IFN-γ or TCR ligation; Fig. 2 a). We hypothesized that the assessment of the localization of STAT1 phosphoforms, which constitute only a fraction of STAT1, might provide a more accurate notion of its activity, as they represent a more terminal product of the signaling cascade. Because the level of pY701-STAT1 expression is very low in Thps and not affected by TCR signaling (previous paragraph), we focused on the behavior of pS727-STAT1.
The majority of resting Thps display uniform surface arrangement of IFNGR1 and TCR (Fig. 4 b; 4 independent experiments; n = 73–83). The distribution of pS727-STAT1 is similar in that its localization is dispersed across the cytoplasm, although some variability in the size and density of enriched foci can be observed. Our images showed no colocalization between the membrane-bound IFNGR1 (or TCR; unpublished data) and pS727-STAT1 in resting Thps, suggesting no preassociation among these molecules. TCR-induced activation led to the redistribution and cocapping of IFNGR1 and TCR. Strikingly, pS727-STAT1 was redistributed to two major sites, the IS and the nucleus (after 30 min of activation).
We quantified this recruitment by determining ρ values as in Fig. 3 (by whole-cell linearization of the cell surface) for the membrane-bound portions of pS727-STAT1, IFNGR1, and TCR (Fig. 5). Additionally, we performed a classical colocalization analysis of pS727-STAT1 and nuclear staining to assess nuclear translocation. Results in Fig. 5 a show that, similar to STAT1, correlations between pS727-STAT1 and IFNGR1 (pS727:IFNGR1), IFNGR1:TCR, and pS727:TCR distributions under resting conditions are weak, with only 0.05, 0.6, and 0.7% of cell sections scoring ρ ≥ 0.8 (double negative). This proportion markedly increased to 21, 25, and 30%, respectively, of z sections above ρ ≥ 0.8 after Thp activation (double positive). To determine the degree of nuclear translocation, regions containing the totality of each cell (per Z section) were scanned for the presence of pS727-STAT1 and DAPI staining (Fig. S5). We used the Metamorph software to calculate the overlap of pS727-STAT1 and nuclear staining. At baseline, ∼25% of pS727-STAT1 molecules overlapped DAPI+ regions (Fig. 5 b). Activation of T cells induced translocation of pS727-STAT1 to the nucleus and increased the amount of colocalization to 50%. This translocation was comparable to our positive control, in which cells were incubated in the presence of IFN-γ, a condition known to initiate STAT1 shuttling to the nucleus.
Figure 5.

Quantification of pS727-STAT1 localization. (a) Corecruitment assessment by whole-cell linearization method and correlation plots. As in Fig. 2, the distributions of the TCR, IFNGR1, and pS727-STAT1 (pS727) were obtained by scanning the content of regions created around the surface and subjacent to the plasma membrane of every cell (n = 73–83) for the calculation of ρ between the distribution of these markers. The correlation plots represent the pool of z sections (n = 1,980–2,490). (b) Translocation of pS727-STAT1 (pS727) to the nucleus. To obtain a numerical value representing the degree of superposition between pS727-STAT1 and DAPI stainings, a Metamorph built-in colocalization tool was applied to every cell by drawing regions that include the totality of each cell (membrane, cytoplasm, and nucleus). The results are expressed as the percentage of integrated surface of pS727-STAT1 that overlaps DAPI staining on a per cell basis (mean of all the z sections). The analysis herein combines observations of four independent experiments.
IL-4 inhibits IFNGR1, STAT1, and pS727-STAT1 mobility after Thp activation
We have reported that IL-4 treatment of Thp prevents association of INFGR to the IS (8). As shown in Fig. 2, treatment with IL-4 also inhibits STAT1 recruitment, whereas the capping of the TCR was not affected. Quantification of cocapping by calculating ρ revealed poor correlation in the distribution of STAT1/IFNGR1 and TCR/IFNGR1 after incubation with IL-4 (Fig. 3 b). Similarly, pS727-STAT1 redistribution to the IS and nucleus was also impaired by IL-4 treatment and comparable to resting conditions (Figs. 5 and 6). Thus, IL-4 signaling inhibits the mobilization of IFNGR1, STAT1, and pS727-STAT1 toward the IS.
Figure 6.

IL4R is recruited to the IS in the absence of IFNGR1 or STAT1. Thps were isolated by negative magnetic separation from the LNs of young animals of different genetic backgrounds (B6, ifngr1−/−, 129, and stat1−/−). CD4+CD62Lhigh T cells (98% pure) were activated, fixed, and stained as indicated, and then imaged as described in Fig. 1. (a) Confocal images. Bars, 4 µm. (b) Quantification by linearization of whole-cell surface. Four independent experiments were analyzed, and the mean of ρ was calculated for each cell (n = 88–114), as in Fig. 2.
IL4R corecruitment with the TCR in the absence of IFNGR1, STAT1, and NFATc2 and c3
We have shown that among several cytokine receptors, only IFNGR and, to a lesser extent, IL2R gain access to the IS. Interestingly, the IL4R remains in the periphery even in the presence of IL-4 or the complete absence of IFN-γ (8). Because TCR-IFNGR1 corecruitment to the IS correlates with a Th1 phenotype, it was possible that in Thp isolated from Th2-prone mice, the IL4R might similarly be recruited to the IS. We selected three genetic models of defective Th1 differentiation and pro-Th2 phenotype in vivo, IFNGR1-, STAT1-, and NFATc2– and c3–deficient mice (nfatc2/c3−/−) (34, 39, 40).
Fig. 6 a shows representative cells that were observed in 4 independent experiments (88–114 cells per condition). At rest, cells from all genetic backgrounds display uniform distributions of TCR, IFNGR1, and IL4RA. Activation of Thp led to the cocapping of the TCR and IFNGR1, regardless of the genetic background. In contrast, the distribution of IL4R changed depending on the integrity of the IFNGR–STAT1 signaling pathway. In wt cells, IL4R is not a part of the IS. However, in ifngr1−/− or stat1−/− Thps, TCR activation results in corecruitment of TCR and IL4R. Quantification of this phenomenon by the method of linearization and ρ calculation corroborated previous results and showed that in normal cells, TCR and IL4R distributions were poorly correlated, whereas in stat1−/− and ifgnr1−/− Thps, 33 and 20% of cells displayed ρ ≥ 0.8 (Fig. 6 b; mean of z sections per cell). Hence, in the absence of a pro-Th1 genetic background, the IL4R is actively recruited to the IS.
Mice lacking both the NFATc2 and NFATc3 transcription factors (nfatc2/c3−/−) have very high levels of circulating IL-4, IgG1, and IgE and succumb to severe autoimmune allergic and inflammatory conditions (39, 40). Thps from these mice exhibit constitutive differentiation to the Th2 subset even in the absence of IL-4, as indicated by the spontaneous Th2 differentiation of triple-deficient Thps (nfatc2/c3/il4−/−). This cytokine-independent pathway of Th2 differentiation mirrors the IFN-γ–independent Th1 differentiation we observed in wt Thp, and hence offers an ideal system to compare the behavior of these functionally opposing cytokine receptors. Thps were sorted from wt or nfatc2/c3−/− mice, activated, and observed using the aforementioned methodology. We observed in two independent experiments (n = 93–145; Fig. 7 a) that on Thps isolated from Th2-prone nfatc2/c3−/− animals, the IL4R and the TCR colocalized and were almost completely superimposed after activation when compared with the wt control. The quantification of these images confirmed the increase of ρ between TCR and IL4R distributions only in nfatc2/c3−/− Thps after activation. This result extends the previous observations on naturally occurring Th2-prone Thps (lacking IFNGR1 or STAT1) and provides another example of recruitment of the IL4R to the IS.
Figure 7.

IL4R is recruited to the IS in the absence of NFATc2 and NFATc3. Thps were isolated prepared as in Fig. 1 from the LNs of young WT or NFATc2c3 double-deficient mice. Thps were activated, fixed, and stained as indicated, and imaged as described in Fig. 1. (a) Confocal images. Bars, 4 µm. (b) Quantification by linearization of whole-cell surface. Two independent experiments were analyzed and the mean of ρ was calculated for each cell (n = 93–145), as in Fig. 2.
DISCUSSION
We have demonstrated that conditions promoting optimal Th1 differentiation lead to corecruitment of STAT1, pS727-STAT1, TCR and IFNGR1 into the IS, and that this corecruitment is inhibited by Th2-inducing signals. The expression of high levels of STAT1 and pS727-STAT1 selectively in the progenitor Th cell may have arisen to guarantee “Th1 readiness” in the setting of microbial invasion. In cells with defective pro-Th1 signaling cascades, the opposing cytokine IL4R migrates to the IS.
Th1-ness of naive Th cells
The stimulus responsible for the very earliest induction of IFN-γ after Thp activation has remained elusive. Here, we suggest that this stimulus may be Thp activation itself, as TCR engagement elicits IFN-γ–independent mobilization of IFNGR, STAT1, and its posttranslationally modified isoform, pS727-STAT1 (8). Our studies show that in the absence of supplementary cytokines in vitro, Thps display a natural tendency to differentiate along the Th1 pathway in an IFNGR-dependent manner (Fig. 4). The Th1-ness of naive T cells might be explained by their remarkably high expression of STAT1 and pS727-STAT1 (Fig. 3) when compared with DP thymocytes or mature Th cells. S727-phosphorylated STAT1 has been described as a primed monomeric form of STAT1 that may precede Y701-phosphorylation and is required for IFN-α/β and IFN-γ biological responses (22, 38). More recent studies have shown that STAT1 requires preassembly into chromatin-associated transcriptional complexes to become S727-phosphorylated and fully biologically active in response to IFNs (41). However, these studies did not assess the phosphorylation status of STAT1 in different tissues, and especially Thps. Further, other reports have shown that STAT1 can shuttle between the cytoplasm and nucleus independently of IFN stimulation and Y701 phosphorylation (42). Our observations are consistent with a model in which STAT1 is “primed” in Thps and shuttles in and out of the nucleus and is retained during IFN or TCR signaling. Additional experiments are required to investigate the expression of STAT1 at other stages of the differentiation process (after activation and thymic maturation).
Cross talk between the TCR and IFNGR pathways
We have shown TCR, IFNGR, STAT1, and pS727-STAT1 inclusion into the IS on naive Th cells (Figs. 1, 2, 4, and 5). Skrenta et al. have also observed some degree of physical association of these receptors by showing IFN-γ–independent internalization of IFNGR after TCR engagement (32), suggesting that these two pathways share signaling termination strategies. Capping and internalization of IFNGR seemingly occurs through the aggregation of lipid rich microdomains, a phenomenon that is also necessary for optimal TCR signaling and down-regulation (43, 44). STAT transcription factors, including STAT1, have also been shown to reside in lipid rafts (45, 46). Hence, there is evidence that all components we have identified to confer “Th1-ness” are localized in the same physical structure.
This physical association between the TCR and IFNGR pathways correlates with known pro-Th1 qualities of T cell activation. Serine phosphorylation of STAT1 is required for full STAT1 activity (21, 38) and plays an important role in linking signaling through these two receptors, as they both induce the activation of mitogen-activated protein kinase (MAPK) p38, which is the putative kinase upstream pS727-STAT1. Blockade of IFNGR or TCR signaling with PKC/PI3K or p38 MAPK inhibitors reduces STAT1-mediated gene transcription via the inhibition of this phosphoform (14, 17, 47, 48).
In contrast, our data indicate that naive circulating Th cells express pS727-STAT1 and that only IFNGR, but not TCR, signaling elicits a modest increase of this phosphoform. These differences may be explained by the choice of cell model used in our experiments; all cells were purified, freshly isolated T cells and not transformed cell lines. However, we cannot exclude the possibility that TCR signaling regulates pS727-STAT1 in vivo, resulting in saturating levels of pS727-STAT1 in Thp ex vivo that cannot be further increased. TCR “tickling” or in vivo nonproductive continuous TCR self-recognition by Thps is required for their survival (49). This low-affinity stimulus induces CD3ζ chain phosphorylation, involves NFκB signaling (50), and may account for STAT1 serine phosphorylation. Another possible source of pS727-STAT1 in vivo is baseline cytokine signaling through IL7R (49, 51) and IL2Rβ (that can directly interact with STAT1) (52). Both IL-2– and IL-7–induced T cell proliferation use p38 MAPK (53). Hence, the same mechanisms that control T cell homeostasis may also be responsible for ensuring an available pool of pS727-STAT1 to prime circulating Thp for rapid activation of STAT1-driven gene expression.
Cytokine receptor exclusion from the IS
IL4R–STAT6 signaling induces the exclusion of the IFNGR from T cell receptor–rich platforms (Figs. 1, 2, 4, and 5). Here, we provide evidence for functional consequences of this phenomenon by showing inhibition of STAT1 mobilization to TCR/IFNGR-rich clusters in the presence of IL-4. Further, we demonstrate that the IL4R can gain access to the IS in cells with deficient Th differentiation (Figs. 7 and 8). Pathological situations where TCR and IL4R might colocalize exist. Individuals with inactivating mutations of IFNGR1 or STAT1 have a severely impaired capacity (often lethal in children) to mount immune responses against intracellular pathogens, including mycobacteria and viruses (54–58). IFNGR down-regulation is generally observed in activated T cells and considered an essential mechanism of avoidance of antiproliferative and proapoptotic effects of IFN signaling (31, 59, 60). In patients with metastatic melanoma, i.v. administration of IFN-α leads to rapid induction of JAK/STAT inhibitors, which are the suppressor of cytokine signaling (SOCS) on PBMCs (61). Similarly, asthmatic patients have elevated expression of SOCS-3 in their peripheral CD3+ T cells, correlating with the severity of the disease. Further, in transgenic SOCS-3 mice, T cells are biased to the Th2 phenotype (62). Therefore, impairment of IFN signaling pathways by SOCS proteins may represent another condition in which IL4R and TCR may colocalize under physiological conditions. However, more experiments are required to test this hypothesis.
Figure 8.

Model of receptor exclusion from the IS. (top) IFNGR, TCR, Stat, phospho-STAT1, JAK3, and eventually the common γ chain (γc) colocalize after TCR signaling. Under these conditions, inhibitors could mediate the exclusion of IL4R from the IS. (middle) IL-4 signaling blocks the recruitment of IFNGR, STAT1, and phospho-STAT1 to the TCR-rich regions of the membrane. This phenomenon could be mediated by association of inhibitors to the IFNGR and/or recruitment of γc-JAK3 to the IL4R complex. Bottom panel. In the absence of pro-Th1 molecules, IFNGR, or STAT1, the IL4R is licensed to enter the IS to induce Th2 differentiation.
We are not aware of previous reports in lymphocytes where functional antagonists mutually regulate each other’s signaling potential by controlling receptor mobilization and hence activating capacity. Further, despite the large body of research on vertebrate JAK–STAT pathways, there is little precedent pointing toward polarized signaling. In a recent study, Sabatos et al. (63) identified polarization of phospho-STAT5 upon IL-2 paracrine secretion among T cells. Along with our results, these data suggest that STAT signaling may generically operate in a polarizing fashion in T cells. In invertebrates, Sotillos et al. (64) recently found that preassembly of this complex to discrete membrane domains primarily benefits signaling efficiency in Drosophila epithelial cells. In this same model, establishment of membrane asymmetry dictates unequal distribution of fate determinants like Numb, Pon, and Neuralized, which are a fundamental mechanism underlying cell specification after asymmetrical cell division (65–69). T cells express the mammalian homologues of the proteins involved in asymmetrical cell division (70–72) and have been shown to divide asymmetrically, a process that determines their fate as effector or memory cells (12). Importantly, confirmation of IFNGR capping in the IS has been provided from these studies and suggests that daughter cells that are proximal to the IS retain IFNGR molecules. Therefore, these cells also retain IFN-γ sensitivity and function as effectors by limiting bacterial burden in vivo (12). Further studies are required to evaluate whether this same principle can be applied to Th2 cells that fail to polarize their IFNGR during activation and to determine whether both effector versus memory and Th cell differentiation are determined during synapse formation.
Huang et al. (73) found that ifngr1−/− T cells have increased levels of STAT6 phosphorylation and association with the IL4R, providing evidence for the constitutive inhibition of IL4R–STAT6 signaling by IFNGR. Zhu et al. (74) have also reported that constitutive STAT6 inhibition early during T cell activation and signaling through the IL2R, IL6R, and IFNAR was inhibited by TCR engagement. These authors further demonstrated that calcineurin and PCK inhibitors known to decrease TCR-driven IFN-γ production increase STAT6 phosphorylation during TCR and IL4R signaling. However, the mechanisms underlying these intriguing phenomena have remained uncertain. We hypothesize that receptor exclusion from the IS is mediated by sequestration of activating or inhibiting cofactors between IL-4 and IFNGRs (Fig. 8).
TCR signaling also intersects with IL4R signaling. TCR stimulation has been reported to activate the common γ chain (γc)–associated JAK3 (75). Our preliminary data show the presence of this important component for IL-2 and IL-4 signaling in the IS (Fig. S6). Additionally, cross talk between the JAK–STAT pathway, Erk, and PI3K has been demonstrated in Jurkat cells during IL-4 signaling. In this system, inhibition of Erk, PI3K, and Ras leads to inhibition of STAT6 activity (76). These observations suggest that IL4R and TCR signaling pathways compete for multiple components. These complexes often operate as multitasking platforms that result from the association of several molecules. Mobilization and sequestration of γc–JAK3–STAT–PI3K complexes could explain the inability of IL4R to enter the synapse and the transient inhibition of IL-4 signaling observed in Thp (74). Notably, we have shown partial IL2RA/TCR cocapping during T cell activation, suggesting another level of competition for γc-JAK3 between the IL2R in the IS and the IL4R. A reciprocal mechanism of inhibitor exchange could be accomplished by a swap of SOCS proteins. socs1−/− mice succumb to severe lymphopenia and multiorgan degenerative macrophage infiltration. Strikingly, double-deficient ifng/socs1−/− mice survive up to a year, and socs1−/− T cells display sustained IFN-γ–IL-4 signaling with impaired IFN-γ inhibition of IL-4 production (77). In addition, TCR signaling controls SOCS1-mediated cytokine signaling inhibition during positive selection of thymocytes (78). Both IFNGR and IL4R can bind SOCS proteins, thereby outcompeting JAK kinases. Exchanging adaptor molecules between receptors would allow mutual inhibition and restrict signaling to a single pro-Th cascade.
The observation that in nfatc2/c3−/− Thp the IL4R enters the IS after TCR triggering is intriguing. NFATs are expressed early in T cell development (79) and regulate TCR-mediated IL-4 gene transcription, and the absence of NFATc2 and NFATc3 leads to constitutive nuclear localization of NFATc1 (40, 80). However, how these molecules modulate the arrangement of membrane receptors is unclear. NFATc2 or NFATc3 regulate the expression of JAK2 that phosphorylate STAT1, and thus affect its transactivation during IFNGR signaling (unpublished data).
Concluding remarks
Establishment of membrane asymmetry plays an essential role the in acquisition of effector versus memory capacities of T cells by unequal segregation of signaling molecules into daughter cells after cell division (12). Remarkably, this process is dependent on and subsequent to antigen presentation and IS formation, suggesting that in addition to controlling cell differentiation into major Th subsets, the IS directs the establishment of immunological memory. Exclusion of cytokine receptors from the IS may represent a general mechanism of specific inhibition by functionally opposing or competing signaling cascades similar to the mechanisms of cell polarity establishment mentioned above. We propose that the widely known inhibitory effect of IL-4 over pro-Th1 stimuli can be explained by the blockade of IFNGR and STAT1 mobilization. Reciprocally, the sole presence of IFNGR or STAT1 suffices to impede IL4R inclusion into the IS, and presumably its participation in the Th2 differentiation program. This latter result is particularly relevant in physiological situations where levels of IFNGR or STAT1 are naturally low, such as in activated Th1 (31) and Th2 cells (Fig. 3), respectively.
These observations suggest that similar to invertebrate cells, the fate and differentiation program of mammalian T cells is regulated through the organization of membrane topography and receptor mobilization, wherein inclusion or exclusion from compartmentalized supramolecular structures affects the integrity of signaling cascades.
MATERIALS AND METHODS
Mice and cells.
Mice of the following backgrounds were obtained from The Jackson Laboratory or Taconic Farms: C57/B6, 129s6/SvEv, BALB/c, ifngr1−/−, stat1−/−, and il4ra−/−. Ifnar1−/− mice were provided by H. Cantor (Dana-Farber Cancer Institute, Boston, MA). Stat1-s272a mutants were provided by T. Decker (University of Vienna, Vienna, Austria). All mice were bred and maintained, and all animal experimentation was approved, in accordance with guidelines and approval of the Harvard University Institutional Animal Care and Use Committee.
Naive Thps were isolated from single-cell suspensions of LNs and/or spleens of young mice of different genetic backgrounds and enriched using MACS magnetic negative selection (Miltenyi Biotec) with a cocktail of microbead-coupled antibodies directed against CD8, CD11b, CD11c, CD19, B220, DX5, MHCII, and TER119. Alternatively, cells were sorted using an automated RoboSep machine and an EasySep CD4+ T cell enrichment kit (StemCell Technologies). When indicated, cells were stained with anti-CD4 APC-Alexa Fluor 750 (RM4-5; Invitrogen), CD25-PerCP (PC61; BD), and CD62L-APC monoclonal antibodies (MEL-14; BD) and subjected to further purification of CD4+CD25lowCD62Lhigh naive T cells using a FACSAria system (BD). DPs were purified from thymic single-cell suspension by flow cytometry (see above) of CD4+CD8+CD11c−CD11b−DX5− γΔTCR−B220−CD19− cells.
Antibodies and reagents.
Primary antibodies: FITC/APC-coupled hamster anti–mouse TCR-β (H57; BD and BioLegend), FITC-coupled rat anti–mouse IFNGR1 (GR20; R. Schreiber, Washington University School of Medicine, St. Louis, MO; conjugated in our laboratory), biotinylated hamster anti–mouse IFNGR1 (2E2; obtained from BD or R. Schreiber), PE-coupled rat anti–mouse IL4R (M1; BD), rabbit anti–mouse STAT1, rabbit anti–mouse phosphotyrosine 701-STAT1 (58D6), rabbit anti–mouse phosphor-serine727-STAT1 (all from Cell Signaling Technology). Goat anti-JAK3 antibodies were directly conjugated to Alexa Fluor 647 in our laboratory (L-20; Santa Cruz Biotechnology, Inc.).
Secondary antibodies: Alexa Fluor 488–coupled goat anti-FITC, Alexa 647–coupled goat anti–hamster IgG, Alexa Fluor 594–coupled goat anti–rat IgG, Alexa Fluor 594–coupled goat anti–rabbit IgG (Fab’)2, Alexa Fluor 488 or 594–coupled NeutrAvidin (all from Invitrogen), and Alexa Fluor 594 mouse anti-PE (eBioscience, conjugated in our laboratory). PE-conjugated antibodies against CD11c, CD11b, DX5, γ™TCR, B220, and CD19 were obtained from BD.
The cytokines used, recombinant mouse IFN-γ and IL-4, were obtained from Peprotech.
Cell activation and staining for microscopy.
Cells were activated in cell culture conditions (37°C, 5% CO2 in RPMI 10% FCS, nonessential amino acids, Hepes buffer, Penicillin, and Streptomycin) by cross-linking surface TCR with anti-TCRβ FITC or APC, followed by incubation with Alexa Fluor 488 anti-FITC or Alexa Fluor 647–conjugated anti–hamster antibodies. After the indicated times, cells were washed twice with cold PBS and fixed with PBS 0.5% PFA for 10 min at room temperature and stored in PBS 0.05% PFA at 4°C. For surface staining, cells were washed twice with PBS and PBS-FCS 1% or PBS-BSA 2% (wash media) sequentially and stained in the same media. For intracellular staining, cells were washed twice with wash media and permeabilized with PBS-FCS 2% supplemented with 0.05% Triton X-100. Cells were observed immediately after staining in Nunc coverslip microchambers by resuspending them in collagen matrixes (1 mg/ml; Vitrogen) to avoid shifting of the cells during observation. Microchambers were spun to allow cells to remain in the same plane of the collagen matrixes.
In vitro Th differentiation and intracellular cytokine staining (ICS).
Purified Thps were cultured at 106/ml in 48-well plates (BD) coated with anti-CD3 (2c11) and anti-CD28 at 2 µg/ml. For Th0 conditions, cells were incubated with recombinant IL-2 (20 ng/ml; Peprotech). For Th1 conditions, cells were incubated in the presence of anti–IL-4 antibody (10 µg/ml), IL-2, and IFN-γ (20 ng/ml; Peprotech). For Th2 skewing, cells were incubated in the presence of anti–IFN-γ antibody (10 µg/ml) and IL-4 (20 ng/ml; Peprotech). For ICS, cells were stimulated in Th0 conditions and restimulated with PMA (50 ng/ml) and ionomycin (1 µM) for 2 h, and then monensin (3 µM final concentration) was added for another 2 h. Cells were harvested and washed in PBS. After fixation in 4% PFA at room temperature for 10 min, cells were washed once in PBS, once in PBS containing 1% FCS, and finally in staining buffer (PBS 1%, FCS 1%, and saponin). Cells were resuspended in staining buffer containing anti–IFN-γ and anti–IL-4 FITC-conjugated antibodies (BD) and incubated on ice for 25 min. Nonspecific staining was blocked with FcR blocking antibody (CD16/CD32). Cells were washed twice in staining buffer, and data were acquired using a FACSCalibur (BD).
Western blots.
After the indicated treatments, cells were washed two times in PBS and lysed in the following buffer for protein extraction: 1% Triton X-100, 50 mM Tris, pH 8.0, 100 mM NaCl, 50 mM NaF, 1 mM EDTA, phosphatase inhibitor cocktail (Sigma-Aldrich), and protease inhibitor cocktail (Roche). Lysates were cleared by centrifugation for 10 min at 14,000 rpm. Western blotting was performed by probing with primary antibody, followed by horseradish peroxidase–conjugated goat anti–rabbit IgG (Zymed Laboratories) and enhanced chemiluminescence according to the manufacturer’s instructions (Thermo Fisher Scientific). Quantification was achieved by using ImageJ software from National Institutes of Health by assessing the integrated density of the blots. These results are shown in Fig. S3. These results were normalized to their respective HSP90 control and displayed in Fig. 3 as the percentage relative to the highest density, as in this example: percentage of STAT1 relative to the highest density = (normalized STAT1 density × 100/highest normalized density) where normalized STAT1 density = (STAT1 density – background density/individual HSP90 density – background density).
Microscopy and image analysis.
Images were acquired using two microscopy systems. An Axiovert 200 epifluorescence microscope (Carl Zeiss, Inc.) controlled by the aid of Metamorph software (Universal Imaging) and an X81 epifluorescence microscope (Olympus) equipped with a Disk Scanning Unit (DSU) controlled by the aid of the IPLab software (Scanalytics). Images were taken using 100× objectives and software-deconvoluted using the Nearest Neighbors method for representation purposes (pictures in figures). The cocapping and colocalization measurements were obtained by using Metamorph software. 30–40 optical sections were collected through each imaged cell in 1 µm intervals using a piezoelectric z-positioner on the objectives.
The linearization method used in an earlier study (8) to measure the degree of cocapping of different molecules was improved by extending the analysis of the cell surface over multiple z sections of the same cell population. Scans of the cell surface were made by drawing ring-shaped regions that included the membrane and the subjacent cytoplasm for every focal z plane of cells.
For every pixel in these regions the intensity and position of each fluorochrome is tabulated. Typically, for one cell, 100 pixels were scanned per single z section. Between 10 and 40 z sections were analyzed per cell on a total of ∼100 cells in different experiments. This method allows us to assess the degree of capping of different molecules as opposed to the simple colocalization method that does not account for their spatial distribution in the cell membrane. Correlation coefficients between the distributions of the fluorochromes were calculated as follows:
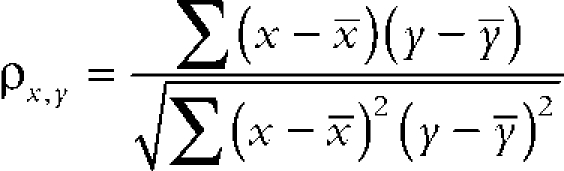 |
(http://mathworld.wolfram.com/CorrelationCoefficient.html). Subsequently, these values were represented as a correlation plot where the correlation between the distributions of two given molecules is plotted against the correlation for two other molecules. This representation allows simultaneous visualization of the correlation for three different molecules for every focal z plane. Calculating the average of the correlations for every cell allowed us to obtain the correlation on a per cell basis. To calculate the colocalization of fluorochromes, images were thresholded (the background was subtracted) and analyzed using Metamorph built-in tools to calculate the integrative colocalization index in percentages.
Online supplemental material.
Fig. S1 shows how lines were positioned, delineating the contour of the cell over the TCR staining on the membrane and across the different optical planes acquired by confocal microscopy. These lines served to perform linescan of the area in close proximity. This technique is the fundament of the whole cell linearization of the cell surface method. Fig. S2 depicts correlation plots displaying the average of the correlation coefficients (ρ) on a “per cell basis” between the distributions of STAT1 and IFNGR1 or STAT1 and TCR on the y axis and TCR and IFNGR1. In Fig. S3, we show the raw quantification data of STAT1 and phospho-STAT1 on Thp and Th cells. Fig. S4 shows the critical negative control of immunoblot of protein extracts from stat1−/− Thps. Fig. S5 shows the regions that were used to measure the overlap of pS727-STAT1 and nuclear (DAPI) staining. Fig. S6 shows the corecruitment of TCR, IFNGR, and JAK3 to the IS. The online supplemental material is available at http://www.jem.org/cgi/content/full/jem.20082900/DC1.
Acknowledgments
We thank Drs. Michael Grusby, Wendy Garrett, and Marc Wein for thoughtful review of the manuscript, Drs. H. Cantor and R. Schreiber for sharing animals and antibodies and Landy Kangaloo for valuable technical help. This work was supported by National Institutes of Health grant P01 NS038037 (LHG). R.M. is a recipient of the Kelli and Gerald Ford Irvington Institute Postdoctoral Fellowship. TD is supported by the Austrian Science Foundation (FWF) through grant SFB28. LHG is a member of the Board of Directors of and holds equity in the Bristol Myers Squibb Corporation. The authors have no conflicting financial interests.
Footnotes
Abbreviations used: DP, double-positive thymocyte; ICS, intracellular cytokine staining; IFNGR, IFN-γ receptor; IS, immunological synapse; JAK, Janus kinase; MAPK, mitogen-activated protein kinase; SOCS, suppressor of cytokine signaling; STAT, signal transducer and activator of transcription; Thp, T helper precursor.
References
- Szabo S.J., Sullivan B.M., Peng S.L., Glimcher L.H. 2003. Molecular mechanisms regulating Th1 immune responses.Annu. Rev. Immunol. 21:713–758 [DOI] [PubMed] [Google Scholar]
- Murphy K.M., Reiner S.L. 2002. The lineage decisions of helper T cells.Nat. Rev. Immunol. 2:933–944 [DOI] [PubMed] [Google Scholar]
- Davis D.M., Dustin M.L. 2004. What is the importance of the immunological synapse? Trends Immunol. 25:323–327 [DOI] [PubMed] [Google Scholar]
- Friedl P., den Boer A.T., Gunzer M. 2005. Tuning immune responses: diversity and adaptation of the immunological synapse.Nat. Rev. Immunol. 5:532–545 [DOI] [PubMed] [Google Scholar]
- Grakoui A., Bromley S.K., Sumen C., Davis M.M., Shaw A.S., Allen P.M., Dustin M.L. 1999. The immunological synapse: a molecular machine controlling T cell activation.Science. 285:221–227 [DOI] [PubMed] [Google Scholar]
- Thauland T.J., Koguchi Y., Wetzel S.A., Dustin M.L., Parker D.C. 2008. Th1 and th2 cells form morphologically distinct immunological synapses.J. Immunol. 181:393–399 [DOI] [PMC free article] [PubMed] [Google Scholar]
- Balamuth F., Leitenberg D., Unternaehrer J., Mellman I., Bottomly K. 2001. Distinct patterns of membrane microdomain partitioning in Th1 and th2 cells.Immunity. 15:729–738 [DOI] [PubMed] [Google Scholar]
- Maldonado R.A., Irvine D.J., Schreiber R., Glimcher L.H. 2004. A role for the immunological synapse in lineage commitment of CD4 lymphocytes.Nature. 431:527–532 [DOI] [PubMed] [Google Scholar]
- Sims T.N., Dustin M.L. 2004. A polarizing situation.Nat. Immunol. 5:1012–1013 [DOI] [PubMed] [Google Scholar]
- Yeh J.H., Sidhu S., Chan A. 2008. Regulation of a late phase of T cell polarity and effector functions by Crtam.Cell. 132:846–859 [DOI] [PubMed] [Google Scholar]
- Dustin M.L. 2008. Synaptic asymmetry to go.Cell. 132:733–734 [DOI] [PubMed] [Google Scholar]
- Chang J.T., Palanivel V.R., Kinjyo I., Schambach F., Intlekofer A.M., Banerjee A., Longworth S.A., Vinup K.E., Mrass P., Oliaro J., et al. 2007. Asymmetric T lymphocyte division in the initiation of adaptive immune responses.Science. 315:1673–1674 [DOI] [PubMed] [Google Scholar]
- Reiner S.L., Sallusto F., Lanzavecchia A. 2007. Division of labor with a workforce of one: challenges in specifying effector and memory T cell fate.Science. 317:622–625 [DOI] [PubMed] [Google Scholar]
- Berenson L.S., Ota N., Murphy K.M. 2004. Issues in T-helper 1 development–resolved and unresolved.Immunol. Rev. 202:157–174 [DOI] [PubMed] [Google Scholar]
- Ansel K.M., Djuretic I., Tanasa B., Rao A. 2006. Regulation of Th2 differentiation and Il4 locus accessibility.Annu. Rev. Immunol. 24:607–656 [DOI] [PubMed] [Google Scholar]
- Mowen K.A., Glimcher L.H. 2004. Signaling pathways in Th2 development.Immunol. Rev. 202:203–222 [DOI] [PubMed] [Google Scholar]
- Platanias L.C. 2005. Mechanisms of type-I- and type-II-interferon-mediated signalling.Nat. Rev. Immunol. 5:375–386 [DOI] [PubMed] [Google Scholar]
- Hebenstreit D., Wirnsberger G., Horejs-Hoeck J., Duschl A. 2006. Signaling mechanisms, interaction partners, and target genes of STAT6.Cytokine Growth Factor Rev. 17:173–188 [DOI] [PubMed] [Google Scholar]
- Lugo-Villarino G., Maldonado-Lopez R., Possemato R., Penaranda C., Glimcher L.H. 2003. T-bet is required for optimal production of IFN-{gamma} and antigen-specific T cell activation by dendritic cells.Proc. Natl. Acad. Sci. USA. 100:7749–7754 [DOI] [PMC free article] [PubMed] [Google Scholar]
- Ohteki T., Fukao T., Suzue K., Maki C., Ito M., Nakamura M., Koyasu S. 1999. Interleukin 12-dependent interferon gamma production by CD8α+ lymphoid dendritic cells.J. Exp. Med. 189:1981–1986 [DOI] [PMC free article] [PubMed] [Google Scholar]
- Decker T., Kovarik P. 2000. Serine phosphorylation of STATs.Oncogene. 19:2628–2637 [DOI] [PubMed] [Google Scholar]
- Kovarik P., Mangold M., Ramsauer K., Heidari H., Steinborn R., Zotter A., Levy D.E., Muller M., Decker T. 2001. Specificity of signaling by STAT1 depends on SH2 and C-terminal domains that regulate Ser727 phosphorylation, differentially affecting specific target gene expression.EMBO J. 20:91–100 [DOI] [PMC free article] [PubMed] [Google Scholar]
- Pilz A., Ramsauer K., Heidari H., Leitges M., Kovarik P., Decker T. 2003. Phosphorylation of the Stat1 transactivating domain is required for the response to type I interferons.EMBO Rep. 4:368–373 [DOI] [PMC free article] [PubMed] [Google Scholar]
- Durbin J.E., Hackenmiller R., Simon M.C., Levy D.E. 1996. Targeted disruption of the mouse Stat1 gene results in compromised innate immunity to viral disease.Cell. 84:443–450 [DOI] [PubMed] [Google Scholar]
- Huang S., Hendriks W., Althage A., Hemmi S., Bluethmann H., Kamijo R., Vilcek J., Zinkernagel R.M., Aguet M. 1993. Immune response in mice that lack the interferon-gamma receptor.Science. 259:1742–1745 [DOI] [PubMed] [Google Scholar]
- Meraz M.A., White J.M., Sheehan K.C., Bach E.A., Rodig S.J., Dighe A.S., Kaplan D.H., Riley J.K., Greenlund A.C., Campbell D., et al. 1996. Targeted disruption of the Stat1 gene in mice reveals unexpected physiologic specificity in the JAK-STAT signaling pathway.Cell. 84:431–442 [DOI] [PubMed] [Google Scholar]
- Ramana C.V., Gil M.P., Schreiber R.D., Stark G.R. 2002. Stat1-dependent and -independent pathways in IFN-gamma-dependent signaling.Trends Immunol. 23:96–101 [DOI] [PubMed] [Google Scholar]
- Brossard C., Feuillet V., Schmitt A., Randriamampita C., Romao M., Raposo G., Trautmann A. 2005. Multifocal structure of the T cell - dendritic cell synapse.Eur. J. Immunol. 35:1741–1753 [DOI] [PubMed] [Google Scholar]
- Halin C., Rodrigo Mora J., Sumen C., von Andrian U.H. 2005. In vivo imaging of lymphocyte trafficking.Annu. Rev. Cell Dev. Biol. 21:581–603 [DOI] [PubMed] [Google Scholar]
- Henrickson S.E., Mempel T.R., Mazo I.B., Liu B., Artyomov M.N., Zheng H., Peixoto A., Flynn M.P., Senman B., Junt T., et al. 2008. T cell sensing of antigen dose governs interactive behavior with dendritic cells and sets a threshold for T cell activation.Nat. Immunol. 9:282–291 [DOI] [PMC free article] [PubMed] [Google Scholar]
- Bach E.A., Szabo S.J., Dighe A.S., Ashkenazi A., Aguet M., Murphy K.M., Schreiber R.D. 1995. Ligand-Induced Autoregulation of IFN-gamma receptor beta chain expression in T helper cell subsets.Science. 270:1215–1218 [DOI] [PubMed] [Google Scholar]
- Skrenta H., Yang Y., Pestka S., Fathman C.G. 2000. Ligand-independent down-regulation of IFN-gamma receptor 1 following TCR engagement.J. Immunol. 164:3506–3511 [DOI] [PubMed] [Google Scholar]
- Van De Wiele C.J., Marino J.H., Whetsell M.E., Vo S.S., Masengale R.M., Teague T.K. 2004. Loss of interferon-induced Stat1 phosphorylation in activated T cells.J. Interferon Cytokine Res. 24:169–178 [DOI] [PubMed] [Google Scholar]
- Rosenzweig S.D., Holland S.M. 2005. Defects in the interferon-gamma and interleukin-12 pathways.Immunol. Rev. 203:38–47 [DOI] [PubMed] [Google Scholar]
- Haring J.S., Badovinac V.P., Olson M.R., Varga S.M., Harty J.T. 2005. In vivo generation of pathogen-specific Th1 cells in the absence of the IFN-gamma receptor.J. Immunol. 175:3117–3122 [DOI] [PubMed] [Google Scholar]
- McBride K.M., Reich N.C. 2003. The ins and outs of STAT1 nuclear transport.Sci. STKE. 2003:re13. [DOI] [PubMed] [Google Scholar]
- Bradley L.M., Dalton D.K., Croft M. 1996. A direct role for IFN-gamma in regulation of Th1 cell development.J. Immunol. 157:1350–1358 [PubMed] [Google Scholar]
- Varinou L., Ramsauer K., Karaghiosoff M., Kolbe T., Pfeffer K., Muller M., Decker T. 2003. Phosphorylation of the Stat1 transactivation domain is required for full-fledged IFN-gamma-dependent innate immunity.Immunity. 19:793–802 [DOI] [PubMed] [Google Scholar]
- Rengarajan J., Tang B., Glimcher L.H. 2002. NFATc2 and NFATc3 regulate T(H)2 differentiation and modulate TCR-responsiveness of naive T(H)cells.Nat. Immunol. 3:48–54 [DOI] [PubMed] [Google Scholar]
- Ranger A.M., Oukka M., Rengarajan J., Glimcher L.H. 1998. Inhibitory function of two NFAT family members in lymphoid homeostasis and Th2 development.Immunity. 9:627–635 [DOI] [PubMed] [Google Scholar]
- Sadzak I., Schiff M., Gattermeier I., Glinitzer R., Sauer I., Saalmüller A., Yang E., Schaljo B., Kovarik P. 2008. Recruitment of Stat1 to chromatin is required for interferon-induced serine phosphorylation of Stat1 transactivation domain.Proc. Natl. Acad. Sci. USA. 105:8944–8949 [DOI] [PMC free article] [PubMed] [Google Scholar]
- Meyer T., Begitt A., Lodige I., van Rossum M., Vinkemeier U. 2002. Constitutive and IFN-gamma-induced nuclear import of STAT1 proceed through independent pathways.EMBO J. 21:344–354 [DOI] [PMC free article] [PubMed] [Google Scholar]
- He H.-T., Lellouch A., Marguet D. 2005. Lipid rafts and the initiation of T cell receptor signaling.Semin. Immunol. 17:23–33 [DOI] [PubMed] [Google Scholar]
- Subramaniam P.S., Johnson H.M. 2002. Lipid microdomains are required sites for the selective endocytosis and nuclear translocation of IFN-gamma, its receptor chain IFN-gamma receptor-1, and the phosphorylation and nuclear translocation of STAT1alpha.J. Immunol. 169:1959–1969 [DOI] [PubMed] [Google Scholar]
- Rao R., Logan B., Forrest K., Roszman T.L., Goebel J. 2004. Lipid rafts in cytokine signaling.Cytokine Growth Factor Rev. 15:103–110 [DOI] [PubMed] [Google Scholar]
- Sehgal P.B., Guo G.G., Shah M., Kumar V., Patel K. 2002. Cytokine signaling: STATS in plasma membrane rafts.J. Biol. Chem. 277:12067–12074 [DOI] [PubMed] [Google Scholar]
- Gamero A.M., Larner A.C. 2000. Signaling via the T cell antigen receptor induces phosphorylation of Stat1 on serine 727.J. Biol. Chem. 275:16574–16578 [DOI] [PubMed] [Google Scholar]
- Lafont V., Decker T., Cantrell D. 2000. Antigen receptor signal transduction: activating and inhibitory antigen receptors regulate STAT1 serine phosphorylation.Eur. J. Immunol. 30:1851–1860 [DOI] [PubMed] [Google Scholar]
- Marrack P., Kappler J. 2004. Control of T cell viability.Annu. Rev. Immunol. 22:765–787 [DOI] [PubMed] [Google Scholar]
- Zheng Y., Vig M., Lyons J., Van Parijs L., Beg A.A. 2003. Combined deficiency of p50 and cRel in CD4+ T cells reveals an essential requirement for nuclear factor κB in regulating mature T cell survival and in vivo function.J. Exp. Med. 197:861–874 [DOI] [PMC free article] [PubMed] [Google Scholar]
- Stockinger B., Kassiotis G., Bourgeois C. 2004. Homeostasis and T cell regulation.Curr. Opin. Immunol. 16:775–779 [DOI] [PubMed] [Google Scholar]
- Delespine-Carmagnat M., Bouvier G., Bertoglio J. 2000. Association of STAT1, STAT3 and STAT5 proteins with the IL-2 receptor involves different subdomains of the IL-2 receptor β chain.Eur. J. Immunol. 30:59–68 [DOI] [PubMed] [Google Scholar]
- Crawley J.B., Rawlinson L., Lali F.V., Page T.H., Saklatvala J., Foxwell B.M.J. 1997. T cell proliferation in response to interleukins 2 and 7 requires p38MAP kinase activation.J. Biol. Chem. 272:15023–15027 [DOI] [PubMed] [Google Scholar]
- Roesler J., Kofink B., Wendisch J., Heyden S., Paul D., Friedrich W., Casanova J.L., Leupold W., Gahr M., Rösen-Wolff A. 1999. Listeria monocytogenes and recurrent mycobacterial infections in a child with complete interferon-gamma-receptor (IFNgammaR1) deficiency: mutational analysis and evaluation of therapeutic options.Exp. Hematol. 27:1368–1374 [DOI] [PubMed] [Google Scholar]
- Okada S., Ishikawa N., Shirao K., Kawaguchi H., Tsumura M., Ohno Y., Yasunaga S., Ohtsubo M., Takihara Y., Kobayashi M. 2007. The novel IFNGR1 mutation 774del4 produces a truncated form of interferon-gamma receptor 1 and has a dominant-negative effect on interferon-gamma signal transduction.J. Med. Genet. 44:485–491 [DOI] [PMC free article] [PubMed] [Google Scholar]
- Dupuis S., Jouanguy E., Al-Hajjar S., Fieschi C., Al-Mohsen I.Z., Al-Jumaah S., Yang K., Chapgier A., Eidenschenk C., Eid P., et al. 2003. Impaired response to interferon-alpha/beta and lethal viral disease in human STAT1 deficiency.Nat. Genet. 33:388–391 [DOI] [PubMed] [Google Scholar]
- Dupuis S., Dargemont C., Fieschi C., Thomassin N., Rosenzweig S., Harris J., Holland S.M., Schreiber R.D., Casanova J.L. 2001. Impairment of mycobacterial but not viral immunity by a germline human STAT1 mutation.Science. 293:300–303 [DOI] [PubMed] [Google Scholar]
- Jouanguy E., Lamhamedi-Cherradi S., Lammas D., Dorman S.E., Fondanèche M.C., Dupuis S., Döffinger R., Altare F., Girdlestone J., Emile J.F., et al. 1999. A human IFNGR1 small deletion hotspot associated with dominant susceptibility to mycobacterial infection.Nat. Genet. 21:370–378 [DOI] [PubMed] [Google Scholar]
- Tau G.Z., von der Weid T., Lu B., Cowan S., Kvatyuk M., Pernis A., Cattoretti G., Braunstein N.S., Coffman R.L., Rothman P.B. 2000. Interferon γ signaling alters the function of T helper type 1 cells.J. Exp. Med. 192:977–986 [DOI] [PMC free article] [PubMed] [Google Scholar]
- Pernis A., Gupta S., Gollob K.J., Garfein E., Coffman R.L., Schindler C., Rothman P. 1995. Lack of interferon gamma receptor beta chain and the prevention of interferon gamma signaling in TH1 cells.Science. 269:245–247 [DOI] [PubMed] [Google Scholar]
- Zimmerer J.M., Lesinski G.B., Kondadasula S.V., Karpa V.I., Lehman A., Raychaudhury A., Becknell B., Carson W.E. 2007. IFN-alpha-induced signal transduction, gene expression, and antitumor activity of immune effector cells are negatively regulated by suppressor of cytokine signaling proteins.J. Immunol. 178:4832–4845 [DOI] [PubMed] [Google Scholar]
- Seki Y., Inoue H., Nagata N., Hayashi K., Fukuyama S., Matsumoto K., Komine O., Hamano S., Himeno K., Inagaki-Ohara K., et al. 2003. SOCS-3 regulates onset and maintenance of T(H)2-mediated allergic responses.Nat. Med. 9:1047–1054 [DOI] [PubMed] [Google Scholar]
- Sabatos C.A., Doh J., Chakravarti S., Friedman R., Pandurangi P., Tooley A., Krummel M. 2008. A synaptic basis for paracrine interleukin-2 signaling during homotypic T cell interaction.Immunity. 29:238–248 [DOI] [PMC free article] [PubMed] [Google Scholar]
- Sotillos S., Díaz-Meco M.T., Moscat J., Castelli-Gair Hombría J. 2008. Polarized subcellular localization of Jak/STAT components is required for efficient signaling.Curr. Biol. 18:624–629 [DOI] [PubMed] [Google Scholar]
- Mayer B., Emery G., Berdnik D., Wirtz-Peitz F., Knoblich J.A. 2005. Quantitative analysis of protein dynamics during asymmetric cell division.Curr. Biol. 15:1847–1854 [DOI] [PubMed] [Google Scholar]
- Lee C.Y., Andersen R.O., Cabernard C., Manning L., Tran K.D., Lanskey M.J., Bashirullah A., Doe C.Q. 2006. Drosophila Aurora-A kinase inhibits neuroblast self-renewal by regulating aPKC/Numb cortical polarity and spindle orientation.Genes Dev. 20:3464–3474 [DOI] [PMC free article] [PubMed] [Google Scholar]
- Rolls M.M., Albertson R., Shih H.P., Lee C.Y., Doe C.Q. 2003. Drosophila aPKC regulates cell polarity and cell proliferation in neuroblasts and epithelia.J. Cell Biol. 163:1089–1098 [DOI] [PMC free article] [PubMed] [Google Scholar]
- Langevin J., Le Borgne R., Rosenfeld F., Gho M., Schweisguth F., Bellaïche Y. 2005. Lethal giant larvae controls the localization of notch-signaling regulators numb, neuralized, and Sanpodo in Drosophila sensory-organ precursor cells.Curr. Biol. 15:955–962 [DOI] [PubMed] [Google Scholar]
- Gibson M.C., Perrimon N. 2003. Apicobasal polarization: epithelial form and function.Curr. Opin. Cell Biol. 15:747–752 [DOI] [PubMed] [Google Scholar]
- Russell S. 2008. How polarity shapes the destiny of T cells.J. Cell Sci. 121:131–136 [DOI] [PubMed] [Google Scholar]
- Krummel M.F., Macara I. 2006. Maintenance and modulation of T cell polarity.Nat. Immunol. 7:1143–1149 [DOI] [PubMed] [Google Scholar]
- Luty W.H., Rodeberg D., Parness J., Vyas Y.M. 2007. Antiparallel segregation of notch components in the immunological synapse directs reciprocal signaling in allogeneic Th:DC conjugates.J. Immunol. 179:819–829 [DOI] [PubMed] [Google Scholar]
- Huang Z., Xin J., Coleman J., Huang H. 2005. IFN-{gamma} suppresses STAT6 phosphorylation by inhibiting its recruitment to the IL-4 receptor.J. Immunol. 174:1332–1337 [DOI] [PubMed] [Google Scholar]
- Zhu J., Huang H., Guo L., Stonehouse T., Watson C.J., Hu-Li J., Paul W.E. 2000. Transient inhibition of interleukin 4 signaling by T cell receptor ligation.J. Exp. Med. 192:1125–1134 [DOI] [PMC free article] [PubMed] [Google Scholar]
- Tomita K., Saijo K., Yamasaki S., Iida T., Nakatsu F., Arase H., Ohno H., Shirasawa T., Kuriyama T., O'Shea J.J., Saito T. 2001. Cytokine-independent Jak3 activation upon T cell receptor (TCR) stimulation through direct association of Jak3 and the TCR complex.J. Biol. Chem. 276:25378–25385 [DOI] [PubMed] [Google Scholar]
- So E.Y., Oh J., Jang J.Y., Kim J.H., Lee C.E. 2007. Ras/Erk pathway positively regulates Jak1/STAT6 activity and IL-4 gene expression in Jurkat T cells.Mol. Immunol. 44:3416–3426 [DOI] [PubMed] [Google Scholar]
- Naka T., Tsutsui H., Fujimoto M., Kawazoe Y., Kohzaki H., Morita Y., Nakagawa M., Narazaki K., Adachi T., Yoshimoto, Nakanishi K., Kishimoto T. 2001. SOCS-1/SSI-1-Deficient NKT Cells Participate in Severe Hepatitis through Dysregulated Cross-Talk Inhibition of IFN-[gamma] and IL-4 Signaling In Vivo.Immunity. 14:535–545 [DOI] [PubMed] [Google Scholar]
- Yu Q., Park J.-H., Doan L.L., Erman B., Feigenbaum L., Singer A. 2006. Cytokine signal transduction is suppressed in preselection double-positive thymocytes and restored by positive selection.J. Exp. Med. 203:165–175 [DOI] [PMC free article] [PubMed] [Google Scholar]
- Adachi S., Amasaki Y., Miyatake S., Arai N., Iwata M. 2000. Successive expression and activation of NFAT family members during thymocyte differentiation.J. Biol. Chem. 275:14708–14716 [DOI] [PubMed] [Google Scholar]
- Brogdon J.L., Leitenberg D., Bottomly K. 2002. The potency of TCR signaling differentially regulates NFATc/p activity and early IL-4 transcription in naive CD4+ T cells.J. Immunol. 168:3825–3832 [DOI] [PubMed] [Google Scholar]