Abstract
The Target of Rapamycin (TOR) signaling pathway regulates cell growth and proliferation, however the extent to which TOR signaling mediates particular organogenesis programs remains to be determined. Here we report an examination of TOR signaling during zebrafish development, using a combination of small molecule treatment and morpholino-mediated gene knockdown. First, we amplified and sequenced the full length cDNA for the zebrafish TOR ortholog (ztor). By in situ hybridization we found that ztor is expressed ubiquitously in the early embryo, but displays a dynamic pattern in the gut between 48 and 72 hours post-fertilization (dpf). Treatment of zebrafish embryos with rapamycin induced only a mild general developmental delay up to 72 hpf, but digestive tract development became arrested at the primitive gut tube stage. Rapamycin inhibited intestinal epithelial growth, morphogenesis and differentiation. Using morpholino-mediated gene knockdown of TOR pathway components, we show that this effect is mediated specifically by the rapamycin-sensitive TOR complex 1 (TORC1). Thus, in addition to regulating cell growth and proliferation, TOR signaling controls the developmental program guiding epithelial morphogenesis in the vertebrate intestine.
Keywords: intestine, target of rapamycin, mTOR, TORC1, zebrafish, organogenesis, morphogenesis, intestinal development
INTRODUCTION
Organ development requires coordination between multiple cellular processes to yield an organ of the proper size and tissue architecture. The mechanisms by which organs are guided to a particular size are not well understood, but this knowledge is critical for treating a wide array of diseases from organ failure to cancer. The zebrafish is an excellent model for vertebrate organogenesis since development can be monitored in real time in the live embryo (Fishman, 2001). Also, it is amenable to molecular manipulation by morpholino-mediated gene knockdown, and to studying the effects of small molecules on specific developmental processes (Peterson and Fishman, 2004).
We are particularly interested in understanding how the intestine develops, and the zebrafish provides a highly tractable model system for its study. The primitive gut tube is formed from the endoderm between 32 and 40 hours post fertilization (Wallace et al., 2005). The epithelial cells become progressively more polarized and begin to express intestine-specific genes between 66 and 84 hpf, with folds of mucosa emerging at 96 hpf, foreshadowing the formation of villi over the next several days. By 120 hpf, it begins to perform its vital function of nutrient absorption. Thus, between 48 and 120 hpf, the intestinal epithelium can be observed to expand by nearly an order of magnitude, making it a useful model for the study of organ growth and morphogenesis.
Forward genetic analysis of gut development in the zebrafish genome has identified a number of genes required for intestinal growth. The nil per os (npo) mutation induces arrest of intestinal development at the primitive gut tube stage, and disrupts a conserved RNA–binding protein involved in processing of pre-ribosomal RNA (Jin et al., 2002; Mayer and Fishman, 2003; Saijou et al., 2004). A number of insertional mutants also show defective intestinal growth, but most of these have yet to be characterized in detail (Amsterdam et al., 2004). Interestingly, like npo, many of these affect genes directly involved in protein biosynthesis or other anabolic function. Examples include several amino acyl t-RNA synthetases, ribosomal proteins, nucleolar factors involved in ribosome biogenesis, and polyamine biosynthesis. These genetic data thus suggest that the regulation of translation might play an important role in the transition of the primitive gut endoderm into mature intestine. In a separate line of investigation, numerous studies have pointed to intestinal epithelial cells as particularly sensitive to regulation by amino acids (reviewed in (Naomoto et al., 2005)).
The target of rapamycin (TOR) plays a central role in the regulation of cell growth and proliferation in all eukaryotic species examined via its regulation of the cell’s growth machinery, and protein biosynthesis in particular (Wullschleger et al., 2006). TOR kinase is the catalytic core of a multiprotein complex that interprets a variety of inputs: nutritional status, growth factor signaling, cellular stress-and regulates the cell’s metabolic machinery in response. The role of TOR in embryonic development has been probed in C. elegans and Drosophila, and to a lesser extent in the mouse due to early lethality. In C. elegans, RNAi-mediated knockdown and genetic mutations result in growth-arrest and intestinal degeneration (Long et al., 2002). In Drosphila, mutations in dTOR exhibit slowed larval growth developmental delay (Oldham et al., 2000). Conversely, mutation of the dTOR inhibitors dTSC1 or dTSC2 leads to organ hypertrophy (Gao et al., 2002). A spontaneous mutation known as flathead encodes a hypomorphic allele of TOR, and these mice arrest their development around E12.5 and display widespread reduction of cell proliferation (Hentges et al., 2001). Mice rendered null for TOR arrest at the perimplantation stage (Gangloff et al., 2004; Murakami et al., 2004). These studies support an essential early role for TOR during mammalian development, then perhaps a distinct later role in regulating organ and body size. Consistent with this idea, human genetic defects that are associated with unregulated TOR activity manifest as abnormal growth. Examples of such conditions include intestinal polyposis syndromes Peutz-Jeghers and Banayan-Riley-Ruvalcaba, the systemic hamartoma syndrome tuberous sclerosis, and other overgrowth syndromes (Inoki et al., 2005).
In this study we sought to determine the role of TOR signaling during zebrafish development. We used rapamycin treatment and morpholino-mediated gene knockdown to manipulate the TOR pathway in the zebrafish. Our findings suggest that signaling through TORC1 controls a critical step during the endoderm-intestine transition.
MATERIALS AND METHODS
Fish stocks and embryo culture
The TUAB, TL and the Gut-GFP transgenic fish line were used in this study. Zebrafish embryos were maintained and mated as described in (Westerfield, 1995). Embryos were collected and raised at 28.5°C. Larvae were staged according to morphological features described in (Kimmel et al., 1995). Live photographs at different developmental stages were captured using a Leica MZFLIII dissecting microscope.
Morpholino knockdowns
All morpholinos, at 100–400 μM, were micro injected into 1-to 4-cell stage embryos. Morpholinos antisense oligonucleotides were designed corresponding to exon-intron junctions of zebrafish genomic sequences and splicing interference was detected by RT-PCR across the targeted exon. Sequences for the morpholinos and RT-PCR primers are given in Table 1.
Table 1.
Morpholino and RT-PCR oligonucleotide sequences
| Gene | Accession # | Morpholino sequence | Primers sequence (5′-3′) | (bp) |
|---|---|---|---|---|
| S6 kinase | NM_212786 | 296-EI
cagtcttcaacttacgtgaacaaga Start gtccggttcctcttcgcaaacattc |
Forward- GATGACTCCATGATTGAGGA
Reverse- CAGTCCATGTAAATGGTCTA |
470 |
| ztor | BC091880 | 2270-EI
ggtttgacacattaccctgagcatg 2221-IE cgctgaatactgctcaaaagaaaca |
Forward -GAGTTCATGTTCCTGCTG
Reverse- CCATCCAATGTAGCATTGG |
1200 |
| raptor | XM_684221 | EI-2
atggatggatggatgctcacctatc Start gttttttcctctgcgtctaccattg |
Forward -ACAGTGAGTGTGGCTCTAG
Reverse- CCT CCT TGG CAT TTC TGC GTA G |
270 |
| rictor | XM_685234 | EI-2
agtgcaataaaacgtggtacagacc Start tcggatgctgaccgccatctttacc |
Forward- GTGGCCAAACAACAAGGAGT
Reverse- CCTGATGAGGTAGCGGAGAG |
203 |
Histology and Morphometry
For histology, embryos were fixed in 4% paraformaldehyde in PBS for 2h at room temperature or overnight at 4°C. Embryos were then washed in PBS, dehydrated in ethanol and then embedded in glycol methacrylate, JB4 (polysciences). Four-micron cross-sections were stained with hematoxylin and eosin. Sections were analyzed by using a Zeiss Axioplan microscope, captured using a Q-imaging digital camera and OpenLab 4.02 (Improvision). Morphometric analysis was performed using Openlab.
Cross sections were chosen based on the following anatomical landmarks: 50microns after the Common Bile Duct for the anterior, after the appearance of pancreatic islets for the midgut, and at the yolk extension AP levels for the posterior. Cell counts were obtained typically from 4–6 embryos. Per section cells were counted and the gut circumference was measured in microns. Average cell width was determined by dividing the circumference by total cell number. Cell height was measured as the number of microns across the nucleus from basal to apical surface (average of five cells per section). The mean and standard deviation of numbers collected from control and rapamycin treated embryos were graphed. Statistical analysis was preformed using a two-tailed t-test (Microsoft Excel).
Drug treatment
A stock solution of rapamycin (Sigma) in DMSO was added to the embryo media at final concentration of 400 nM. FK506, (AntibioticsPlus) was dissolve in DMSO and used at indicated concentrations. Drug-containing media was replaced every 24 h. In some experiments, embryos at later developmental stages were injected with drug to avoid problems with drug penetration. Injections into the circulation consisted of 13 nl of 60 μM rapamycin plus 2.5 mg/ml rhodamine dextran (to track the effectiveness of the injection). Embryos were scored for successful injection by rhodamine fluorescence to determine if the injected solution had entered the circulation. These positive embryos were subjected for the final analysis.
RT-PCR
Total RNA was extracted from zebrafish embryos using Trizol (Invitrogen). Reverse transcription was performed using oligo (dT)20 and SuperScript™ II. PCR reactions used Taq polymerase from Qiagen, and contained 5% of the reverse transcription.
5-Bromo-2′-deoxy-uridine (BrdU) labeling
Rapamycin Treatment
TL strain embryos at 24 hpf were treated with 400 nM rapamycin while the remaining half were treated with DMSO carrier. Embryos were placed in fresh media every 24 hours, and allowed to grow at 28°C.
BrdU Injection
All embryos were dechorionated and injected with 10 nL of 5 mM BrdU (Roche) with 2.5 mg/ml rhodamine dextran at either 51 or 72 hpf, then incubated at 28°C for 90 min. Embryos were scored for successful injection by rhodamine fluorescence to determine if the injected solution had entered the circulation. Selected embryos were fixed overnight at 4°C in 4% PFA and stored in methanol at −20°C.
Anti-BrdU Immunostaining
Embryos were rehydrated in a graded methanol PBT series. For permeablization, embryos were digested using proteinase K treatment for 30 min (30 μg/ml for 51 hpf, rapamycin treated and untreated, and 72 hpf rapamycin treated; 80 μg/ml, 72 hpf untreated). Embryos were postfixed in 4% PFA for 20 min, then incubated in 2N HCl for 1 h to denature the DNA. Embryos were blocked with blocking solution (10% sheep serum, 1% BSA, in PBT) for 30 min. Embryos were incubated in primary anti-BrdU antibody (Roche 117037; 6 μg/ml in blocking solution) overnight at 4°C then in secondary AlexFluor564-conjugated goat anti-mouse (Molecular Probes) for 1 h.
Mounting and Sectioning
Embryos were fixed in 4% PFA for 20 min, dehydrated in graded ethanol and embedded in JB-4. Blocks were sectioned at 4 μm and counter-stained with DAPI.
Cell Counting and Analysis
Gut epithelial cells were identified in the DAPI-stained sections and used to calculate the total cell number; BrdU labeled cells were counted for each embryo and the fraction of BrdU/total number was calculated for each embryo (n=8 embryos per treatment). These numbers were used to calculate the mean and standard deviation for both rapamycin treated and control groups. Differences between the two groups were analyzed using a two-tailed t-test and unequal variances (Microsoft Excel).
RNA in situ hybridization
Probe synthesis and whole-mount RNA in situ hybridization were carried out as described (Mayer and Fishman, 2003). Probe for ifabp was as described (Mayer and Fishman, 2003). Probes were generated by RT-PCR using gene specific forward and reverse primers, listed in table 2, and using 4 dpf randomly primed total RNA. Reverse primers were synthesized with a T7 polymerase recognition sequence in the 5′ tail.
Table 2.
Primer pairs for in situ probe templates
| Gene
|
Primers (5′-3′)
|
|---|---|
| ztor | Forward1-TGGTGTTACGAGAACTGGCTGTC
Reverse1-TGAAAGTGTGAGGCTGGAAGGC Forward2-TTCTGAACAGCGAGCACAAGG Reverse2-AGTTGAGCAGCACCTCCAGTAGAG Forward3-GCTTTTTGGCTTGGTGAACACTC Reverse3-TCCAGGCTTTTTGTGCGTTG |
| villin | Forward-TATAGTTTCCTGCAGAGAAGCTGGT
Reverse-GGGTGCAGTAGTCTCCGGGTGT |
| raptor | Forward1-CAGATGAAAACAGTGAGTGTGGCTC
Reverse1-CAAACCTCTCGGTAGGACATTCC Forward2-TCACTACGCAGAAATGCCAAGG Reverse2-GTTCAGCAAAGAATGGACTGTGC |
| rictor | Forward1-GGGCACTCTGAGGAAAAGTTTGG
Reverse1-TGCTGTGTCTGGATTGTGTCTGTAG Forward2-CTCGCATTGCTGCTTTCTGC Reverse2-CATCTGTTCCTCTTTGTTGTTCCG Forward3-TCCACCCCTCCCTTTCTCATAGTG Reverse3-GACAGTTCTCCTCAGTGTGCTCTTG |
Immunostaining and histochemistry
Whole-mount α-6F staining
Embryos at 4.5 dpf were fixed in DENT’s (20% DMSO/80%methanol) for 2h to overnight and blocked for 1h at room temperature in blocking buffer (10% sheep serum, 1% BSA, 1% DMSO, 0.1% Tween-20) in PBS. Na+/K+ ATPase was detecting using anti-α-6F antibody (kindly provided by S. Tsukita) at1:100 dilution in blocking buffer for 1h at room temperature. Embryos were washed with PBT 4 times for 10 min each and then incubated with biotin conjugated goat-anti-mouse secondary antibody (1:1000) for 1h at RT. After several extensive washing the embryos were incubated with Cy3-streptavidin (1:1000 dilution) for 1h at RT. After washing with PBT the embryos were examined and using a fluorescence dissecting microscope (Leica FLIII).
Wheat Germ Agglutinin
Embryos were fixed in 4% paraformaldehyde for 2h to overnight. Fixed embryos were incubated in 100% acetone at −20°C for 20 min then returned to PBT and permeablized with 120μg/ml proteinase K in (PBS and 0.1% Tween 20, PBT) for 35 min at room temperature. Goblet cell mucin was detected by incubation with rhodamine conjugated wheat germ agglutinin (1:100 dilution in PBS and 0.1% Tween 20) (Vector Laboratories) overnight at 4°C. Embryos were washed with PBT 4 times at 10 min each then photographed by fluorescence microscopy.
Alkaline phosphatase
Embryos were fixed in 4% paraformaldehyde for 2h to overnight. For alkaline phosphatase staining, embryos were incubated with 100% acetone for 30min at –20, washed with NTMT buffer [0.1M Tris-HCl (pH 9.5), 50mM MgCl2, 0.1M NaCl, and 0.1% Tween-20] 2 times for 10 min each before they were incubated with the reaction substrate, NBT and BCIP (Roche). For histological analysis, embryos were embedded in JB-4 (Polysciences) and sectioned as described above.
Alcian blue staining
Embryos fixed in PFA were washed with PBS followed by washing with 20% acetic acid in ethanol. Alcian blue (Sigma Cat# A-3157) at 0.1% in (20% acetic acid and 80% ethanol) was preformed as described in (Schilling et al., 1996).
Western blot
Embryos were collected at 52 or 72 hpf, homogenized in sodium dodecyl sulfate lysis buffer (62.5 mM Tris-HCl, pH 6.8, 25% glycerol, 5% β-mercaptoethanol, 2.5% sodium dodecyl sulfate). Total extract was boiled for 6–7 min then centrifuged at 14,000 xg for 10 min at room temperature. Supernatant (about 20–35 μl of total extract per lane) was resolved by SDS-PAGE and analyzed by Western blot using anti-S6K at 1:10,000 Dilution (Sigma), then stripped and reprobed with anti-T389 phospho-S6K at 1:200 Dilution (Santa Cruz). Samples were normalized to the total S6K.
RESULTS
Sequence and alignment of the zebrafish ortholog of TOR (zTOR)
The TOR protein is conserved among all eukaryotes (Abraham, 2004); thus we expected to identify at least one TOR ortholog in the zebrafish genome. A sequence search (tblastn) of the zebrafish genome assembly (zv5) against human or mouse mTOR protein identified a single locus on chromosome 8 predicted to encode a protein nearly 90% identical to mammalian orthologs, consistent with a conserved function across eukaryotic species. The current genomic assembly contains a gap that corresponds to the middle third of the protein. Guided by the predicted exon sequences we bridged this gap via RT-PCR and 5′ RACE to assemble a full-length cDNA sequence 8.5 kb in length (Accession # DQ666026). Alignment of the predicted protein with other TOR orthologs indicates the same domain structure, including the HEAT repeats, FAT domain, FKBP-rapamycin binding domain, and a highly conserved kinase domain near the C-terminal (Fig. S1).
ztor expression
As an initial step to examine the role of ztor during development, we determined its expression pattern by whole mount in situ hybridization (Fig. 1). This revealed ubiquitous expression between the 1-cell and 24 hpf stages. Between 24 and 48 hrs there is a general decline in expression in most of the body in a caudal to cranial wave, with persistence in the head, particularly in the brain, eyes and branchial arches (Fig. 1A–C). Between 48 and 72 hpf there is a transient increase in ztor expression in the digestive tract and in the neural tube, peaking around 57 hpf (Fig. 1D). After 72 hpf the gut-specific expression declines and thereafter remains barely detectable. A positive control probe (ifabp) routinely gave robust signal, making poor probe penetration an unlikely possibility (not shown). After 96 hpf, ztor expression persists in the head and the eyes (Fig. 1F and 1G). Histological sectioning of the 48 and 57 hpf embryos revealed that most of the intestinal staining is within the epithelium (Fig. 1H and 1I) as compared to the mesenchyme. Thus transcriptional regulation of ztor may play a role in regulating epithelial cell growth and division.
Fig. 1. ztor expression during embryonic and larval development.
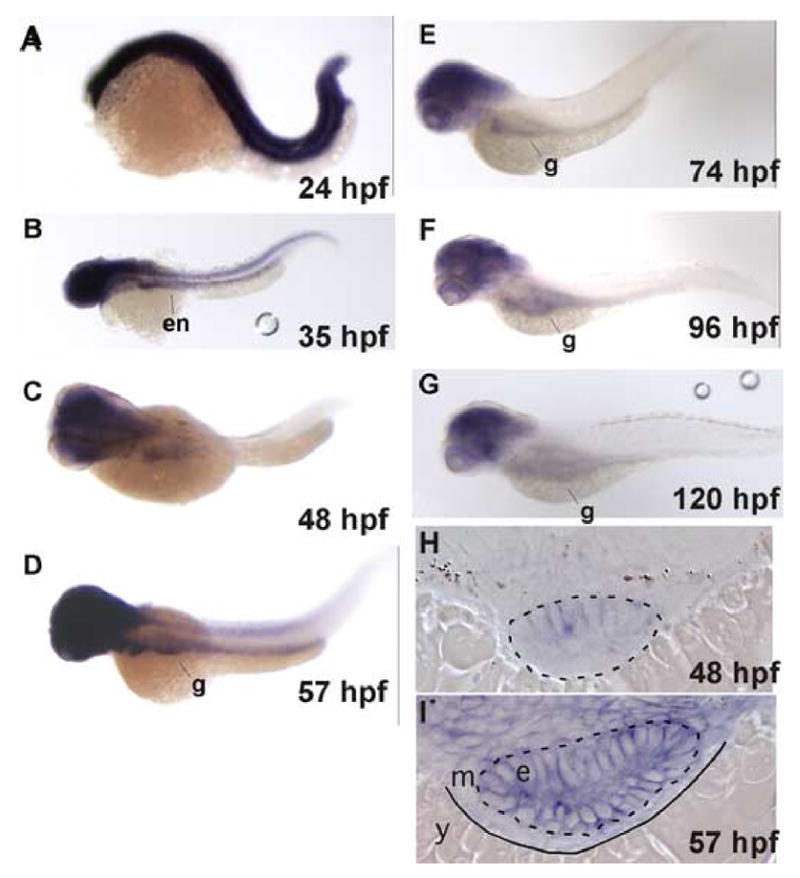
A–G: Whole-mount in situ hybridization to ztor shown in dorso-lateral view with head to the left. H and I: Histological sections of embryos shown in C and D, respectively. Prior to 24 hpf, ztor is expressed ubiquitously (A). Ztor expression then recedes in a caudal-to-cranial fashion between 24 to 48 hpf with expression remaining in the gut and the head (B and C). Ztor expression transiently increases in the gut tube between 48 and 57 hpf (D) and then declines in the gut, remaining detectable in the head thereafter (E–G). Cross sections of 48 and 57 hpf embryos show ztor expressed in the gut tube epithelium (H and I). Dashed lines outline the gut epithelium, solid line delineates mesenchyme from yolk. Original magnification: A–F, 40x; G and H, 200x. Abbreviations: en, endoderm; g, gut; e, epithelium; m, mesenchyme; y, yolk.
Rapamycin exerts a specific effect on the digestive tract
To evaluate the function of ztor during development we treated zebrafish embryos with the TOR inhibitor, rapamycin. Increasing concentrations between 10 nM and 100 nM gave increasingly pronounced effects, but rapamycin concentrations ranging from 200 nM to 10 μM rapamycin gave comparable results (data not shown). Hence we used 400 nM as the standard treating concentration for the experiments described in the remainder of this paper, unless otherwise specified. We repeated many of the experiments using the rapamycin analog RAD-001, and observed identical effects (data not shown).
We first analyzed the effects of rapamycin treatment on live zebrafish embryos beginning at the 1-cell stage up to 5 days post fertilization (dpf) (Fig. 2A). During the first 72 hours, rapamycin induced a mild, general developmental delay. To objectively assess its extent, we measured the head-trunk angle as a function of chronological age (supplemental figure S2). Rapamycin treatment shifted the curve to the right, but the shape of the curve was nearly identical to control, supporting the interpretation that the embryos were delayed, but not arrested.
Fig. 2. Effect of rapamycin on zebrafish embryonic development.
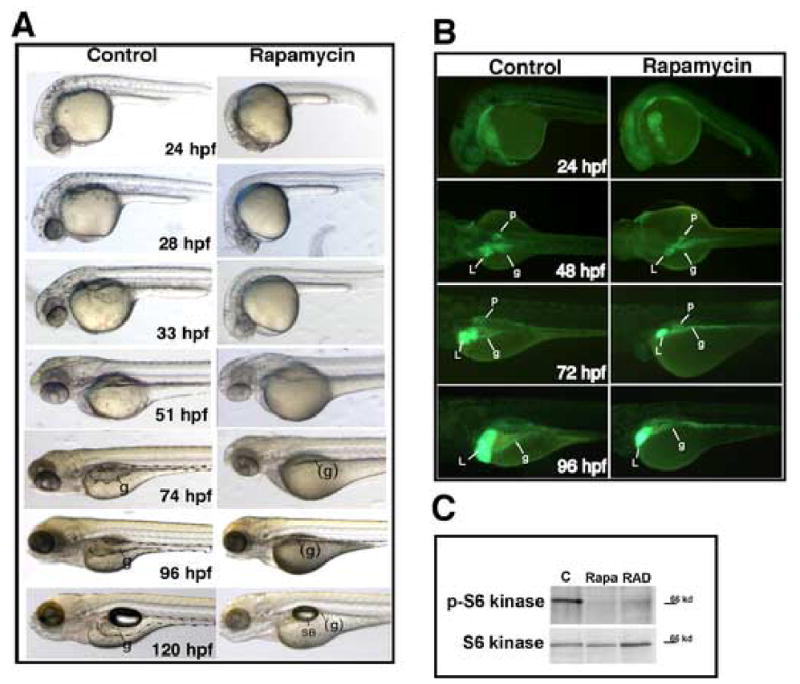
Zebrafish embryos were treated with 400 nM rapamycin continuously beginning at 1-cell stage and photographed at the indicated developmental stages. (A) Embryos treated with rapamycin are shown live. Up to 74 hpf rapamycin induced a generalized developmental delay. However by 120 hpf most structures in the rapamycin-treated embryos ultimately developed, with the notable exception of the digestive organs. Yolk absorption was also significantly delayed. (B) Fluorescence microscopy of live Gut-GFP transgenic embryos; green fluorescence marks the endoderm. Prior to 72 hpf, the size of the organs are concordant with the developmental stage, which is known to be delayed as seen in panels A and B. Embryos treated with rapamycin show a marked deceleration of digestive system growth after 72 hpf. (C) Western blot analysis of phospho-389-S6 kinase and total S6 kinase in rapamycin and RAD-001-treated zebrafish embryos. Embryos were treated at 24 hpf with 400 nM of the indicated drug and extract collected at 52 hpf. The blot shows virtually complete inhibition of TOR kinase by this criterion. Abbreviations: SB, swim bladder; L, liver; p, pancreas; g, gut; (g), approximate position of gut, but not discernible Original magnification: A, B 40x.
Normally, after 72 hpf the intestine becomes an increasingly prominent structure, occupying the ventral third of the body by 5 dpf. But in the rapamycin-treated larvae the gut tube was barely detectable at 5 dpf. To better visualize rapamycin’s effects on digestive organ growth, we treated embryos from the GutGFP transgenic line, which expresses enhanced green fluorescent protein (EGFP) in the gut, liver and pancreas (Ng et al., 2005). We confirmed that the early morphogenesis of the digestive tract up to 72 hpf was delayed by rapamycin, but patterning of the digestive tract was otherwise normal (Fig. 2B). In particular, the liver and pancreas bud from the gut tube at the expected A–P position, but they are clearly smaller than in control fish. Thus, rapamycin appears to affect the outgrowth of the digestive organs in addition to the intestine proper.
A well-established target of TOR kinase is p70 S6 kinase (S6K); the phosphorylation of S6K at Threonine 389 is sensitive to rapamycin (Fingar et al., 2002). We analyzed the effect of rapamycin on S6K phosphorylation by Western blot of 52 hpf embryo extracts (Fig 2C). Using phospho-T389-specific antibody, we noted a substantial decrease in response to rapamycin and RAD-001 treatment. These data demonstrate effective inhibition of a known downstream target of TOR in treated zebrafish.
During larval development, other structures outside the gastrointestinal tract developed relatively normally despite treatment with rapamycin. Vasculogenesis (including subintestinal vessels) appears normal based on alkaline phosphatase staining (Fig 3A, a and b). The branchial arches appeared essentially normal by alcian blue staining (Fig. 3A, c and d), and the pronephric epithelium (visualized with the α 6F antibody) appeared normal as well (Fig. 3A, e and f). Heart function and circulation were not perceptibly affected by rapamycin based on observations of live embryos (not shown). Further incubation with rapamycin up to 9 dpf revealed no further growth of the intestine (Fig. 3B), confirming its developmental arrest at an earlier stage.
Fig. 3.
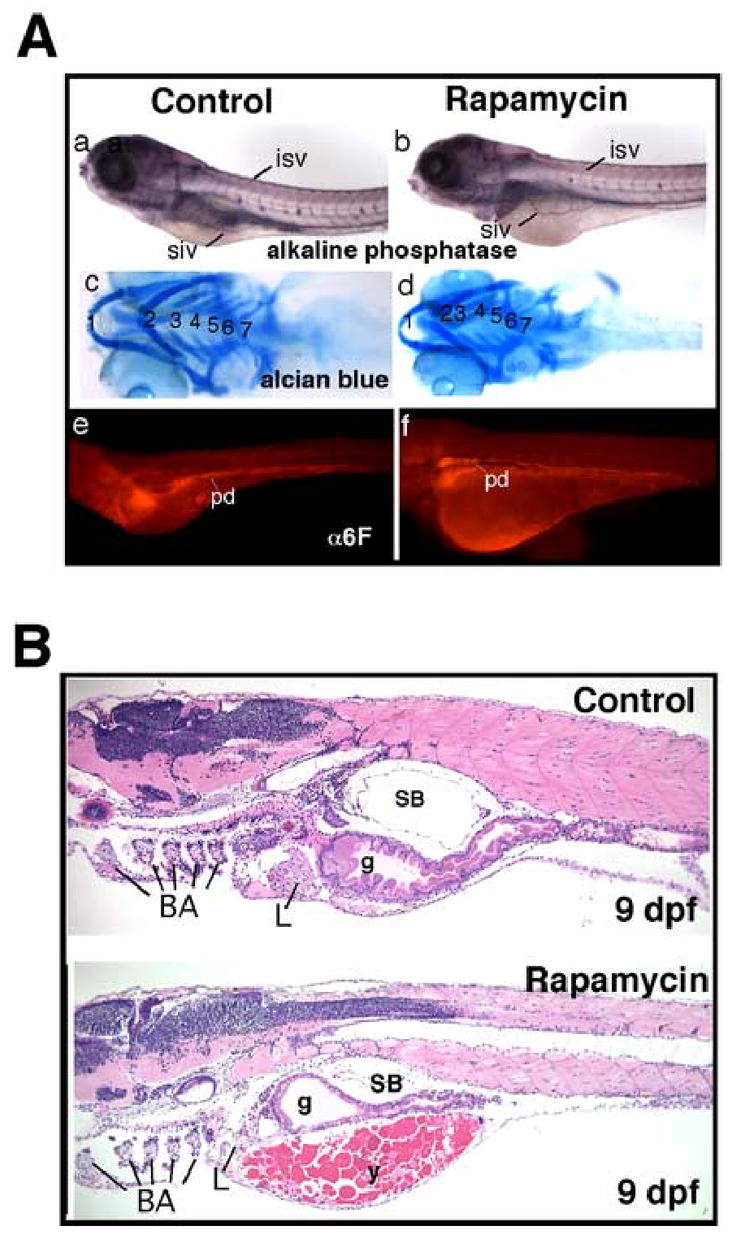
(A) (a, b) Whole mount staining for alkaline phosphatase in rapamycin-treated embryos demonstrated normal blood vessel morphogenesis; (c, d) alcian blue staining demonstrated that branchial arch formation was not significantly affected by rapamycin, though the size of the cranium and jaw was slightly smaller in treated embryos. Numerals denote the branchial arches; (e, f) Immunofluorescence staining for α6F subunit of Na/K ATPase reveal that the pronephric ducts are structurally normal in rapamycin-treated larvae. (B) Sagital sections of 9 dpf larvae stained with H&E, control and treated with rapamycin, demonstrating the disproportionate and enduring effect of rapamycin on gut development relative to the rest of the embryo. Abbreviations: BA, branchial arches; SB, swim bladder; isv, intersomitic vessels; siv, sub-intestinal vessels; pd, pronephric duct; L, liver; g, gut; y, yolk. Original magnification: A, 40x; B, 100x.
Morphometric analysis of developing intestine in rapamycin-treated embryos
Intestinal morphogenesis involves a concerted series of changes in the size and architecture of the epithelial cells that line the gut tube. To evaluate the effect of rapamycin on morphogenesis we performed histological cross sectioning at 3 locations along the A–P axis, in the foregut, midgut and hindgut regions. We analyzed samples by three criteria: cell number, cell size, and columnarity (height-to-width ratio) (Figs. 4A, supplemental Figs. S3 and S4). To ensure the validity of comparisons between embryos we chose sections relative to fixed points along the A–P axis using internal landmarks (i.e. pneumatic, duct, bile duct, etc.) as described in detail in Materials and Methods. The results for the midgut are described below, since this area displayed the most pronounced effects on growth and morphogenesis.
Fig. 4. Morphometric analysis of intestinal growth and morphogenesis in rapamycin treated larvae.
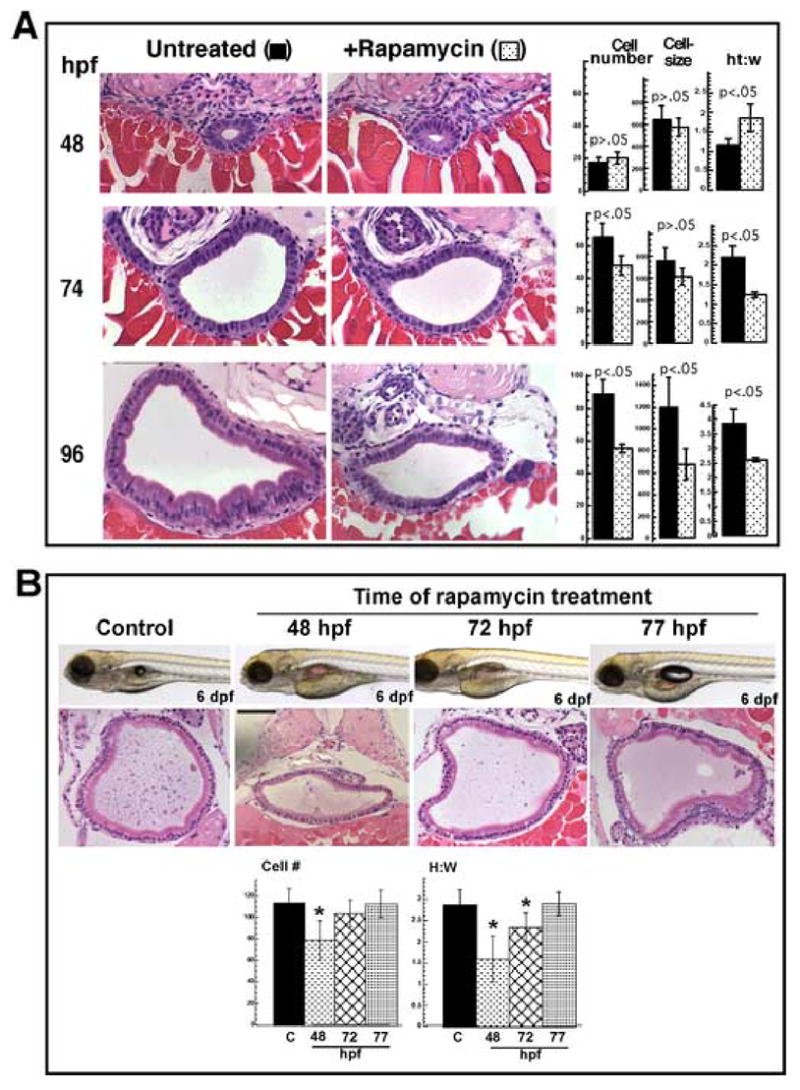
(A) Cross sections of the midgut stained with H&E, either untreated or treated with rapamycin, at the indicated stage. Morphometric analysis is summarized in the bar graphs to the right of the micrographs. Cell number refers to average number of epithelial cells composing the gut tube in a single section. Cell size is expressed in μm3 and is derived from average cell width and height measurements; ht:w is the ratio of average epithelial cell height to average width. Each measurement was derived from 2–3 sections at a similar location along the A–P axis, from 6 embryos (12–18 sections). There are minimal effects on growth before 72 hpf. Then at 96 hpf the foregut and midgut show the most pronounced sensitivity to rapamycin, whereas the hindgut, is less affected. (B) Embryos injected at the indicated stage with 400 nM rapamycin; live photo and corresponding cross section of the midgut stained with H&E at 6 dpf. Bar graphs summarized the morphometric analysis done as above (* p<0.05). Taken together, panels (A) and (B) suggest a discrete stage (about 70–72 hpf) at which the gut is sensitive to rapamycin treatment. Original magnification of micrographs, 200x.
At 48 hpf we found few differences between control and treated intestine with regard to cell number or size. The gut tube contained a central lumen (smaller in the rapamycin-treated embryos), and the cell morphology was consistent with undifferentiated intestine (Fig. 4A, 48 hpf). At 74 hpf, rapamycin treated embryos began to diverge from the controls along all three parameters. The gut tube was smaller due to the combined effect on cell number and size. Also, the cell morphology was more cuboidal in the rapamycin treated gut, and this was reflected by the average height-to-width ratio (2.2 in control vs 1.2 in treated) (Fig. 4A, 74 hpf).
To account for the decreased cell number in the rapamycin-treated embryos we measured the proliferation rate in the intestinal epithelium by BrdU incorporation (supplemental Fig. S4A). At 51 hpf, 27.2±5.1% of the cells were BrdU positive in the control (n=5 embryos), and 22.3±7.4% were positive in the rapamycin treated embryos (n=5 embryos) (p>0.05). At 72 hpf, 33.9±5.3% of the cells were BrdU positive (n=5 embryos), compared to 25.6±3.7% in the rapamycin treated embryos (n=9) (p<0.05). We did not detect any apoptosis by histological criteria or by TUNEL assay in the intestinal epithelium of control or treated embryos (not shown), whereas the TUNEL assay was positive in the anus of both control and treated larvae (internal positive control). Thus we attribute the decreased cell number in the epithelium to a decrease in the cell proliferation rate. The difference between controls and treated was not statistically significant at 51 hpf, but was significant at 72 hpf. This would suggest that the effect of rapamycin varies across this developmental time frame.
At 96 hpf the effect of rapamycin became much more pronounced. Normally at this stage the epithelial cells adopt the signature features of differentiated enterocytes: columnar morphology, basal nuclear localization and a distinct, eosinophilic apical cytoplasm. In the rapamycin treated animals the gut epithelial cells were less numerous and qualitatively different from controls. The nuclei were pleiomorphic and their location was less uniformly basal. The cells were smaller and less columnar, resembling normal epithelial cells at a much earlier stage (Fig. 4A, compare 96 hpf treated to 74 hpf control). This effect is not a transient delay since the appearance did not change substantially even by 9 dpf (Fig. 3B).
We performed a similar morphometric analysis on the anterior and posterior gut and found that the effects were qualitatively similar (supplemental Figure S3). The data from all three locations is integrated in supplemental Figure S4B, which depicts intestinal growth in a schematic, yet quantitative format. In the untreated fish, the anterior and midgut sections show the highest degree of expansion from 48 to 96 hfp. These regions were also the most sensitive to rapamycin, consistent with a critical role for TOR signaling in their growth and morphogenesis. The posterior gut was also affected by rapamycin, but to a much lesser degree.
The stage at which arrest occurred corresponded morphologically to about 72 hpf, which is when the intestine is undergoing a rapid growth phase (Wallace et al., 2005). The timing of this effect was shortly after the transient upregulation of ztor expression shown in Fig. 1, consistent with a critical role for TOR signaling at this time. To better define the window for rapamycin sensitivity, we treated larvae with rapamycin at different times between 48 and 77 hpf, and analyzed the phenotype at 6 dpf (Fig. 4B). The results showed an inhibition of intestinal growth in the larvae treated at 48 hpf, affecting both cell number and morphology. This effect was similar to treatment at 24 hpf (compare Fig 4A, 96 hpf, treated at 24 h vs. Fig. 4B, 6 dpf treated at 48 hr). Between 72 and 77 hpf, susceptibility to rapamycin decreased precipitously. Treatment at 72 hpf resulted in a mild decrement in cell number, but a more pronounced effect on cell morphology. At 77 hpf, there were no discernible effects of rapamycin, despite the fact that the intestine undergoes a substantial amount of growth between 77 hpf and the time of analysis at 6 dpf. Thus we have identified a developmental window during which TOR signaling is required for intestinal development.
Fig. 6. Rapamycin acts through TOR inhibition.
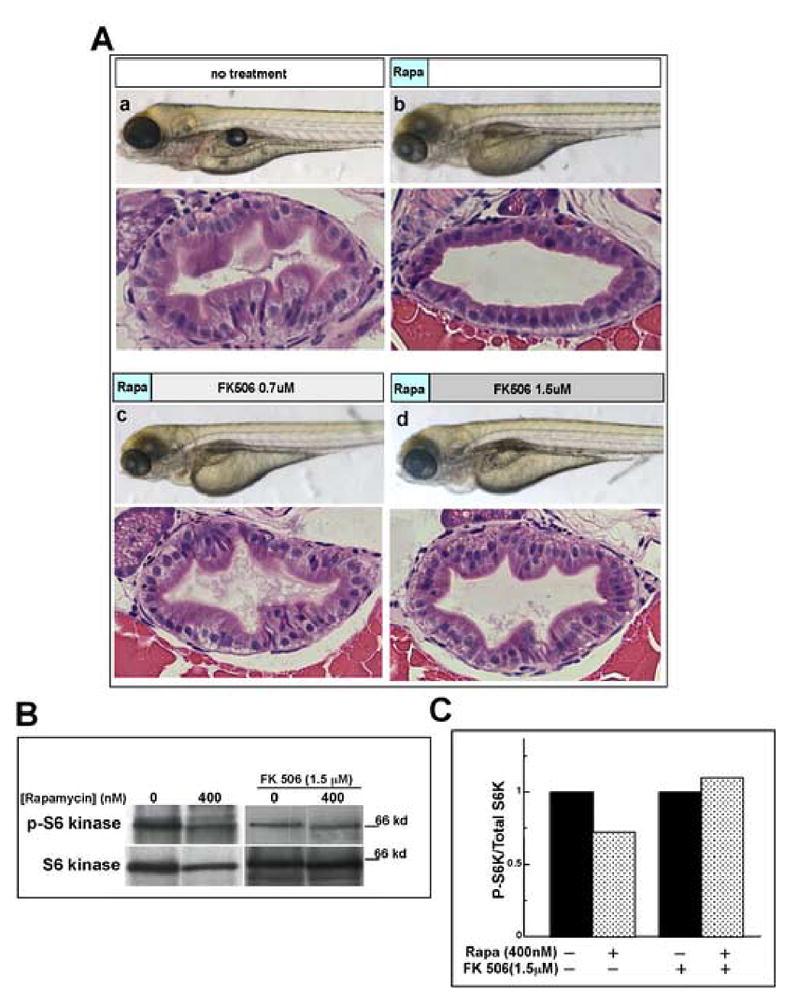
(A) FK506 rescues the rapamycin phenotype. Shown are live and sectioned 96 hpf embryos stained with H&E treated as follows: (a) no treatment; (b) rapamycin 0–3 hpf, no FK506; (c) rapamycin 0–3 hpf, then 0.7 μM FK506 3–96 hpf; (d) rapamycin 0–3 hpf, then 1.5 μM FK506 3–96 hpf. Comparing panel Ab to Ac and Ad shows that addition of FK506 attenuates the intestinal defect in a concentration dependent fashion. Magnification: live images are 40x and sections are 400x. (B) Western blot analysis of S6 kinase phosphorylation. Extracts from control and rapamycin-treated embryos were analyzed for total S6K and T389 phospho-S6K in the absence and presence of FK506. (C) Densitometric analysis of band intesities in panel (B) normalized for total S6 kinase show a 30% reduction of phospho-S6 kinase in rapamycin-treated embryos. FK506 treatment blocks this effect.
Rapamycin affects epithelial cell differentiation
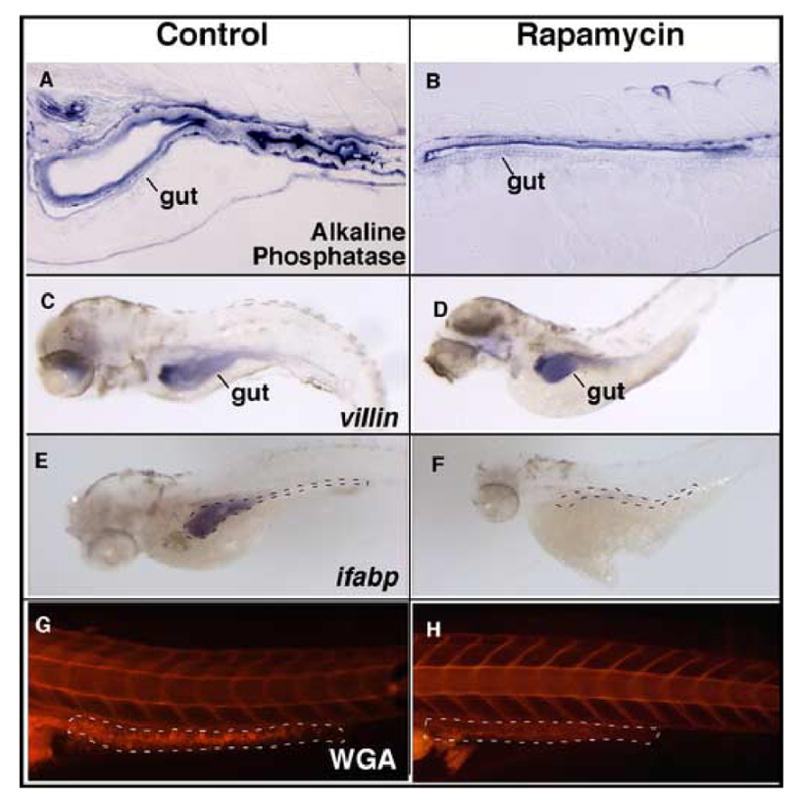
Since rapamycin interferes with intestinal morphogenesis, we wanted to know if cell type differentiation was affected as well. We tested the expression and localization of the enterocyte marker alkaline phosphatase, and found that rapamycin induced a discernible decrease in brush border staining, particularly on the ventral aspect of the gut (Fig 5A and B). However, the stain was properly localized to the apical aspect of the cells. Interestingly, villin expression was comparable in control and treated intestine (Fig 5C and D), but the enterocyte marker intestinal fatty acid binding protein (ifabp) was substantially reduced in rapamycin treated larvae (Fig 5E and F). These results indicate that enterocyte specification is not blocked by rapamycin, but differentiation is blocked at a stage delineated by the expression of ifabp.
Fig. 5. Effect of rapamycin on intestinal cell differentiation.
(A and B) Histochemical staining for alkaline phosphatase shows enzyme expression and localization to the apical aspect of the epithelial cells. Expression appears to be decreased in the treated embryos, particularly on the ventral epithelium. (C, D) Whole-mount in situ hybridization for the enterocyte marker villin is specific to the intestinal epithelium and is similar in treated and untreated embryos. (E, F) Whole-mount in situ hybridization for the enterocyte marker ifabp shows robust expression in controls, and barely detectable expression in rapamycin treated embryos. (G, H) Lateral view of whole mount stained embryos for goblet cell mucin using rhodamine-conjugated wheat germ agglutinin (WGA). Staining appears to be virtually undetectable in the posterior gut of treated embryos. Gut is outlined by black and white lines (in panels F and H, respectively). Original magnification is 100x in A and B, 40x in C–H.
We assessed for the presence of goblet cells using fluorescently labeled wheat germ agglutinin, and detected no signal in the gut of rapamycin treated embryos (Fig 5G and H). Thus, rapamycin blocked the later differentiation of epithelial cells consistent with a critical role for TOR signaling in the intestine’s developmental program.
TOR inhibition underlies the effect of rapamycin on intestinal development
To our knowledge, the only documented biological activity of rapamycin is inhibition of TOR signaling (Edinger et al., 2003). Nevertheless, we sought to verify that the effects of rapamycin on intestinal development were indeed via TOR inhibition. Rapamycin is known to inhibit TOR by forming a ternary complex with FK506 binding protein (FKBP). The drug FK506 also binds FKBP and competes with rapamycin, but this complex does not inhibit TOR. Accordingly, if the effect of rapamycin on intestinal development is indeed due to inhibition of TOR, then FK506 should be able to antagonize rapamycin’s effect. When we performed this experiment by comparing embryos treated continuously with rapamycin in the presence and absence of FK506, we saw no discernible differences (not shown). However, when we treated embryos with rapamycin between 0 and 3 hpf, then replaced the medium with either no drug or FK506, we observed that post-treatment with FK506 mitigates the effect of rapamycin in a dose-dependent manner (Fig. 6A). We performed Western blot analysis to detect phospho-389 S6 kinase in response to these treatments (Fig. 6B and C). In the absence of FK506, we noted a 30% reduction of the phospho-S6/total S6 kinase ratio (normalized to control). Addition of FK506 resulted in no changes in this ratio. These data support the interpretation that rapamycin affects intestinal development via the canonical mechanism for TOR inhibition.
Morpholino-mediated knockdown of TOR pathway components
Using a morpholino targeting a splice junction upstream of the TOR kinase domain, we effected a knockdown of ztor (Fig. 7A). This morpholino resulted in a relatively normal appearing embryo, except the intestine was small and the epithelium was poorly differentiated (Fig. 7B). The block in differentiation is reflected by the reduction in ifabp expression in the ztor morphants (Fig 7C). Sequencing of the aberrant RT-PCR product demonstrated that the morpholino induced utilization of a cryptic splice donor that interrupted the mRNA with several kb of intronic sequences. Targeting a different intron-exon junction gave a similar phenotype (not shown).
Fig. 7. Morpholino-mediated knockdown of TOR.
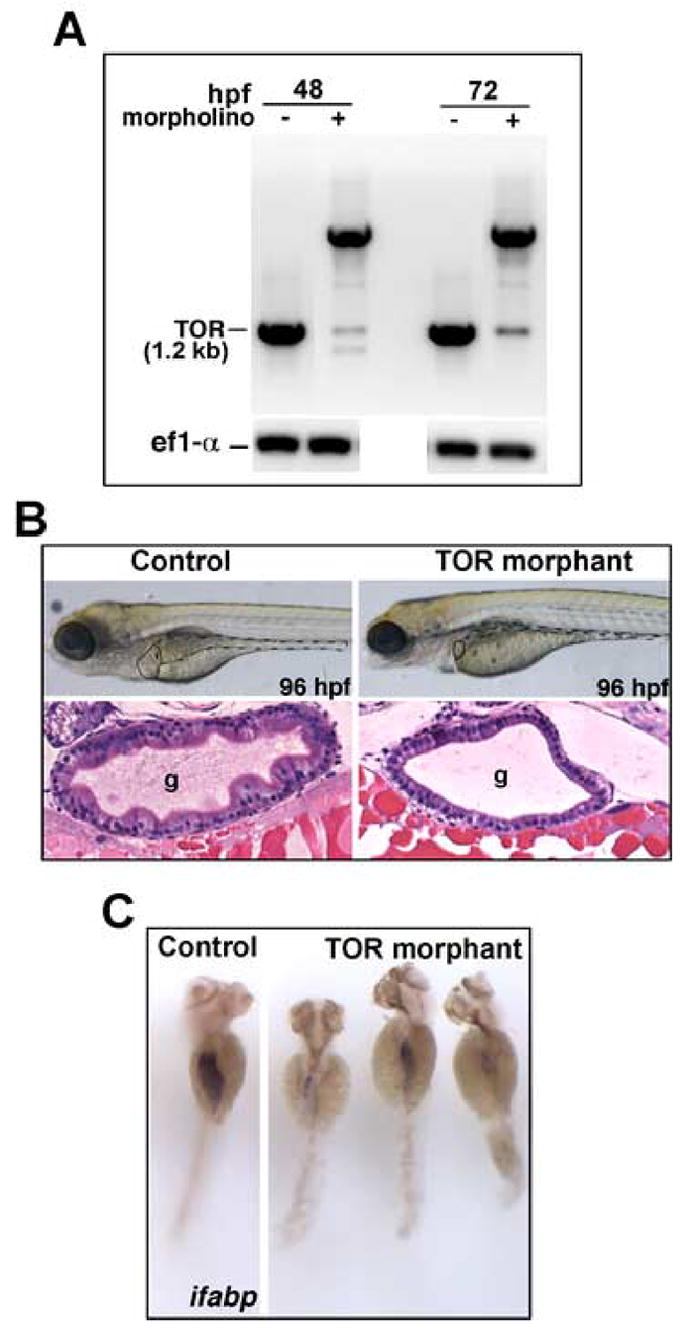
One to 4 cell-stage embryos were injected with morpholino oligonucleotide directed to a predicted splice site in the ztor transcript. (A) RT-PCR showed a reduction in ztor expression in conjunction with the appearance of an aberrant splice product at 48 and 72 hpf. By DNA sequencing this product was confirmed to contain a large intronic fragment derived from the genonic sequence. (B) Upper panels show live larvae at 96 hpf, with liver outlined by solid line, gut tube outlined by dashed line. Both liver and gut are several-fold smaller in TOR morphant. The rest of the larva (eg. head, somites) appears relatively normal. Lower panels show histological cross sections through the midgut stained with H&E. TOR morphants show hypoplastic intestine with defective epithelial morphogenesis; note lack of folds and cuboidal epithelial morphology in morphants, similar to the effect of rapamycin. (C) Whole mount in situ hybridization for ifabp demonstrating substantially lower expression in TOR morphant, indicating a differentiation defect similar to the effect of rapamycin. Original magnification B (live embryos) and C, is 40x; B, (histology) is 200x. Abbreviation: g, gut.
We also tested the functional role of s6k by morpholino-mediated knockdown. Splice-directed morpholinos induced a reduction in wild-type s6k message (Fig 8A), and induced an appearance similar to the rapamycin-treated embryos: mildly delayed, but with smaller, poorly differentiated gut tube (Fig. 8B). Intestinal epithelial folds were absent, and the cells were less columnar with pleimorphic nuclei located at random stations with respect to the apical-basal axis. These results are consistent with a role for S6K in mediating intestinal growth and morphogenesis.
Fig. 8. Morpholino-mediated knockdown of p70 S6 kinase.
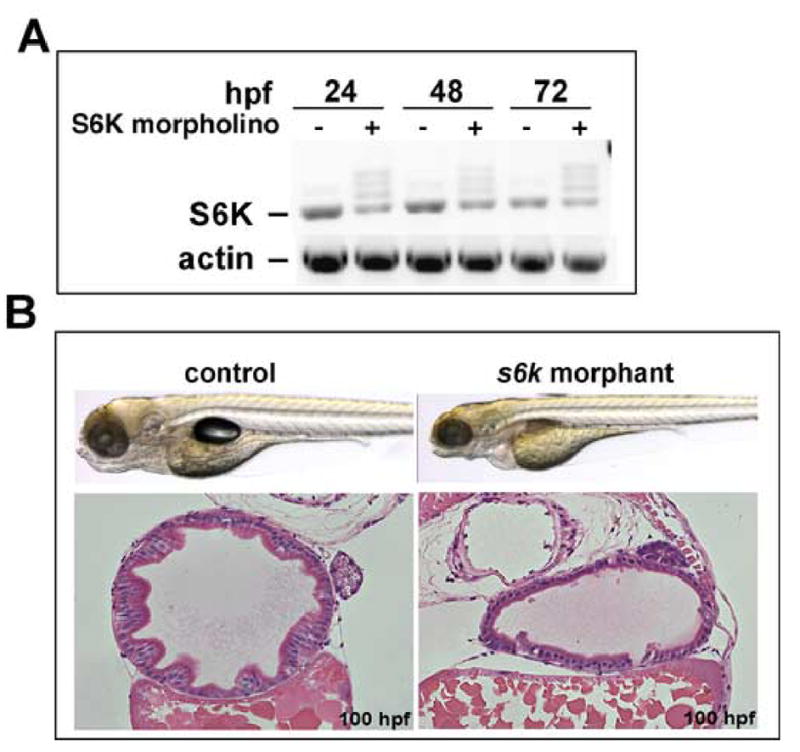
One to 4 cell-stage embryos were injected with morpholino directed to a predicted splice site in the p70 S6 Kinase transcript. (A) RT-PCR shows reduction of normal splice product in control and decreased product in morphant embryos, with aberrant splice products in the morphants. (B) Shown are live embryos and corresponding histological cross sections through the midgut of the control and morphant embryos. Knockdown of S6K results in a normally formed embryo with a specific defect in the digestive organs; histology reveals a poorly differentiated, featureless epithelium with cuboidal cellular morphology, similar to the TOR morphant and rapamycin treatment. Original magnification: 200x.
Intestinal development requires TOR complex 1
Two biochemically distinct TOR-containing complexes have been described previously. TOR complex 1 (TORC1) is rapamycin-sensitive and contains the protein Raptor (Hara et al., 2002; Kim et al., 2002), whereas TORC2 is rapamycin-insensitive and contains the protein Rictor (Sarbassov et al., 2004). The observation that rapamycin has a disproportionate effect on digestive development suggested that TORC1 is essential to this developmental process. Whereas TOR knockdown would be expected to affect both TORC1 and TORC2, the effect was similar to that of rapamycin treatment. This would suggest that TORC2 is not essential to this stage of intestinal development.
As an initial test of this idea we identified the zebrafish orthologs and determined the developmental expression pattern for both raptor and rictor by whole mount in situ hybridization (Fig. 9). Although, both genes were expressed in the head and endoderm at 34 hpf, only raptor is expressed in the nascent digestive organs at 48 hpf and 72 hpf. In contrast, rictor expression was nearly undetectable in these structures.
Fig. 9. Developmental expression of raptor and rictor.
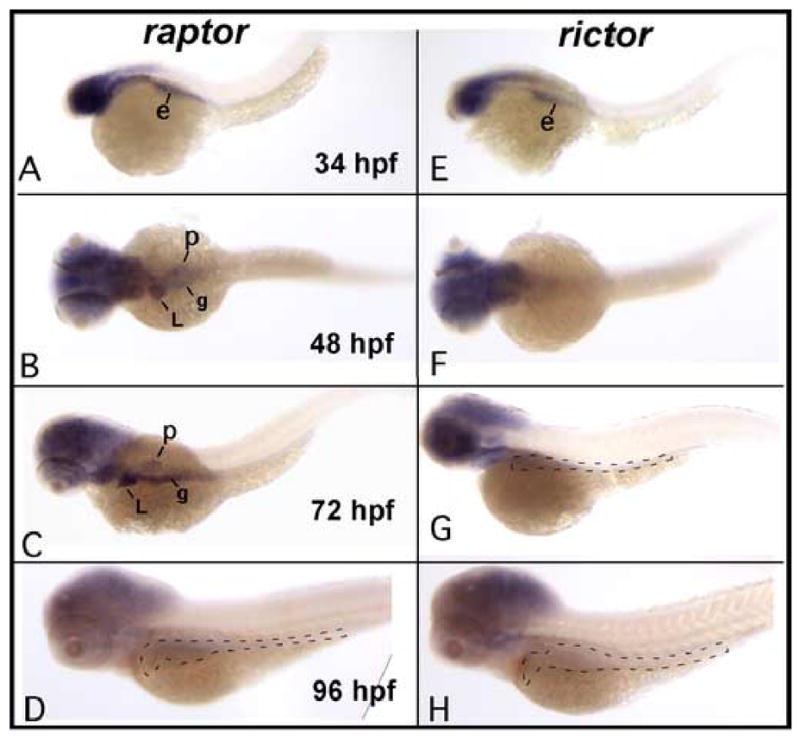
Whole mount in situ hybridization for raptor and rictor shows a similar pattern up to 34 hpf, after which the patterns diverge. Both genes are expressed in the head and the endoderm earlier, then raptor is selectively upregulated in the digestive organs at 48 and 72 hpf. Raptor then declines at 96 hpf. Rictor remains expressed in the head, but is not expressed later in the digestive tract. Original magnification 40x (all panels). Abbreviations: e, endoderm; L, liver; p, pancreas; g, gut. Dashed lines indicate the position of the digestive organs.
To further evaluate the respective roles of TORC1 and TORC2 during development, we performed morpholino-mediated knockdown of both raptor and rictor (Fig. 10). Knockdown of raptor phenocopied rapamycin treatment and the ztor and s6k morphants, featuring a smaller gut tube and poorly differentiated epithelium. In contrast, knockdown of rictor had minimal effects on intestinal growth or morphogenesis. These data support an essential role for TORC1 in regulating intestinal development; TORC2, in contrast, appears not to play a critical role at this stage.
Fig. 10. TOR complex 1 regulates intestinal growth.
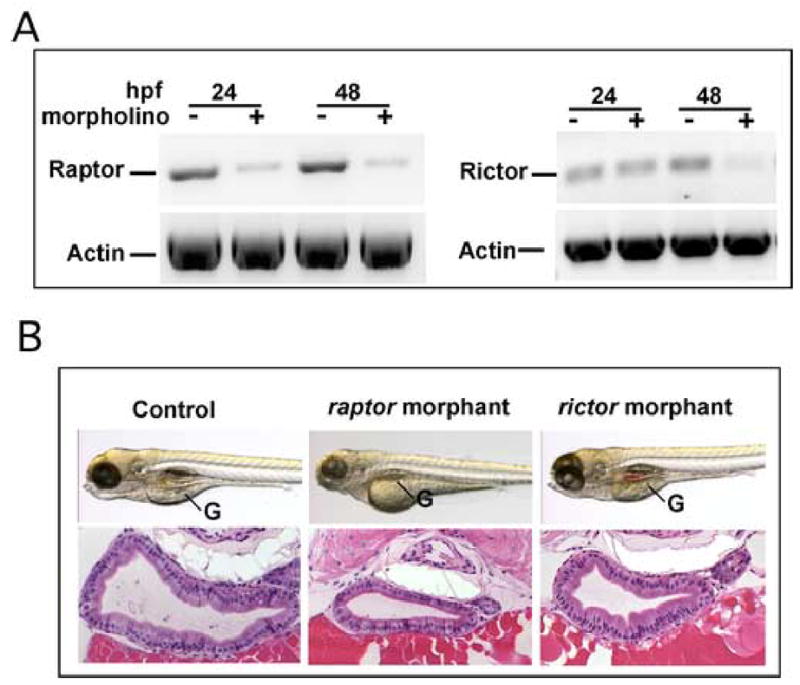
Splice-directed morpholinos to either raptor or rictor were microinjected into 1–4 cell stage embryos. (A) RT-PCR demonstrated a significant reduction of raptor at 24 hpf, whereas both messages were substantially reduced at 48 hpf. (B) Live embryos at 96 hpf and corresponding cross sections of the midgut stained with H&E show a substantial effect on gut morphology in the raptor morphant as compared to the rictor morphant. In the raptor morphant the gut tube is smaller and the cells are smaller and less columnar than in the rictor morphant. In contrast rictor knockdown had a negligible effect on intestinal development. Original magnification: 200x.
DISCUSSION
Here we report the initial broad examination of TOR signaling during zebrafish development. We found that rapamycin had an unexpectedly mild effect on early embryonic development, yet a marked effect on later digestive tract development. We also analyzed the effects of morpholino-mediated knockdown of TOR pathway components, and together the data support an essential role for TORC1 in the elaboration of a fully differentiated intestinal epithelium. TORC1 has been postulated to serve as a metabolic checkpoint, regulating cell growth in response to nutrient availability and growth factor signaling (Kim et al., 2002). Thus, in characterizing the defect induced by TORC1 inhibition, we have delineated a development step subject to regulation by this checkpoint apparatus.
Transcriptional regulation of TOR and raptor
Previous reports have described TOR expression as ubiquitous (Leevers and Hafen, 2004; Long et al., 2002; Sabers et al., 1995). The pattern we observed was both spatially and temporally dynamic, featuring a transient increase in the intestinal epithelium at about 60 hpf. Interestingly, the expression pattern for raptor, a defining component of the TORC1 complex, displayed a spatio-temporal pattern similar to ztor in the digestive tract between 48 and 72 hpf. TORC1 signaling thus appears to be regulated, at least in part, at the level of transcription of its key components. This seems logical, since at 60 hpf the gut tube is poised to undergo a major growth spurt; increased ztor and raptor expression may further amplify upstream signals that are known to activate TOR (growth factors, nutrients) to promote tissue expansion during this developmental period.
Organ- and stage-specificity of rapamycin effects and TORC1 function
In embryos treated from the 1-cell stage, the most enduring and pronounced effects of rapamycin are on the zebrafish digestive tract. Why these tissues displayed a disproportionate sensitivity to rapamycin is not clear, since other tissues such as the brain also express TOR and experience substantial growth during the same time frame. A review of the literature reveals unexplained differences in rapamycin sensitivity between species and between tissues within sensitive species. For example, in S. cerevisiae cell growth and division is sensitive to rapamycin (Heitman et al., 1991), whereas C. elegans displayed no sensitivity to rapamycin treatment (Long et al., 2002). In Drosophila, rapamycin treatment slowed development during early larval stages, eventually leading to lethality (Oldham et al., 2000) and rapamycin sensitivity was noted to be more pronounced in endoreplicative structures such as the salivary gland (Zhang et al., 2000). In the mouse, treating the E3.5 embryo with rapamycin inhibited proliferation of trophoblast more than the inner cell mass (Murakami et al., 2004), and later in mouse embryogenesis TOR is broadly required for proliferation (Hentges et al., 2001).
Perhaps the best context for assessing rapamycin sensitivity, owing to the sheer variety of cell phenotypes, is in cancer cells (Vignot et al., 2005). Of all variables examined, increased sensitivity to rapamycin seems to correlate best with the oncogenic inactivation of PTEN tumor suppressor, which leads to elevated signaling via phosphatidyl inositol 3-phosphate (PI3P) (Vignot et al., 2005). In other words, of the various means available for cells to engage in growth and proliferation, the PI3P route renders the cell particularly dependent on TOR signaling. Hence these cells display increased susceptibility to rapamycin. Analogously, increased signaling through the PI3K pathway in the developmental context may likewise be a critical determinant for rapamycin sensitivity. The intestine is known to require epidermal growth factor and insulin-like growth factor for normal growth, among other factors that act through the PI3K pathway (Abud et al., 2005; Dignass and Sturm, 2001). The tissue distribution and timing of the effects of rapamycin may thus be a consequence of the developmental activation of the PI3K pathway and the extent to which TORC1 transmits those signals to the cellular machinery.
In a recent report, Goldsmith et al (Goldsmith et al., 2006) demonstrated differential rapamycin sensitivity in adult versus juvenile fish in the caudal fin. They found that allometric growth in juvenile fish was rapamycin resistant/TOR-independent, but in the adult fish, isometric fin growth was rapamycin sensitive/TOR-dependent. These results provide additional evidence for the idea that TOR-dependence is not a uniform feature of all growth phenomena. Dependence on TOR signaling for growth may signify a high degree of reliance on nutrient sensing for growth control, for reasons that are yet to be discerned. The relatively mild effect of rapamycin on early embryonic development in zebrafish may reflect similar differences in TOR dependence. Likewise, the transition from TOR-dependent to TOR-independent growth in the developing intestine between 72 and 77 hpf may arise from a transition in growth control mechanisms.
The Developmental Role of TORC1
The morphogenic sequence for intestinal development in the zebrafish has been described in detail previously (Ng et al., 2005; Wallace et al., 2005), and can be divided conceptually into two stages. In the first stage, the primitive gut tube is fashioned from the endoderm between 32 and 40 hpf by the formation of junctional complexes at the nascent apices of the epithelial cells (Horne-Badovinac et al., 2001). The second stage of intestinal morphogenesis occurs between about 60 and 80 hpf. During this phase the epithelium adopts a columnar morphology, increases several-fold in size, forms folds, and diversifies into absorptive and secretory subtypes (Wallace et al., 2005). TORC1 appears to be selectively required for the later stages of intestinal development based on the observed defects in growth, morphogenesis and cell differentiation caused by its inhibition. Villin expression is initiated in the epithelium at about 70 hpf (ANM, unpublished results) and rapamycin treatment had no effect on its expression. However, rapamycin-treated embryos failed to fully activate ifabp by 96 hpf, even though expression is initiated between 72 and 84 hpf (Andre et al., 2000). Arrest of enterocyte differentiation between the onset of villin and ifabp expression thus delineates the requirement for TORC1 signaling to the developmental interval between 70 and 84 hpf. The gut specificity of this requirement is supported by the failure of rapamycin-treated larvae to elaborate goblet cells, whereas the branchial arches and swim bladder continue to grow beyond 96 hpf. By treating larvae with rapamycin at different times, we demonstrated that intestinal development transitions to a TORC1-independent mechanism between 72 and 77 hpf. Taken together with the marker expression data, this allows us to further narrow the window of TOR dependence to around 70 hpf.
We hypothesize that TORC1 may be serving as a permissive regulator of intestinal development at this juncture, when the primitive epithelium must commit to a dedicated program of growth, morphogenesis and differentiation. This would expand the repertoire of TORC1 function, most often invoked as a controller of cell growth and proliferation (Wullschleger et al., 2006). Recent work in the setting of neuronal differentiation in Drosophila points to a role for TOR in the coordination of developmental timing (Bateman and McNeill, 2004). The data presented here suggest that a similar role for TOR may be operative in the vertebrate digestive tract. This would suggest that TORC1 is required during a particular developmental window, and the timing of which may be reflected in the transient expression of tor and rictor in the intestine. It is not clear how directly TORC1 may be communicating with the intestine’s developmental program. It may be required to activate a cascade of gene expression that leads to a differentiated state, or to achieve an organ size threshold required to activate morphogenesis.
Supplementary Material
We determined the full length cDNA sequence for ztor and performed conceptual translation to determine the amino acid sequence. Clustal alignment of zTOR with yeast, mouse and human TOR orthologs, revealed a high degree of homology, particularly in the conserved FAT and Kinase domains. These are respectively highlighted in the red and black boxes. The blue line represents the third highly conserved FATC domain.
Head-trunk angle was calculated as a function of hours of development, revealing a rightward shift in the curve, but a similar profile. Untreated embryos, open squares (□); rapamycin treated embryos, black squares (■).
Shown are micrographs of foregut (A) and hindgut (B) either untreated or treated with rapamycin, beginning at 24 hpf until fixation at the indicated stage. Morphometric analysis (performed as described in Materials and Methods) is summarized in the bar graphs to the right of the micrographs. Cell number refers to average number of epithelial cells lining the gut tube per section. Cell size is given in μm3; ht:w is the ratio of epithelial cell height to width. These data accompany Fig. 3A to complete an anatomic survey of intestinal development as perturbed by rapamycin treatment. The data show differential effects on foregut (Fig. S3A), midgut (Fig. 4) and hindgut (Fig. S3B), which are summarized in Fig. S4. Original magnification: 400x in all micrographs.
(A)Bar graphs depict the percent of cells scored as BrdU positive at 51 and 74 hpf. (B) Semiquantitative representation of the effect of rapamycin on intestinal growth along the anterior-posterior (A-P) axis, and at three developmental time points. The A-P axis is schematically depicted along the x-axis (A, anterior, M, midgut, P, posterior). The y-axis represents the cross-sectional circumference of the gut at the position indicated in the live photograph; thus the length of the vertical lines is directly proportional to the measured circumference of the gut tube. The data is taken fromFig. 4 panel A and supplementary data (Fig. S3).
Acknowledgments
We thank Clifford Brugman for fish facility maintenance and animal husbandry; Benedetta B. Bonacci for technical assistance with histology and Drs. Vivian Lee and Stephen Duncan for valuable feedback on the manuscript. We thank the MCW Biostatistics consulting service for help with data analysis. We thank Novartis for providing a sample of RAD-001. This work was supported by grants to A.N.M. from the Children’s Research Institute at the Medical College of Wisconsin and the NIH (K08-DK002968).
Footnotes
Publisher's Disclaimer: This is a PDF file of an unedited manuscript that has been accepted for publication. As a service to our customers we are providing this early version of the manuscript. The manuscript will undergo copyediting, typesetting, and review of the resulting proof before it is published in its final citable form. Please note that during the production process errors may be discovered which could affect the content, and all legal disclaimers that apply to the journal pertain.
References
- Abraham RT. PI 3-kinase related kinases: ‘big’ players in stress-induced signaling pathways. DNA Repair (Amst) 2004;3:883–7. doi: 10.1016/j.dnarep.2004.04.002. [DOI] [PubMed] [Google Scholar]
- Abud HE, Watson N, Heath JK. Growth of intestinal epithelium in organ culture is dependent on EGF signalling. Exp Cell Res. 2005;303:252–62. doi: 10.1016/j.yexcr.2004.10.006. [DOI] [PubMed] [Google Scholar]
- Amsterdam A, Nissen RM, Sun Z, Swindell EC, Farrington S, Hopkins N. Identification of 315 genes essential for early zebrafish development. Proc Natl Acad Sci U S A. 2004;101:12792–7. doi: 10.1073/pnas.0403929101. [DOI] [PMC free article] [PubMed] [Google Scholar]
- Andre M, Ando S, Ballagny C, Durliat M, Poupard G, Briancon C, Babin PJ. Intestinal fatty acid binding protein gene expression reveals the cephalocaudal patterning during zebrafish gut morphogenesis. Int J Dev Biol. 2000;44:249–52. [PubMed] [Google Scholar]
- Bateman JM, McNeill H. Temporal control of differentiation by the insulin receptor/tor pathway in Drosophila. Cell. 2004;119:87–96. doi: 10.1016/j.cell.2004.08.028. [DOI] [PubMed] [Google Scholar]
- Dignass AU, Sturm A. Peptide growth factors in the intestine. Eur J Gastroenterol Hepatol. 2001;13:763–70. doi: 10.1097/00042737-200107000-00002. [DOI] [PubMed] [Google Scholar]
- Edinger AL, Linardic CM, Chiang GG, Thompson CB, Abraham RT. Differential effects of rapamycin on mammalian target of rapamycin signaling functions in mammalian cells. Cancer Res. 2003;63:8451–60. [PubMed] [Google Scholar]
- Fingar DC, Salama S, Tsou C, Harlow E, Blenis J. Mammalian cell size is controlled by mTOR and its downstream targets S6K1 and 4EBP1/eIF4E. Genes Dev. 2002;16:1472–87. doi: 10.1101/gad.995802. [DOI] [PMC free article] [PubMed] [Google Scholar]
- Fishman MC. Genomics. Zebrafish--the canonical vertebrate. Science. 2001;294:1290–1. doi: 10.1126/science.1066652. [DOI] [PubMed] [Google Scholar]
- Gangloff YG, Mueller M, Dann SG, Svoboda P, Sticker M, Spetz JF, Um SH, Brown EJ, Cereghini S, Thomas G, Kozma SC. Disruption of the mouse mTOR gene leads to early postimplantation lethality and prohibits embryonic stem cell development. Mol Cell Biol. 2004;24:9508–16. doi: 10.1128/MCB.24.21.9508-9516.2004. [DOI] [PMC free article] [PubMed] [Google Scholar]
- Gao X, Zhang Y, Arrazola P, Hino O, Kobayashi T, Yeung RS, Ru B, Pan D. Tsc tumour suppressor proteins antagonize amino-acid-TOR signalling. Nat Cell Biol. 2002;4:699–704. doi: 10.1038/ncb847. [DOI] [PubMed] [Google Scholar]
- Goldsmith MI, Iovine MK, O’Reilly-Pol T, Johnson SL. A developmental transition in growth control during zebrafish caudal fin development. Dev Biol. 2006;296:450–7. doi: 10.1016/j.ydbio.2006.06.010. [DOI] [PubMed] [Google Scholar]
- Hara K, Maruki Y, Long X, Yoshino K, Oshiro N, Hidayat S, Tokunaga C, Avruch J, Yonezawa K. Raptor, a binding partner of target of rapamycin (TOR), mediates TOR action. Cell. 2002;110:177–89. doi: 10.1016/s0092-8674(02)00833-4. [DOI] [PubMed] [Google Scholar]
- Heitman J, Movva NR, Hall MN. Targets for cell cycle arrest by the immunosuppressant rapamycin in yeast. Science. 1991;253:905–9. doi: 10.1126/science.1715094. [DOI] [PubMed] [Google Scholar]
- Hentges KE, Sirry B, Gingeras AC, Sarbassov D, Sonenberg N, Sabatini D, Peterson AS. FRAP/mTOR is required for proliferation and patterning during embryonic development in the mouse. Proc Natl Acad Sci U S A. 2001;98:13796–801. doi: 10.1073/pnas.241184198. [DOI] [PMC free article] [PubMed] [Google Scholar]
- Horne-Badovinac S, Lin D, Waldron S, Schwarz M, Mbamalu G, Pawson T, Jan Y, Stainier DY, Abdelilah-Seyfried S. Positional cloning of heart and soul reveals multiple roles for PKC lambda in zebrafish organogenesis. Curr Biol. 2001;11:1492–502. doi: 10.1016/s0960-9822(01)00458-4. [DOI] [PubMed] [Google Scholar]
- Inoki K, Corradetti MN, Guan KL. Dysregulation of the TSC-mTOR pathway in human disease. Nat Genet. 2005;37:19–24. doi: 10.1038/ng1494. [DOI] [PubMed] [Google Scholar]
- Jin SB, Zhao J, Bjork P, Schmekel K, Ljungdahl PO, Wieslander L. Mrd1p is required for processing of pre-rRNA and for maintenance of steady-state levels of 40 S ribosomal subunits in yeast. J Biol Chem. 2002;277:18431–9. doi: 10.1074/jbc.M112395200. [DOI] [PubMed] [Google Scholar]
- Kim DH, Sarbassov DD, Ali SM, King JE, Latek RR, Erdjument-Bromage H, Tempst P, Sabatini DM. mTOR interacts with raptor to form a nutrient-sensitive complex that signals to the cell growth machinery. Cell. 2002;110:163–75. doi: 10.1016/s0092-8674(02)00808-5. [DOI] [PubMed] [Google Scholar]
- Kimmel CB, Ballard WW, Kimmel SR, Ullmann B, Schilling TF. Stages of embryonic development of the zebrafish. Dev Dyn. 1995;203:253–310. doi: 10.1002/aja.1002030302. [DOI] [PubMed] [Google Scholar]
- Leevers SJ, Hafen E. Growth Regulation by Insulin and TOR Signaling in Drosophila. In: Hall MN, Raff M, Thomas G, editors. Cell Growth. Cold Spring Harbor Press; Cold Spring Harbor, NY: 2004. pp. 167–192. [Google Scholar]
- Long X, Spycher C, Han ZS, Rose AM, Muller F, Avruch J. TOR deficiency in C. elegans causes developmental arrest and intestinal atrophy by inhibition of mRNA translation. Curr Biol. 2002;12:1448–61. doi: 10.1016/s0960-9822(02)01091-6. [DOI] [PubMed] [Google Scholar]
- Mayer AN, Fishman MC. Nil per os encodes a conserved RNA recognition motif protein required for morphogenesis and cytodifferentiation of digestive organs in zebrafish. Development. 2003;130:3917–28. doi: 10.1242/dev.00600. [DOI] [PubMed] [Google Scholar]
- Murakami M, Ichisaka T, Maeda M, Oshiro N, Hara K, Edenhofer F, Kiyama H, Yonezawa K, Yamanaka S. mTOR is essential for growth and proliferation in early mouse embryos and embryonic stem cells. Mol Cell Biol. 2004;24:6710–8. doi: 10.1128/MCB.24.15.6710-6718.2004. [DOI] [PMC free article] [PubMed] [Google Scholar]
- Naomoto Y, Yamatsuji T, Shigemitsu K, Ban H, Nakajo T, Shirakawa Y, Motok T, Kobayashi M, Gunduz M, Tanaka N. Rational role of amino acids in intestinal epithelial cells (Review) Int J Mol Med. 2005;16:201–4. [PubMed] [Google Scholar]
- Ng AN, de Jong-Curtain TA, Mawdsley DJ, White SJ, Shin J, Appel B, Dong PD, Stainier DY, Heath JK. Formation of the digestive system in zebrafish: III. Intestinal epithelium morphogenesis. Dev Biol. 2005;286:114–35. doi: 10.1016/j.ydbio.2005.07.013. [DOI] [PubMed] [Google Scholar]
- Oldham S, Montagne J, Radimerski T, Thomas G, Hafen E. Genetic and biochemical characterization of dTOR, the Drosophila homolog of the target of rapamycin. Genes Dev. 2000;14:2689–94. doi: 10.1101/gad.845700. [DOI] [PMC free article] [PubMed] [Google Scholar]
- Peterson RT, Fishman MC. Discovery and use of small molecules for probing biological processes in zebrafish. Methods Cell Biol. 2004;76:569–91. doi: 10.1016/s0091-679x(04)76026-4. [DOI] [PubMed] [Google Scholar]
- Sabers CJ, Martin MM, Brunn GJ, Williams JM, Dumont FJ, Wiederrecht G, Abraham RT. Isolation of a protein target of the FKBP12-rapamycin complex in mammalian cells. J Biol Chem. 1995;270:815–22. doi: 10.1074/jbc.270.2.815. [DOI] [PubMed] [Google Scholar]
- Saijou E, Fujiwara T, Suzaki T, Inoue K, Sakamoto H. RBD-1, a nucleolar RNA-binding protein, is essential for Caenorhabditis elegans early development through 18S ribosomal RNA processing. Nucleic Acids Res. 2004;32:1028–36. doi: 10.1093/nar/gkh264. [DOI] [PMC free article] [PubMed] [Google Scholar]
- Sarbassov DD, Ali SM, Kim DH, Guertin DA, Latek RR, Erdjument-Bromage H, Tempst P, Sabatini DM. Rictor, a novel binding partner of mTOR, defines a rapamycin-insensitive and raptor-independent pathway that regulates the cytoskeleton. Curr Biol. 2004;14:1296–302. doi: 10.1016/j.cub.2004.06.054. [DOI] [PubMed] [Google Scholar]
- Schilling TF, Piotrowski T, Grandel H, Brand M, Heisenberg CP, Jiang YJ, Beuchle D, Hammerschmidt M, Kane DA, Mullins MC, van Eeden FJ, Kelsh RN, Furutani-Seiki M, Granato M, Haffter P, Odenthal J, Warga RM, Trowe T, Nusslein-Volhard C. Jaw and branchial arch mutants in zebrafish I: branchial arches. Development. 1996;123:329–44. doi: 10.1242/dev.123.1.329. [DOI] [PubMed] [Google Scholar]
- Vignot S, Faivre S, Aguirre D, Raymond E. mTOR-targeted therapy of cancer with rapamycin derivatives. Ann Oncol. 2005;16:525–37. doi: 10.1093/annonc/mdi113. [DOI] [PubMed] [Google Scholar]
- Wallace KN, Akhter S, Smith EM, Lorent K, Pack M. Intestinal growth and differentiation in zebrafish. Mech Dev. 2005;122:157–73. doi: 10.1016/j.mod.2004.10.009. [DOI] [PubMed] [Google Scholar]
- Westerfield M. The Zebrafish Book. The University of Oregon Press; Eugene: 1995. [Google Scholar]
- Wullschleger S, Loewith R, Hall MN. TOR signaling in growth and metabolism. Cell. 2006;124:471–84. doi: 10.1016/j.cell.2006.01.016. [DOI] [PubMed] [Google Scholar]
- Zhang H, Stallock JP, Ng JC, Reinhard C, Neufeld TP. Regulation of cellular growth by the Drosophila target of rapamycin dTOR. Genes Dev. 2000;14:2712–24. doi: 10.1101/gad.835000. [DOI] [PMC free article] [PubMed] [Google Scholar]
Associated Data
This section collects any data citations, data availability statements, or supplementary materials included in this article.
Supplementary Materials
We determined the full length cDNA sequence for ztor and performed conceptual translation to determine the amino acid sequence. Clustal alignment of zTOR with yeast, mouse and human TOR orthologs, revealed a high degree of homology, particularly in the conserved FAT and Kinase domains. These are respectively highlighted in the red and black boxes. The blue line represents the third highly conserved FATC domain.
Head-trunk angle was calculated as a function of hours of development, revealing a rightward shift in the curve, but a similar profile. Untreated embryos, open squares (□); rapamycin treated embryos, black squares (■).
Shown are micrographs of foregut (A) and hindgut (B) either untreated or treated with rapamycin, beginning at 24 hpf until fixation at the indicated stage. Morphometric analysis (performed as described in Materials and Methods) is summarized in the bar graphs to the right of the micrographs. Cell number refers to average number of epithelial cells lining the gut tube per section. Cell size is given in μm3; ht:w is the ratio of epithelial cell height to width. These data accompany Fig. 3A to complete an anatomic survey of intestinal development as perturbed by rapamycin treatment. The data show differential effects on foregut (Fig. S3A), midgut (Fig. 4) and hindgut (Fig. S3B), which are summarized in Fig. S4. Original magnification: 400x in all micrographs.
(A)Bar graphs depict the percent of cells scored as BrdU positive at 51 and 74 hpf. (B) Semiquantitative representation of the effect of rapamycin on intestinal growth along the anterior-posterior (A-P) axis, and at three developmental time points. The A-P axis is schematically depicted along the x-axis (A, anterior, M, midgut, P, posterior). The y-axis represents the cross-sectional circumference of the gut at the position indicated in the live photograph; thus the length of the vertical lines is directly proportional to the measured circumference of the gut tube. The data is taken fromFig. 4 panel A and supplementary data (Fig. S3).


