Abstract
We have combined hyperspectral imaging with spectral domain optical coherence tomography (SDOCT) to non-invasively image changes in hemoglobin saturation, blood flow, microvessel morphology and sheer rate on the vessel wall with tumor growth. Changes in these hemodynamic variables were measured over 24 hours in dorsal skin fold window chamber tumors. There was a strong correlation between volumetric flow and hemoglobin saturation (ρ = 0.89, p = 9 × 10⁻⁶, N = 15), and a moderate correlation between shear rate on the vessel wall and hemoglobin saturation (ρ = 0.56, p = 0.03, N=15).
Hypoxia is important in regulating tumor aggressiveness and treatment resistance, and thus serves as a valuable biomarker for tumor treatment outcome. A better understanding of tumor microcirculation would provide a basis for improved prognostic and treatment approaches for solid tumors. In tumors, formation of new vessels and remodeling and dropout of existing vessels occurs continuously, resulting in temporal variations in flow and oxygenation [1]. Dynamic imaging of vessel morphology, hemoglobin oxygen saturation, blood flow and shear rate on the vessel wall would provide valuable insight into the mechanisms and distribution of cycling hypoxia in growing tumors. For example, these data will allow for direct observation of tumor microvessel response to changing hemodynamic and metabolic conditions induced by cancer treatments.
Tumor hemodynamics on the microvascular level have traditionally been studied with invasive methods or highly localized (non-imaging) methods. Confocal or multiphoton microscopy coupled with a vascular contrast agent has been widely used in animal models to track changes in vessel morphology [2]. Blood flow in small vessels has been limited to point measurements using video-rate microscopy and single cell counting [1] or laser doppler flowmetry [3]. Tumor oxygenation has been quantified with fluorescence lifetime imaging of a pO2 calibrated dye [4] or with microelectrode measurements [3]. Point measurements of shear rates on vessel walls have also been estimated with video microscopy [5]. Non-invasive imaging methods are currently emerging to replace these traditional techniques. Speckle variance optical coherence tomography (OCT) has recently shown promise for monitoring changes in vessel morphology with photodynamic therapy in the dorsal skin fold window chamber [2]. Doppler OCT imaging of blood flow direction and velocity profiles within vessels [6], and hyperspectral imaging of tumor hemoglobin oxygenation saturation [7] have also been shown separately to provide valuable information on tumor vessel function. However, a complete picture of tumor hemodynamics requires multi-dimensional image data including vessel morphology, blood velocity profiles and direction of flow, and hemoglobin oxygen saturation.
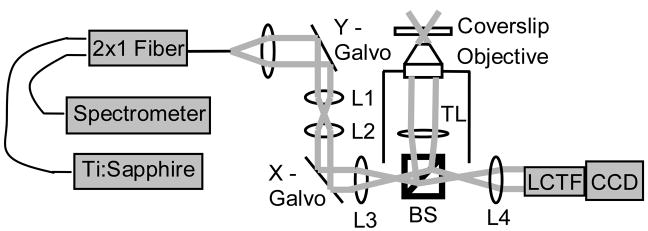
We have combined hyperspectral imaging with OCT to non-invasively image changes in vascular morphology, hemoglobin oxygen saturation, blood velocity and direction of flow, and shear rate on the vessel wall with tumor growth. This combined microscope provides a wealth of information on the dynamics of structural and functional changes in tumor vasculature. Hyperspectral (hemoglobin oxygen saturation) and SDOCT (blood flow and vascular morphology) arms were connected through two separate baseports in an inverted microscope (Carl Zeiss Axiovert 200) (Fig. 1). Two-dimensional hyperspectral images were collected with a 100 W halogen lamp for transillumination, and detection was achieved with a liquid crystal tunable filter (LCTF) (CRI Inc.) placed in front of a DVC 1412 CCD camera (DVC Company) [7]. Custom software was used to tune the filter and acquire images at 10 nm increments between 500 and 610 nm. Measurements of the dark offset and transmission through a neutral density filter at each wavelength were made before each imaging session. Hemoglobin saturation images were calculated by applying an extension of the Beer-Lambert law to the wavelength-dependent absorption at each pixel (assuming oxygenated and deoxygenated hemoglobin as the only absorbers), and then solving for hemoglobin saturation with linear least-squares regression [7]. The system, software and analysis techniques have previously been validated on liquid phantoms with an accuracy of approximately 1% and in vivo [7].
Figure 1.
Schematic of the combined hyperspectral/SDOCT microscope. L1-L4, lenses 1–4; TL, tube lens; BS, beam splitter; LCTF, liquid crystal tunable filter.
The common-path spectral domain OCT arm consists of a Ti:Sapphire laser source (Femtolasers) centered at 790 nm with a 90 nm full width at half-maximum. The interferogram is detected using a custom-made spectrometer with a line scan CCD camera (Atmel, Aviiva). The OCT system is driven by software that controls the lateral scanner and performs data acquisition and archiving (Bioptigen, Inc.). Three-dimensional blood flow images were collected with Doppler OCT, which measures phase changes due to flowing erythrocytes. Phase changes are calculated from multiple A-scans collected at the same position in the volume, and can be related to flow velocity profiles by measuring the angle of incidence in the three-dimensional volume. Three-dimensional morphology was collected with speckle variance OCT, which detects blood vessels from the variance in the speckle pattern between sequential B-scan magnitude images [2]. Speckle variance is advantageous for morphology mapping because it is independent of the angle between the blood flow and the incident beam. However, it is currently not capable of accurately quantifying blood velocity or flow direction.
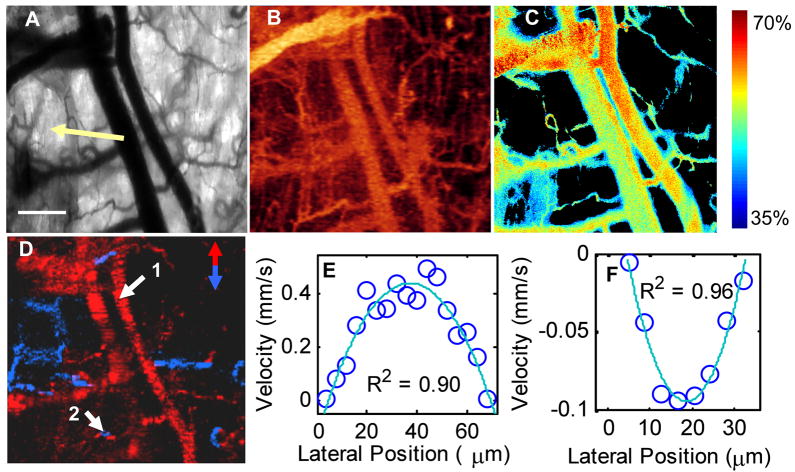
Hyperspectral, Doppler OCT and speckle variance OCT images were collected from 4T1 tumors implanted in dorsal skin fold window chambers in nude mice. Surgery and imaging were carried out under ketamine/xylazine and Isoflurane anesthesia, respectively, with the mice maintained at body temperature (conducted with institutional approval at Duke University). The transmission image of the window chamber morphology (Fig. 2(a)) and hyperspectral image of the percent hemoglobin oxygenation saturation in the vessels (Fig. 2(c)) were taken with a 2.5X objective (NA = 0.12). Speckle variance OCT (Fig. 2(b)) provides three-dimensional vessel morphology and Doppler OCT (Fig. 2(d)) provides three-dimensional vessel flow velocities and flow direction. Speckle variance and Doppler OCT images were collected over a 1×1 mm area with 250×125 pixels, and 1024 pixels in the depth dimension. OCT images were collected with a 4X objective (NA = 0.1) with a 1 ms integration time for each A-line. Eight repeated B-scans were collected for speckle variance OCT, registered using “stackreg” for ImageJ, and 10 repeated A-scans were colleted for Doppler OCT. The flow profiles in Fig. 2(e) and (f) were fit to a second order polynomial and corrected for the angle of incidence to provide velocity in mm/s. Maximum blood velocity is determined from the peak of this fit, vessel diameter is determined from the zero-crossings of the fit, and the shear rate on the vessel wall is calculated from the derivative of the fit (dvz/dr), assuming a Newtonian fluid [8]. Co-registration of speckle variance OCT, hyperspectral, and Doppler OCT images allow for vessel morphology, percent hemoglobin oxygen saturation, blood velocity and direction of flow, and shear rate on the vessel to be determined at any point within the window chamber.
Figure 2.
Multidimensional functional imaging of 4T1 tumor vasculature in the dorsal skin fold mouse window chamber. Transmission image of the window chamber taken with the liquid crystal tunable filter set at 500 nm, with a portion of the tumor visible (arrow, a). Scale bar is 200μm. Speckle variance OCT image of vessel morphology shown as an en face average intensity projection over 1 mm depth (b). Hyperspectral image of percent hemoglobin oxygen saturation (c), thresholded for the R-squared value of the linear fit and total absorption value at each pixel (background pixels are black). Doppler OCT image of vessel blood flow direction shown as an en face maximum intensity projection over depth (d), with red vessels flowing toward the top of the image, and blue vessels flowing toward the bottom of the image. The flow profiles at point 1 (e) and point 2 (f) were fit to a second order polynomial and corrected for the angle of incidence to provide velocity in mm/s.
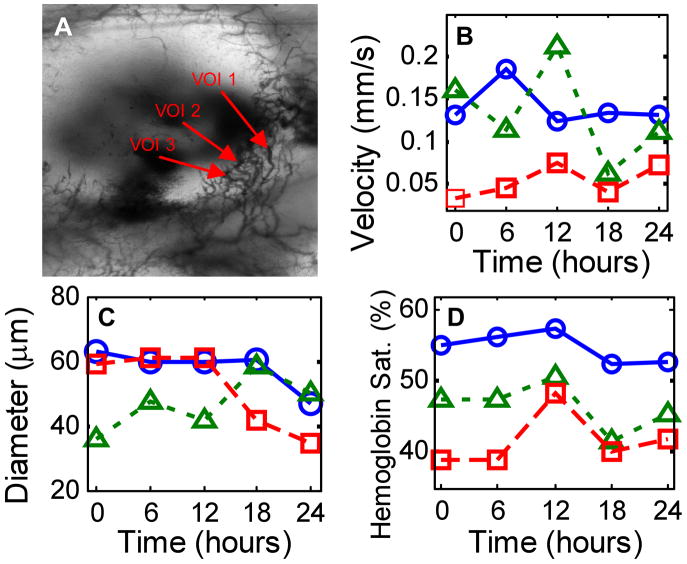
Changes in hemoglobin saturation, vessel morphology and blood flow with tumor growth were measured in a 14-day old 4T1 tumor in the dorsal skin fold window chamber (Fig. 3). Hyperspectral and Doppler OCT data sets were collected every six hours for twenty-four hours. The blood velocity and hemoglobin saturation as a function of time are shown for three vessel cross-sections of interest (VOI) in Fig. 3. The measured hemoglobin saturation values fall within the expected range [9, 10]. Note that the pO2 of peripheral arteries in both tumors [9] and normal tissues [10] can be substantially less than 95% saturated due to loss of oxygen from the peripheral arterial tree (longitudinal oxygen gradient). The extracted maximum velocities and vessel diameters are in agreement with previously published values from the window chamber model [11]. Variations in red blood cell flux and pO2 [1], hemoglobin oxygen saturation [7], and diameter [12] have previously been observed in tumors over time scales ranging from one hour to several days.
Figure 3.
Time series data taken from a 4T1 window chamber tumor using the combined hyperspectral/OCT microscope. The transmission image (a) is 3 mm (height) by 2 mm (width) and delineates the three vessel cross-sections of interest (VOI) for which maximum blood velocity (b), diameter (c), and hemoglobin saturation (d) are plotted (○ VOI 1; Δ VOI 2; □ VOI 3).
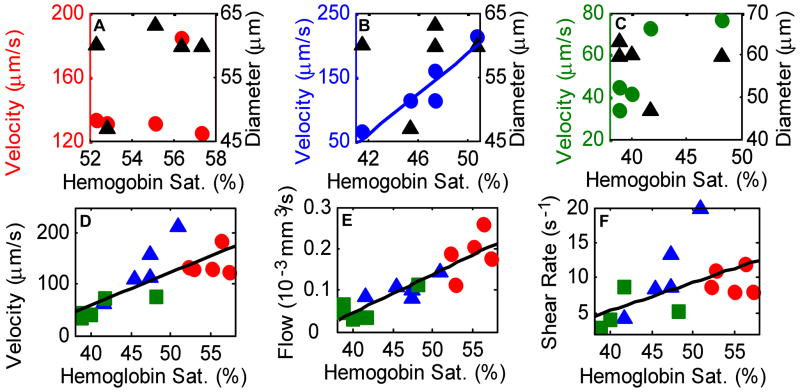
The relationship between the maximum velocity, diameter, flow rate, shear rate and hemoglobin oxygen saturation for the same three vessels is shown in Fig. 4. Spearman rank correlation analysis of the three vessels over five time points revealed a strong correlation (ρ = 0.94, p=0.018, N=5) between vessel hemoglobin saturation and maximum vessel velocity for VOI 2 (Fig. 4(b)), and no significant correlation for VOI 1 or VOI 3 (p>0.05, Fig. 4(a) and (c)). There was no correlation between vessel diameter and maximum velocity or between vessel diameter and hemoglobin saturation for any of the VOI (p>0.05). The flow rate (Q = π*(D/2)2*Vmax/2, [mm3/s]) was calculated from the vessel diameter (D) and maximum vessel velocity (Vmax). For all three VOI and five time points grouped together, there was a strong correlation between velocity and hemoglobin saturation (Fig. 4(d), ρ = 0.78, p= 0.0006, N = 15), and between flow rate and hemoglobin saturation (Fig. 4(e), ρ = 0.89, p = 9 × 10⁻⁶, N = 15), and a moderate correlation between shear rate on the vessel wall and hemoglobin saturation (Fig. 4(f), ρ = 0.56, p = 0.03, N=15). Shear rate values are in qualitative agreement with previous studies employing different techniques [5].
Figure 4.
Scatter plots of maximum velocity vs. hemoglobin saturation (○) and diameter vs. hemoglobin saturation (Δ) for VOI 1 (a), VOI 2 (b) and VOI 3 (c). There was a strong correlation (b) between the maximum velocity and hemoglobin saturation for VOI 2 (ρ = 0.94, p = 0.018, N = 5), and no correlation for any other VOI (p>0.05). However, when all VOI (○ VOI 1; Δ VOI 2; □ VOI 3) and time points were grouped together (d), there was a strong correlation between maximum velocity and hemoglobin saturation (ρ = 0.78, p= 0.0006, N = 15). There was also a strong correlation (e) between flow (vessel cross sectional area times ½ maximum velocity) and hemoglobin saturation (ρ = 0.89, p = 9 × 10⁻⁶, N = 15) and a moderate correlation (f) between shear rate on the vessel wall and hemoglobin saturation (ρ = 0.56, p = 0.03, N=15) when all VOI and time points were grouped together.
Previous studies [1, 4] indicate that vessel remodeling with tumor growth alters flow distributions, and the relationship between hemoglobin oxygen saturation and blood flow in tumors is heterogeneous. However, the techniques employed in previous studies have a significant effect on the results. The dual slit technique suffers from inaccurate estimations of the length traveled by red blood cells because the length of a three-dimensional vessel is projected onto a two-dimensional image, resulting in imprecise velocity values. Red blood cell flux measurements are limited to vessels smaller than ~30 μm in diameter because individual red blood cells are difficult to visualize in larger vessels. Also, previous studies measured intra- and extra- vascular pO2, rather than hemoglobin saturation. The techniques demonstrated in the current study are advantageous because flow velocity profiles can be accurately measured from a wide range of vessel diameters, and morphology, blood oxygen saturation and blood velocity can be accurately determined without the use of contrast agents.
We have combined hyperspectral microscopy with OCT to create a tool that can dynamically and non-invasively monitor vessel structure and function. These combined measurements will allow for unprecedented insight into the relationship between vessel structure, hemoglobin saturation, blood flow and hypoxic episodes in tumors. This research instrument could ultimately lead to a more detailed understanding the structural and functional properties of tumor vasculature, and potentially become a valuable tool for screening tumor therapies in animal models.
Acknowledgments
This research was supported by NIH/NCI CA40355, NIH R21 EB006338, and M.S. acknowledges fellowship support through the NIH/NCI (F32 CA130309).
Footnotes
OCIS codes: Optical coherence tomography (170.4500), Multispectral and hyperspectral imaging (110.4234), Functional monitoring and imaging (170.2655), Medical and biological imaging (170.3880)
References
- 1.Lanzen J, Braun RD, Klitzman B, Brizel D, Secomb TW, Dewhirst MW. Cancer Res. 2006;4:66. doi: 10.1158/0008-5472.CAN-03-2958. [DOI] [PubMed] [Google Scholar]
- 2.Mariampillai A, Standish BA, Moriyama EH, Khurana M, Munce NR, Leung MK, Jiang J, Cable A, Wilson BC, Vitkin IA, Yang VX. Opt Lett. 2008;13:33. doi: 10.1364/ol.33.001530. [DOI] [PubMed] [Google Scholar]
- 3.Braun RD, Lanzen JL, Dewhirst MW. Am J Physiol. 1999;2(Pt 2):277. doi: 10.1152/ajpheart.1999.277.2.H551. [DOI] [PubMed] [Google Scholar]
- 4.Helmlinger G, Yuan F, Dellian M, Jain RK. Nat Med. 1997;2:3. doi: 10.1038/nm0297-177. [DOI] [PubMed] [Google Scholar]
- 5.Tsuzuki Y, Fukumura D, Oosthuyse B, Koike C, Carmeliet P, Jain RK. Cancer Res. 2000;22:60. [PubMed] [Google Scholar]
- 6.Yang VX, Tang SJ, Gordon ML, Qi B, Gardiner G, Cirocco M, Kortan P, Haber GB, Kandel G, Vitkin IA, Wilson BC, Marcon NE. Gastrointest Endosc. 2005;7:61. doi: 10.1016/s0016-5107(05)00323-8. [DOI] [PubMed] [Google Scholar]
- 7.Sorg BS, Moeller BJ, Donovan O, Cao Y, Dewhirst MW. J Biomed Opt. 2005;4:10. doi: 10.1117/1.2003369. [DOI] [PubMed] [Google Scholar]
- 8.van Leeuwen TG, Kulkarni MD, Yazdanfar S, Rollins AM, Izatt JA. Opt Lett. 1999;22:24. doi: 10.1364/ol.24.001584. [DOI] [PubMed] [Google Scholar]
- 9.Dewhirst MW, Ong ET, Rosner GL, Rehmus SW, Shan S, Braun RD, Brizel DM, Secomb TW. Br J Cancer Suppl. 1996;27 [PMC free article] [PubMed] [Google Scholar]
- 10.Duling BR, Berne RM. Circ Res. 1970;5:27. doi: 10.1161/01.res.27.5.669. [DOI] [PubMed] [Google Scholar]
- 11.Dewhirst MW, Oliver R, Tso CY, Gustafson C, Secomb T, Gross JF. Int J Radiat Oncol Biol Phys. 1990;3:18. doi: 10.1016/0360-3016(90)90061-n. [DOI] [PubMed] [Google Scholar]
- 12.Dewhirst MW, Kimura H, Rehmus SW, Braun RD, Papahadjopoulos D, Hong K, Secomb TW. Br J Cancer Suppl. 1996;27 [PMC free article] [PubMed] [Google Scholar]


