

Abstract
Objective:
To assess the correlations of both MRI and CSF biomarkers with clinical diagnosis and with cognitive performance in cognitively normal (CN) subjects and patients with amnestic mild cognitive impairment (aMCI) and Alzheimer disease (AD).
Methods:
This is a cross-sectional study with data from the Alzheimer's Disease Neuroimaging Initiative, which consists of CN subjects, subjects with aMCI, and subjects with AD with both CSF and MRI. Baseline CSF (t-tau, Aβ1-42, and p-tau181P) and MRI scans were obtained in 399 subjects (109 CN, 192 aMCI, 98 AD). Structural Abnormality Index (STAND) scores, which reflect the degree of AD-like anatomic features on MRI, were computed for each subject.
Results:
We found no significant correlation between CSF biomarkers and cognitive scores in any of the 3 clinical groups individually. Conversely, STAND scores correlated with both Clinical Dementia Rating–sum of boxes and Mini-Mental State Examination in aMCI and AD (p ≤ 0.01). While STAND and all CSF biomarkers were predictors of clinical group membership (CN, aMCI, or AD) univariately (p < 0.001), STAND was more predictive than CSF both univariately and in combined models.
Conclusions:
CSF and MRI biomarkers independently contribute to intergroup diagnostic discrimination and the combination of CSF and MRI provides better prediction than either source of data alone. However, MRI provides greater power to effect cross-sectional groupwise discrimination and better correlation with general cognition and functional status cross-sectionally. We therefore conclude that although MRI and CSF provide complementary information, MRI reflects clinically defined disease stage better than the CSF biomarkers tested.
GLOSSARY
- AD
= Alzheimer disease;
- ADNI
= Alzheimer's Disease Neuroimaging Initiative;
- aMCI
= amnestic mild cognitive impairment;
- AUROC
= area under the receiver operating characteristic curve;
- CDR-SB
= Clinical Dementia Rating–sum of boxes score;
- CI
= confidence interval;
- CN
= cognitively normal;
- EBM
= evidence-based medicine;
- EC
= entorhinal cortex;
- MMSE
= Mini-Mental State Examination;
- NFT
= neurofibrillary tangle;
- POLR
= proportional odds logistic regression;
- STAND
= Structural Abnormality Index.
Biomarker and imaging indicators of disease that closely reflect the underlying pathology provide an independent measure of pathology based only on biology, in contrast to clinical diagnosis done on the basis of clinical examination and neuropsychological tests. Two highly promising CSF biomarkers for Alzheimer disease (AD) are total tau (t-tau) and Aβ1-42.1 We have also included phospho-tau181P (p-tau181P) since it reflects phosphorylated tau and has been postulated to more closely mirror neurofibrillary tangle (NFT) formation.2 Structural MRI captures disease-related structural changes in the brain by measuring loss of brain volume.3 A technique developed in our laboratory condenses the degree and location of AD-related atrophy on the 3-dimensional MRI scan into a single number which is called Structural Abnormality Index (STAND) score4 and antemortem MRI scan–based STAND scores correlate well with postmortem NFT pathologic Braak stage.5 In the present article, we use STAND scores as an indicator of severity of AD-like pattern of volume loss on structural MRI.
Both CSF and MRI have been shown independently to be useful for intergroup discrimination of AD. To date, there have been relatively few studies that have compared the performance of both MRI and CSF biomarkers together for diagnosis of AD.6–14 The aims of our article are twofold in the context of evaluating both the biomarkers cross-sectionally: 1) to evaluate individual and combined utility of MRI (STAND score) and CSF (t-tau and Aβ1-42) biomarkers to effect diagnostic intergroup discrimination; and 2) to assess correlation between MRI and CSF biomarkers and clinical measures of severity, using Clinical Dementia Rating–sum of boxes score (CDR-SB) and Mini-Mental State Examination (MMSE).
METHODS
The data used in this study are from the Alzheimer's Disease Neuroimaging Initiative (ADNI), which is a longitudinal multisite observational study of elderly individuals with normal cognition (CN), amnestic mild cognitive impairment (aMCI), and AD collected from 56 participating institutes.15 Written informed consent was obtained for participation in these studies, as approved by the Institutional Review Board at each of the participating centers. The details of ADNI can be found at http://www.ADNI-info.org. Baseline MRI and clinical/psychometric assessments are acquired on all subjects. CSF was obtained in approximately 55% of the cohort. In this study, all subjects with CSF data at baseline and usable MRI were considered. Our sample consists of 399 subjects (109 CN, 192 aMCI, 98 AD). Two of the 98 subjects with AD subsequently reclassified as non-AD dementias (frontotemporal dementia and dementia with Lewy bodies) are considered as AD for this analysis. We used MMSE16 and the CDR-SB17 as overall indices of general cognitive performance and global functional status, respectively, which were collected on all subjects at the screening visit.
CSF methods and processing.
Lumbar puncture for the collection of CSF occurred a median of 1 day after the baseline clinical visit (range: −20 to 163 days, 11 missing dates). CSF was collected at each site, transferred into polypropylene transfer tubes followed by freezing on dry ice within 1 hour after collection, and shipped overnight to the ADNI Biomarker Core laboratory at the University of Pennsylvania Medical Center on dry ice. When samples are received in the laboratory, they are thawed and aliquots are stored in barcoded polypropylene vials at −80°C. The complete details can be found at http://www.adni-info.org/index.php. A standardized protocol was implemented to quantify biomarker concentrations in each of the CSF ADNI baseline aliquots using a multiplex xMAP Luminex platform (Luminex Corp, Austin, TX) with Innogenetics (INNO-BIA AlzBio3, Ghent, Belgium; for research use only reagents) immunoassay kit–based reagents, which was validated in previous reports.18,19
MRI methods and preprocessing.
ADNI collects 1.5-T MRI scans in all subjects and 3-T scans in approximately 25% of the sample; only the 1.5-T MRI scans were used for this study. The MRI scan was a median of 18 days before baseline clinical examination (range: −12 days to 190 days). The images were acquired on commercial 1.5-T scanners. The nominal parameters of the morphometric T1-weighted MPRAGE can be found in reference 15. These images are additionally corrected for gradient nonlinearity, intensity inhomogeneity, and scaled geometrically using the phantom scan acquired with each subject examination15 using a centralized MRI processing pipeline at Mayo Clinic, Rochester, MN. STAND scores were estimated on these preprocessed images.
STAND scores reflect atrophy in regions associated with AD, primarily the medial temporal limbic areas and inferior and lateral temporal neocortex. To estimate STAND scores, the algorithm must be trained to optimally identify anatomic MRI features that differentiate AD from CN subjects using a training dataset. An important design feature of our study was that the STAND algorithm was trained in a separate group of ADNI AD and CN subjects not described in detail here (i.e., 90 AD and 90 CN ADNI subjects who did not undergo lumbar puncture). The algorithm was trained and then applied in independent subject groups (those with both CSF as well as MRI), thus avoiding circularity. Regions detected as important for differentiating AD from CN using the training dataset are shown in appendix e-1 on the Neurology® Web site at www.neurology.org and subsequently these regions are used to assign STAND scores to new incoming scans (in our case the test cases). Note that the algorithm searches a much broader anatomic area including the hippocampus. Computation details for STAND scores are reported in appendix e-1.
Statistical analysis.
Pairwise differences in MRI and CSF biomarker measures by diagnosis were tested with a two-sided Wilcoxon rank sum test. The relationship between CDR-SB and MMSE and biomarker data were expressed as Spearman partial rank-order correlations adjusted for age among all subjects and within diagnosis groups. Among all subjects, the Choi test20 was used to determine if the strength of the correlations between MRI and cognitive scores was different from the strength of the correlations between CSF data and cognitive scores.
To assess the relationship between biomarkers and all 3 clinical diagnoses (CN, aMCI, and AD), we fit proportional odds logistic regression (POLR) models.21 POLR is a generalization of binary logistic regression that is useful when the outcome of interest has more than 2 groups that have a natural ordering. For our models, we assume clinical group is ordered from better to worse as CN, aMCI, AD. Models were fit separately for each biomarker measurement with age included as an adjustment covariate. Two multivariables were also fit: the first includes age, STAND, Aβ1-42, and log(t-tau), and the second includes age, STAND, and log(t-tau/Aβ1-42) as the CSF ratio is more widely used clinically. We used the natural logarithm transform to correct for skewness. We report the area under the receiver operating characteristic curve (AUROC) for each model. This has the interpretation of the proportion of times the model will correctly order the clinical diagnosis of 2 subjects given only the values of the model predictors. Additionally, we report likelihood ratio χ2 statistics and p values for the biomarker predictors.
For simplicity of interpretation, we also computed the diagnostic accuracy of all biomarkers for AD vs CN classification based on a cutoff value chosen such that overall accuracy of each independent biomarker is maximized. AUROC, sensitivity (proportion of positives identified that are true positives), specificity (proportion of negatives identified that are true negatives), test accuracy (proportion of positives and negatives correctly identified), positive predictive value (number of true positives/[number of true positives + number of false positives]), and negative predictive value (number of true negatives/[number of true negatives + number of false negatives]) were computed. Evidence-based medicine (EBM) likelihood ratios (sensitivity/[1 − specificity]) were also computed to determine the likelihood that a biomarker value greater than or equal to the determined threshold would be expected to be AD compared to the likelihood that the same value would be expected given CN.
All data manipulation and analysis was performed using SAS version 9.1.3 and R version 2.7.1.
RESULTS
Patient characteristics.
The demographics and clinical summary of all subjects with MRI and CSF biomarker data are presented in the patient characteristics section of table 1. MRI and CSF biomarker summary statistics are presented in the measurement section of table 1. Differences between CN and AD, CN and aMCI, as well as aMCI and AD were significant for MRI and CSF biomarkers. All biomarkers scale appropriately with groupwise level of cognitive and functional impairment with CN (least abnormal) and AD (most abnormal) at 2 extremes and MCI in the middle of the spectrum. Box plots of these distributions by group are shown in the top row of the figure. In the bottom row of the figure, we show 3 within-group plots of STAND plotted against log(t-tau/Aβ1-42). The clusters of scores move diagonally from low STAND–low log(t-tau/Aβ1-42) in CN to high STAND–high log(t-tau/Aβ1-42) in AD.
Table 1 Patient characteristics at the time of the MRI scan by diagnosis
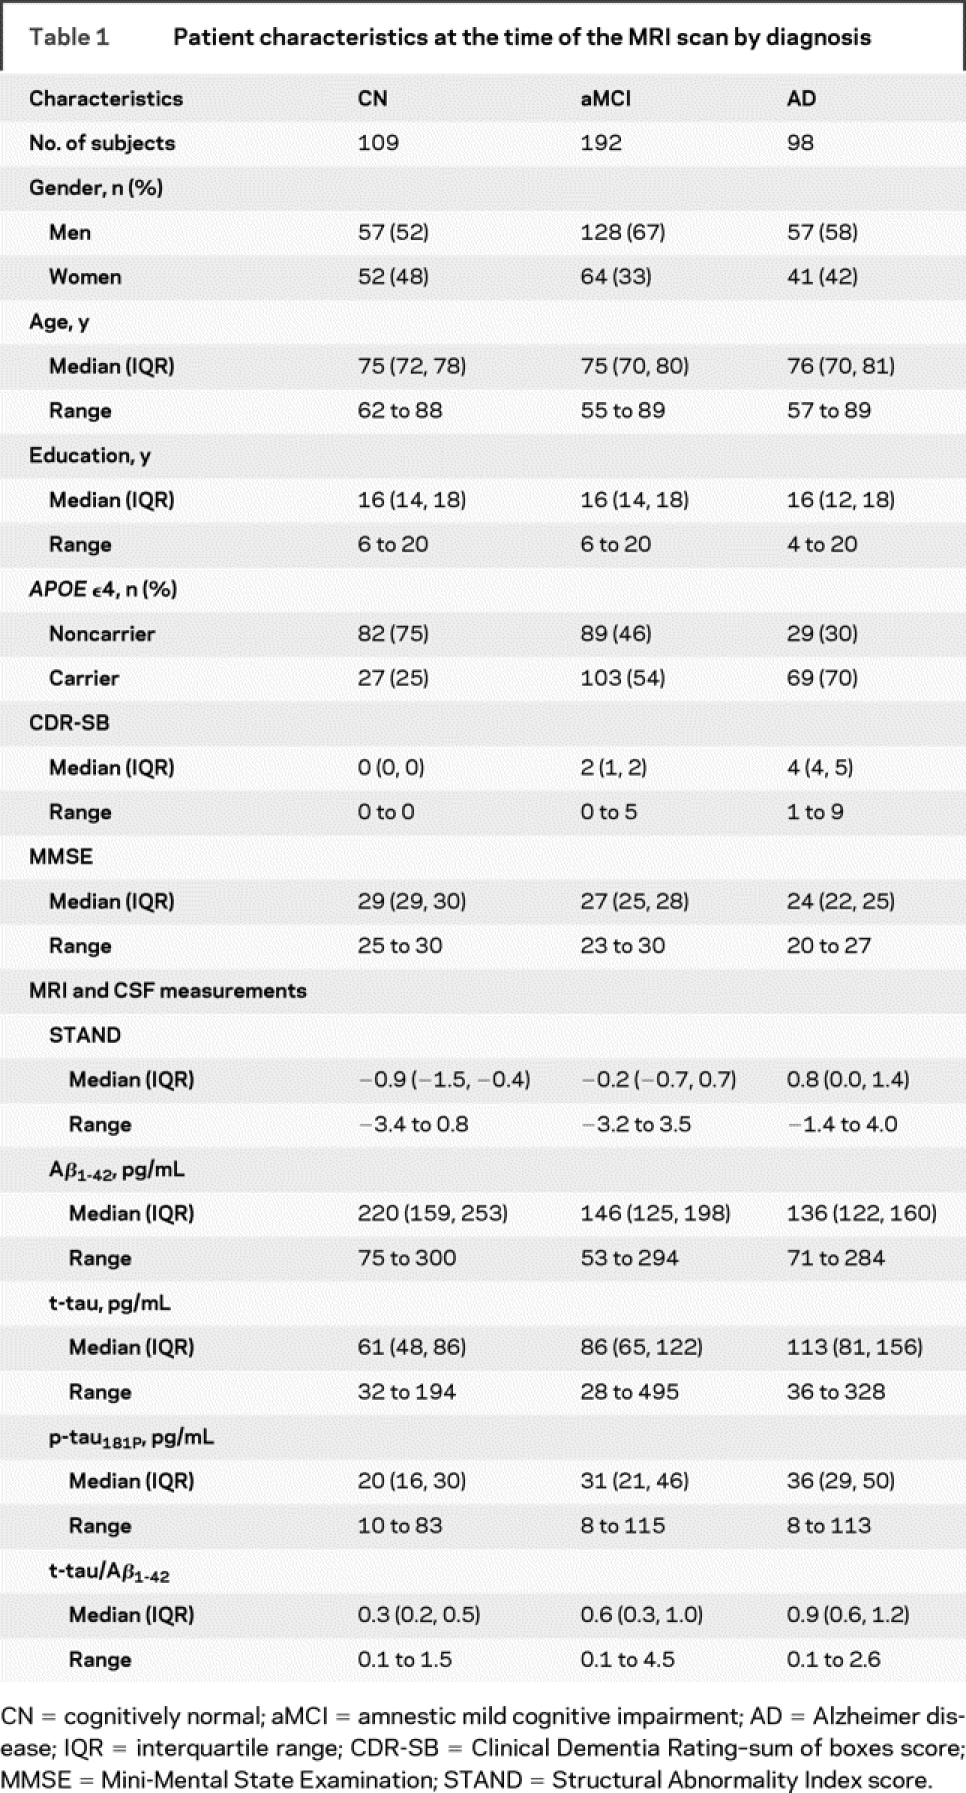

Figure Box plots of MRI and CSF biomarker distributions by group (top row) and relationship between Structural Abnormality Index (STAND) scores and log(t-tau/Aβ1-42) by group (bottom row)
AD = Alzheimer disease; aMCI = amnestic mild cognitive impairment; CN = cognitively normal.
Correlation between cognitive/functional performance and MRI and CSF biomarkers.
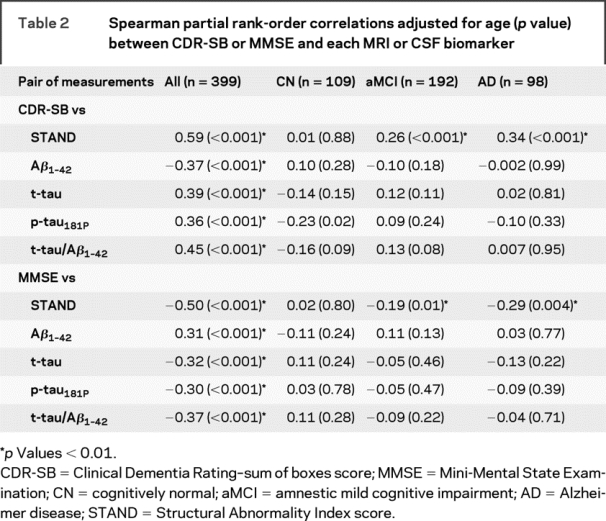
Spearman partial rank-order correlations adjusted for age (p value) between cognitive/functional measures and each MRI/CSF biomarker are shown in table 2. When subjects from all 3 clinical groups are combined, MRI and every CSF biomarker was correlated with both CDR-SB and MMSE in the expected direction (p < 0.001). Among all subjects, the correlation between STAND and cognitive scores was stronger than between CSF biomarkers and cognitive/functional performance scores (p < 0.01, Choi test), suggesting STAND is more closely related to cognitive and functional performance than CSF biomarkers. When the subjects were split into 3 individual clinical diagnostic groups, there was no significant correlation between the CSF biomarkers and cognitive scores in any of the groups. However, STAND score correlated significantly with both CDR-SB and MMSE in aMCI and AD groups, suggesting that structural MRI is related to within-group variation in cognitive status in aMCI and AD.
Table 2 Spearman partial rank-order correlations adjusted for age (p value) between CDR-SB or MMSE and each MRI or CSF biomarker
MRI and CSF biomarker prediction of clinical group membership.
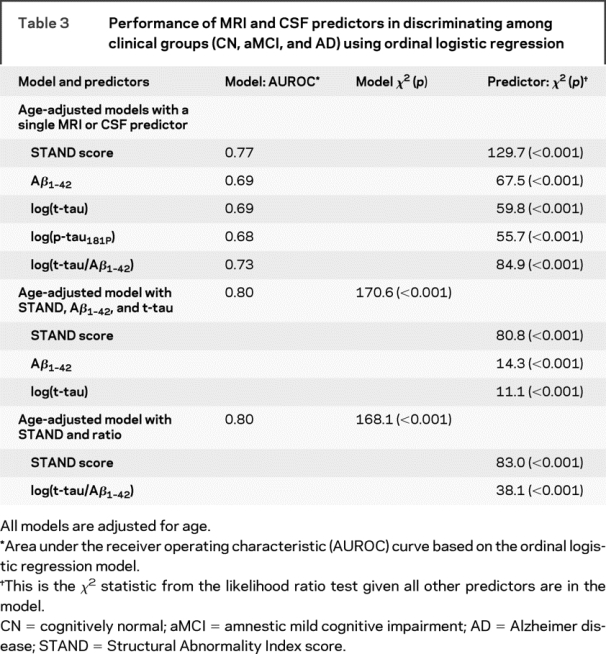
Using ordinal regression models, we assessed the ability of STAND and CSF biomarkers alone and then in combined models to diagnostically separate CN, aMCI, and AD (table 3). These models are adjusted for the linear effect of age. Each of the MRI/CSF biomarkers independently contributed (p < 0.001) to the prediction of clinical group membership (in univariate models). Due to a high correlation between p-tau181P and t-tau, we did not consider p-tau181P in the combined model. The model that combined STAND, t-tau, and Aβ1-42 had better performance that any one disease indicator alone, the contribution of each disease indicator remained significant. Predictor χ2 indicates contribution of one disease indicator conditioned on the rest of the indicators. The higher χ2 values of STAND when conditioned on t-tau and Aβ1-42 indicates that STAND provides more information concerning cross-sectional intergroup discrimination than CSF markers. We used bootstrap resampling to estimate the difference in univariate model AUROCs for the various predictors. Based on 95% confidence intervals (CIs) for the difference in AUROCs, STAND score was a better predictor than Aβ1-42 (95% CI = 0.03 to 0.13), log(t-tau) (95% CI = 0.03 to 0.13), and log(p-tau) (95% CI = 0.04 to 0.14). STAND score appeared to be a better predictor than t-tau/Aβ1-42 at p = 0.10 level (90% CI = 0.004 to 0.09) but not at p = 0.05 level (95% CI = −0.003 to 0.09).
Table 3 Performance of MRI and CSF predictors in discriminating among clinical groups (CN, aMCI, and AD) using ordinal logistic regression
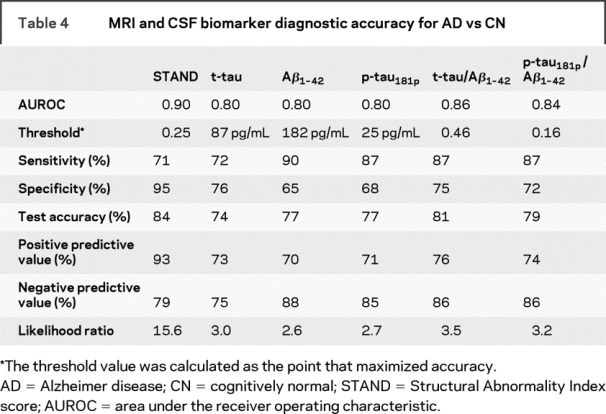
In table 4, the AUROC, diagnostic accuracy of the biomarkers for AD vs CN classification, are presented alongside the computed cutoff values. Similar to the results in the 3 group models (table 3), we found that STAND scores had a higher test accuracy of 84% (AUROC 0.9) compared to individual CSF biomarkers test accuracy of 74%–77% (AUROC 0.8) in separating AD vs CN. STAND AUROC was higher than t-tau (p = 0.002), Aβ1-42 (p = 0.01), and p-tau181P (p = 0.004) but not different from t-tau/Aβ1-42 (p = 0.17) or p-tau181P/Aβ1-42 (p = 0.07). STAND score had the highest EBM likelihood ratio of 15.6, indicating that if a subject had STAND score ≥0.25 then the subject is 15.6 times more likely to have AD compared to the likelihood of being CN.
Table 4 MRI and CSF biomarker diagnostic accuracy for AD vs CN
DISCUSSION
This study presents an analysis of cross-sectional clinical correlations of 2 core disease indicators in AD: MRI and CSF biomarkers. Our results suggest that of the 2 classes of disease indicators, structural MRI changes were more closely related to general cognitive and functional indices of disease stage in impaired subjects. These results are concordant with some CSF and MRI studies that have shown that CSF biomarkers do not correlate with cognitive measures cross-sectionally among patients with AD22 nor with plaque and tangle burden,23 whereas MRI biomarkers (such as hippocampal volume, STAND score) correlate with both degree of cognitive impairment as well as Braak NFT staging.24,25
All MRI/CSF biomarkers were found to be significant for intergroup discrimination of CN, aMCI, and AD. The combined predictor model with both MRI and t-tau/Aβ1-42 ratio performed better than any one biomarker alone and the contribution of both CSF and MRI was found to be significant. p-tau Epitopes are believed to be most useful for differentiating AD and non-AD dementias,26 which may explain why p-tau181 was not more sensitive than t-tau measurements in intergroup discrimination in subjects who lay along the normal to AD continuum.
The 3 disease markers examined in this article (MRI, CSF Aβ1-42, and CSF t-tau) reflect different aspects of AD pathology. Low CSF Aβ1-42 is a marker of fibrillary amyloid deposition in plaques. Nearly complete concordance is present between individuals with positive Pittsburgh Compound B (PIB)–PET scans and those with low CSF Aβ1-42.27 Although correlations with Aβ1-42 were present in our study, well accepted reasons exist to explain why Aβ1-42 might not correlate highly with clinical indices of disease stage. Amyloid deposition is regarded to be an early event that occurs prior to clinical symptoms. In one proposed model of AD, a full complement of amyloid is deposited and then plateaus with little further deposition.28 Cognitive decline, as well as NFTs and synaptic loss, progressively worsen in the presence of a relatively static total load of amyloid.28 Animal data also indicate that amyloid plaque deposition precedes NFT.29 An additional possible explanation for our findings is that measurement of CSF Aβ1-42 appears to be inherently more variable than MRI (figure).
Increased CSF t-tau is a marker of neuronal injury which correlates well with NFT stage and NFT load.30,31 Atrophy on structural MRI also correlates with Braak NFT stage and NFT load24,25 but the most proximate histologic correlate of MRI volume loss is loss of neurons and synapses.3,32 It may at first be surprising to find that correlations with clinical disease stage are slightly stronger for MRI vs t-tau given that CSF t-tau is usually regarded as direct marker of neuronal injury. However, autopsy studies have shown that the appearance of NFT pathology in entorhinal cortex (EC) precedes the appearance of EC neuronal loss.33 Therefore, assuming CSF t-tau is a direct reflection of NFT pathology and atrophy on MRI is a direct result of neuron and synapse loss, one might expect slightly better correlation between clinical indices of disease stage (which themselves reflect neuron and synapse loss) and MRI than with CSF t-tau. The fact that the literature to date on CSF–clinical correlations contains some seemingly contradictory results in late onset AD (which is what our subject population represents) supports this notion. For example, one study reported no change in CSF t-tau levels over time in patients with AD and concluded that CSF t-tau does not predict either severity or rate of clinical decline in AD.34 Rates of change on MRI did correlate with change on MMSE scores, but change in CSF t-tau did not.35 Conversely, another study36 found that baseline CSF t-tau (and Aβ1-42) predicted conversion to dementia and another22 found a direct correlation between increasing levels of CSF t-tau and severity of impairment in AD. The relationship between CSF t-tau and disease stage may therefore be complex. In contrast, the relationship between clinical disease stage and MRI seems to be a fairly straightforward direct correlation since MRI measures atrophy, which reflects cumulative damage. The literature on MRI is nearly unanimous in indicating close correlation between loss of cognitive function and loss of volume on MRI over time.37,38 A final possible explanation for our finding of better correlation between MRI and cognition than between CSF t-tau and cognition is that MRI may be a more stable indicator of neuronal injury. Brain volume quantification with MRI has nothing analogous to daily turnover of a soluble protein. Minimal physiologic variation in brain volume may translate into stronger correlations with cognition over many subjects.
Typically MRI and CSF biomarkers have been shown to have an accuracy of 80%–90% in discriminating AD and CN. In this study, we found the performance of MRI and CSF was slightly lower than the numbers seen in the literature. Despite rigorous standardization of procedures and processing, this could be attributed to the fact that ADNI is a multisite study with known site-to-site variation in methods of subject recruitment. We explored whether there was any evidence of site-specific differences that may require adjusting biomarker values and found that subject-to-subject variability was much greater than site-to-site variability for all biomarkers with intraclass correlations below 0.02 across all biomarkers. This suggests that less than 2% of the variability in biomarker values is due to site differences. In light of these findings, and because of the large number of sites and relatively few subjects per site, incorporation of site into our analyses was not required.
Advances in computational power and MRI technology in the last decade have enabled us to obtain automated MRI biomarkers such as STAND scores for assessing the disease state. Advantages of using MRI biomarkers are the noninvasive nature of the imaging modality, low processing time, and automation of biomarker estimation. This study also validates that MRI scans from different centers can be combined and STAND scores perform reasonably well for diagnostic purposes. There are two limitations of this study: 1) ADNI population is not generalizable to the general population. The recruitment mechanisms were those used for clinical trials in AD and included memory clinics, patient registries, public media campaigns, and other forms of public advertisements. 2) Since the gold standard is clinical diagnosis, which is based on the screening tests, we cannot directly evaluate the additive value of the biomarkers to clinical methods. This will require a different study design.
AUTHOR CONTRIBUTIONS
Statistical analysis was conducted by Heather J. Wiste, BA, and Stephen D. Weigand, MS.
ACKNOWLEDGMENT
Data used in the preparation of this article were obtained from the Alzheimer's Disease Neuroimaging Initiative (ADNI) database (www.loni.ucla.edu\ADNI). As such, the investigators within the ADNI contributed to the design and implementation of ADNI and/or provided data but did not participate in analysis or writing of this report.
DISCLOSURE
Dr. Vemuri receives support from the Robert H. Smith Family Foundation Research Fellowship and NIH [R01-AG11378]. Heather Wiste reports no disclosures. Stephen Weigand reports no disclosures. Dr. Shaw receives support from the NIH [U01-AG024904]. Dr. Trojanowski receives support from the NIH [U01-AG024904]. Dr. Weiner receives support from the NIH [U01-AG024904, P01-AG19724, R01 AG10897, and P41 RR023953]. Dr. Knopman serves as an Associate Editor of Neurology®; served on a data safety monitoring board for Sanofi Aventis; and is an investigator in a clinical trial sponsored by Elan Pharmaceuticals and by Forest Laboratories. Dr. Petersen has served as a consultant to GE Healthcare; has served on a data safety monitoring board for Elan and Wyeth Pharmaceuticals; and receives research support from the NIH [P50-AG16574 and U01-AG06786]. Dr. Jack is an investigator in clinical trials sponsored by Pfizer; serves as a consultant for Elan Pharmaceuticals; and receives research support from the NIH [R01-AG11378] and the Alexander Family Alzheimer's Disease Research Professorship of the Mayo Foundation.
Supplementary Material
Received December 5, 2008. Accepted in final form April 20, 2009.
Address correspondence and reprint requests to Dr. Clifford R. Jack, Jr., Mayo Clinic and Foundation, 200 First Street SW, Rochester, MN 55905 jack.clifford@mayo.edu
Supplemental data at www.neurology.org
See page 294
*Investigators of The Alzheimer's Disease Neuroimaging Initiative are listed at www.loni.ucla.edu\ADNI\Collaboration\ADNI_Manuscript_Citations.pdf.
Disclosure: Author disclosures are provided at the end of the article.
REFERENCES
- 1.Andreasen N, Gottfries J, Vanmechelen E, et al. Evaluation of CSF biomarkers for axonal and neuronal degeneration, gliosis, and beta-amyloid metabolism in Alzheimer's disease. J Neurol Neurosurg Psychiatry 2001;71:557–558. [DOI] [PMC free article] [PubMed] [Google Scholar]
- 2.Blennow K, Hampel H. CSF markers for incipient Alzheimer's disease. Lancet Neurol 2003;2:605–613. [DOI] [PubMed] [Google Scholar]
- 3.Bobinski M, de Leon MJ, Wegiel J, et al. The histological validation of post mortem magnetic resonance imaging-determined hippocampal volume in Alzheimer's disease. Neuroscience 2000;95:721–725. [DOI] [PubMed] [Google Scholar]
- 4.Vemuri P, Gunter JL, Senjem ML, et al. Alzheimer's disease diagnosis in individual subjects using structural MR images: Validation studies. Neuroimage 2008;39:1186–1197. [DOI] [PMC free article] [PubMed] [Google Scholar]
- 5.Vemuri P, Whitwell JL, Kantarci K, et al. Antemortem MRI based STructural Abnormality iNDex (STAND)-scores correlate with postmortem Braak neurofibrillary tangle stage. Neuroimage 2008;42:559–567. [DOI] [PMC free article] [PubMed] [Google Scholar]
- 6.de Leon MJ, DeSanti S, Zinkowski R, et al. MRI and CSF studies in the early diagnosis of Alzheimer's disease. J Intern Med 2004;256:205–223. [DOI] [PubMed] [Google Scholar]
- 7.Schoonenboom NS, van der Flier WM, Blankenstein MA, et al. CSF and MRI markers independently contribute to the diagnosis of Alzheimer's disease. Neurobiol Aging 2008;29:669–675. [DOI] [PubMed] [Google Scholar]
- 8.Bouwman FH, Schoonenboom SN, van der Flier WM, et al. CSF biomarkers and medial temporal lobe atrophy predict dementia in mild cognitive impairment. Neurobiol Aging 2007;28:1070–1074. [DOI] [PubMed] [Google Scholar]
- 9.Herukka SK, Pennanen C, Soininen H, Pirttila T. CSF Abeta42, tau and phosphorylated tau correlate with medial temporal lobe atrophy. J Alzheimer Dis 2008;14:51–57. [DOI] [PubMed] [Google Scholar]
- 10.Hampel H, Burger K, Pruessner JC, et al. Correlation of cerebrospinal fluid levels of tau protein phosphorylated at threonine 231 with rates of hippocampal atrophy in Alzheimer disease. Arch Neurol 2005;62:770–773. [DOI] [PubMed] [Google Scholar]
- 11.de Leon MJ, DeSanti S, Zinkowski R, et al. Longitudinal CSF and MRI biomarkers improve the diagnosis of mild cognitive impairment. Neurobiol Aging 2006;27:394–401. [DOI] [PubMed] [Google Scholar]
- 12.Schonknecht P, Pantel J, Hartmann T, et al. Cerebrospinal fluid tau levels in Alzheimer's disease are elevated when compared with vascular dementia but do not correlate with measures of cerebral atrophy. Psychiatry Res 2003;120:231–238. [DOI] [PubMed] [Google Scholar]
- 13.Schroder J, Pantel J, Ida N, et al. Cerebral changes and cerebrospinal fluid beta-amyloid in Alzheimer's disease: a study with quantitative magnetic resonance imaging. Mol Psychiatry 1997;2:505–507. [DOI] [PubMed] [Google Scholar]
- 14.Wahlund LO, Blennow K. Cerebrospinal fluid biomarkers for disease stage and intensity in cognitively impaired patients. Neurosci Lett 2003;339:99–102. [DOI] [PubMed] [Google Scholar]
- 15.Jack CR Jr, Bernstein MA, Fox NC, et al. The Alzheimer's Disease Neuroimaging Initiative (ADNI): MRI methods. J Magn Reson Imaging 2008;27:685–691. [DOI] [PMC free article] [PubMed] [Google Scholar]
- 16.Folstein MF, Folstein SE, McHugh PR. “Mini-mental state”: a practical method for grading the cognitive state of patients for the clinician. J Psychiatr Res 1975;12:189–198. [DOI] [PubMed] [Google Scholar]
- 17.Hughes CP, Berg L, Danziger WL, Coben LA, Martin RL. A new clinical scale for the staging of dementia. Br J Psychiatry 1982;140:566–572. [DOI] [PubMed] [Google Scholar]
- 18.Shaw LM, Vanderstichele H, Knapik-Czajka M, et al. Characterization of CSF Aβ1-42, tau and p-tau 181P concentrations at baseline in Alzheimer's Disease Neuroimaging Initiative (ADNI) study cohorts. Alzheimer Dementia 2008;4(suppl 4):545–546. [Google Scholar]
- 19.Shaw LM, Vanderstichele H, Knapik-Czajka M, et al. Cerebrospinal fluid biomarker signature in Alzheimer's disease neuroimaging initiative subjects. Ann Neurol 2009 (in press). [DOI] [PMC free article] [PubMed]
- 20.Choi SC. Tests of equality of dependent correlation coefficients. Biometrics 1977;64:645–647. [Google Scholar]
- 21.Harrell FE Jr. Regression Modeling Strategies. New York: Springer; 2001. [Google Scholar]
- 22.Stefani A, Martorana A, Bernardini S, et al. CSF markers in Alzheimer disease patients are not related to the different degree of cognitive impairment. J Neurol Sci 2006;251:124–128. [DOI] [PubMed] [Google Scholar]
- 23.Engelborghs S, Sleegers K, Cras P, et al. No association of CSF biomarkers with APOEepsilon4, plaque and tangle burden in definite Alzheimer's disease. Brain 2007;130:2320–2326. [DOI] [PubMed] [Google Scholar]
- 24.Gosche KM, Mortimer JA, Smith CD, Markesbery WR, Snowdon DA. Hippocampal volume as an index of Alzheimer neuropathology: findings from the Nun Study. Neurology 2002;58:1476–1482. [DOI] [PubMed] [Google Scholar]
- 25.Jack CR Jr, Dickson DW, Parisi JE, et al. Antemortem MRI findings correlate with hippocampal neuropathology in typical aging and dementia. Neurology 2002;58:750–757. [DOI] [PMC free article] [PubMed] [Google Scholar]
- 26.Hampel H, Buerger K, Zinkowski R, et al. Measurement of phosphorylated tau epitopes in the differential diagnosis of Alzheimer disease: a comparative cerebrospinal fluid study. Arch Gen Psychiatry 2004;61:95–102. [DOI] [PubMed] [Google Scholar]
- 27.Fagan AM, Mintun MA, Mach RH, et al. Inverse relation between in vivo amyloid imaging load and cerebrospinal fluid Abeta42 in humans. Ann Neurol 2006;59:512–519. [DOI] [PubMed] [Google Scholar]
- 28.Ingelsson M, Fukumoto H, Newell KL, et al. Early Abeta accumulation and progressive synaptic loss, gliosis, and tangle formation in AD brain. Neurology 2004;62:925–931. [DOI] [PubMed] [Google Scholar]
- 29.Billings LM, Oddo S, Green KN, McGaugh JL, LaFerla FM. Intraneuronal Abeta causes the onset of early Alzheimer's disease-related cognitive deficits in transgenic mice. Neuron 2005;45:675–688. [DOI] [PubMed] [Google Scholar]
- 30.Buerger K, Ewers M, Pirttila T, et al. CSF phosphorylated tau protein correlates with neocortical neurofibrillary pathology in Alzheimer's disease. Brain 2006;129:3035–3041. [DOI] [PubMed] [Google Scholar]
- 31.Clark CM, Xie S, Chittams J, et al. Cerebrospinal fluid tau and beta-amyloid: how well do these biomarkers reflect autopsy-confirmed dementia diagnoses? Arch Neurol 2003;60:1696–1702. [DOI] [PubMed] [Google Scholar]
- 32.Zarow C, Vinters HV, Ellis WG, et al. Correlates of hippocampal neuron number in Alzheimer's disease and ischemic vascular dementia. Ann Neurol 2005;57:896–903. [DOI] [PMC free article] [PubMed] [Google Scholar]
- 33.Price JL, Ko AI, Wade MJ, Tsou SK, McKeel DW, Morris JC. Neuron number in the entorhinal cortex and CA1 in preclinical Alzheimer disease. Arch Neurol 2001;58:1395–1402. [DOI] [PubMed] [Google Scholar]
- 34.Sunderland T, Wolozin B, Galasko D, et al. Longitudinal stability of CSF tau levels in Alzheimer patients. Biol Psychiatry 1999;46:750–755. [DOI] [PubMed] [Google Scholar]
- 35.Sluimer JD, Bouwman FH, Vrenken H, et al. Whole-brain atrophy rate and CSF biomarker levels in MCI and AD: A longitudinal study. Neurobiol Aging Epub 2008 Aug 7. [DOI] [PubMed]
- 36.Hansson O, Zetterberg H, Buchhave P, Londos E, Blennow K, Minthon L. Association between CSF biomarkers and incipient Alzheimer's disease in patients with mild cognitive impairment: a follow-up study. Lancet Neurol 2006;5:228–234. [DOI] [PubMed] [Google Scholar]
- 37.Stoub TR, Bulgakova M, Leurgans S, et al. MRI predictors of risk of incident Alzheimer disease: a longitudinal study. Neurology 2005;64:1520–1524. [DOI] [PubMed] [Google Scholar]
- 38.Jack CR Jr, Shiung MM, Weigand SD, et al. Brain atrophy rates predict subsequent clinical conversion in normal elderly and amnestic MCI. Neurology 2005;65:1227–1231. [DOI] [PMC free article] [PubMed] [Google Scholar]
Associated Data
This section collects any data citations, data availability statements, or supplementary materials included in this article.