Abstract
How evergreen species store and protect chlorophyll during exposure to high light in winter remains unexplained. This study reveals that the evergreen snow gum (Eucalyptus pauciflora Sieb. ex Spreng.) stores and protects its chlorophylls by forming special complexes that are unique to the winter-acclimated state. Our in vivo spectral and kinetic characterizations reveal a prominent component of the chlorophyll fluorescence spectrum around 715 nm at 77 K. This band coincides structurally with a loss of chlorophyll and an increase in energy-dissipating carotenoids. Functionally, the band coincides with an increased capacity to dissipate excess light energy, absorbed by the chlorophylls, as heat without intrathylakoid acidification. The increased heat dissipation helps protect the chlorophylls from photo-oxidative bleaching and thereby facilitates rapid recovery of photosynthesis in spring.
Under favorable light and temperatures, most plants operate with a high quantum efficiency (better than 80%) to use absorbed photons to catalyze photosynthetic electron transport, ATP synthesis, and carbon fixation. However, photosynthetic efficiency in leaves of evergreens such as holly (1), pines (2, 3), and snow gum (4, 5), naturally declines to very low levels during winter and remains inhibited until conditions become favorable for growth in spring. These evergreen species maintain significant levels of chlorophyll (Chl), which exists in a state that has not been characterized previously with respect to the Chl electronic-excited state or fluorescence lifetimes, or the Chl excitation vs. emission spectra of photosystems I and II (PSI and PSII). This characterization is essential for understanding mechanisms of Chl protection and storage in overwintering evergreens.
We report that winter acclimation of the photosynthetic apparatus in the snow gum Eucalyptus pauciflora Sieb. ex Spreng results in a large loss of Chl in the leaf and profound changes in the Chl a fluorescence emission spectrum at 77 K in the form of a broad emission maximum featured in the 715-nm region. Concomitantly there is a significant increase in the amplitudes of room temperature PSII Chl a fluorescence emission components with subnanosecond fluorescence lifetimes. The subnanosecond lifetime components indicate a more rapid rate of thermal excitation dissipation compared to the main 2.5-ns components (6) that typify the deacclimated state. Although the spectral and kinetic changes during winter acclimation are induced by excess light and chloroplast intrathylakoid acidification (6, 7), the slowly reversing changes during deacclimation are sustained largely independently of intrathylakoid acidification. The enhanced thermal dissipation during winter acclimation correlates with a massive build-up of the same xanthophyll cycle pigments (8) that are most widely known to correlate with PSII thermal dissipation when there is intrathylakoid acidification (6, 7, 9–12). The primary steps of winter deacclimation correlate with a slow, stoichiometric conversion of epoxide-free xanthophyll cycle pigments to epoxide-containing forms without a change in the total leaf xanthophyll cycle or Chl pools. The winter-sustained thermal energy dissipation and associated spectral changes do clearly involve changes in the proteinaceous conformational or organizational environment of the PSII antennae. We propose that the Chl loss and enhanced thermal energy dissipation, respectively, decrease the absorption and increase the dissipation rate of any excess light absorbed by the photosynthetic apparatus during winter when temperatures limit photosynthetic carbon fixation (1–6).
Materials and Methods
Plant Material.
All measurements were made on fully expanded leaves of 9-mo-old seedlings of snow gum (E. pauciflora Sieb. ex Spreng). Seed collection, germination and cultivation before transfer to a field site, and the environmental characteristics of the site were as described (4). The seedlings were grown in pots that were buried to ground level under field conditions for 6 mo from late summer through midwinter before the study. The plants experienced a natural field acclimation to high irradiance and freezing temperatures of at least 3 wk. After the acclimation treatment, the potted plants were returned to the laboratory for the deacclimation period during which they remained well watered in their pots. Deacclimation occurred under room temperature (20°C) and low incident light (<20 μmol photons⋅m−2⋅s−1).
The 77 K Chl Fluorescence Spectra.
Leaf pieces (14 × 5 mm) were excised and the ratio of variable to maximal fluorescence (Fv/Fm) was first measured as described (13) from the sunny, adaxial surface that had been dark-adapted for at least 30 min. After the Fv/Fm determinations, the same leaf pieces were quick-frozen to 77 K, and their fluorescence spectra at 77 K were measured by using an SLM-8100 spectrofluorimeter (Spectronic, Rochester, NY) fitted with a liquid nitrogen dewar and cold finger. The excitation monochromator was scanned from 400 to 500 nm at 2.5-nm intervals while simultaneously scanning the emission monochromator from 650 to 770 nm at 1-nm intervals for a total scan time of 65 min. The excitation and emission slit widths were 4 and 2 mm, respectively; resolution was 2 nm/mm.
Chl Fluorescence Lifetimes.
Using the same initial Fv/Fm protocol (13) and at matching time intervals with the 77 K protocol, a matching leaf piece was completely vacuum infiltrated with 10 μM 3-(3,4-dichlorophenyl)-1,1′-dimethylurea alone (or where indicated plus 4 μM nigericin) for 30 min at room temperature. The adaxial leaf surface was used for fluorescence lifetime measurement by using a front surface cuvette in the refrigerated 5°C sample compartment of the ISS K2–004 (Urbana-Champaign, IL) multifrequency phase fluorometer. The fluorescence lifetimes were determined by using 12 logarithmically spaced frequencies ranging from 10 to 120 MHz; excitation was filtered through a Schott short pass LS550 (λ < 550 nm) filter while total Chl emission was collected through a long pass red Schott RG610 filter (λ > 610 nm). The lifetime reference sample was the scattered excitation light (τ = 0 ns) collected with a glycogen suspension and quartz cuvette. The phase angle shift and demodulation factors were fit to a trimodal fluorescence Lorentzian distribution model by using a global analysis program assembled with Microsoft excel 97 and visual basic and based on the methods of Alcala et al. (14) and Beechem et al. (15). The integral of the fractional intensity, for the sum of all component distribution modes was normalized to unity, i.e., ∫f(τ) dτ = 1. The best fits and overall model were judged by both the global (χ2 = 1.44) in addition to individual and local assessments of each data file (not shown), usually resulting in χ2 values <1; the SEs for the phase shift and demodulation factors were 0.2° and 0.004, respectively.
Pigment Analyses.
Pigments were extracted and assayed by using HPLC as described (16). A at 440 nm was measured with a Waters 490 (Waters, Milford, MA) variable wavelength detector. SEs were <10% for both xanthophylls and Chls per sample injection.
Results and Discussion
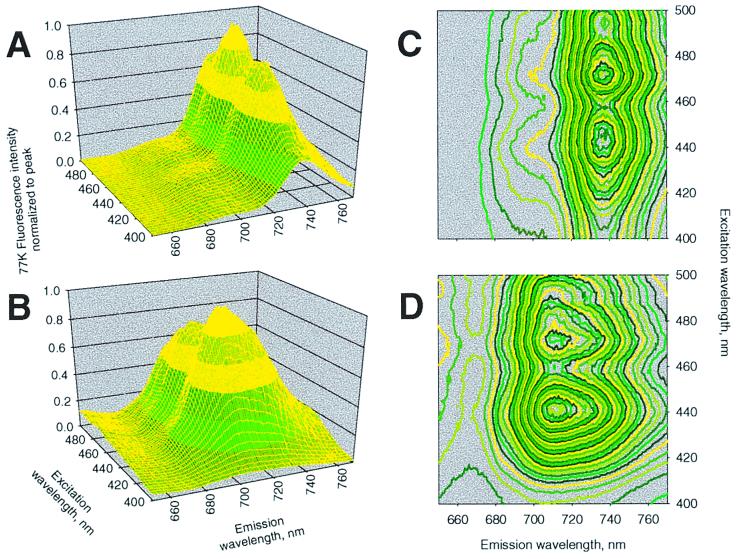
We investigated winter acclimation of the photosynthetic apparatus by measuring the 77 K Chl fluorescence emission vs. excitation spectra in field-grown leaves. Leaves with high photosynthetic efficiency exhibit a characteristic fluorescence emission-excitation spectrum similar to that shown for the deacclimated snow gum leaf in Fig. 1A. The predominating emission band at 737 nm originates from the heterodimeric PSI antenna complex comprising Lhca1 and Lhca4 (17). Minor emission spectral bands, namely the 685-nm and 695-nm bands, that emanate from the PSII core antenna complexes known as CP43 and CP47, respectively (18, 19), are not the focus of this spectral profile that emphasizes the dominant longer wavelength band(s). The spectral contour, dominated by the 737-nm emission exhibits excitation maxima at 442 nm and 472 nm from Chls a and b, respectively. However, Fig. 1B shows that a winter-acclimated leaf (>8 wk) with a low Fv/Fm ratio (≈0.45) and a strongly reduced Chl a and b content (see legend) exhibits a dramatically altered excitation-emission spectral contour. The most striking feature is the prominent new emission maximum ≈710–715 nm, hereafter referred to as the “cold-hard band” or CHB. This novel spectral feature exhibits the major excitation maximum at 442 nm from Chl a and a depressed excitation peak from Chl b at 472 nm. The minor PSII emission bands are largely obscured by the CHB emission in the winter-acclimated leaves.
Figure 1.
Liquid nitrogen temperature (77 K) Chl fluorescence excitation vs. emission spectral contour plots of E. pauciflora leaves representing deacclimated (A and C) and winter high-light acclimated states (B and D). The concentrations (μmol m−2) of Chls a and b, respectively, were 410 and 98 in leaf A and 164 and 34 in leaf B. The spectral contours were normalized to the peak emission amplitude.
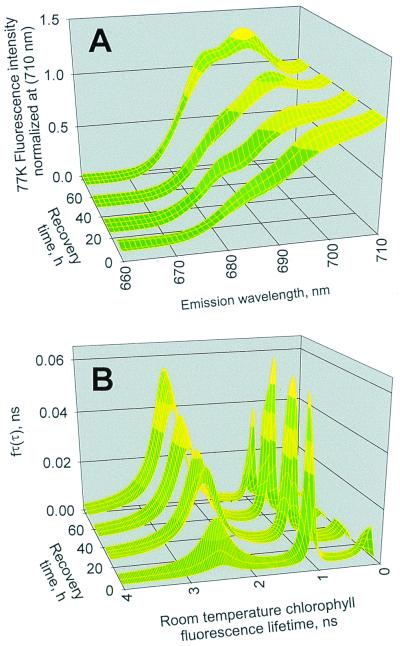
The experiments in Fig. 2 were performed to investigate probable relationships between the CHB, the 77 K PSII spectral emission region (primarily the 685- and 695-nm bands) and recovery of PSII photosynthetic efficiency at room temperature during winter deacclimation. Fig. 2A focuses on the 77 K emission profiles for the PSII emission region (spectra are normalized to unity at 710 nm) from leaves over the 4-day deacclimation period under low-light and room temperature conditions in the laboratory; the recovery period followed a natural field acclimation to high irradiance and freezing temperatures. A striking spectral feature is the gradual re-emergence of characteristic PSII emission bands at 685 and 695 nm at the expense of the CHB emission maximum ≈710–715 nm.
Figure 2.
Kinetics of changes in the 77 K Chl a fluorescence emission spectra and room temperature fluorescence lifetimes during winter deacclimation of E. pauciflora leaves. (A) Time-dependent changes in 77 K Chl fluorescence spectral profiles of the PSII-associated spectral region during recovery from winter acclimation. The emission profiles represent the integrated excitation from 400 to 500 nm. (B) Corresponding time-dependent changes in the room temperature Chl fluorescence lifetime distributions measured in parallel with the 77 K spectral profiles in A. Data on the recovery time axes in A and B are plotted as the moving average for each day of measurements for four leaves (two leaves per plant).
Kinetic resolution of the room temperature Chl fluorescence lifetime, τ, distributions of PSII, on the picosecond (ps = 10−12 s) to nanosecond (ns = 10−9 s) time scale, provides important information regarding PSII photochemistry, thermal energy dissipation, and protein conformational dynamics (6, 9, 10, 12, 13). Therefore, we measured as shown in Fig. 2B the corresponding changes in the room temperature PSII fluorescence lifetime distributions associated with the gradual 77 K spectral changes in PSII shown in Fig. 2A. Note that these data reflect changes caused only by radiationless energy dissipation because PSII photochemistry was arrested with an electron-transport inhibiting herbicide (6, 20). At the start of the recovery period, a high proportion of the PSII fluorescence lifetimes was distributed below 1 ns. Recovery was primarily associated with an increase in the fractional amplitude of a PSII associated Chl distribution (maximal amplitude at 685 nm) with a τ-center at approximately 2.5 ns at the expense of those with τ-centers of 1 ns or less. The global statistical analysis indicated that only the amplitudes and neither the centers nor widths of the lifetime distributions changed during recovery. This pattern was consistent with a shift in the relative population densities of Chl fluorescence emitter pools and clearly corresponded with the changing amplitudes of the different Chl–protein complexes seen in the 77 K spectra of Fig. 2A. The behavior of the 2.5-ns distribution amplitude was important because the well-characterized lumen pH- and xanthophyll cycle codependent quenching of PSII fluorescence is associated with significant changes in both the widths and centers of the main 2- to 2.5-ns distribution mode (6, 10). Thus the data in Fig. 2B strongly suggest that the slow recovery kinetics are not associated with a slowly relaxing trans-thylakoid pH gradient; this hypothesis was further tested in experiments described later.
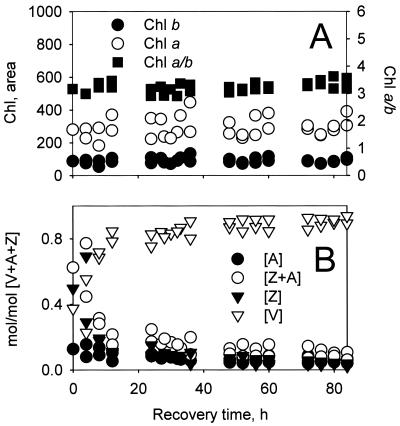
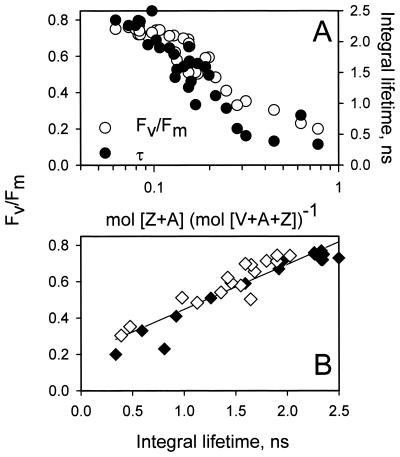
Although winter high light acclimation is associated with a significant Chl loss on a per-leaf area basis in E. pauciflora (Fig. 1), Fig. 3A shows that the Chl a and b concentrations remained mostly unchanged during the primary 4-day deacclimation period. Fig. 3B shows that there were very large changes in the relative concentrations of the xanthophyll cycle pigments violaxanthin (V), antheraxanthin (A), and zeaxanthin (Z); note that like the Chl levels the xanthophyll pool size [V + A + Z] remained constant during deacclimation. The epoxide-free zeaxanthin (Z) and mono-epoxide A molecules form via reversible de-epoxidation and epoxidation of the di-epoxide violaxanthin (V) in the xanthophyll cycle (8). The de-epoxidation reaction is associated with excess light conditions that acidify the chloroplast thylakoid lumen and activate the luminal violaxanthin de-epoxidase enzyme. Evidently during the exposure to combined low temperatures and high light, the lumen was acidified (11), causing acclimated leaves to accumulate [Z + A]. However, as reported by Gilmore and Björkman (11) the majority of the lumen acidity-dependent component of PSII energy dissipation did not sustain for much more than 5 min under the low-light, room temperature deacclimation conditions in either winter-acclimated or -deacclimated plants (data not shown). Fig. 3B shows during deacclimation under low light and warm temperatures, [Z + A] levels reversed via epoxidation; the kinetics were greatly slowed compared to typical deacclimated conditions (not shown) but still most rapid in the first 24 h followed by a more gradual decrease over the next 72 h. Fig. 4A shows that decreases in [Z + A] during deacclimation generally coincided with increases in PSII photochemical efficiency (○), measured as Fv/Fm (6, 21, 22) and as the integral of the fluorescence lifetime distributions with PSII photochemistry inhibited (●). Furthermore, Fig. 4B shows two important items: (i) that changes in the fluorescence lifetime integrals with the PSII-inhibiting herbicide correlate linearly with changes in Fv/Fm (6), and (ii) that saturating concentrations of protonophoric uncouplers included with the PSII-inhibiting herbicide (♦) do not influence the lifetime integrals or Fv/Fm compared to infiltration with the herbicide alone (⋄).
Figure 3.
Changes in leaf Chl and xanthophyll cycle pigments during winter deacclimation in E. pauciflora leaves corresponding to the conditions in Fig. 2. (A) Time-dependent changes in concentrations of Chl a and b (μmol m−2 leaf area), the Chl a/b ratio, and concentrations of the xanthophyll cycle pigments [Z], [A], their sum [Z + A], and [V] (B).
Figure 4.
Relationships among the PSII photochemical efficiency (Fv/Fm), the Chl fluorescence lifetime integral, and the combined concentration of the xanthophylls Z and A. (A) A scatter plot of corresponding measurements of Fv/Fm and the integral fluorescence lifetime vs. the [Z + A]. (B) The empirical linear correlation between Fv/Fm and fluorescence lifetime integrals in samples with herbicide alone (◊) or with herbicide plus uncoupler (⧫); the best-fit line inclusive of both data sets was defined as Fv/Fm = 0.248(τ) + 0.199; r2 = 0.873.
Conclusions
The classical mechanism of thermal energy dissipation by the Z and A molecules requires chloroplast thylakoid lumen acidification to protonate key PSII proteins, which then bind Z or A to engage the radiationless dissipation processes (6, 9, 23–25). It has been recently established that classical xanthophyll cycle-dependent energy dissipation requires a special PSII minor protein known as CP22 (23). Thus if the energy dissipation in our experiments is indeed caused by increased [Z + A], then there must be some conformational-structural change in PSII Chl proteins that overrides the necessity for the pH gradient. The large spectral shifts in Figs. 1 and 2 indeed indicate a significant structural change has occurred in PSII because the Chl fluorescence emission spectrum is primarily determined by the protein-structural environment of the Chl (6, 26). These changes may relate to the CP22 protein and or phosphorylation of PSII antennae proteins (27). In unstressed leaves, the CP22 protein exists at two copies per PSII and is probably structurally associated with the PSII inner-core antennae Chl a/b proteins (23, 28). However, Ottander et al. (2) showed that in Pinus sylvestris, the CP22 protein increases 20-fold in the winter along with retarded epoxidation and a decrease in the PSII reaction center (32 kDa) D1 protein. Deacclimation in our study occurred largely independent of any net increase in the total pool of Chl or carotenoids. We therefore conclude that the storage and safe-protection of Chl in these winter evergreens is achieved in the stable, energy-dissipating Chl–xanthophyll–protein complex(es) signified by the CHB structure. Formation and disassembly of these photoprotective complex(es) are fundamental processes associated with high light acclimation in overwintering snow gum and probably other evergreen species.
Acknowledgments
We thank Jack Egerton and Wayne Pippen for expert field assistance, Tim Hobbs for permission to grow eucalypts on his farm, and Drs. Xiao-ping Li and Eldon Ball and Profs. Jan Anderson, Barry Osmond, and M Srinivasan for thoughtful comments on the manuscript.
Abbreviations
- Chl
chlorophyll
- PSI
photosystem I
- PSII
photosystem II
- Fv/Fm
ratio of variable to maximal fluorescence
- CHB
cold hard band
- V
violaxanthin
- A
antheraxanthin
- Z
zeaxanthin
Footnotes
Article published online before print: Proc. Natl. Acad. Sci. USA, 10.1073/pnas.150237697.
Article and publication date are at www.pnas.org/cgi/doi/10.1073/pnas.150237697
References
- 1.Groom Q J, Baker N R, Long S P. Physiol Plant. 1991;83:585–590. [Google Scholar]
- 2.Ottander C, Campbell D, Öquist G. Planta. 1995;197:176–183. [Google Scholar]
- 3.Verhoeven A S, Adams W W, III, Demmig-Adams B. Oecologia. 1999;118:277–287. doi: 10.1007/s004420050728. [DOI] [PubMed] [Google Scholar]
- 4.Ball M C, Egerton J J G, Leuning R, Cunningham R B, Dunne P. Plant Cell Environ. 1997;20:155–166. [Google Scholar]
- 5.Warren C R, Hovenden M J, Davidson N J, Beadle C L. Oecologia. 1998;113:350–359. doi: 10.1007/s004420050386. [DOI] [PubMed] [Google Scholar]
- 6.Gilmore A M, Govindjee . In: Concepts in Photobiology: Photosynthesis and Photomorphogenesis. Singhal G S, Renger G, Sopory S K, Irrgang K-D, Govindjee, editors. New Dehli: Narosa; 1999. pp. 613–548. [Google Scholar]
- 7.Demmig-Adams B, Gilmore A M, Adams W W., III FASEB. 1996;10:403–411. doi: 10.1096/fasebj.10.4.8647339. [DOI] [PubMed] [Google Scholar]
- 8.Yamamoto H Y. Pure Appl Chem. 1979;51:639–648. [Google Scholar]
- 9.Gilmore A M, Shinkarev V P, Hazlett T L, Govindjee Biochemistry. 1998;37:13582–13593. doi: 10.1021/bi981384x. [DOI] [PubMed] [Google Scholar]
- 10.Gilmore A M, Hazlett T L, Debrunner P G, Govindjee Photochem Photobiol. 1996;64:552–563. doi: 10.1111/j.1751-1097.1996.tb03105.x. [DOI] [PubMed] [Google Scholar]
- 11.Gilmore A M, Björkman O. Planta. 1995;197:646–654. [Google Scholar]
- 12.Gilmore A M, Hazlett T L, Govindjee Proc Natl Acad Sci USA. 1995;92:2273–2277. doi: 10.1073/pnas.92.6.2273. [DOI] [PMC free article] [PubMed] [Google Scholar]
- 13.Gilmore A M, Shinkarev V P, Hazlett T L, Govindjee Photosynth Res. 1996;48:171–187. doi: 10.1007/BF00041007. [DOI] [PubMed] [Google Scholar]
- 14.Alcala J R, Gratton E, Prendergast F G. Biophys J. 1987;51:587–596. doi: 10.1016/S0006-3495(87)83383-0. [DOI] [PMC free article] [PubMed] [Google Scholar]
- 15.Beechem J M, Knutson J R, Alexander Ross J B, Turner B W, Turner L. Biochemistry. 1983;22:6054–6058. [Google Scholar]
- 16.Gilmore A M, Yamamoto H Y. J Chromatogr. 1991;543:137–145. [Google Scholar]
- 17.Knoetzel J, Bossmann B, Grimme H. FEBS Lett. 1998;436:339–342. doi: 10.1016/s0014-5793(98)01158-2. [DOI] [PubMed] [Google Scholar]
- 18.Rijgersberg C P, Amesz J, Thielen A P G, Swager J A. Biochim Biophys Acta. 1979;545:473–482. doi: 10.1016/0005-2728(79)90156-7. [DOI] [PubMed] [Google Scholar]
- 19.Nakatani H S, Ke B, Dolan E, Arntzen C J. Biochim Biophys Acta. 1984;765:347–352. [Google Scholar]
- 20.Velthuys B R. FEBS Lett. 1981;126:277–281. [Google Scholar]
- 21.Adams W W, III, Demmig-Adams B, Winter K, Schreiber U. Planta. 1990;180:166–174. doi: 10.1007/BF00193991. [DOI] [PubMed] [Google Scholar]
- 22.Butler W R, Kitajima M. Biochim Biophys Acta. 1975;376:116–125. doi: 10.1016/0005-2728(75)90210-8. [DOI] [PubMed] [Google Scholar]
- 23.Li X-P, Björkman O, Shih C, Grossman A, Rosenquist M, Jansson S, Niyogi K K. Nature (London) 2000;403:391–395. doi: 10.1038/35000131. [DOI] [PubMed] [Google Scholar]
- 24.Horton P, Ruban A V, Walters R G. Annu Rev Plant Physiol Plant Mol Biol. 1996;47:655–684. doi: 10.1146/annurev.arplant.47.1.655. [DOI] [PubMed] [Google Scholar]
- 25.Niyogi K K. Annu Rev Plant Physiol Plant Mol Biol. 1999;50:333–359. doi: 10.1146/annurev.arplant.50.1.333. [DOI] [PubMed] [Google Scholar]
- 26.Govindjee Aust J Plant Physiol. 1995;22:131–160. [Google Scholar]
- 27.Xu C C, Jeon Y A, Hwang H J, Lee C-H. Plant Sci. 1999;146:27–34. [Google Scholar]
- 28.Funk C, Schröder W P, Napiwotzki A, Tjus S E, Renger G, Andersson B. Biochemistry. 1995;34:11133–11141. doi: 10.1021/bi00035a019. [DOI] [PubMed] [Google Scholar]


