

Abstract
Kinetic analysis of the successive oxidative cyclic voltammetric responses of [OsII(bpy)2py(OH2)]2+ in buffered water, together with determination of H/D isotope effects, has allowed the determination of the mechanisms of the successive proton-coupled electron transfers that convert the OsII-aquo complex into the OsIII-hydroxo complex and the later into the OsIV-oxo complex. The stepwise pathways prevail over the concerted pathway in the first case. However, very large concentrations of a base, such as acetate, trigger the beginning of a concerted reaction. The same trend appears, but to a much larger extent, when high local concentration of carboxylates are attached close to the Os complex. The OsIII-hydroxo/OsIV-oxo couple is globally much slower and concerted pathways predominate over the stepwise pathways. Water is, however, not an appropriate proton acceptor in this respect. Other bases, such as citrate or phosphate, are instead quite effective for triggering concerted pathways. Here, we suggest factors causing these contrasting behaviors, providing a practical illustration of the prediction that concerted processes are an efficient way of avoiding high-energy intermediates. Observation of a strong decelerating effect of inactive ions together with the positive role of high local concentrations of carboxylates to initiate a concerted route underscores the variety of structural and medium factors that may operate to modulate and control the occurrence of concerted pathways. These demonstrations and analyses of the occurrence of concerted pathways in an aquo–hydroxo–oxo series are expected to serve as guidelines for studies in term of methodology and factor analysis.
Keywords: concerted processes, electron transfer chemistry of metal complexes
Many reactions of electron transfer chemistry and radical chemistry associate single electron transfer with proton transfer. Molecular electrochemists have been interested in this as a special case of the coupling between electron transfer and acid-base reactions in a general sense (ref. 1, pp. 140–148). In these electrochemical proton-coupled electron transfers (PCET), proton transfer and electrochemical electron transfer have been viewed for a long time as separate steps as represented by the blue pathways in Scheme 1, proton transfer first, followed by electron transfer (PET) or vice versa (EPT). The mechanisms of many important processes have thus been uncovered by observing the change induced by addition of an acid to a nonacidic solvent in reductions or, conversely, of a base to a nonbasic solvent in oxidations (1). In water, treatment of the kinetics under the assumption that the protonation step are fast and reversible, albeit not always relevant, has proved successful in quite a number of cases (2). This conceptual framework changed rapidly when it was realized that electrochemistry could contribute efficiently to the interpretation of clues indicating that proton and electron transfers could be concerted (red pathway in Scheme 1) in several natural processes (3–5). Photosystem II (Scheme 2) is the most prominent example (6–8), but evidence has been gathered that similar processes are involved in the functioning of several other biochemical systems (9). Very likely, this is only the tip of the iceberg as electron transfer (and/or transport) and proton transfer (and/or transport) are associated in a considerable number of natural processes. The question may even be raised of whether the remarkable efficiency of enzymatic systems in which proton and electron transfers are coupled is not the result of their acting in concert.
Scheme 1.

Pathways for PCET oxidation. The superscripts O and R are for “oxidized” and “reduced,” respectively. Z (charge not shown)/HZ+ is any electroinactive acid-base couple attached or not to the X structure, including the H3O+/H2O and H2O/OH− couples when the solvent is water.
Scheme 2.

Schematic view of Photosystem II. (A) Kok cycle (15). (B) Structure of the reaction center of Photosystem II showing the TyrZ-ChlD1(P680)-PheoD1-QA donor-chromophore-acceptor system, electron transfer from tyrosine (TyrZ) being coupled to proton transfer from histidine D1 H190 (the numbers are the distances in ångstroms). OEC, oxygen evolving complex, from ref. 16. (C) One proposed schematic view of the OEC Mn4Ca from ref. 17. Ala, alanine; Arg, arginine; Asp, aspartate; Glu, glutamate; His, histidine. The numbers are the distances in ångstroms. The distances between Mn (red) and Ca (orange), as illustrated by the connecting lines, are: gray, 2.7 Å; blue, 3.3 Å, green, 3.4 Å. In the labeling scheme, amino acids in black are in the first coordination sphere and those beyond in gray.
Coupling proton transfer to electron transfer entails an improvement of the driving force of the reaction. The benefit of the additional driving force offered by the coupling with proton transfer is expected to be fully exploited along the concerted pathway rather than along the stepwise pathways, although there might be a kinetic price to pay for this advantage. Model systems have been investigated using molecular electron transfer agents, including photogenerated or electrochemically generated species, or by means of direct electron transfer to or from an electrode (10, 11). In all these cases, the electron and proton exchanging coreactants are different species. Otherwise the reaction consists, at least formally, in a hydrogen-atom transfer.
The electrochemical approach, through nondestructive techniques such as cyclic voltammetry offers several distinct advantages: Scanning the electrode potential is equivalent to using a continuous set of electron acceptors; the current flowing through the electrode is a direct measure of the overall kinetics, which includes the diffusion of the various species toward or from the electrode. Once diffusion has been taken into account, the current is thus a reflection of the mechanism and kinetics of the set of reactions under investigation. An additional attractive feature of this approach is that the forward and reverse reactions may be simultaneously characterized.
Although electrochemical reactions that have been unambiguously shown to proceed via the CPET route are not many for the time being, they are numerous enough to show the capability of the electrochemical approach (11). Most investigations so far have concerned the oxidation of phenols, being principally inspired by the involvement of tyrosine oxidation in Photosystem II in the proximity of a histidine serving as putative proton acceptor (Scheme 2).
In line with this biological inspiration, the question of the mechanism of PCET reactions also arises about the way in which the oxygen evolution manganese cluster of Photosystem II (Scheme 2) is able to catalyze the oxidation of water. This is the case as well for artificial catalytic systems of the same reaction based on transition metal complexes (12–14) where the role of the metal(II)aquo–metal(III)hydroxo–metal(IV)oxo PCET sequence is deemed essential.
We have taken as an illustrative example in this quest of concerted pathways in metal(II)aquo–metal(III)hydroxo–metal(IV)oxo PCET sequences, the electrochemical oxidation of the [OsII(bpy)2py(OH2)]2+ (py, pyridine; bpy, 2,2′-bispyridine) complex in water. The mechanism of the PCET oxidation of metal(II)aquo–metal(III)hydroxo–metal(IV)oxo sequence has been addressed in pioneering, albeit not conclusive, electrochemical and homogeneous studies of similar ruthenium complexes (18–22), at a time where the concept of concerted proton-electron transfer was not available or, later on, at a time where the notion of pH-dependent driving force for a CPET reaction was not yet clearly recognized as incorrect (23). The mechanistic analysis was additionally obscured by the possible interference of Ru(II)+Ru(IV) comproportionation. The domain of thermodynamic existence of the Ru(III) is indeed very narrow over the accessible range of pH. This is not the case with the present osmium complexes as made clear in the following sections and was an additional reason for selecting this series as illustrating examples.
Results and Discussion
A typical slow-scan rate cyclic voltammogram (ref. 1, chapter 1, and ref. 24) of [OsII(bpy)2py(OH2)]2+ is shown in Fig. 1A (anodic currents are represented as positive). Two chemically reversible successive 1-electron waves are seen. The midpoint between the anodic and cathodic peaks of each wave is a measure of the apparent standard potential, Eap0, of the OsII/OsIII and OsIII/OsIV redox couples, respectively.
Fig. 1.

Cyclic voltammetry. (A) typical 2-wave voltammogram for the oxidation of 0.4 mM [OsII(bpy)2py(OH2)]2+ in a 0.1 M Britton–Robinson buffer at pH = 3.1 at 0.2 V/s obtained at a boron-doped diamond electrode. (see SI Appendix). (B) variation of the apparent standard potential with pH, defining the zones of thermodynamic stability of the various intervening species.
The successive apparent standard potentials so derived both vary with pH as shown in Fig. 1B, allowing the definition of the zones of thermodynamic stability of the participating species (Pourbaix diagrams). The distance between the apparent standard potentials is of the order of half-a-volt, making the interference of disproportionation negligible at all accessible pH values.
For pH values between 2 and 9, both apparent standard potentials vary with pH linearly, with the characteristic slope of 0.059 V per pH unit, indicating the concomitant exchange of 1 proton and 1 electron. PCET reactions are thus involved in both cases as summarized in Scheme 3, where the possibility that stepwise (blue) and concerted (red) pathway be followed in the 2 successive oxidation reactions is underlined.
Scheme 3.

Z (charge not shown)/HZ+ is any electroinactive acid-base couple attached or not to the X structure, including the H3O+/H2O and H2O/OH− couples when the solvent is water. E0, standard potential; kS, standard rate constant; KZH, acid dissociation constant; Kas, association constants with Z; Kas+, association constants with HZ+.
The CPET pathway involves the formation of transient adducts between the reduced complexes and the base Z (any base present in the solution such as the bases of the buffer and water or OH−) and between the oxidized complexes and the acid HZ+ (conjugated acid of Z) and H3O+ and H2O. The Pourbaix diagram of the OsII/OsIII redox couple shows 2 horizontals starting at pH values that correspond to pKMIIIOH2 = 9.2 and pKMIIOH2 = 1.9, indicating that the MIIOH and MIIIOH2 intermediates can be reached within the available pH range. This is not the case with the OsIII/OsIV couple, where the MIIIO and MIVOH intermediates are of too high energy to be accessible.
Whatever the reaction mechanism, the thermodynamics of the 2 successive oxidation reactions may be described by a global Nernst law:
 |
E is the electrode potential. Σ indicates a summation of the concentrations at the electrode surface over all species having the same oxidation degree. The protonation/deprotonation reactions are so fast that they can be considered as being under unconditional equilibrium. Then, in the oblique portions of the Pourbaix diagram, and taking into account that the association constants are small (KasII[Z], Kas,+III[HZ+] ≪ 1, (KasIII[Z], Kas,+IV[HZ+] ≪ 1), the expression of the apparent standard potential, Eap0, as a function of the individual standard potentials may be derived from the equilibrium concentrations of the various intervening species (Eqs. 1S and 2S in SI Appendix).
At the first wave:
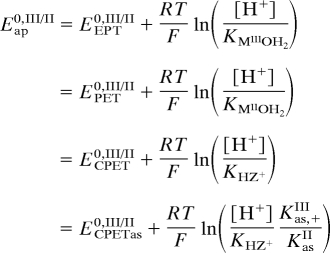 |
At the second wave:
 |
These relationships display the expected 59 mV-slope linear variation with pH. We also note that Eap0 is in all cases independent of the buffer concentration, which results from the assumption that KasII[Z] ≪ 1 and Kas,+III[Z] ≪ 1.
The driving force for each pathway is given by the difference between the electrode potential and each specific standard potential. In all cases, including the CPET pathways, the driving force is independent of pH. For the EPT and PET pathways, the standard potentials are the values of Eap0 for pH = pKMIIIOH2 (first wave), pKMIVOH (second wave), pH = pKMIIOH2 (first wave), and pKMIIIOH (second wave), respectively. These potentials may be reached for the III/II couple but not for the IV/III in the available pH range. E0CPET derives from the value of Eap0 for pH = pKHZ, i.e., the pK of the buffer, for both waves and E0CPETas contains additionally the ratio of the association constants with the basic and acid form of the buffer.
As shown in Fig. 1A, the anodic-to-cathodic peak potential splitting is much smaller for the OsII/OsIII couple than for the OsIII/OsIV couple indicating that the first PCET is globally much faster than the second. The kinetics of the outersphere electron transfer steps in the stepwise pathways may be described by the Marcus–Hush–Levich rate law, which takes into account the multiplicity of electronic states in the electrode and uses, for each of them, a quadratic activation-driving force relationship (25). The same law may also be approximately applied to electrochemical innersphere CPET reactions (25, 26). In all cases, one may use with a good accuracy, a simplified rate law, viz., the Butler–Volmer rate law in which the relationship between activation free energy and driving force is linearized:
 |
i is the current density, S the electrode surface area. E0is the standard potential characterizing the reaction pathway under examination, and kS the standard rate constant (rate constant at zero driving force). The transfer coefficient α, which measures the rate at which the activation free energy varies with the driving force, may be taken as equal to 1/2, as in Eq. 2, with a good accuracy because driving forces are small.
Application of Eq. 1 to the various possible reaction pathways leads, taking into account the equilibrium expressions of the reactant concentrations at the electrode surface (Eqs. 1S and 2S in SI Appendix), to a global Butler–Volmer rate law:
 |
C0is the total bulk concentration of the complex) involving an apparent standard rate constant that contains the contributions of all 3 reaction pathways.
For the first wave:
 |
and, for the second:
 |
In Eq. 2:
 |
The convolution integral (t, time) on the right-hand side takes care of the linear diffusion between electrode and solution bulk, with a diffusion coefficient, D, which can be considered with a good accuracy as being the same for all reactants. The last condition to be taken into account to derive the current-potential curve is the linear variation of the electrode potential, with the same scan rate, v, during the anodic and cathodic scans. Under these conditions, the anodic-to-cathodic peak potential distance is a function of the dimensionless parameter kSap. The determination of kSap from the peak potential separation requires this parameter to be small enough for the peak potential separation be larger than the 60 mV (at 25 °C) that characterizes the diffusion control of the overall electrochemical reaction so as to achieve conditions in which this is kinetically controlled, at least partly, by electron transfer (25). Determination of kSap from the anodic-to-cathodic peak potential distance thus required the use of much higher scan rates for the OsII/OsIII couple (Fig. 2A) than for the OsIII/OsIV couple. An example of “trumpet plot” thus used for these determinations is given in Fig. 2B for the OsII/OsIII PCET.
Fig. 2.

Cyclic voltammetry of 1.8 mM [OsII(bpy)2py(OH2)](PF6)2 at a glassy carbon electrode in a pH = 4.8 Britton–Robinson 0.1 M buffer solution limited to the OsII/OsIII wave. (A) Normalized cyclic voltammograms (v is the scan rate) at 0.1 (yellow), 10 (green), 50 (blue), 100 (red), 200 (magenta) V/s. The oscillations at high scan rates correspond to the maximal positive feedback resistance compensation (see SI Appendix). (B) Anodic (upper dots) and cathodic (lower dots) peak potentials (Ep) as a function of the log of scan rate. Simulation of the “trumpet plot” (full line) leads to the determination of kSap (D = 5 × 10⁻⁶ cm2·s−1 from the peak current density: Ip/F = 0.446√FvD/RTC0, where C0 is the osmium complex bulk concentration).
The variation of kSap with pH (27) summarized in Fig. 3, is in agreement with a mechanism in which the stepwise pathways completely prevail over the concerted pathway in the framework of Scheme 3 Upper (the imperfect reproducibility of the electrode surface, despite polishing after each run, is the main cause of the scatter in the data points). The blue lines in Fig. 3 indeed represent the predicted variations of kSap according to Eq. 3 in which the contribution of the CPET pathway is neglected. The quasi-absence of H/D isotope effect (Fig. 3B) points to the same conclusion. As expected, the EPT mechanism predominates in acidic media and the PET mechanism in basic media. In the EPT case, the decrease of kSap upon increasing the pH reflects the increasing difficulty for the reaction to proceed through an instable intermediate, viz., MIIIOH2. Conversely, in the PET case, the decrease of kSap upon decreasing pH reflects the increasing difficulty for the reaction to proceed through an unstable intermediate, viz., MIIOH.
Fig. 3.

Variation of the apparent standard rate constant of the OsII/OsIII couple with pH. (A and B) Blue dots, 0.1 M Britton–Robinson buffers in water. Solid line, prediction based on the stepwise square scheme mechanism in Scheme 3 Upper. (B) Red dots: 0.1 M Britton–Robinson buffers in D2O. (Inset) Shown is the dependence of the apparent standard rate constant on buffer concentration in an acetate buffer at pH 5 in water.
We have found, in an experiment using acetate as proton acceptor (insert in Fig. 3B), that a slight acceleration of the reaction is observed when acetate concentration is raised up to 2 M, indicating the onset of a CPET contribution. This observation is reminiscent of earlier data obtained with a similar osmium complex attached to the end of a long-chain thiol through a NH2 group in the 4-position of the pyridine ligand, assembled with long chain thiols, of similar length, terminated by a carboxylic acid group (28, 29). A much more significant contribution of a CPET pathway was demonstrated (confirmed by a significant H/D isotope effect) by the fact that the values of kSap shown in Fig. 4(now expressed in s−1 because a surface reaction is dealt with) stand significantly above (green stars) the blue curve depicting the predictions for the stepwise pathways (descending and ascending dotted blue curves for the EPT and PET pathways, respectively). These observations were initially interpreted as resulting from a CPET reaction involving water as the proton acceptor. In fact, the water-CPET pathway (descending red curve) is very inefficient and less favorable than the EPT pathway. The main reason for this is that the driving force is more favorable in the second case than in the first. Indeed, ECPET,H2O0,III/II = Eap,pH=00,III/II > EEPT0,III/II = Eap,pKMIIIOH2=1.90,III/II.
Fig. 4.

Oxidation of [OsII(bpy)2(4-py-NH2)OH2]2+ attached to the electrode by means of long-chain thiols assembled with long chain thiols terminated by a carboxylic acid group on a glassy carbon electrode surface. Green stars, data points from ref. 29. The blue lines represent the simulation of the contribution of the 2 stepwise pathways as in Fig. 3. The green thick line simulates the contribution of the CPET pathway involving the superficial carboxylate groups as proton acceptors, taking into account the homoconjugation (KHC) between −CO2− and −CO2H: KHCZ0 = 235 (Z0 is the total superficial concentration of −CO2− and −CO2H), with Kas,+IIIZ0 = 7.5ç Kas,+IIZ0 = 3.4, KsCEPT = Ks,III/IIEPT = Ks,III/IIPET = 5 s−1.
OH− may be thought of as another potential CPET-proton acceptor candidate. It is, however, quite inefficient, as can be judged from the ascending red curve in Fig. 4. The reason is not the same as in the preceding case. The driving force is indeed favorable: ECPET,OH−0,III/II = Eap,pH=140,III/II < EPET0,III/II = Eap,pKMIIOH2=9.20,III/II, but the concentration of OH− is too small in the investigated pH range. The result is that the PET pathway predominates over the OH−-CPET pathway.
The CPET pathway that is actually followed involves the carboxylate groups embedding the osmium complexes at the end of the self-assembled film as demonstrated by the simulation shown in Fig. 4 as a green line (successful simulation in this case required lifting the assumption that KasII [H] ≪ 1 and Kas,+III[HZ+] ≪ 1, thus leading to a somewhat more intricate algebra).
At this stage of the analysis of the kinetics and mechanisms of the OsII/OsIII PCET interconversion, we may conclude that the stepwise pathways are predominantly followed, the EPT pathway in the acidic pH range and the PET pathway in the basic pH range. H2O-CPET and OH−-CPET do not interfere to any appreciable extent. The appearance of a CPET contribution with other proton acceptors, such as acetate, requires very high concentrations in solution. In line with this observation is the significant acceleration of the CPET pathway when carboxylate ions are forced to sit in the close vicinity of the osmium reactant.
We now discuss the mechanisms of the PCET reactions taking place at the second wave where the osmium(III) hydroxo complex is oxidized into the osmium(IV) oxo complex giving rise to the mechanistic possibilities depicted in Scheme 3 Lower.
The glassy carbon electrode that was used successfully to investigate the kinetics of the OsIIOH2/OsIIIOH couple did not prove appropriate in terms of reproducibility in the more positive potential domain required by the analysis of the second wave. We used instead a boron-doped diamond electrode (31), the preparation and activation procedures of which are described in SI Appendix.
Analysis of the kinetics at the second wave was made easier by subtraction of the first wave current prolonged in the potential range of the second wave by simulation of the first wave as a Nernstian diffusion controlled wave (Fig. 5A). The resulting corrected waves are shown as a function of pH in Fig. 5B. The investigation was limited to pH < 7 because, above this value, an electrochemically induced substitution of the pyridine ligand by water tends to obscure the kinetic analyses. Trumpet plot similar to that in Fig. 2B allowed the derivation of the apparent rate constant. Because the electron transfer process is globally much slower in the OsIIIOH/OsIVO case than in the OsIIOH2/OsIIIOH case, smaller scan rates (0.05–0.2 V/s) could be used and ohmic drop correction, leading to oscillations as shown in Fig. 2A, was not necessary.
Fig. 5.

Cyclic voltammetry of the osmium complex. (A) light red, typical 2-wave voltammogram for the oxidation of 0.4 mM [OsII(bpy)2py(OH2)]2+ in a 0.1 M Britton–Robinson buffer at pH = 3.1 at 0.05 V/s obtained at a boron-doped diamond electrode. (see SI Appendix). Dark red, simulation of the first wave as a Nernstian diffusion controlled wave, using the DigiElch package (31). Blue, subtraction-corrected second wave. (B) subtraction-corrected second wave as a function of pH in 0.1 M Britton–Robinson buffers. From right to left: pH = 3.1, 3.5, 4.0, 4.5, 4.9, 5.5, and 5.9. Scan rate: 0.05 V/s.
The resulting values of ksap are shown in Fig. 6A as a function of pH in H2O and pD in D2O. Because the data in Fig. 6 concern acidic media, we expect the PET pathway to contribute negligibly, leading to a simplified mechanism consisting in a competition between the EPT pathway and CPET pathways. It immediately appears that the H/D isotope effect is practically nil at the lowest pH and increases with pH, rapidly reaching a value of 2– 2.5. An EPT mechanism, for which no H/D isotope effect is predicted, is thus operating at the lowest pH. Starting from this pH, the apparent standard rate constant for this mechanism is expected to decrease with pH according to:
(which corresponds to the first term in Eq. 4) as represented by the dotted descending straight line in Fig. 6B. All of the other data points are located above this line, pointing to the occurrence of CPET pathways, as confirmed by the observed H/D isotope effect. These observations also indicate that, among the possible CPET routes, a pathway that would involve water as proton acceptor is not at work. Otherwise an H/D isotope effect should have been observed at the lowest pH and the apparent rate constant would linearly decrease with pH.
Fig. 6.

Apparent standard rate constant. (A) apparent standard rate constant as a function of pH in light (red open circles) and heavy (red stars) water. Dotted straight line, prediction for the EPT pathway. Full red curve, prediction for CPET pathways induced by the bases of the 0.1 M Britton–Robinson buffer. (B) detail of the contribution of each buffer couple: magenta and green: phosphoric acid, pK = 2.16 and 7.21, respectively; cyan, blue, and yellow: citric acid, pK = 3.15, 4.77 and 6.40, respectively.
It follows that CPET reactions involving bases contained in the Britton–Robinson buffer are clearly operating. Analysis of the ensuing kinetics requires generalizing Eq. 4 to a case where several bases may contribute to the CPET process. Still neglecting the contribution of the PET pathway, this generalization with the assumption that Kas, jII[Zj] ≪ 1 and Kas+, jIII[HZj+] ≪ 1, for a set of buffer couples ranging from j = 1 to j = n, leads to:
 |
Fig. 6B represents the contributions of the various bases of the Britton–Robinson buffer that are present in significant amount within the investigated pH range: citric acid (pK = 3.15, 4.77, 6.40), phosphoric acid (pK = 2.16, 7.21) under the assumption that their intrinsic contribution, represented by ksCPET,j, is the same for all bases. The maximal value of each contribution is reached when [Zj] = [HZj+], i.e., when pKHZ+ = pH. Addition of the various contributions according to Eq. 3, with kSCPET,j = 1.6 × 10⁻³ cm·s−1·M−1 ∀ j, led to a good agreement (Fig. 6A) with the experimental data, thus validating the assumptions made in the above derivations. kSCPET,j measures the kinetics of a formally third order overall reaction (hence the above units). There is no way, at present, to dissect its value into the 3 ingredients, kS,IV/IIICPET,s, Kas,jIII, and Kas,+, jIV. It is worth noting that the possibility of an actual ternary reaction in which the electrode, the osmium complex and the proton acceptor would react together within a single step cannot be excluded. Contrary to certain beliefs, there is indeed no impossibility for such reactions provided concentrations are high enough (ref. 1, pp. 184–187, and ref. 32). The ternary collision frequency is ca 20 times lower than the bimolecular collision frequency, i.e., of the order of 2.5 102 cm·s−1·M−1. Discrimination between such a ternary pathway and a pre- and postassociation mechanism would require independent information on the magnitude on possible associations with the difficulty that there are likely to be weak.
Another series of experiments, in which substantial amounts of a supporting electrolyte were added to the solution, provided further insights into the mechanism of the CPET process. The salts used as standard supporting electrolytes in electrochemical experiments are selected as being well dissociated and being as much as possible chemically inert. We selected KNO3 in this connection in the purpose of investigating the role of ions that cannot partake directly in the PCET process. To simplify the problem, a single buffer component was used, viz., citric acid at pH = 5.2 (the citric acid pK involved is thus 4.8).
The results displayed in Fig. 7 show that both the apparent standard potential and the apparent standard rate constant are strongly influenced by the addition of KNO3. At high concentrations, Eap0 tends to increase linearly with log[KNO3] at a rate of 59.3 mV per log unit, whereas logkSap tends to decrease linearly with log[KNO3] with a slope of 1/2. Test experiments with addition of other supporting electrolytes show that the resulting decrease of kSap varies in the order KNO3 > KPF6 ≈ NaClO4 > Na2SO4. We also noted that the pH is not influenced by the addition of KNO3.
Fig. 7.

The OsIIIOH/OsIVO reaction in 0.2 M citric acid at pH = 5.2 in the presence of increasing amounts of KNO3. Variation of the apparent standard potential (A) and the apparent standard rate constant (B). Red dots, experimental data; red lines, predictions for the mechanism in Scheme 4.
These observations imply that the effect of the supporting electrolyte concerns the NO3− anion, in line with the fact that all intervening osmium species are positively charged, thus suggesting a mechanism (Scheme 4) where the interactions with the supporting electrolyte anion results in the formation of inactive adducts (most probably ion pairs) that compete with the formation of the Z and HZ+ adducts that are required to achieve the CPET reaction.
Scheme 4.

A− is an anion interacting with the various osmium complex without partaking directly in the PCET reaction.
Analysis of the resulting kinetics requires the modification of the equations giving the equilibrium concentration of the various reactants (Eqs. 3S in SI Appendix), taking into account the formation of the inactive adducts that we assume fast and reversible (the corresponding equilibrium constants are defined in Scheme 4) as for the formation of the CPET-active adducts.
The following expressions of the apparent standard potential, Eap0, as a function of the individual standard potentials, ensue.
 |
Whatever the considered expression, the experimental variations of Eap0 with log[A−], displayed in Fig. 7A, with the 59.3 mV-slope asymptote at large log[A−], imply that: KasIV,A[A−], Kas,HIV,A[A−] ≪ 1.
The red curve in Fig. 7A thus represents the fitting of the experimental data with an accordingly simplified expression of the apparent standard potential:
where KasIII,A = 9 M−1 and
 |
 |
Concerning the effect of the supporting electrolyte anions on the reaction kinetics, modification of Eq. 4, taking into account of the presence of [A−] in the expression of the equilibrium concentrations and of the various simplifications successively introduced, leads to:
 |
Application of this relationship led to satisfactory fitting of the kap0 data points in Fig. 7B using the same value, KasIII,A = 9 M−1, that was derived earlier from the apparent standard potential data. This adherence between experiment and prediction validates the mechanism proposed in Scheme 4 by which the supporting electrolyte decreases the CPET reactivity.
Conclusions
Systematic kinetic analysis of the successive oxidative cyclic voltammetric responses of [OsII(bpy)2py(OH2)]2+ in buffered water, together with determination of H/D isotope effects has allowed the determination of the mechanisms of the proton-coupled electron transfers that converts the osmium(II)–aquo complex into the osmium(III)–hydroxo complex and the later into the osmium(IV)–oxo complex.
The stepwise pathways prevail over the concerted pathway in the osmium(II)–aquo/osmium(III)–hydroxo reaction in most circumstances, the EPT pathway (electron transfer first, followed by proton transfer) below pH 7 and the PET pathway (proton transfer first, followed by electron transfer) above pH 7. H2O and OH− CPET routes appear ineffective. However, very large concentrations of a base, such as acetate, trigger the beginning of a CPET pathway. The same trend appears, but to a much larger extent, when reexamining previous data obtained with a similar osmium complex attached to the end of a long-chain thiol assembled with long chain thiols, of similar length, terminated by a carboxylic acid group. Above pH 4, the high local concentration of carboxylate ions in the vicinity of the attached osmium complex strongly favors the CPET pathway involving these ions as proton acceptors.
The osmium(III)–hydroxo/osmium(IV)–oxo couple exhibits a quite different behavior. It is globally much slower, by ∼3 orders of magnitude. Another striking difference is the predominance of concerted pathways over stepwise pathways over most of the accessible pH range. Water is, however, not an appropriate proton acceptor for an efficient CPET route. Other bases such as citrate, phosphate etc. often used in buffers are instead quite effective for triggering concerted pathways as revealed by the kinetic analysis of the cyclic voltammetric responses and confirmed by the observation of a significant H/D isotope effect. We are unaware of another study describing that the occurrence of a concerted mechanism has been established for a hydro/oxo complex couple.
Fig. 8 suggests a qualitative explanation of the different behaviors of the II/III and III/IV couples. The pK values that control the occurrence of the EPT pathway on the acidic side and the PET pathway on the basic side are much more distant in the second case than in the first, which gives more room for CPET reaction to occur in the second case than in the first. This is a practical illustration of the prediction that concerted processes are an efficient way of avoiding high energy intermediates. An additional factor is that the EPT and PET electron transfer intrinsic barriers may be higher for the III/IV couple than for the II/III couple.
Fig. 8.

Comparative kinetics of the osmium(II)- aquo/osmium(III)- hydroxo couple (blue open circle) and the osmium(III)- hydroxo/osmium(IV)- oxo couple (red open circle). Data from Figs. 3 and 6. The blue curves represent the predictions for the stepwise pathways. The lower blue curve has been obtained from the dashed blue curve in Fig. 6 with, additionally, an arbitrary moving aside of the EPT and PET pK values and a decrease of the characteristic kS for these 2 pathways.
Efficacy of these CPET routes is, however, under the dependence of additional factors that may counteract the interactions between the proton acceptor and the complex being oxidized. This is exemplified by the decelerating effect of anions that do not participate directly to the PCET process but form adduct with the reactive species thus preventing the initiation of the CPET reaction.
This observation together with the positive role of high local concentrations of carboxylates to initiate a concerted route in the osmium(II)–aquo/osmium(III)–hydroxo couple underscores the variety of structural and medium factors that may operate to modulate and control the occurrence of concerted pathways.
Supplementary Material
Acknowledgments.
We thank Pascal Mailley (Université Joseph Fourier, Grenoble France) and Philippe Bergonzo, Jacques de Sanoit and Emilie Van Hove (Commissariat à l'Energie Atomique, Saclay, France) for the gift of a boron-doped diamond electrode and helpful information on the properties and activation of this type of electrodes and Claude Andrieux (Laboratoire d'Electrochimie Moléculaire, Université Paris-Diderot) for his help in the preparation of small-diameter glassy carbon electrodes. This work was supported by the Laboratoire d'Electrochimie Moléculaire, Unité Mixte de Recherche Université—Centre National de la Recherche Scientifique No. 7591, Université Paris-Diderot, and the Agence Nationale de la Recherche through program “PROTOCOLE.”
Footnotes
The authors declare no conflict of interest.
This article contains supporting information online at www.pnas.org/cgi/content/full/0905020106/DCSupplemental.
References
- 1.Savéant JM. Elements of Molecular and Biomolecular Electrochemistry. New York: Wiley-Interscience; 2006. [Google Scholar]
- 2.Laviron E. Electrochemical reactions with protonations at equilibrium: Part II. The 1e, 1H+ reaction (four-member square scheme) for a heterogeneous reaction. J Electroanal Chem. 1981;124:1–7. [Google Scholar]
- 3.Stubbe J, van der Donk WA. Protein radicals in enzyme catalysis. Chem Rev. 1998;98:705–762. doi: 10.1021/cr9400875. [DOI] [PubMed] [Google Scholar]
- 4.Byrdin M, et al. Intraprotein electron transfer and proton dynamics during photoactivation of DNA photolyase from E. coli: Review and new insights from an “inverse” deuterium isotope effect. Biochim Biophys Acta Bioenerget. 2004;1655:64–70. doi: 10.1016/j.bbabio.2003.07.001. [DOI] [PubMed] [Google Scholar]
- 5.Shih C, et al. Tryptophan-accelerated electron flow through proteins. Science. 2008;320:1760–1762. doi: 10.1126/science.1158241. [DOI] [PubMed] [Google Scholar]
- 6.Tommos C, Babcock GT. Proton and hydrogen currents in photosynthetic water oxidation. Biochim Biophys Acta Bioenerget. 2000;1458:199–219. doi: 10.1016/s0005-2728(00)00069-4. [DOI] [PubMed] [Google Scholar]
- 7.Renger G. Coupling of electron and proton transfer in oxidative water cleavage in photosynthesis. Biochim Biophys Acta Bioenerget. 2004;1655:195–204. doi: 10.1016/j.bbabio.2003.07.007. [DOI] [PubMed] [Google Scholar]
- 8.Meyer TJ, Huynh MHV, Thorp HH. The possible role of proton-coupled electron transfer (PCET) in water oxidation by photosystem II. Angew Chem Int Ed. 2007;46:5284–5304. doi: 10.1002/anie.200600917. [DOI] [PubMed] [Google Scholar]
- 9.Miller A-F. Superoxide dismutases: Active sites that save, but a protein that kills. Curr Opin Chem Biol. 2004;8:162–168. doi: 10.1016/j.cbpa.2004.02.011. [DOI] [PubMed] [Google Scholar]
- 10.Huynh MHV, Meyer TJ. Proton-coupled electron transfer. Chem Rev. 2007;107:5004–5064. doi: 10.1021/cr0500030. [DOI] [PMC free article] [PubMed] [Google Scholar]
- 11.Costentin C. Electrochemical approach to the mechanistic study of proton-coupled electron transfer. Chem Rev. 2008;108:2145–2179. doi: 10.1021/cr068065t. [DOI] [PubMed] [Google Scholar]
- 12.Savéant JM. Molecular catalysis of electrochemical reactions. Mechanistic aspects. Chem Rev. 2008;108:2348–2378. doi: 10.1021/cr068079z. [DOI] [PubMed] [Google Scholar]
- 13.Kanan MW, Nocera DG. In situ formation of an oxygen-evolving catalyst in neutral water containing phosphate and Co2+ Science. 2008;321:1072–1075. doi: 10.1126/science.1162018. [DOI] [PubMed] [Google Scholar]
- 14.Concepcion JJ, Jurss JW, Templeton JL, Meyer TJ. One site is enough. Catalytic water oxidation by [Ru(tpy)(bpm)(OH2)]2+ and [Ru(tpy)(bpz)(OH2)]2+ J Am Chem Soc. 2008;130:16462–16463. doi: 10.1021/ja8059649. [DOI] [PubMed] [Google Scholar]
- 15.Kok B, Forbush B, McGloin M. Cooperation of charges in photosynthetic O2 evolution-I. A linear four step mechanism. Photochem Photobiol. 1970;11:457–475. doi: 10.1111/j.1751-1097.1970.tb06017.x. [DOI] [PubMed] [Google Scholar]
- 16.Ferreira KN, Iverson TM, Maghlaoui K, Barber J, Iwata S. Architecture of the photosynthetic oxygen-evolving center. Science. 2004;303:1831–1838. doi: 10.1126/science.1093087. [DOI] [PubMed] [Google Scholar]
- 17.Loll B, Kern J, Saenger W, Zouni A, Biesiadka J. Towards complete cofactor arrangement in the 3.0 Å resolution structure of photosystem II. Nature. 2005;438:1040–1044. doi: 10.1038/nature04224. [DOI] [PubMed] [Google Scholar]
- 18.Moyer BA, Meyer TJ. Properties of the oxo/aqua system [(bpy)2(py)RuO]2+/[(bpy)2(py)Ru(OH2)]2+ Inorg Chem. 1981;20:436–444. [Google Scholar]
- 19.Takeuchi KJ, Thompson MS, Pipes DW, Meyer TJ. Redox and spectral properties of monooxo polypyridyl complexes of ruthenium and osmium in aqueous media. Inorg Chem. 1984;23:1845–1851. [Google Scholar]
- 20.McHatton RC, Anson FC. Electrochemical behavior of [Ru(trpy)(bpy)(OH2)]3+ in aqueous solution and when incorporated in Nafion coatings. Inorg Chem. 1984;23:3935–3942. [Google Scholar]
- 21.Binstead RA, Meyer TJ. Hydrogen-atom transfer between metal complex ions in solution. J Am Chem Soc. 1987;109:3287–3297. [Google Scholar]
- 22.Lebeau EL, Binstead RA, Meyer TJ. Mechanistic implications of proton transfer coupled to electron transfer. J Am Chem Soc. 2001;123:10535–10544. doi: 10.1021/ja000517a. [DOI] [PubMed] [Google Scholar]
- 23.Costentin C, Robert M, Savéant JM. Concerted proton-electron transfer reactions in water. Are the driving force and rate constant depending on pH when water acts as proton donor or acceptor? J Am Chem Soc. 2007;129:5870–5879. doi: 10.1021/ja067950q. [DOI] [PubMed] [Google Scholar]
- 24.Bard AJ, Faulkner LR. Electrochemical Methods: Fundamentals and Applications. New York: Wiley; 2001. pp. 239–243. [Google Scholar]
- 25.Costentin C, Robert M, Savéant JM. Electrochemical concerted proton and electron transfers. Potential-dependent rate constant, reorganization factors, proton tunneling and isotope effects. J Electroanal Chem. 2006;588:197–206. [Google Scholar]
- 26.Costentin C, Robert M, Savéant JM. Adiabatic and non-adiabatic concerted proton-electron transfers. Temperature effects in the oxidation of intramolecularly hydrogen-bonded phenols. J Am Chem Soc. 2007;129:9953–9963. doi: 10.1021/ja071150d. [DOI] [PubMed] [Google Scholar]
- 27.Costentin C, Robert M, Savéant JM, Teillout AL. Concerted and stepwise proton-coupled electron transfers in aquo/hydroxo complex couples in water: Oxidative electrochemistry of [OsII(bpy)2(py)(OH2)]2+ ChemPhysChem. 2009;10:191–198. doi: 10.1002/cphc.200800361. [DOI] [PubMed] [Google Scholar]
- 28.Haddox RM, Finklea HO. Proton-coupled electron transfer of an osmium aquo complex on a self-assembled monolayer on gold. J Phys Chem B. 2004;108:1694–1700. [Google Scholar]
- 29.Madhiri N, Finklea HO. Potential-, pH-, and isotope-dependence of proton-coupled electron transfer of an osmium aquo complex attached to an electrode. Langmuir. 2006;22:10643–10651. doi: 10.1021/la061103j. [DOI] [PubMed] [Google Scholar]
- 30.Rudolph M. Digital simulations on unequally spaced grids: Part 2. Using the box method by discretisation on a transformed equally spaced grid. J Electroanal Chem. 2003;543:23–39. [Google Scholar]
- 31.Vanhove E, et al. Stability of H-terminated BDD electrodes: An insight into the influence of the surface preparation. Physica Status Solidi A. 2007;204:2931–2939. [Google Scholar]
- 32.Savéant JM. Dissociative electron transfer and the principle of microscopic reversibility. J Electroanal Chem. 2000;485:86–88. [Google Scholar]
Associated Data
This section collects any data citations, data availability statements, or supplementary materials included in this article.