

Abstract
We consider the inference of which of two alleles is ancestral when the alleles have a single nonsynonymous difference and when natural selection acts via protein tertiary structure. Whereas the probability that an allele is ancestral under neutrality is equal to its frequency, under selection this probability depends on allele frequency and on the magnitude and direction of selection pressure. Although allele frequencies can be well estimated from intraspecific data, small fitness differences have a large evolutionary impact but can be difficult to estimate with only intraspecific data. Methods for predicting aspects of phenotype from genotype can supplement intraspecific sequence data. Recently developed statistical techniques can assess effects of phenotypes, such as protein tertiary structure on molecular evolution. While these techniques were initially designed for comparing protein-coding genes from different species, the resulting interspecific inferences can be assigned population genetic interpretations to assess the effect of selection pressure, and we use them here along with intraspecific allele frequency data to estimate the probability that an allele is ancestral. We focus on 140 nonsynonymous single nucleotide polymorphisms of humans that are in proteins with known tertiary structures. We find that our technique for employing protein tertiary structure information yields some biologically plausible results but that it does not substantially improve the inference of ancestral human allele types.
Keywords: molecular evolution, population genetics, scaled selection coefficient, fitness
1 Introduction
Evolutionary biology is undeniably a historical science. The study of important evolutionary events is inherently retrospective. In contrast, much of evolutionary theory is prospective. A large body of population genetic theory deals with what will happen to allele frequencies over time given certain assumptions about natural selection, population structure, and mutation. Although this theory is prospective, it is not often actually employed to make predictions. Ideally, the future genetic composition of a population could be forecast based upon its existing composition. Given a sample of alleles from a population, the allele type that is most likely to fix in a population could be predicted. This could be done with population genetic theory if relative fitnesses could be assigned to the possible genotypes and some knowledge about mutational tendencies and population structure was available.
Population genetic theory does not purport to map relative fitnesses to possible genotypes. Instead, it presupposes that relative fitnesses are known or, in inferential contexts, should be treated as free parameters that are little influenced by available biological knowledge. This is a major limitation and is a key reason why prospective applications of population genetics are scarce. We suggest that de novo (or nearly de novo) prediction of fitnesses from genotypes should be a major focus of population genetics.
Natural selection operates on phenotypes and phenotypes arise from the interaction of genotypes and environment. Therefore, assignment of fitnesses to genotypes could be accomplished by collecting genotypic information, predicting phenotype, and then converting phenotypic predictions to fitness estimates. Due to dramatic technological improvements, genotypic information is increasingly straightforward to collect. Prediction of phenotype from genotype remains primitive but this mapping of genotype to phenotype is perhaps the most active area of biological research and is a central goal of computational biology. While genotype-phenotype mapping systems are in their infancy, at least some aspects of phenotype (e.g., protein tertiary structure) can now be usefully predicted from genotype. Furthermore, genotype-phenotype mapping systems will undoubtedly improve in the near future.
It is the task of evolutionary biologists to link phenotype and fitness and this study examines a crude framework (Thorne et al. 2007) for doing so. Although this framework could be employed for prospective purposes such as predicting which allele types will eventually get fixed, it would be difficult to evaluate it in a prospective setting. Therefore, we choose to evaluate the framework in a retrospective setting. Rather than forecasting which allele type in a population will eventually be fixed, we instead consider the closely related task of inferring which type is ancestral. Specifically, we estimate ancestral allele type from human single nucleotide polymorphism (SNP) data and then employ the chimpanzee genome to evaluate our estimates.
When species are distantly related, inference of the ancestral DNA sequences that relate them is conventionally done without regard to intraspecific polymorphism (e.g., Felsenstein, 2004; Yang et al., 1995) but, when reconstructing ancestral allele types from intraspecific data, the frequencies of extant allele types become highly relevant. Under standard population genetic assumptions and if variation among alleles is selectively neutral, the probability that an allele is the ancestral type is equal to its frequency in the population (Watterson and Guess, 1977). Watterson and Guess (1977) noted that if mutation rates are not negligible, the most frequent allele is less likely to be oldest. Likewise, if genetic variation is not neutral, the probability that an allele is ancestral is no longer the allele frequency (e.g., Slade, 2000; Fearnhead, 2002; Taylor, 2007). New mutations are more commonly deleterious than advantageous and new deleterious mutations are unlikely to reach high or even moderate allele frequencies before being lost. Accordingly, it is intuitive that the probability of a deleterious allele being ancestral is less than its frequency. Donnelly and Kurtz (1999) made the sensible conjecture that the expected fitness of a common ancestral allele will exceed that of a randomly selected allele from the population. Slade (2000) and Fearnhead (2002) corroborated the conjecture with simulation and analytical treatments, respectively, using the ancestral selection graph technique of Krone and Neuhauser (1997). Because nonsynonymous SNPs (nsSNPs) are expected to be more deleterious than synonymous SNPs (sSNPs), these results coincide with empirical findings such as the tendency of nsSNPs to have lower allele frequencies than sSNPs (Cargill et al., 1999).
The concurrent growth of genetic variation and protein structural data has motivated the integration of information regarding coding SNPs and protein structure (Chasman and Adams, 2001; Sunyaev et al., 2001a,b; Wang and Moult, 2001; Ramensky et al., 2002; Hughes et al., 2003; Krishnan and Westhead, 2003; Yue et al., 2005; Yue and Moult, 2006). These techniques attempt to associate genetic variation of SNPs with phenotypic consequences of abnormal protein structural changes and diseases in order to predict which nsSNPs are likely to affect protein function (see also Stone and Sidow, 2005). Although these studies connect genotypic changes with phenotype, they typically do not provide a population genetic interpretation about differences in relative fitnesses among alleles.
Likewise, de novo predictions of genotypic fitnesses tend to be unavailable for population genetic studies. Efforts to better handle natural selection in models of interspecific evolution emerged with Halpern and Bruno (1998), who related rates in interspecific models of sequence change to fixation probabilities of population genetic diffusion theory (Kimura, 1962). More recently, Nielsen and Yang (2003) studied codon models and estimated the distribution of the product of effective population size (N) and selection coefficient (s), a product referred to as the scaled selection coefficient. The codon model of Nielsen and Yang (2003) has the independent-site assumption that each codon evolves independently of each other, and there is no genotype-phenotype mapping built into the model. Robinson et al. (2003) relaxed the independent-site assumption of codon models by explicitly incorporating molecular phenotype (e.g., protein tertiary structure). Hereafter, we refer to Robinson et al. (2003) model as the dependent-sites model. Although the dependent-sites model was designed to study interspecific sequence data, Thorne et al. (2007) assigned population genetic interpretations to the parameters relating to phenotype in the model. These interpretations exploit techniques for predicting phenotype from genotype and can approximate the distribution of scaled selection coefficients among possible nonsynonymous changes. In so doing, a population genetic interpretation of the dependent-sites model yields estimates of the magnitude and direction of selection pressure.
There are a paucity of studies that combine phenotype and genetic variation to pursue the probability that an allele is ancestral. Here, we consider natural selection due to protein tertiary structure when inferring allele ancestry. We first examine allele frequencies in two large human SNP data sets. We refer to the less frequent allele at a biallelic SNP locus as the minor allele and to the more frequent one as the major allele. We find that the minor allele of nonsynonymous SNPs (nsSNPs) is slightly less likely to be ancestral than the minor allele of an intron SNP if the two minor alleles have about the same frequency (see also Cargill et al. 1999; Chen and Rajewsky, 2006). This is consistent with purifying selection at nsSNP loci. Second, we infer the probability of ancestry for the two alleles of each of 140 nsSNPs. We do this by obtaining protein tertiary structure information for these SNPs and by deriving the probability that an allele is ancestral given allele frequency and given a measure of compatibility between protein sequence and tertiary structure (see Jones et al., 1992). To evaluate our procedure, we use orthologous chimpanzee loci to determine the ancestry of the 140 human nsSNP alleles and we then compare these ancestral alleles with the probabilities of ancestry that we have computed for them.
2 Materials and Methods
2.1 Data preparation
We concentrate on two data sets of human SNPs, one from the human HapMap project (The International HapMap Consortium, 2005) and the other from the National Institute of Environmental Health Sciences (NIEHS) SNP project (Livingston et al., 2004). For both data sets, we focus on which human SNP allele is ancestral and which is derived.
Following the Chimpanzee Sequencing and Analysis Consortium (2005), we infer the ancestry of SNP alleles by comparing them to the chimpanzee genome and assuming that the ancestral human allele has the nucleotide type found in the reference chimpanzee genome. This parsimony procedure amounts to the assumption that mutation is rare enough to neglect the possibility that multiple mutations occurred at an individual SNP locus since the most recent common ancestor of human and chimpanzee. Although we do not pursue it here, a potential correction to the parsimony procedure has recently been proposed by Hernandez et al. (2007). To obtain chimpanzee DNA that is orthologous to human SNP sites, we relied upon University of California Santa Cruz (UCSC) Genome Browser table called “snp126orthoPanTro2Rhemac2” (Thomas et al., 2007). Via the web interactive application “Galaxy” (Giardine et al., 2005), we used the table that was available on April 13th, 2007.
We first examined the SNP frequency data of an African population from the International HapMap Project. These data were downloaded from build 127 of the dbSNP database (Sherry et al., 2001). The functional class annotations in this database allowed us to gather information concerning 11,807 sSNPs, 12,704 nsSNPs, and 951,603 intron SNPs. We ignored a small number of SNPs for which neither human allele matches the chimpanzee outgroup.
SNPs discovered by the International HapMap Project suffer from ascertainment bias in SNP genotyping processes (Nielsen and Signorovitch, 2003). Rather than directly sequencing all individual chromosomes, SNP discovery often proceeds by first locating nucleotide sites that are variable within a small set of chromosomes and then typing these identified SNPs from a larger sample of chromosomes. This process can lead to data sets that are enriched for SNP alleles that have intermediate frequencies.
Therefore, we invested most of our effort in the SNPs from the NIEHS project. The NIEHS SNP project detects SNPs via direct gene sequencing (Livingston et al., 2004) and this lessens concerns about ascertainment bias (Clark et al., 2005). We obtained SNP data for 612 genes from the NIEHS SNPs database (Livingston et al., 2004). These NIEHS data represented 33,862 intron SNPs, 921 sSNPs, and 959 nsSNPs. To integrate SNP and protein tertiary structure information, we then searched the Research Collaboratory for Structural Bioinformatics Protein Data Bank (RCSB-PDB) database (Berman et al., 2000) for protein tertiary structures with amino acid sequences that are similar to those of the genes in the NIEHS data set. We did this by using the default options of BLAST (Altschul et al., 1997), except internal gaps were not permitted. We retained the protein structures that yielded the top match and kept only DNA sequences that were at least 200 nucleotides long. All retained protein structures had sequences with BLAST E-values that were 4 × 10-11 or lower. The resulting data set consists of genes with DNA sequences and estimated frequencies for both alleles at each SNP locus. Each SNP locus also has an accompanying reference tertiary structure. There are a total of 140 nonsynonymous SNPs from 72 genes in the data set. Among the 140 nsSNPs, the average percentage amino acid identity between the human gene and the PDB reference structure was 91%, but these values ranged from 28% to 100%.
2.2 Parameter Estimation
2.2.1 Dependent-sites model of protein-coding DNA sequence evolution
We briefly outline the dependent-sites model of protein-coding DNA sequence evolution (Robinson et al., 2003) and its population genetic interpretation (Thorne et al., 2007; see also Halpern and Bruno, 1998; Nielsen and Yang, 2003; Berg et al., 2004; Mustonen and Lässig, 2005; Sella and Hirsh, 2005). Subsequently, we employ this interpretation to consider the probability of an allele being ancestral.
The dependent-sites model explicitly takes tertiary structure into account to relax the assumption that each site evolves independently (see Robinson et al., 2003). Consider DNA sequences that are denoted i and j. When i and j differ at more than one site or when j encodes a premature stop codon, the rate of change from i to j is set to 0. For sequences i and j that differ only at a site where j has nucleotide type h, the instantaneous rate Rij of change from i to j is
| (1) |
The π parameters allow mutations to the four nucleotide types to not be equally likely. Transitions and transversions can happen at different rates due to the parameter κ. The overall rate of change is scaled through the parameter u. The treatment of nonsynonymous substitutions involves three additional parameters: ω to capture contributions to nonsynonymous rates that are external to the protein under analysis, and fs and fp to capture the effects of tertiary structure. The fs parameter incorporates solvent accessibility effects while fp reflects pairwise amino acid interactions. We adopt the sequence-structure compatibility system of Jone et al. (1992). We respectively use Es(i) and Ep(i) to represent solvent accessibility compatibility and pairwise interaction compatibility. Lower scores of Es(i) and Ep(i) are better in terms of sequence-structure compatibility. A biologically plausible scenario is the case where fs and fp both are positive. The model reduces to a conventional codon model that ignores protein structure (e.g., Goldman and Yang, 1994; Muse and Gaut, 1994) if fs and fp are both zero. Sequence i has stationary probability
| (2) |
where im (kn) is the nucleotide type at position m (n) in DNA sequence i (k) and the sum in the denominator is over all possible sequences k of length M that lack a premature stop codon.
2.2.2 Population genetic interpretation of phenotypic impact parameters
Statistical procedures for inferring phylogenies and characterizing interspecific evolution tend not to be explicitly connected to population genetics despite the fact that evolution happens at the population level. Thorne et al. (2007) placed a population genetic interpretation upon phenotypic impact parameters of the dependent-sites model (e.g., fs and fp) by extending the pioneering work of Halpern and Bruno (1998). The interpretation relies upon the assumption of a very low mutation rate. It also assumes there is a diploid organism with constant effective population size N and with a multiplicative relative fitness scheme where s is the selection coefficient. For alleles i and j, the genotype fitnesses are: ωii = 1 , ωij = 1 + s, and ωjj = (1 + s)2. Parameters of the dependent-sites model can then be related to population genetics as follows:
| (3) |
For data sets consisting of single sequences, estimates of 2Ns that are identical to those above arise when employing a slightly different parameterization of evolutionary rates that more directly incorporates relative fitnesses (Thorne et al., 2007).
2.2.3 Probability of an allele being ancestral under selection
Fearnhead (2002) and Taylor (2007) give rigorous mathematical treatments of the probability that an allele is ancestral with selection. Fearnhead (2002) leverages the ancestral selection graph technique (Krone and Neuhauser, 1997) to find the stationary distribution of the common ancestral type of a sample of genes with consideration of a non-neutral population genetics model. Taylor (2007) uses the structured coalescent process (Kaplan et al., 1988) to characterize the common ancestor process for Wright-Fisher diffusion models, and then analytically calculates the stationary distribution of the common ancestral type for a two-allele model. The above two methods of finding the stationary probability of a common ancestor are more general than that described here.
We consider a gene that has been evolving according to the dependent-sites model. Mutations are assumed to be rare enough that the gene is usually monomorphic within a population. This low mutation assumption could be especially problematic for SNPs located in mutation hotspots. When the gene is polymorphic, the low mutation rate means that the only case that has a non-negligible probability is the one where a single point mutation event has yielded a single biallelic SNP site. We refer to the two segregating allele types as i and j and their frequencies within the population will be ρi and ρj. We use the same multiplicative relative fitness scheme as employed earlier in Section 2.2.2: ωii = 1, ωij = 1 + s, and ωjj = (1 + s)2. Note that allele j is selectively advantageous compared to allele i when s is positive.
We sample the SNP site in a time period where only allele types i and j are segregating. We therefore consider only time intervals that begin with a new mutant allele of type i or j being introduced into a population of the other allele type and that end with the new mutant allele either being lost or fixed. We refer to such a time interval as a polymorphic episode involving i and j. We wish to calculate the probability that allele type i is ancestral conditional upon ρi where O < ρi < 1 and ρj = 1 - ρi. Because of our sampling scheme and the low mutation rate, this probability is unaffected by a simplification to the dependent-sites model that permits only allele types i or j by forcing all mutation rates not involving i and j to be zero. This simplification alters the stationary distribution of allele types i and j but does not change their relative stationary probabilities or the behavior of allele frequencies within polymorphic episodes involving i and j.
Embedded within the continuous time process defined by the simplified dependent-sites model is a discrete time stochastic process that is observed exclusively when the frequency of allele i is ρi. The time T of this embedded process (T ∈ {0, 1, 2, . . .}) would therefore be the Tth occasion that allele i has reached frequency ρi during the continuous process. At time T of the discrete process, we set Xρi(T) equal to the ancestral allele type (i.e., i or j). We define αρi(T) to be a random variable that is 1 if the embedded stochastic process has T and T + 1 occuring during the same polymorphic episode. Otherwise, αρi(T) is 0.
If T and T + 1 occur during the same polymorphic episode, the ancestral allele type must be the same for T and T + 1. Given that allele i has frequency ρi, rρi is used to represent the probability that allele i has frequency ρi again at some later time within the same polymorphic episode. The Markov property of changes in allele frequency over (continuous) time means that, conditional upon the frequency of allele i being ρi, the future allele frequencies within a polymorphic episode are independent of the ancestral type. Therefore,
We denote Zi(a → b) as the probability that allele i later reaches frequency b in the current polymorphic episode given that its current frequency is a. For frequency ρi, Zi(ρi → 1) is the probability that i is fixed and Zi(ρi → 0) is the probability that i is lost. Because fixation of i means i will be ancestral at the next time i has frequency ρi and because loss of i means j will be ancestral when i next has frequency ρi,
By summing over the possible values of αρi(T), the transition probabilities relating Xρi(T + 1) and Xρi(T) are obtained (see Figure 1). The two stationary probabilities for this two-state discrete Markov chain represent the desired probabilities that the two allele types are ancestral conditional upon allele frequency i being ρi. Letting A represent the ancestral allele type, the stationary probabilities are:
The probability Pr(A = i|ρi) is, interestingly, the same as the probability that allele i eventually gets fixed given its contemporary allele frequency ρi (see also Taylor, 2007, for a more rigorous mathematical treatment). This result connects prospective and retrospective applications of population genetics.
Figure 1. A two-state Markov chain for allele ancestry.

Each time allele type I has frequency ρ and allele type J has frequency 1 - ρ, the ancestral allele type is recorded. The resulting series of ancestral allele types can be described by a two-state Markov chain with transition probabilities that can be obtained by summing the probabilities associated with the arrows that are depicted.
The diffusion fixation approximation of Kimura (1962) permits Pr(A = i|ρi) and Pr(A = j|ρi) to be written as
| (4) |
| (5) |
We obtain these results by assuming s is small enough that 1 - e-2s ≐ -(1 - e2s). We can replace Equations (4) and (5) with a single expression by having ρ and 1 be the frequency and relative fitness of a SNP allele of interest and by having 1 + s be the relative fitness of the other SNP allele. With this notation, the probability that the SNP allele of interest is ancestral would be approximated by
| (6) |
The population genetic interpretation of the dependent-sites model (see eq. 3) allows inferred values of fS and fp to be converted to an estimate of Ns. The Ns estimates together with allele frequencies from SNP data can then provide estimates of probabilities of allele ancestry (see eq. 4 and 5). When estimating ancestry probabilities in this way, one would ideally account for uncertainty in the fs, fp, and allele frequency estimates. For the results reported here, we do not add this level of complexity. Instead, we follow the protocol of Choi et al. (2007) to obtain posterior mean estimates of fs and fp. Also, we use sample proportions of SNP alleles as estimates of their population proportions.
3 Results and Discussion
3.1 The frequency of an allele versus its probability of ancestry
To empirically investigate the relationship between the frequency of an allele and its probability of ancestry, we binned all African HapMap intron SNPs with similar minor allele frequencies together. We separately binned together the African nsSNPs with similar minor allele frequencies. Despite the ascertainment bias of the HapMap data, HapMap loci with a low frequency for their minor allele are more common than loci with minor alleles that have a more intermediate frequency (e.g., the median minor allele frequency was 0.15 among African nsSNPs). We elected to bin SNPs by trying to assign an approximately equal number to each bin. This results in a wider range of minor allele frequencies for the bins with relatively common minor alleles than for those with comparatively rare minor alleles. Under neutrality, points should be near the dashed line of Figure 2A.
Figure 2. The empirical frequency of minor alleles that are ancestral plotted against minor allele frequencies.

Solid circles are for intron SNPs, and open circles are for non-synonymous SNPs. The dashed line represents the neutral prediction. Error bars extend twice the estimated standard deviation above and below the circles. Because uncertainty in estimates of allele frequencies is ignored, the estimated standard deviation for bin c is √Pc(1 - Pc)/nc where Pc is the frequency of ancestral alleles among SNPs in bin c and where nc is the number of SNPs grouped in bin c. (A) The International HapMap data of African ethnicity and (B) NIEHS data.
For SNP frequencies in the 0.2 to 0.5 range, the data do seem to approximately follow this neutral line. However, the frequency with which the minor allele is ancestral is higher than the neutral expectation for minor allele frequencies that are less than 0.2 and the difference is more pronounced for intron SNPs than for nsSNPs. The deviation from the neutral line is much larger in European and Asian populations (data not shown). The Chimpanzee Sequencing and Analysis Consortium (2005) listed several possibilities for why this deviation might occur. The possibilities include incorrect ancestral allele assignments, bottlenecks during human evolution, and selective sweeps. We do not attempt to distinguish between the possibilities here. Instead, we emphasize that the y-axis values in Figure 2A tend to be lower for nsSNPs than intron SNPs. This may be a result of purifying selection. Slightly different interrogations of human SNP data have arrived in similar conclusions (e.g., Cargill et al., 1999; Chen and Rajewsky, 2006).
Because it has less ascertainment bias, the NIEHS data has a much higher proportion than the HapMap data of SNP loci with minor allele frequencies that are close to zero. For example, the median minor allele frequency of NIEHS SNPs was about 0.01. Figure 2B shows a plot of ancestral allele frequencies derived from the NIEHS data. This plot also exhibits lower y-axis values for nsSNPs than intron SNPs. We also examined the sSNP patterns for the African HapMap and NIEHS data. The sSNP behavior seems similar to the intron SNP patterns (data not shown), except that the differences plotted on the y-axis had larger confidence intervals than for the intron SNPs because the intron SNPs were more numerous.
3.2 Fitness and allele ancestry
We reasoned that ancestry of nsSNPs might be better inferred by considering natural selection due to protein structure. We used the 140 human nsSNPs with associated protein structure to infer the 2Ns values for each pair of ancestral and derived alleles. This was done by setting the relative fitness of the derived allele to 1 + s and the relative fitness of the ancestral allele to 1. Although these 140 SNPs represent only 72 genes, we treated all 140 SNPs independently and ignored any possible interaction between polymorphic sites. The dependent-sites model is well-suited to handling interactions between sites but to properly consider interactions between polymorphic sites in evolution, we would need haplotype information about which nucleotides at one polymorphic site are associated with which nucleotide types at each other site.
We classified the ancestral allele at each of the 140 NIEHS nsSNPs by whether it is the major frequency allele and by whether it has higher estimated fitness. We further subdivided this classification by comparing the nsSNP to the reference protein structure. Usually, either the major or minor allele at the polymorphic codon encodes the amino acid type found at the corresponding location in the reference tertiary structure but sometimes the reference tertiary structure has neither amino acid type. The categorical summary of our 140 nsSNPs is shown in Table 1.
Table 1. Counts of SNPs categorized according to allele ancestry, relative fitness, and reference structure.
The reference structure column refers to whether the amino acid in the reference tertiary structure matches the amino acid encoded by the non-synonymous polymorphism in the derived allele, ancestral allele, or neither allele. Calculations use 1 + s for relative fitness of derived allele and 1 for relative fitness of ancestral allele. Numbers in parentheses are the sum of the count for the ancestral allele having higher fitness and the count for the derived allele having higher fitness.
| Reference structure | Higher fitness allele | Ancestral major allele | Derived major allele | Total |
|---|---|---|---|---|
| ancestral | ancestral derived |
77 (108) 31 |
2 (3) 1 |
79 (111) 32 |
| derived | ancestral derived |
2 (6) 4 |
3 (5) 2 |
5 (11) 6 |
| neither | ancestral derived |
12 (17) 5 |
1 (1) 0 |
13 (18) 5 |
| 131 | 9 | 140 |
For 97 of 140 nsSNPs, the ancestral allele was assessed to be selectively more advantageous than the derived one. The proportion of ancestral alleles with higher fitness is significantly greater than 0.5 (P-value less than 0.001) and supports the idea that derived alleles may have lower fitness on average because they are often selectively deleterious variants that are unlikely to be fixed in the population. If this idea is correct, the selective advantage of the ancestral alleles might tend to be smaller when the derived alleles have reached relatively high frequencies. We found no statistical support for such a relationship.
Figure 3 plots the inferred 2Ns values versus derived allele frequencies with data points colored according to whether the amino acid type of the reference tertiary structure matched the amino acid encoded by the polymorphic codon in the ancestral, derived, or neither allele. It is clear that matching is more likely for derived alleles with high frequency than for derived alleles with low frequency (Figure 3). It seems reasonable that common alleles might be more likely to be selected for experimental determination of protein tertiary structure. Although tertiary structure tends to change slowly (Chothia and Lesk, 1986; Flores et al., 1993; Russell et al., 1997), it does evolve. Therefore, the assumption by the dependent-sites model that tertiary structure is invariant is flawed. This means that the 2Ns estimates might be influenced by the reference structures. The degree of this influence is difficult to assess from our data set of 140 nsSNPs because of the strong correlation between which allele is ancestral and which matches the reference structure. A bigger data set might allow the effect of reference structure on 2Ns estimates to be quantified.
Figure 3. Scatter plot of derived allele frequency versus scaled selection coefficient.
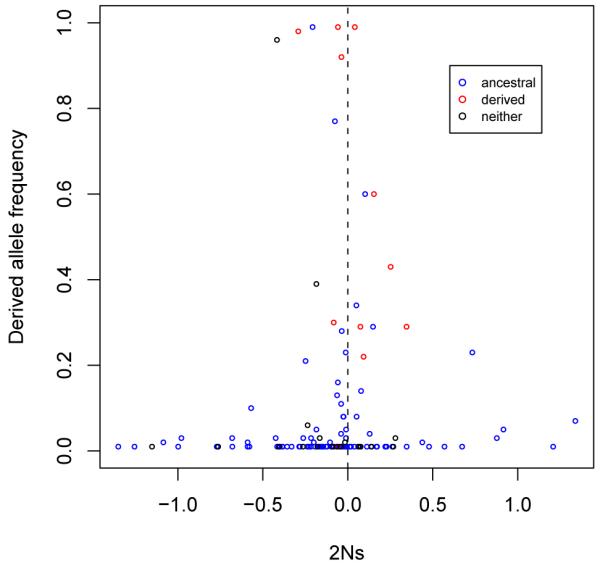
By setting the relative fitness of a derived allele to 1 + s and that of an ancestral allele to 1, 2Ns estimates are plotted against derived allele frequency. Amino acid residues of SNP sites in protein structures can agree with ancestral allele (blue), or derived allele (red), or neither of them (black).
There are six nsSNPs for which the major allele was ancestral but for which the derived/minor allele matched the reference structure. Four of these six nsSNPs have positive 2Ns estimates and all six exceed the mean 2Ns estimate for the 108 nsSNPs that have the ancestral allele being the major allele and matching the reference structure. However, we do not think these 6 nsSNPs are evidence for a strong effect of the reference structure. Five of these 6 nsSNPs have minor allele frequencies in the 0.2 to 0.5 range. Other nsSNPs in this relatively high minor allele frequency range also seem prone to have positive 2Ns values (Figure 3). As further evidence against a strong reference structure effect on relative fitness estimates, there are 17 loci where the major allele is ancestral but where the reference structure matches neither major nor minor allele. The average 2Ns estimate among these 17 loci is actually slightly less than that for the 108 loci that have ancestral allele being the major allele and matching the reference structure.
Figure 3 shows that 6 of the 7 derived alleles with highest frequency also have a negative 2Ns estimate. Although these 2Ns estimates are not too far from zero, this pattern is still contrary to what might be expected. It is unclear what might be responsible for this pattern but we note that failure of our parsimony procedure to correctly assign ancestral states could be responsible.
The average minor allele frequency of the 140 loci was about 0.052. Thus, the neutral evolution prediction would be that about 140 × 0.052 ≐ 7 minor alleles would be ancestral. This is close to the actual number of 9 SNPs with minor alleles that are judged to be ancestral by comparison with the chimpanzee genome. Among the 131 loci that have major alleles that are ancestral, the major alleles are selectively more advantageous in about 2/3 (91) of them. For the 9 SNPs with a minor allele that is ancestral, minor alleles are more advantageous for 6 SNPs. We constructed a contingency table with two rows and two columns. Loci were assigned to rows according to whether the major allele or the minor allele had a higher estimated fitness. Loci were assigned to columns according to whether the major or the minor allele was ancestral. For an alternative hypothesis that ancestral alleles usually have higher fitness than derived alleles, Fisher’s Exact test yielded a P-value of 0.035. These results again seem to be weak empirical support for the idea that ancestral alleles tend to have higher fitness.
None of the 140 estimates of 2Ns are very far from zero. Even though natural selection tends to eliminate fitness variation, we view these estimates with a mix of skepticism and interest. Earlier, we investigated the 2Ns distribution of possible nonsynonymous mutations with this population genetic perspective of the dependent-sites model (Thorne et al., 2007). We concluded that the distribution had a variance that was too small and a mean that was too big. This discrepancy between the 2Ns distribution and biological expectations was mostly attributed to the failure of the dependent-sites model to treat some potential nonsynonymous mutations as being moderately or extremely deleterious.
We believe the relative rankings of our 2Ns estimates are likely to be more reliable than the specific values of these estimates. Overly simplistic population genetic assumptions such as constant population size and low mutation rate were made to obtain the 2Ns estimates, but violation of these assumptions is more likely to affect the values of the 2Ns estimates than their relative rankings. However, even the rankings of the estimates could be made more accurate by improving the dependent-sites model. Improved treatments of protein evolution are being developed (Rodrigue et al., 2005, 2006) as are improved measures of sequence-structure compatibility (Kleinman et al., 2006).
3.3 Fitnesses of nonsynonymous mutations relative to derived allele
For each of the 140 SNP loci, we calculated the proportion of possible nonsynonymous mutations to the ancestral sequence that are more deleterious than the actual derived allele. These proportions are plotted versus the derived allele frequency in Figure 4. Because derived alleles have been subject to natural selection and therefore do not represent a random sample of non-synonymous mutations, we expected the majority of these 140 proportions to substantially exceed 0.5. We were therefore surprised to find that the average of the 140 proportions is only about 0.525. This average is much closer to 0.5 than we had expected.
Figure 4. Scatter plot of the proportion of possible non-synonymous changes to ancestral alleles that are more deleterious than actual derived allele versus derived allele frequency.
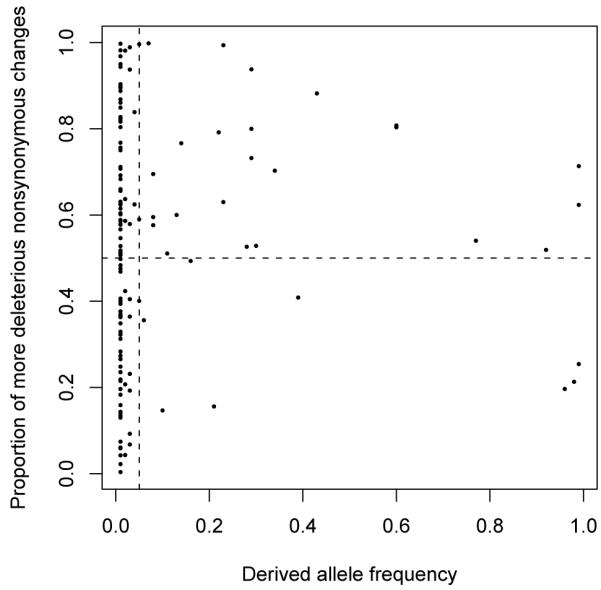
The horizontal dashed line is drawn at 0.5, and the vertical dashed line is at 0.05.
Visual inspection of the plot in Figure 4 helps to explain why the average proportion is only slightly bigger than 0.5. Most derived allele frequencies in the NIEHS data are close to 0. These rare minor alleles are likely to be the product of relatively recent mutation events and may not have had much time for natural selection to act upon them. As a result, the low frequency derived alleles may be closer to a random sample of nonsynonymous mutations than are the derived alleles of higher frequency.
The 109 loci with derived allele frequencies that are less than or equal to 0.05 were placed into one group and the remaining 31 loci were placed into another group. Among the 101 loci in the low frequency group, the average proportion of nonsynonymous mutations that are more deleterious than the actual derived allele is about 0.505 and the median is about 0.514. For the high frequency group, the average proportion is about 0.597 and the median is about 0.600. A one-sided t-test reveals that the mean proportion for high frequency derived alleles exceeds the mean proportion for low frequency derived alleles (P-value ≐ 0.021). Because we formed our hypotheses only after inspecting the data, this P-value should be interpreted with caution. However, the reasoning that rare derived alleles should differ less from the distribution of possible nonsynonymous mutations than more common derived alleles seems to us to be plausible, especially for species such as humans that have been experiencing recent population expansions.
3.4 Retrospective evaluation of scaled selection coefficient estimates
Estimated values of 2Ns and allele frequencies can be used to infer the probability of allele ancestry (see eq. 6). Let ps(i) be the probability that the minor allele of locus i is ancestral conditional upon the 2Ns estimate for locus i. and its allele frequency. Let δi = 1 if the minor allele is ancestral according to the chimpanzee outgroup comparison and let δi = 0 if the major allele is ancestral. Assuming all SNP loci can be treated independently, the likelihood for our 140 SNP data set is the product of densities for 140 Bernoulli random variables. This likelihood can be written as
A similar likelihood can be constructed for the model that SNP variation is selectively neutral except that ps(i) is replaced by p0(i) where p0(i) would be the minor allele frequency and would represent the probability that the minor allele is ancestral if the SNP variation is neutral. We computed the likelihood ratio of the selection and neutral model,
and obtained a log-likelihood ratio of about -33.15 - (-33.56) ≐ 0.51. The fact that the likelihood for the selection model is only slightly bigger than the one for the neutral model indicates that incorporating natural selection did not provide much benefit for predicting allele ancestry.
Because our 2Ns estimates for most of the 140 SNPs were close to 0 and because most minor alleles had very low frequencies, failure to substantially improve ancestral allele predictions by incorporating natural selection is not surprising. The correlation coefficient between the ps(i) and p0(i) values was about 0.979 for the 140 SNPs. In Figure 5, the probability that an allele is ancestral with selection (i.e., the ps(i) values) are plotted on the y-axis versus the minor allele frequencies (i.e., the p0(i) values). The fact that the points in Figure 5 tend to fall near the y = x line shows that the minor allele frequencies have a strong influence on the ps(i) values whereas the 2Ns values have less of an impact.
Figure 5. Scatter plot of estimated probability of minor allele being ancestral versus minor allele frequency.
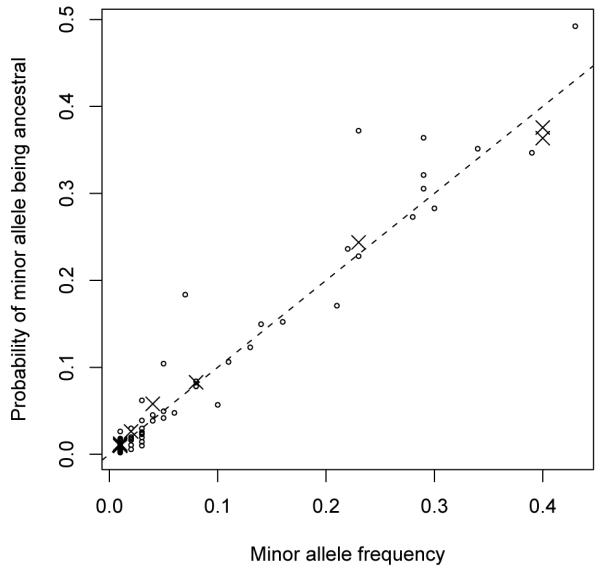
Ancestral probabilities are inferred by accounting for selection due to protein structure. Circles are for SNPs with major alleles that are ancestral to minor ones, and cross marks are for SNPs with minor alleles that are ancestral to major ones. The dashed diagonal line indicates the expectation under neutrality.
3.5 Conclusion
Although we have stressed the inadequacies of our 2Ns estimates, there are promising and straightforward directions for future improvement. We strongly believe that the computational efforts to predict phenotype by genotype should be paralleled by efforts to predict fitness from phenotype. In addition to studying the impact of protein tertiary structure on evolution, there may be prospects for examining fitness effects of SNPs in gene regulatory regions. Computational systems for predicting the effect of a regulation sequence change on gene expression are being developed (e.g., Stepanova et al., 2006). Likewise, fitness effects of SNPs that act at the RNA secondary structure level could also be examined (see Yu and Thorne, 2006; Thorne et al., 2007).
The connection between a genotype and its relative fitness has traditionally been treated by the population genetic field as a “black box.” The usual practice is to simply to represent the relative fitness of a genotype by a free parameter that can in theory be estimated. This treatment can seriously hamper understanding of the underlying biological sources for fitness differences. The mapping of phenotype to fitness should be just as central to biology as is the mapping of genotype to phenotype.
Acknowledgments
J. Thorne and especially H. Kishino would like to thank Masami Hasegawa for the strong and positive influence that he has had on their careers and on the field of molecular evolution. We thank Philip Awadalla, Kate McGee, Asger Hobolth, Benjamin Redelings, and Reed Cartwright for their help. S.C.C. and J.L.T. were supported by NSF grant DEB-0445180 and by NIH grant GM070806. H.K. was supported by JSPS Grants-in-Aid for Scientific Research (B) 19300094.
Abbreviations
- SNP
single nucleotide polymorphism
- sSNP
synonymous single nucleotide polymorphism
- nsSNP
nonsynonymous single nucleotide polymorphism
Footnotes
Submission Type: Special Issue (Hasegawa - Phylogenomics)
Publisher's Disclaimer: This is a PDF file of an unedited manuscript that has been accepted for publication. As a service to our customers we are providing this early version of the manuscript. The manuscript will undergo copyediting, typesetting, and review of the resulting proof before it is published in its final citable form. Please note that during the production process errors may be discovered which could affect the content, and all legal disclaimers that apply to the journal pertain.
References
- Altschul SF, Madden TL, Schäffer AA, Zhang J, Zhang Z, Miller W, Lipman DJ. Gapped BLAST and PSI-BLAST: a new generation of protein database search programs. Nucleic Acids Res. 1997;25:3389–3402. doi: 10.1093/nar/25.17.3389. [DOI] [PMC free article] [PubMed] [Google Scholar]
- Berg J, Willmann S, Lässig M. Adaptive evolution of transcription factor binding sites. BMC Evol Biol. 2004;4:42. doi: 10.1186/1471-2148-4-42. [DOI] [PMC free article] [PubMed] [Google Scholar]
- Berman HM, Westbrook J, Feng Z, Gilliland G, Bhat TN, Weissig H, Shindyalov IN, Bourne PE. The Protein Data Bank. Nucleic Acids Res. 2000;28:235–242. doi: 10.1093/nar/28.1.235. [DOI] [PMC free article] [PubMed] [Google Scholar]
- Cargill M, Altshuler D, Ireland J, Sklar P, Ardlie K, Patil N, Shaw N, Lane CR, Lim EP, Kalyanaraman N, Nemesh J, Ziaugra L, Friedland L, Rolfe A, Warrington J, Lipshutz R, Daley GQ, Lander ES. Characterization of single-nucleotide polymorphisms in coding regions of human genes. Nat Genet. 1999;22:231–238. doi: 10.1038/10290. [DOI] [PubMed] [Google Scholar]
- Chasman D, Adams RM. Predicting the functional consequences of non-synonymous single nucleotide polymorphisms: structure-based assessment of amino acid variation. J Mol Biol. 2001;307:683–706. doi: 10.1006/jmbi.2001.4510. [DOI] [PubMed] [Google Scholar]
- Chen K, Rajewsky N. Natural selection on human microRNA binding sites inferred from SNP data. Nat Genet. 2006;38:1452–1456. doi: 10.1038/ng1910. [DOI] [PubMed] [Google Scholar]
- Chimpanzee Sequencing and Analysis Consortium Initial sequence of the chimpanzee genome and comparison with the human genome. Nature. 2005;437:69–87. doi: 10.1038/nature04072. [DOI] [PubMed] [Google Scholar]
- Choi SC, Hobolth A, Robinson DM, Kishino H, Thorne JL. Quantifying the impact of protein tertiary structure on molecular evolution. Mol Biol Evol. 2007;24:1769–1782. doi: 10.1093/molbev/msm097. [DOI] [PubMed] [Google Scholar]
- Chothia C, Lesk AM. The relation between the divergence of sequence and structure in proteins. EMBO J. 1986;5:823–826. doi: 10.1002/j.1460-2075.1986.tb04288.x. [DOI] [PMC free article] [PubMed] [Google Scholar]
- Clark AG, Hubisz MJ, Bustamante CD, Williamson SH, Nielsen R. Ascertainment bias in studies of human genome-wide polymorphism. Genome Res. 2005;15:1496–1502. doi: 10.1101/gr.4107905. [DOI] [PMC free article] [PubMed] [Google Scholar]
- Donnelly P, Kurtz T. Genealogical processes for Fleming-Viot models with selection and recombination. Ann Appl Probab. 1999;9:1091–1148. [Google Scholar]
- Fearnhead P. The common ancestor at a nonneutral locus. J Appl Probab. 2002;39:38–54. [Google Scholar]
- Felsenstein J. Inferring Phylogenies. Sinauer Associates, Inc.; 2004. pp. 67–69. chapter 6. [Google Scholar]
- Flores TP, Orengo CA, Moss DS, Thornton JM. Comparison of conformational characteristics in structurally similar protein pairs. Protein Sci. 1993;2:1811–1826. doi: 10.1002/pro.5560021104. [DOI] [PMC free article] [PubMed] [Google Scholar]
- Giardine B, Riemer C, Hardison RC, Burhans R, Elnitski L, Shah P, Zhang Y, Blankenberg D, Albert I, Taylor J, Miller W, Kent WJ, Nekrutenko A. Galaxy: a platform for interactive large-scale genome analysis. Genome Res. 2005;15:1451–1455. doi: 10.1101/gr.4086505. [DOI] [PMC free article] [PubMed] [Google Scholar]
- Goldman N, Yang Z. A codon-based model of nucleotide substitution for protein-coding DNA sequences. Mol Biol Evol. 1994;11:725–736. doi: 10.1093/oxfordjournals.molbev.a040153. [DOI] [PubMed] [Google Scholar]
- Halpern AL, Bruno WJ. Evolutionary distances for protein-coding sequences: modeling site-specific residue frequencies. Mol Biol Evol. 1998;15:910–917. doi: 10.1093/oxfordjournals.molbev.a025995. [DOI] [PubMed] [Google Scholar]
- Hernandez RD, Williamson SH, Bustamante CD. Context dependence, ancestral misidentification, and spurious signatures of natural selection. Mol Biol Evol. 2007;24:1792–1800. doi: 10.1093/molbev/msm108. [DOI] [PubMed] [Google Scholar]
- Hughes AL, Packer B, Welch R, Bergen AW, Chanock SJ, Yeager M. Widespread purifying selection at polymorphic sites in human protein-coding loci. Proc Natl Acad Sci USA. 2003;100:15754–15757. doi: 10.1073/pnas.2536718100. [DOI] [PMC free article] [PubMed] [Google Scholar]
- Jones DT, Taylor WR, Thornton JM. A new approach to protein fold recognition. Nature. 1992;358:86–89. doi: 10.1038/358086a0. [DOI] [PubMed] [Google Scholar]
- Kaplan NL, Darden T, Hudson RR. The coalescent process in models with selection. Genetics. 1988;120:819–829. doi: 10.1093/genetics/120.3.819. [DOI] [PMC free article] [PubMed] [Google Scholar]
- Kimura M. On the probability of fixation of mutant genes in a population. Genetics. 1962;47:713–719. doi: 10.1093/genetics/47.6.713. [DOI] [PMC free article] [PubMed] [Google Scholar]
- Kleinman CL, Rodrigue N, Bonnard C, Philippe H, Lartillot N. A maximum likelihood framework for protein design. BMC Bioinformatics. 2006;7:326. doi: 10.1186/1471-2105-7-326. [DOI] [PMC free article] [PubMed] [Google Scholar]
- Krishnan VG, Westhead DR. A comparative study of machine-learning methods to predict the effects of single nucleotide polymorphisms on protein function. Bioinformatics. 2003;19:2199–2209. doi: 10.1093/bioinformatics/btg297. [DOI] [PubMed] [Google Scholar]
- Krone S, Neuhauser C. Ancestral processes with selection. Theor Popul Biol. 1997;51:210–237. doi: 10.1006/tpbi.1997.1299. [DOI] [PubMed] [Google Scholar]
- Livingston RJ, von Niederhausern A, Jegga AG, Crawford DC, Carlson CS, Rieder MJ, Gowrisankar S, Aronow BJ, Weiss RB, Nickerson DA. Pattern of sequence variation across 213 environmental response genes. Genome Res. 2004;14:1821–1831. doi: 10.1101/gr.2730004. [DOI] [PMC free article] [PubMed] [Google Scholar]
- Muse SV, Gaut BS. A likelihood approach for comparing synonymous and nonsynonymous nucleotide substitution rates with application to the chloroplast genome. Mol Biol Evol. 1994;11:715–724. doi: 10.1093/oxfordjournals.molbev.a040152. [DOI] [PubMed] [Google Scholar]
- Mustonen V, Lässig M. Evolutionary population genetics of promoters: predicting binding sites and functional phylogenies. Proc Natl Acad Sci USA. 2005;102:15936–15941. doi: 10.1073/pnas.0505537102. [DOI] [PMC free article] [PubMed] [Google Scholar]
- Nielsen R, Signorovitch J. Correcting for ascertainment biases when analyzing SNP data: applications to the estimation of linkage disequilibrium. Theor Popul Biol. 2003;63:245–255. doi: 10.1016/s0040-5809(03)00005-4. [DOI] [PubMed] [Google Scholar]
- Nielsen R, Yang Z. Estimating the distribution of selection coefficients from phylogenetic data with applications to mitochondrial and viral DNA. Mol Biol Evol. 2003;20:1231–1239. doi: 10.1093/molbev/msg147. [DOI] [PubMed] [Google Scholar]
- Ramensky V, Bork P, Sunyaev S. Human non-synonymous SNPs: server and survey. Nucleic Acids Res. 2002;30:3894–3900. doi: 10.1093/nar/gkf493. [DOI] [PMC free article] [PubMed] [Google Scholar]
- Robinson DM, Jones DT, Kishino H, Goldman N, Thorne JL. Protein evolution with dependence among codons due to tertiary structure. Mol Biol Evol. 2003;20:1692–1704. doi: 10.1093/molbev/msg184. [DOI] [PubMed] [Google Scholar]
- Rodrigue N, Lartillot N, Bryant D, Philippe H. Site interdependence attributed to tertiary structure in amino acid sequence evolution. Gene. 2005;347:207–217. doi: 10.1016/j.gene.2004.12.011. [DOI] [PubMed] [Google Scholar]
- Rodrigue N, Philippe H, Lartillot N. Assessing site-interdependent phylogenetic models of sequence evolution. Mol Biol Evol. 2006;23:1762–1775. doi: 10.1093/molbev/msl041. [DOI] [PubMed] [Google Scholar]
- Russell RB, Saqi MA, Sayle RA, Bates PA, Sternberg MJ. Recognition of analogous and homologous protein folds: analysis of sequence and structure conservation. J Mol Biol. 1997;269:423–439. doi: 10.1006/jmbi.1997.1019. [DOI] [PubMed] [Google Scholar]
- Sella G, Hirsh AE. The application of statistical physics to evolutionary biology. Proc Natl Acad Sci USA. 2005;102:9541–9546. doi: 10.1073/pnas.0501865102. [DOI] [PMC free article] [PubMed] [Google Scholar]
- Sherry ST, Ward MH, Kholodov M, Baker J, Phan L, Smigielski EM, Sirotkin K. dbSNP: the NCBI database of genetic variation. Nucleic Acids Res. 2001;29:308–311. doi: 10.1093/nar/29.1.308. [DOI] [PMC free article] [PubMed] [Google Scholar]
- Slade PF. Most recent common ancestor probability distributions in gene genealogies under selection. Theor Popul Biol. 2000;58:291–305. doi: 10.1006/tpbi.2000.1488. [DOI] [PubMed] [Google Scholar]
- Stepanova M, Tiazhelova T, Skoblov M, Baranova A. Potential regulatory SNPs in promoters of human genes: a systematic approach. Mol Cell Probes. 2006;20:348–358. doi: 10.1016/j.mcp.2006.03.007. [DOI] [PubMed] [Google Scholar]
- Stone EA, Sidow A. Physicochemical constraint violation by missense substitutions mediates impairment of protein function and disease severity. Genome Res. 2005;15:978–986. doi: 10.1101/gr.3804205. [DOI] [PMC free article] [PubMed] [Google Scholar]
- Sunyaev S, Lathe W, Bork P. Integration of genome data and protein structures: prediction of protein folds, protein interactions and “molecular phenotypes” of single nucleotide polymorphisms. Curr Opin Struct Biol. 2001a;11:125–130. doi: 10.1016/s0959-440x(00)00175-5. [DOI] [PubMed] [Google Scholar]
- Sunyaev S, Ramensky V, Koch I, Lathe W, Kondrashov AS, Bork P. Prediction of deleterious human alleles. Hum Mol Genet. 2001b;10:591–597. doi: 10.1093/hmg/10.6.591. [DOI] [PubMed] [Google Scholar]
- Taylor JE. The common ancestor process for a Wright-Fisher diffusion. Electron J Probab. 2007;12:808–847. [Google Scholar]
- The International HapMap Consortium A haplotype map of the human genome. Nature. 2005;437:1299–1320. doi: 10.1038/nature04226. [DOI] [PMC free article] [PubMed] [Google Scholar]
- Thomas DJ, Trumbower H, Kern AD, Rhead BL, Kuhn RM, Haussler D, Kent WJ. Variation resources at UC Santa Cruz. Nucleic Acids Res. 2007;35:D716–20. doi: 10.1093/nar/gkl953. [DOI] [PMC free article] [PubMed] [Google Scholar]
- Thorne JL, Choi SC, Yu J, Higgs PG, Kishino H. Population genetics without intraspecific data. Mol Biol Evol. 2007;24:1667–1677. doi: 10.1093/molbev/msm085. [DOI] [PubMed] [Google Scholar]
- Wang Z, Moult J. SNPs, protein structure, and disease. Hum Mutat. 2001;17:263–270. doi: 10.1002/humu.22. [DOI] [PubMed] [Google Scholar]
- Watterson GA, Guess HA. Is the most frequent allele the oldest? Theor Popul Biol. 1977;11:141–160. doi: 10.1016/0040-5809(77)90023-5. [DOI] [PubMed] [Google Scholar]
- Yang Z, Kumar S, Nei M. A new method of inference of ancestral nucleotide and amino acid sequences. Genetics. 1995;141:1641–1650. doi: 10.1093/genetics/141.4.1641. [DOI] [PMC free article] [PubMed] [Google Scholar]
- Yu J, Thorne JL. Dependence among sites in RNA evolution. Mol Biol Evol. 2006;23:1525–1537. doi: 10.1093/molbev/msl015. [DOI] [PubMed] [Google Scholar]
- Yue P, Li Z, Moult J. Loss of protein structure stability as a major causative factor in monogenic disease. J Mol Biol. 2005;353:459–473. doi: 10.1016/j.jmb.2005.08.020. [DOI] [PubMed] [Google Scholar]
- Yue P, Moult J. Identification and analysis of deleterious human SNPs. J Mol Biol. 2006;356:1263–1274. doi: 10.1016/j.jmb.2005.12.025. [DOI] [PubMed] [Google Scholar]