

Introduction
Electron microscopic (EM) tomography is proving useful for examining the organization of protein molecules in large molecular machines at critical neural sites, such as synapses. Methods are still in a state of flux, and many steps exist between a neuron and a molecular model of one of its synapses. Here, we show our approach for doing tomography on synaptic structure, hoping thereby to shed light generally on the emerging field of EM tomography. For a glossary of terms, see Table 1.
Table 1.
Glossary of terms
| High-pressure freezing | Method for freezing large volumes of tissue that depends on application of high pressures to prevent formation of ice crystals. |
| Freeze-substitution | Ice in frozen tissue is replaced with an organic solvent, thereby introducing stabilizing molecules and heavy metal stains into the tissue. |
| Fiducial marker | Gold particles applied to sections to aid fine alignment of a set of tilted images. |
| Projection angle | Complement of the angle between the specimen plane and the incoming electron beam. |
| Backprojection | Reverse of projection to yield a 3D reconstruction, or tomogram, from a set of tilted images. |
| Missing pyramid | Blind spot in two axis tomographic series attributable to limitations in tilt angle, leading to a loss of resolution in the final tomogram. |
| Tomogram | Computed 3D volume based on backprojections of all images from a tilt series. |
| Virtual section | Any individual section computed from a tomogram whose minimum thickness is one 3D pixel, or voxel. |
Much effort had been expended to understand the molecular basis of synaptic transmission and plasticity, primarily by electrophysiology and molecular techniques combined with advanced light microscopy (Okabe, 2007; Sheng and Hoogenraad, 2007; Chetkovich and Nicoll, 2008). However, understanding the molecular basis of synaptic transmission and plasticity requires understanding exactly how the proteins that make up the synapse are arranged, and this lies just out of reach of current light microscopy. Electron microscopy has the potential to pick the individual trees out of the forest, particularly using the emerging technique of EM tomography.
Tissues and cells to be examined by electron microscopy typically are embedded in plastic and sectioned thin enough for electrons to pass through them. Much of what we know about the detailed structure of synapses and other neural structures is derived from examination of thin plastic sections, the mainstay of electron microscopy for almost 50 years. The sizes of macromolecular assemblies essential for cellular physiology are typically in the nanometer range, i.e., too small to be resolved by light microscopy and often too large to be directly studied by high-resolution x-ray crystallography and nuclear magnetic resonance (NMR). Electron microscopy provides the resolution needed to fill this gap, but the depth of field of an electron microscope (order of a micrometer) far exceeds the thickness of a typical thin section, so images from different structures within the section are superimposed in the final image. It has long been understood that extending structural analysis to macromolecules substantially smaller than the thickness of the section is potentially fraught with errors attributable to the overlap of the many macromolecules contained within the section, as well as to unevenness in staining gradients through the thickness of the section.
Macromolecular and cellular structures overlapping within a thin section can, however, be sorted out and reconstructed by EM tomography (Figs. 1, 2A–C). Three-dimensional images of structures within a thin section are reconstructed from multiple electron micrographs of the same area collected at a wide variety of projection angles by backprojection and other algorithms (DeRosier and Klug, 1968; Crowther et al., 1970; Gilbert, 1972a). Virtual sections typically only 0.5–1.5 nm thick are derived from the final three-dimensional reconstruction and can provide virtual serial sections through a single large macromolecule, thereby eliminating the overlap problem that arises in traditional thin-section EM imaging. High-resolution images of structures within a thin section down to a few nanometers in size can then be rendered from the tomographic reconstructions by tracing these structures in consecutive virtual sections and eventually generating their three-dimensional representations. Thus, tomography potentially brings electron microscopy to the level of visualizing individual protein molecules and complexes in cells and may prove to be a powerful tool for dissecting macromolecular organization in neurons (Harlow et al., 2001; Lenzi et al., 2002; Siksou et al., 2007; Chen et al., 2008a). However, many technical problems first need to be overcome to realize the potential of EM tomography. This Toolbox discusses the current state of high-resolution tomography of complex systems, as illustrated with synapses.
Figure 1.
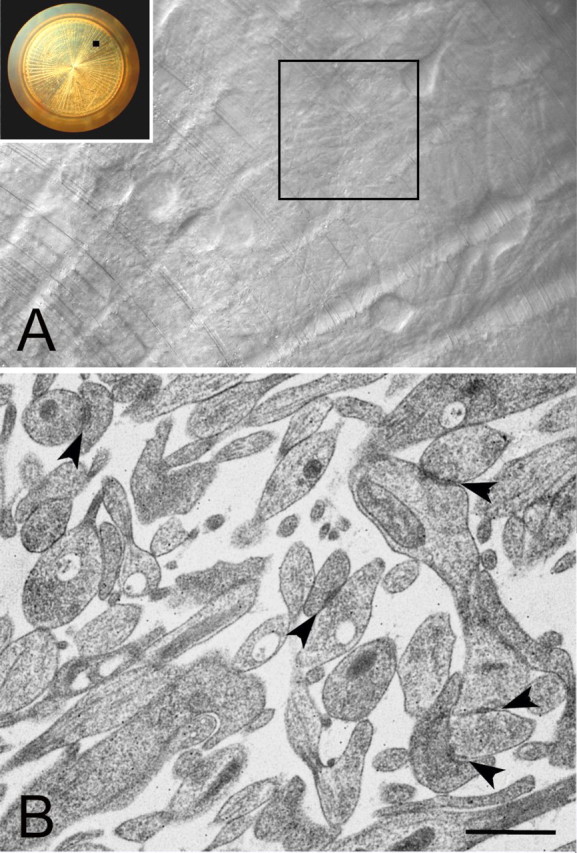
A, Dissociated rat hippocampal neurons grown for 3 weeks on a layer of glia in the 3 mm gold specimen carrier (inset) used for high-pressure freezing. An area of confluence of fine process from adjacent cell bodies on the specimen carrier (black square) is enclosed in corresponding large square on the right. It is in these areas that numerous synapses are found, as shown in B. Living cells on the gold specimen carrier are visualized by reflection microscopy. B, Examples of synapses with presynaptic vesicles, and postsynaptic densities (arrowheads) from neurons grown on gold specimen carrier and freeze-substituted. Many of these synapses are on spines. Scale bar, 1 μm.
Figure 2.
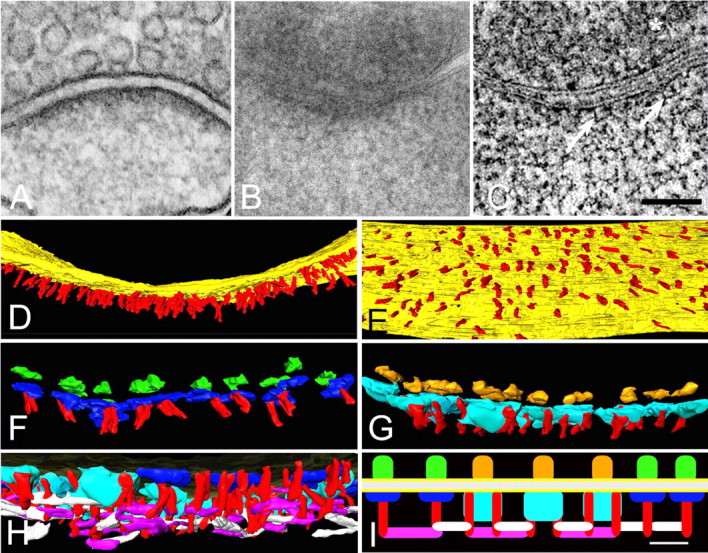
A, Synapse from section (80 nm thick) through a hippocampal culture prepared with conventional fixation and staining. Structural details in PSD are obscured. B, Sections (200 nm thick) typical of those used for tomography, through a dendritic spine from hippocampal culture prepared by freeze-substitution. Fine structural details are obscured by overlap within the section. C, Virtual sections (1.4 nm thick) derived from a tomographic reconstruction (tomogram) of synapse shown in B. Many fine structural details become apparent within the PSD, including vertical filaments 5–6 nm in diameter. The asterisk is over a synaptic vesicle. Scale bar, 100 nm. D, Rendering of the fine vertical filaments (red) from the tomogram. In the on-edge view of the PSD, it is apparent that the overlap of individual vertical filaments contributes to the typical thickened appearance of a PSD. Immunolabeling suggests that the vertical filaments contain PSD-95 (see text). E, Face-on view of the postsynaptic membrane (yellow) at a magnification similar to that in D, showing the regular distribution of the vertical filaments (red). F, On-edge view of the PSD at higher magnification in which one type of transmembrane structure at the PSD has been rendered in green on its cleft side and in blue on the cytoplasmic side of the post synaptic membrane. The size and distribution of these transmembrane structures is compatible with that of AMPARs and associated proteins. Most AMPAR-like structures are contacted by one vertical filament (red). G, Second type of transmembrane structure, rendered in gold on its cleft side and azure on its larger cytoplasmic side; this type of transmembrane structure is likely to represent NMDAR. NMDAR-type structures are typically contacted by two vertical filaments (red). H, Cross section of PSD slightly tilted away to reveal its cytoplasmic side. Two types of horizontal filament, rendered in purple and white, contact the vertical filaments (red) that, in turn, contact the two types of transmembrane structures (azure and blue). I, Diagram of the relationships of the two types of transmembrane proteins to the vertical filaments and, in turn, to the two types of horizontal filaments. The azure structures represent the cytoplasmic surfaces of NMDAR-like structures, and dark blue structures represent the AMPAR complexes, whereas the red vertical filaments are predominately PSD-95 family members. These filaments connect receptors to an orthogonal, interlinked scaffold at the core of the PSD. Adapted from Chen et al. (2008a) (with permission).
The traditional approach of preparing tissues for thin-section electron microscopy is to stabilize them with cross-linking fixatives. Methods that depend on initial fixation may not yield reliable results with labile structures or with soluble structures where fixatives could cross-link them to other structures. Furthermore, the slow diffusion characteristic of fixatives could allow molecular rearrangements and introduces physiological artifacts, such as inducing transmitter release (Smith and Reese, 1980). Traditional methods also depend on application of heavy metal stains to the section, which may stain structures near the surface more heavily than deeper ones. These problems can be avoided with methods that apply the stains en bloc, before the tissue is embedded. This approach has in fact produced some stunning successes for tomography using tissues prepared with cross-linking fixatives, which contained well organized structures as small as a few nanometers (Harlow et al., 2001).
Direct freezing to stabilize tissues seems likely to yield more realistic results, especially when water is frozen free of large ice crystals (Heuser and Reese, 1981; Dubochet, 2007). A great deal of effort has been made to perform tomography directly on frozen specimens in the absence of any stains or fixatives. Most neural and other cellular applications require first cutting frozen sections and performing tomography directly on them (Al-Amoudi et al., 2004; Lucić et al., 2005; McIntosh et al., 2005; Ladinsky et al., 2006; Marko et al., 2007). The light elements that make up cells yield little contrast in focused images, so the electron microscope must be defocused to provide phase contrast. Resolution and contrast of details are necessarily poor compared with the images derived from structures stained with heavy metals, which produce much more electron scattering and a higher signal-to-noise ratio. However, cryo-EM tomography has enjoyed important successes in studying the high-resolution structure of individual proteins or isolated protein complexes where large number of structures can be averaged (Frank, 1981; Steven and Belnap, 2005; Zhang et al., 2008). The difficulties with cryo-electron microscopy arise in directly studying neuronal structures, such as synapses, which are intrinsically heterogeneous. Collecting multiple images of the same structure in tomographic series from cryosections also poses difficult technical problems in minimizing beam damage and in interpreting images, but this approach may ultimately prove useful for studying macromolecular structures in mammalian neural tissues (Lucić et al., 2007).
Freeze-substitution provides an alternative approach more suited to complex neural systems where structures, such as synapses, are rarely cut in optimal planes of section. Freeze-substitution typically begins with directly freezing tissues, which avoids exposing living tissues to cross-linking fixatives and stops cell functions within milliseconds. The success with freeze-substitution ultimately depends on the efficacy of the freezing methods because there are severe limitations on the size of tissues that can be successfully frozen.
Freezing methods
A fundamental hurdle in freezing biological tissues is the formation of ice crystals that distort or damage structures. Cryoprotectants can damage structures, such as membranes, or distort cells by shrinking them, but cryoprotectants can be avoided if the heat can be removed in ≤1 ms. To date it has only been possible to achieve these rates of cooling within a few micrometers of the surface in a neural tissues (Heuser and Reese, 1981), limiting investigation almost entirely to disassociated cultures or surfaces of acute brain slices. High-pressure freezing (HPF) methods (Moore, 1987), which inhibit the formation of ice crystals by exertion of large pressures at the moment of freezing, can extend the depth of freezing to 100–300 μm or more and, when optimally implemented, can well preserve structures down to atomic resolutions (Dubochet, 2007). However, in practice, results may be capricious, and current HPF machines limit the size of the tissue to 1–3 mm. Other HPF methods to freeze reliably larger volumes of tissue are under development. The heat transfer rate for HPF is generally lower than that of rapid slam freezing (Heuser and Reese, 1981), so HPF might not be the best choice for capturing very fast dynamic events. Despite these challenges, HPF would be the method of choice for preparing nerve tissues for many future EM tomography investigations in which the emphasis is focused on macromolecular organization in neurons. Here, we present an example of a system for tomography based on HPF and freeze-substitution of dissociated neuronal cultures (Fig. 1).
Freeze-substitution
During freeze-substitution, ice sublimes directly into a cold solvent, typically acetone at −90°C, whereas stains and stabilizing molecules dissolved in the cold solvent enter the tissue. The problem of optimizing tissue preparation to resolve macromolecular structure by EM tomography is, however, fundamentally different from the problem of producing conventional projection images through the entire thickness of a section. Many traditional stains and stabilizing molecules are not suitable for tomography because they provide too much contrast or coat proteins, adding to and presumably distorting their native structures. For these reasons, osmium tetroxide and tannic acid, both widely used as contrasting agents in freeze-substitution, must be avoided in freeze-substituting neural tissues for tomography. When staining is limited to uranyl acetate, and stabilization of membranes is limited to acrolein, individual structures such as actin filaments assume their expected diameters of 7 nm [Chen et al. (2008a), see cover figure]. Although adequate details may be preserved in traditional epoxy-embedding media, the stabilization of structures offered by low-temperature embedding using an acrylic resin (such as HM-20) can be quite beneficial.
Acquiring tomography series
Conventional thin sections are typically cut 40–100 nm thick to decrease overlap among structures within the section. It is possible to use sections ranging up to several micrometers thick for tomography (Bouwer et al., 2007). The limiting factor becomes the penetration of the electron beam, which is increased by using higher accelerating voltages, up to the point at which too much contrast is lost. Furthermore, to retain spatial resolution in the tomographic reconstruction in thicker specimens, one needs to acquire larger number of images. The resulting longer exposure to electron radiation can lead to more distortion of the plastic section and more alignment errors in building the final reconstruction volume. In practice, sections of HM-20 up to ≥300 nm thick can be optimally examined at an accelerating voltage of 300 kV. Coating both sides of the specimen grid with a thin (∼5 nm) layer of carbon helps to stabilize the section during relatively long exposure to electron bombardment. Applying 10–15 nm gold particles to both surfaces of the section provides fiducial markers for fine alignment of the series. An area of the specimen is tilted and repeatedly imaged at tilt increments of 1–2° ranging from approximately +70 to −70° along an axis perpendicular to the incoming electron beam. It is now becoming standard practice to collect a second orthogonal tilt series by rotating the grid ∼90° relative to the first series. The two series are separately reconstructed and then combined to generate a more complete reconstruction. This process is termed dual-axis tomography. Dual-axis tomography not only provides more uniform resolution in the final reconstruction but also avoids loss of resolution when structures have an unfavorable orientation, e.g., elongated objects oriented perpendicular to the tilt axis (Mastronarde, 1997). Dual-axis tomography should always be used if the section is stable enough to sustain the longer period of beam exposure.
Tomographic reconstruction
The realization that a three-dimensional object can be reconstructed from a set of its two-dimensional projections was first demonstrated mathematically by Radon (1917), who showed that with an infinite number of projections, a three-dimensional map of the object can be constructed by reverse or backprojection (an inverse Radon transformation). A variety of backprojection methods for three-dimensional reconstructions were independently discovered in radio astronomy (Bracewell and Riddle, 1967), electron microscopy (DeRosier and Klug, 1968), and notably medical imaging with computed tomography (Cormack, 1980) and magnetic resonance imaging scanning (Lauterbur, 1973).
The concept of creating a reconstruction from backprojections can be understood in the context of Fourier transformations. Thus, DeRosier and Klug (1968) demonstrated, by summing Fourier transforms of sets of projection EM images (collected at various tilt angles), that a three-dimensional map of the original object is reconstructed by an inverse Fourier transformation. Alternatively, reconstructions can be made directly from electron micrographs in real space by direct backprojection methods (Crowther et al., 1970; Gilbert, 1972a). Because the Fourier frequencies closer to the rotation axis are sampled more than those further away, a weighting filter is typically applied in Fourier space before backprojection in real space. The numerical approximation of the inverse Radon transformation by direct backprojection of the filtered images is implemented in most of the EM tomography packages such as SPIDER, IMOD, or EM3D (Frank, 1981; Kremer et al., 1996; Harlow et al., 2001).
To obtain reconstructions of a high quality, one needs to align the images accurately before using them for backprojection. A typical approach starts with initial alignment of images by cross-correlation and then uses fiducial markers on the surfaces of a section, or embedded in the sample, to fit to a model of a solid rotating body to calculate the rotation angles, shifts and magnification changes of the collected images. Backprojection is then applied to this alignment solution to reconstruct a map of the original volume.
Because progressive increases in effective section thickness ultimately limit how high one can tilt, Fourier frequencies at high tilt angles are unobtainable. This missing wedge problem nonuniformly degrades the resolution in the final reconstruction and introduces characteristic artifacts in the tomogram. This problem is considerably alleviated by dual-axis tomography (Penczek et al., 1995; Mastronarde, 1997), which reduces the missing wedge to a missing pyramid.
Iterative approaches can be used further to refine the reconstruction. The most popular of these is the simultaneous iterative reconstruction technique (SIRT) (Gilbert, 1972b), and SIRT is now starting to be implemented in tomography packages (Tong et al., 2006). SIRT iteratively projects an initial tomographic reconstruction back to compare with the original images and then the corrected images are backprojected to generate a new reconstruction. The iterative process can, in some instances, produce reconstructions with improved resolution. SIRT is computationally intensive, but we found with a few test runs that it can greatly improve the quality of single-axis tomographic reconstructions and generate reconstructions comparable to those obtained from dual-axis tomography.
Segmentation of three-dimensional structures
Virtual sections limited by the size of the voxels can be displayed in any plane through the reconstruction. The size of the voxels in three-dimensional images depends on the magnification used when the two-dimensional projections are collected in an electron microscope. For imaging individual protein molecules inside neurons, the voxel is typically 0.5–1.5 nm.
The segmentation process starts with a discovery phase, in which the investigator observes, exams, reflects, and quite often re-examines the sets of virtual sections extensively to form initial interpretations to inform further analyses. This phase typically requires many hours of attentive observation, but with good preparations and accurate three-dimensional reconstructions, one is eventually prepared to recognize and classify morphologically distinct structures. The cataloging of structures into classes must meet a set of clear, objective criteria: specific shapes (filaments or globular); locations in specific cellular compartment (membrane associated or not in the postsynaptic density region or in the cytoplasm of spine); and particularly specific dimensions (e.g., vertical filaments in Fig. 2C). An object to be segmented typically represents a protein molecule, or a partial or complete complex of molecules, but it could also represent a transmembrane structure such as a receptor. Some objects, such as filaments, are recognized in certain orientations where they are contained within a virtual section. It is possible to rotate the entire volume to optimize orientations of unoriented objects, but if there are large numbers of objects, all in slightly different orientations, this becomes a daunting computational task.
To circumvent problems imposed by different orientations, we segment each object in each of its three orthogonal planes, x–y, x–z, and y–z (Chen et al., 2008a). When the density belonging to an object is outlined in all three orthogonal views, ambiguities in one view can typically be resolved in other views. In most of tomograms, resolution in the x–y plane (normal to the electron beam) is better than that in the x–z and y–z planes, primarily because of the missing pyramid problem and imperfections in building the reconstruction. But with small increment (1–2°), high-tilt (approximately ±70°) dual-axis tomography, differences in resolution in different image planes are minimized.
Features segmented, i.e., outlined, in a 0.5–1.5 nm virtual section will typically represent only a part of the whole three-dimensional object. To segment the whole object, it must be followed, and outlined, in several, successive virtual sections. For instance, a filament 5 nm in diameter and 20 nm long (Fig. 2D,E) is too large to be contained within a single virtual section. Such a filament will typically not even be displayed in its entire length in one virtual section, so it will have to be traced through several adjacent virtual sections. There are various methods and tools already implemented in various software packages for segmenting objects in virtual sections. One could directly outline the boundary of an object, or one could select the density over the object automatically by setting a gray scale threshold. Some software also implements routines to automatically segment specific structures (Ress et al., 2004), but so far these have not been generally applicable to smaller, more complex structures.
Segmenting transmembrane structures such as receptors is more challenging because they may not be detectable as they pass through the hydrophobic interior of the membrane. Furthermore, the axis of orientation of the whole receptor complex with respect to the membrane is unknown, and the virtual section may not cut through an orthogonal plane of the membrane. Therefore, extracellular domains should be segmented separately from intracellular domains and then carefully mapped for overlay after rendering. In all instances, structures that might show ambiguities as to their beginning and end when segmented in one of the orthogonal views can generally be resolved when segmented in the two other orthogonal views. With this approach, it is possible to determine accurately the alignment between domains on opposite sides of the membrane and identify transmembrane structures, such as receptors (Chen et al., 2008a).
Most segmentation can be done semimanually (Harlow et al., 2001; Chen et al., 2008a). Because molecular structures typically fall into classes containing morphologically similar or identical objects, it should be possible to develop automatic segmentation algorithms in the future to identify and segment repetitive structures in tomograms. The improved automatic segmentation could eventually help to alleviate the burden of repetitive work in segmenting each object in three planes, but each segmentation will still need to be initiated and checked by an investigator. The more advanced automatic segmentation routines for large serial reconstructions use neuronal network algorithms that are trained and checked by human eyes to facilitate machine-based segmentation (Jain et al., 2007). This approach might eventually be quite valuable for tomography segmentation.
Rendering, structural analysis, and model building
The ultimate goal of tomography is to render and classify the components of an entire assembly of the various molecular structures comprising a particular cellular compartment. Every individual segmented object, such as a domain of transmembrane structure, a membrane associated filament, or portion of cell membrane, contained within the whole reconstruction can be rendered by stacking up segments of density boundaries from consecutive sections and rendering them as three-dimensional objects. Objects can be displayed either as continuous foils (surface rendering) (Fig. 2D–H) or as densities (volume rendering). A wealth of information can be gleaned from the complete three-dimensional rendering, including the locations of each individual structure as well as their sizes in each dimension (Fig. 2H–I). Individual objects presumed to belong to a class, at this point, can be re-examined to ensure correct classification.
The valuable outcome is that one can determine the number of a particular structural class of structures in a specific cellular compartment, as well as the relationships between structures. Patterns of localization or connections between different classes of structures then become apparent (Harlow et al., 2001; Chen et al., 2008a). For example, one class of structures may be linked together by another distinct group of structures (Fig. 2F–G), or may manifest a specific geometric organization, such as a rhombic lattice or other patterns. Examples of such patterns are illustrated in the postsynaptic density (PSD) organization (Chen et al., 2008a).
Information on the location and sizes of these small structures in a reconstruction can be used to generate working hypotheses regarding their molecular identity. Sizes of structures from reconstructions can match specific molecules or complexes derived from various sources, for example, the PSD-95/Discs large/zona occludens-1 (PDZ), SH3-GK domains of PSD-95 derived from high-resolution x-ray crystallography or NMR can be combined to estimate the size of PSD-95 (Doyle et al., 1996; McGee et al., 2001; Long et al., 2003). Also, size information can be derived from parts of larger intact structures such as extracellular domain of AMPA receptors (AMPARs) obtained from single particle electron microscopy of the intact AMPARs (Nakagawa et al., 2005), or x-ray structures of the ligand-binding domain of AMPARs (Armstrong and Gouaux, 2000) and NMDA receptors (NMDARs) (Furukawa et al., 2005). Another approach is to calculate sizes from structural informatics by first analyzing the domain conformation based on amino acid sequences and then calculating its size mostly based on the predicted conformation (structured or natively unstructured) and molecular mass (Uversky, 2002; Dosztányi et al., 2005; Chen et al., 2008a). Matching the sizes alone does not prove the molecular identity of a specific structure, but a mismatch can certainly rule out certain candidates.
To build a complete molecular model based on a completed three-dimensional rendering of a tomogram (Fig. 2I), one must marshal information from various sources, such as results from electrophysiology, biochemistry, immunoelectron microscopy, and functional studies with light microscopic imaging. For instance, PSD-95 is known to associate with membrane by N-terminal palmitoylation (Craven et al., 1999), whereas its PDZ domains interact with both NMDARs (Niethammer et al., 1996) and AMPAR complex (Chen et al., 2000). Any identification of rendered structures in the PSD should be consistent with all known information.
Future perspectives: identifying molecules in reconstructions
By developing new cryo-methods for tomography, we have demonstrated that a complex protein assembly such as the PSD in neurons can be rendered at a molecular level with high-tilt, dual-axis EM tomography (Chen et al., 2008a). Historically, there are examples in which electron microscopy has uncovered some molecular level details at the PSD. Application of freeze fracture and deep etching to rapid frozen synapses produces fractures along lipid bilayers that uncover particles likely to represent glutamate receptors (Harris and Landis, 1986). These are contacted by small vertical filaments in the core of the PSDs, whereas other filaments representing actin filaments fill the rest of the cytoplasm of spines (Gulley and Reese, 1981; Landis and Reese, 1983). A variant of this approach uses fracture immunolabel to identify glutamate receptors at a synapse (Tanaka et al., 2005), but the fracture methods can only reveal one plane through the synapse, as in a single virtual section. With high-resolution tomography, many virtual sections can be combined to produce complete three-dimensional reconstructions of the proteins in the PSD and the dendritic spine.
Although the identities of many of the components of a reconstruction can be inferred from their sizes, shapes, and positions, many of them will have to be positively identified to create a complete picture of molecular organization. Traditional immunolabeling for electron microscopy typically uses gold particles conjugated to primary or uses secondary antibody to pinpoint epitopes, but the morphological structure of the labeled proteins can rarely be seen directly, the weak fixatives used to retain antigenicity results in loss of many structural details. However, some progress has been made by combining preembedding immunoelectron microscopy with high-pressure freezing, freeze-substitution, and EM tomography to visualize which individual structures are labeled by immunogold. After labeling, vertical filaments in the PSD that were thought to be PSD-95, could be rendered from tomograms in which their association with antibodies linking them to gold particles was apparent (Chen et al., 2008a,b). This approach requires a fixative resulting in some degradation of structure; therefore, further development in labeling methods is warranted. Also, other molecular techniques such as knock-out of a specific gene or knockdown of a specific protein could also be used to settle questions about the identification of a particular class of structures.
We expect that with a hybrid approach, in which tomography is used to show structural organization at molecular resolution, some molecules are identified by immunogold labeling, and finally, molecular tools are combined with tomography to identify molecular components, will ultimately provide a detailed structural basis with which to understand synaptic function at the molecular level.
Footnotes
This work was supported by the Intramural Research Program of the National Institutes of Health–National Institute of Neurological Disorders and Stroke. We thank Jim Galbraith for help with the high-pressure freezing, Susan Cheng for help with all aspects of immunoelectron microscopy, and Richard Leapman for providing resources and much help in collecting tomographic series. We received invaluable help from David Mastronarde with reconstruction methods, and Maria Aronova tested the SIRT method.
Editor's Note: Toolboxes are intended to briefly highlight and evaluate an emerging approach or a resource that is becoming widely used in neuroscience. For more information, see http://www.jneurosci.org/misc/itoa.shtml.
References
- Al-Amoudi A, Norlen LP, Dubochet J. Cryo-electron microscopy of vitreous sections of native biological cells and tissues. J Struct Biol. 2004;148:131–135. doi: 10.1016/j.jsb.2004.03.010. [DOI] [PubMed] [Google Scholar]
- Armstrong N, Gouaux E. Mechanisms for activation and antagonism of an AMPA-sensitive glutamate receptor: crystal structures of the GluR2 ligand binding core. Neuron. 2000;28:165–181. doi: 10.1016/s0896-6273(00)00094-5. [DOI] [PubMed] [Google Scholar]
- Bouwer JC, Mackey MR, Lawrence A, Deerinck TJ, Jones YZ, Terada M, Martone ME, Peltier ST, Ellisman MH. The application of energy-filtered electron microscopy to tomography of thick, selectively stained biological samples. Methods Cell Biol. 2007;79:643–660. doi: 10.1016/S0091-679X(06)79026-4. [DOI] [PubMed] [Google Scholar]
- Bracewell RN, Riddle AC. Inversion of fan-beam scans in radioastronomy. Astrophys J. 1967;150:427–434. [Google Scholar]
- Chen L, Chetkovich DM, Petralia RS, Sweeney NT, Kawasaki Y, Wenthold RJ, Bredt DS, Nicoll RA. Stargazin regulates synaptic targeting of AMPA receptors by two distinct mechanisms. Nature. 2000;408:936–943. doi: 10.1038/35050030. [DOI] [PubMed] [Google Scholar]
- Chen X, Winters C, Azzam R, Li X, Galbraith JA, Leapman RD, Reese TS. Organization of the core structure of the postsynaptic density. Proc Natl Acad Sci USA. 2008a;105:4453–4458. doi: 10.1073/pnas.0800897105. [DOI] [PMC free article] [PubMed] [Google Scholar]
- Chen X, Winters C, Azzam R, Li X, Galbraith JA, Leapman RD, Reese TS. Identifying individual scaffolding molecules in the postsynaptic density. the Microscopy and Microanalysis 2008 meeting; August; Albuquerque, NM. 2008b. Paper presented at. [DOI] [PMC free article] [PubMed] [Google Scholar]
- Chetkovich DM, Nicoll RA. Organization and regulation of the postsynaptic density. In: Stuart G, Spruston N, Häusser M, editors. Dendrite. Oxfrod: Oxford UP; 2008. pp. 131–153. [Google Scholar]
- Cormack AM. Early two-dimensional reconstruction and recent topics stemming from it. Science. 1980;209:1482–1486. doi: 10.1126/science.6254142. [DOI] [PubMed] [Google Scholar]
- Craven SE, El-Husseini AE, Bredt DS. Synaptic targeting of the postsynaptic density protein PSD-95 mediated by lipid and protein motifs. Neuron. 1999;22:497–509. doi: 10.1016/s0896-6273(00)80705-9. [DOI] [PubMed] [Google Scholar]
- Crowther RA, DeRosier DJ, Klug A. The Reconstruction of a three-dimensional structure from projections and its application to electron microscopy. Proc R Soc Lond A Math Phys Sci. 1970;317:319–340. [Google Scholar]
- DeRosier DJ, Klug A. Reconstruction of three-dimensional structures from electron micrographs. Nature. 1968;217:130–134. doi: 10.1038/217130a0. [DOI] [PubMed] [Google Scholar]
- Dosztányi Z, Csizmók V, Tompa P, Simon I. The pairwise energy content estimated from amino acid composition discriminates between folded and intrinsically unstructured proteins. J Mol Biol. 2005;347:827–839. doi: 10.1016/j.jmb.2005.01.071. [DOI] [PubMed] [Google Scholar]
- Doyle DA, Lee A, Lewis J, Kim E, Sheng M, MacKinnon R. Crystal structures of a complexed and peptide-free membrane protein-binding domain: molecular basis of peptide recognition by PDZ. Cell. 1996;85:1067–1076. doi: 10.1016/s0092-8674(00)81307-0. [DOI] [PubMed] [Google Scholar]
- Dubochet J. The physics of rapid cooling and its implications for cryoimmobilization of cells. Methods Cell Biol. 2007;79:7–21. doi: 10.1016/S0091-679X(06)79001-X. [DOI] [PubMed] [Google Scholar]
- Frank J. Three-dimensional reconstruction of single molecules. Methods Cell Biol. 1981;22:325–344. doi: 10.1016/s0091-679x(08)61882-8. [DOI] [PubMed] [Google Scholar]
- Furukawa H, Singh SK, Mancusso R, Gouaux E. Subunit arrangement and function in NMDA receptors. Nature. 2005;438:185–192. doi: 10.1038/nature04089. [DOI] [PubMed] [Google Scholar]
- Gilbert PFC. The reconstruction of a three-dimensional structure from projections and its application to electron microscopy. II. Direct methods. Proc R Soc Lond B Biol Sci. 1972a;182:89–102. doi: 10.1098/rspb.1972.0068. [DOI] [PubMed] [Google Scholar]
- Gilbert PFC. Iterative methods for the three-dimensional reconstruction of an object from projections. J Theor Biol. 1972b;36:105–117. doi: 10.1016/0022-5193(72)90180-4. [DOI] [PubMed] [Google Scholar]
- Gulley RL, Reese TS. Cytoskeletal organization at the postsynaptic complex. J Cell Biol. 1981;91:298–302. doi: 10.1083/jcb.91.1.298. [DOI] [PMC free article] [PubMed] [Google Scholar]
- Harlow ML, Ress D, Stoschek A, Marshall RM, McMahan UJ. The architecture of active zone material at the frog's neuromuscular junction. Nature. 2001;409:479–484. doi: 10.1038/35054000. [DOI] [PubMed] [Google Scholar]
- Harris KM, Landis DM. Membrane structure at synaptic junctions in area CA1 of the rat hippocampus. Neuroscience. 1986;19:857–872. doi: 10.1016/0306-4522(86)90304-0. [DOI] [PubMed] [Google Scholar]
- Heuser JE, Reese TS. Structural changes after transmitter release at the frog neuromuscular junction. J Cell Biol. 1981;88:564–580. doi: 10.1083/jcb.88.3.564. [DOI] [PMC free article] [PubMed] [Google Scholar]
- Jain V, Murray JF, Roth F, Turaga S, Zhigulin V, Briggman K, Helmstaedter M, Denk W, Seung H S. Supervised learning of image restoration with convolutional networks. Eleventh IEEE International Conference on Computer Vision; October; Rio de Janeiro, Brazil. 2007. Paper presented at. [Google Scholar]
- Kremer JR, Mastronarde DN, McIntosh JR. Computer visualization of three-dimensional image data using IMOD. J Struct Biol. 1996;116:71–76. doi: 10.1006/jsbi.1996.0013. [DOI] [PubMed] [Google Scholar]
- Ladinsky MS, Pierson JM, McIntosh JR. Vitreous cryo-sectioning of cells facilitated by a micromanipulator. J Microsc. 2006;224:129–134. doi: 10.1111/j.1365-2818.2006.01674.x. [DOI] [PubMed] [Google Scholar]
- Landis DM, Reese TS. Cytoplasmic organization in cerebellar dendritic spines. J Cell Biol. 1983;97:1169–1178. doi: 10.1083/jcb.97.4.1169. [DOI] [PMC free article] [PubMed] [Google Scholar]
- Lauterbur PC. Image formation by induced local interactions: Examples employing nuclear magnetic resonance. Nature. 1973;242:190–191. [PubMed] [Google Scholar]
- Lenzi D, Crum J, Ellisman MH, Roberts WM. Depolarization redistributes synaptic membrane and creates a gradient of vesicles on the synaptic body at a ribbon synapse. Neuron. 2002;36:649–659. doi: 10.1016/s0896-6273(02)01025-5. [DOI] [PubMed] [Google Scholar]
- Long JF, Tochio H, Wang P, Fan JS, Sala C, Niethammer M, Sheng M, Zhang M. Supramodular structure and synergistic target binding of the N-terminal tandem PDZ domains of PSD-95. J Mol Biol. 2003;327:203–214. doi: 10.1016/s0022-2836(03)00113-x. [DOI] [PubMed] [Google Scholar]
- Lucić V, Förster F, Baumeister W. Structural studies by electron tomography: from cells to molecules. Annu Rev Biochem. 2005;74:833–865. doi: 10.1146/annurev.biochem.73.011303.074112. [DOI] [PubMed] [Google Scholar]
- Lucić V, Kossel AH, Yang T, Bonhoeffer T, Baumeister W, Sartori A. Multiscale imaging of neurons grown in culture: from light microscopy to cryo-electron tomography. J Struct Biol. 2007;160:146–156. doi: 10.1016/j.jsb.2007.08.014. [DOI] [PubMed] [Google Scholar]
- Marko M, Hsieh C, Schalek R, Frank J, Mannella C. Focused-ion-beam thinning of frozen-hydrated biological specimens for cryo-electron microscopy. Nat Methods. 2007;4:215–217. doi: 10.1038/nmeth1014. [DOI] [PubMed] [Google Scholar]
- Mastronarde DN. Dual-axis tomography: an approach with alignment methods that preserve resolution. J Struct Biol. 1997;120:343–352. doi: 10.1006/jsbi.1997.3919. [DOI] [PubMed] [Google Scholar]
- McGee AW, Dakoji SR, Olsen O, Bredt DS, Lim WA, Prehoda KE. Structure of the SH3-guanylate kinase module from PSD-95 suggests a mechanism for regulated assembly of MAGUK scaffolding proteins. Mol Cell. 2001;8:1291–1301. doi: 10.1016/s1097-2765(01)00411-7. [DOI] [PubMed] [Google Scholar]
- McIntosh R, Nicastro D, Mastronarde D. New views of cells in 3D: an introduction to electron tomography. Trends Cell Biol. 2005;15:43–51. doi: 10.1016/j.tcb.2004.11.009. [DOI] [PubMed] [Google Scholar]
- Moore H. Theory and practice of high pressure freezing. In: Steinbrecht RA, Zierold K, editors. Cryotechniques in biologocal electron microscopy. Berlin: Spinger-Verlag; 1987. pp. 175–191. [Google Scholar]
- Nakagawa T, Cheng Y, Ramm E, Sheng M, Walz T. Structure and different conformational states of native AMPA receptor complexes. Nature. 2005;433:545–549. doi: 10.1038/nature03328. [DOI] [PubMed] [Google Scholar]
- Niethammer M, Kim E, Sheng M. Interaction between the C terminus of NMDA receptor subunits and multiple members of the PSD-95 family of membrane-associated guanylate kinases. J Neurosci. 1996;16:2157–2163. doi: 10.1523/JNEUROSCI.16-07-02157.1996. [DOI] [PMC free article] [PubMed] [Google Scholar]
- Okabe S. Molecular anatomy of the postsynaptic density. Mol Cell Neurosci. 2007;34:503–518. doi: 10.1016/j.mcn.2007.01.006. [DOI] [PubMed] [Google Scholar]
- Penczek P, Marko M, Buttle K, Frank J. Double-tilt electron tomography. Ultramicroscopy. 1995;60:393–410. doi: 10.1016/0304-3991(95)00078-x. [DOI] [PubMed] [Google Scholar]
- Radon J. On the determination of functions from their integrals along certain manifolds. Ber Verh Sachs Akad Wiss Leipzig Math-Phys, Kl. 1917;69:262–277. [Google Scholar]
- Ress DB, Harlow ML, Marshall RM, McMahan UJ. Methods for generating high-resolution structural models from electron microscope tomography data. Structure. 2004;12:1763–1774. doi: 10.1016/j.str.2004.07.022. [DOI] [PMC free article] [PubMed] [Google Scholar]
- Sheng M, Hoogenraad CC. The postsynaptic architecture of excitatory synapses: a more quantitative view. Annu Rev Biochem. 2007;76:823–847. doi: 10.1146/annurev.biochem.76.060805.160029. [DOI] [PubMed] [Google Scholar]
- Siksou L, Rostaing P, Lechaire JP, Boudier T, Ohtsuka T, Fejtová A, Kao HT, Greengard P, Gundelfinger ED, Triller A, Marty S. Three-dimensional architecture of presynaptic terminal cytomatrix. J Neurosci. 2007;27:6868–6877. doi: 10.1523/JNEUROSCI.1773-07.2007. [DOI] [PMC free article] [PubMed] [Google Scholar]
- Smith JE, Reese TS. Use of aldehyde fixatives to determine the rate of synaptic transmitter release. J Exp Biol. 1980;89:19–29. doi: 10.1242/jeb.89.1.19. [DOI] [PubMed] [Google Scholar]
- Steven A, Belnap D. Electron microscopy and image processing: an essential tool for structural analysis of macromolecules. Curr Protoc Protein Sci. 2005 doi: 10.1002/0471140864.ps1702s42. Chapter 17:Unit 17.2. [DOI] [PubMed] [Google Scholar]
- Tanaka J, Matsuzaki M, Tarusawa E, Momiyama A, Molnar E, Kasai H, Shigemoto R. Number and density of AMPA receptors in single synapses in immature cerebellum. J Neurosci. 2005;25:799–807. doi: 10.1523/JNEUROSCI.4256-04.2005. [DOI] [PMC free article] [PubMed] [Google Scholar]
- Tong J, Arslan I, Midgley P. A novel dual-axis iterative algorithm for electron tomography. J Struct Biol. 2006;153:55–63. doi: 10.1016/j.jsb.2005.10.005. [DOI] [PubMed] [Google Scholar]
- Uversky VN. What does it mean to be natively unfolded? Eur J Biochem. 2002;269:2–12. doi: 10.1046/j.0014-2956.2001.02649.x. [DOI] [PubMed] [Google Scholar]
- Zhang X, Settembre E, Xu C, Dormitzer PR, Bellamy R, Harrison SC, Grigorieff N. Near-atomic resolution using electron cryomicroscopy and single-particle reconstruction. Proc Natl Acad Sci U S A. 2008;105:1867–1872. doi: 10.1073/pnas.0711623105. [DOI] [PMC free article] [PubMed] [Google Scholar]