

Abstract
For automated production of tandem mass spectrometric data for proteins and peptides >3 kDa at >50 000 resolution, a dual online—offline approach is presented here that improves upon standard liquid chromatography—tandem mass spectrometry (LC—MS/MS) strategies. An integrated hardware and software infrastructure analyzes online LC—MS data and intelligently determines which targets to interrogate offline using a posteriori knowledge such as prior observation, identification, and degree of characterization. This platform represents a way to implement accurate mass inclusion and exclusion lists in the context of a proteome project, automating collection of high-resolution MS/MS data that cannot currently be acquired on a chromatographic time scale at equivalent spectral quality. For intact proteins from an acid extract of human nuclei fractionated by reversed-phase liquid chromatography (RPLC), the automated offline system generated 57 successful identifications of protein forms arising from 30 distinct genes, a substantial improvement over online LC—MS/MS using the same 12 T LTQ FT Ultra instrument. Analysis of human nuclei subjected to a shotgun Lys-C digest using the same RPLC/automated offline sampling identified 147 unique peptides containing 29 co- and post-translational modifications. Expectation values ranged from 10−5 to 10−99, allowing routine multiplexed identifications.
Historically, there has been a trade-off in mass spectrometry between resolution and sensitivity. In contemporary MS-based proteomics,1 there is long-standing interest in increasing either spectral resolution, the size of peptides/proteins analyzed, or both. Such improvements will allow more protein complexity to be measured with greater certainty.2 Driven in part by new ion fragmentation approaches3,4 and improving instrumentation,5-12 the steadily advancing capabilities of MS are challenged by targeting polypeptides >3 kDa, such as intact proteins, non-tryptic peptides, and/or large endogenous peptides.13 Although proteomics has traditionally been a field ripe for automation,14 data acquisition solutions for MS/MS of proteins or peptides at >50 000 resolving power remain relatively underdeveloped.
In a typical bottom-up LC—MS/MS experiment using the new breed of ion trap-Fourier transform (FT) hybrid instruments, intact peptide data are now routinely acquired at FTMS resolution,15,16 substantially clarifying protein identifications by database retrieval. However, parameters that lead to increased MS/MS data quality (e.g., long ion accumulation times, detection by FTMS, and spectral averaging) are sacrificed to increase the speed of MS/MS sampling in order to maximize proteome coverage. This increase in sampling rate is not compatible with acquisition of high-resolution MS/MS spectra by Fourier transform mass analyzers, which are inherently slower than electron multiplier detection-based ion traps and time-of-flight (TOF) instruments more commonly employed for automated MS/MS on a chromatographic time scale.17-21
In addition to the challenges of performing proteomics with high-resolution MS/MS data, the data acquisition approaches common on modern mass spectrometers are less effective for masses >3 kDa due to charge state distributions that mask less abundant species.22 Straightforward implementation of data-dependent experimental methods with larger parent ions produced by electrospray typically fragments several charge states of the same precursor, thus making it unlikely to acquire data on a species not even an order of magnitude less abundant on a chromatographic time scale. For small peptides this is not a major concern, since 1—3 kDa peptides will usually produce only one or two charge states within the m/z range of analysis. Although online top-down proteomics is now a reality, as recently demonstrated for yeast proteins <40 kDa,23 these factors continue to argue for an offline data acquisition strategy.
Much of the current research into increasing the biological dynamic range accessible by MS/MS involves parallel24 or data-independent25 methods, where multiple precursors are selected for simultaneous fragmentation. This multiplexing methodology is very effective at improving offline throughput,26 which is particularly critical for the acquisition of high-resolution tandem mass spectra, and is one of three distinct data acquisition strategies published by Patrie et al. in 2004.27 These past solutions focused on automating more intelligent data acquisition for top-down proteomics following fractionation by RPLC and were based on the use of advanced data analysis algorithms for determination of highly accurate precursor masses. Initially, the ZSCORE implementation28 of the charge state deconvolution algorithm29 was used.22 Later, a modified version of the thorough high-resolution analysis of spectra by Horn (THRASH) algorithm30 was incorporated to improve sensitivity and accuracy.31
Although most research on this front involves innovative mass spectrometers, there are alternatives rooted in the inlet and chromatography configuration. For targeted work performed online, “peak parking” has shown promise.32-34 For proteomic work, however, a split-flow setup is necessary to extend analysis time for species eluting throughout the entire chromatographic gradient. Split-flow mass spectrometry has thus far been successfully applied to the detection of low-abundance phosphopeptides35,36 and bacterial signaling molecules,37 but has not yet been extended to whole proteome studies.
The work presented here is a natural extension of these past platforms and combines the Advion TriVersa NanoMate with a Thermo Scientific 12 T LTQ FT Ultra into an integrated system for collection of online LC—MS data with simultaneous fraction collection for intelligent acquisition of offline fragmentation data. Targets are sought online, re-infused, and fragmented offline in a highly automated fashion. This new data production engine is coupled with a streamlined version of the ProSight software suite,38-41 advancing technology for high-resolution proteomics that allows for automated acquisition of high-quality MS/MS for bottom-up, middle-down, or top-down proteome projects.
EXPERIMENTAL SECTION
Cell Processing
Washed human HeLa cell pellets (∼2 × 10⁷ cells) were suspended in nuclear isolation buffer (NIB-250): 15 mM tris-hydrochloric acid (pH 7.5), 60 mM potassium chloride, 15 mM sodium chloride, 5 mM magnesium chloride, 1 mM calcium chloride, 250 mM sucrose, 1 mM dithiothreitol, 10 mM sodium butyrate, protease inhibitor cocktail set III (Calbiochem; San Diego, CA) at a 100:1 v:v ratio, and phosphatase inhibitor cocktail set II (Calbiochem) at a 100:1 v:v ratio plus 0.3% NP-40 at a 10:1 v:v ratio. Cells were lysed by gentle mixing and incubation on ice for 5 min. Nuclei were pelleted at 600 × g for 5 min at 4 °C and then washed twice with NIB-250 without detergent.
Sample Preparation
For top-down, 0.4 N sulfuric acid was added to HeLa nuclei to give a 3:1 ratio. The acid-extracted nuclei were maintained at 4 °C for 30 min and centrifuged at 2000 × g. The supernatant was transferred to a 1.5 mL microcentrifuge tube and centrifuged again at 14 000 rpm for 20 min. This supernatant (200 μL) was mixed with 150 μL of buffer A—water + 0.2% formic acid and 0.01% trifluoroacetic acid (TFA)—prior to injection.
For middle-down, isolated nuclei were suspended directly in lysis buffer containing 50 mM ammonium bicarbonate, 1 mM dithiothreitol, 10 mM sodium butyrate, 2 M urea, and 10 nM microcystin. Nuclei were lysed with pulsed sonication six times for 30 s each, and to the unclarified lysate, 20 ng of endoproteinase Lys-C (Wako Chemicals; Richmond, VA) was added to give roughly a 250:1 substrate-to-enzyme ratio. The nuclear lysate was digested overnight at 37 °C. Prior to injection, the digest was clarified at 14 000 rpm for 20 min. Buffer A was added to the supernatant to double the volume, and the sample was reclarified to remove any precipitate.
Liquid Chromatography
Top-down or middle-down samples were injected with a Gilson 235P autosampler (Middleton, WI) into an Agilent 1200 binary HPLC system with degasser (Santa Clara, CA). A flow rate of 100 μL/min was used with PLRP-S 1000 Å, 5 μm, 150 mm × 1.0 mm polymer columns (Higgins Analytical; Mountain View, CA). The gradient lasted 116 min; samples were injected with 95% solvent A (water with 0.2% formic acid and 0.01% TFA) and 5% B (90:10 acetonitrile:isopropyl alcohol with 0.2% formic acid and 0.01% TFA) as starting conditions for 5 min. The linear gradient ramped to 30% B at 10 min and to 50% B at 106 min. A majority of the proteins/peptides eluted between 30 and 50% B. At 111 min, the gradient reached 95% B and was maintained until 116 min.
The TriVersa NanoMate (Advion BioSciences; Ithaca, NY) was used in LC—MS fraction collection mode with a split such that 300 nL/min was infused into the mass spectrometer via the chip-based nanoelectrospray ionization source and the remaining 99.7 μL/min was collected for subsequent offline analyses. The first 15 min of the gradient were directed to waste. Electrospray started at 16 min, when both data acquisition and fraction collection began, and ended after fraction 96 at 111 min. The electrospray voltage was typically +2.0 kV.
Mass Spectrometry
The mass spectrometer used was a Thermo Scientific 12 T LTQ FT Ultra running LTQ Tune Plus 2.2 and Xcalibur 2.0.5 (San Jose, CA/Bremen, Germany). For top-down experiments, the instrument method consisted of nine steps of “zoom mapping”, or data-independent ion trap isolation windows, detected by FT and with no subsequent fragmentation. The center of the isolation windows progressed from m/z 700 to 1100, with an isolation width of 60 m/z and a step size of 50 m/z to ensure overlap at the edges of the isolation windows. The detection range for all FT events was m/z 600–1200. This was done to ensure that all scans have sufficient data past the region of interest for the data analysis software to function optimally. After the fifth ion trap window centered at m/z 900, a full ion trap scan from m/z 600–1600 was included to enable optional assessment of data quality, but it was not analyzed by the software. Automatic gain control (AGC) targets were increased from the default of 2 × 10⁵ to 1 × 10⁶ for MSn FTMS, while the full ion trap was left at the default of 3 × 10⁴. The number of microscans was 1 except where noted.
For middle-down experiments, the instrument method consisted of full FT scans (5 microscans) from m/z 500–1500, since zoom mapping fails to cover enough m/z space in which peptide precursors occur to be effective. AGC targets were increased from 5 × 10⁵ to 2 × 10⁶ for full FTMS. For both top-down and middle-down experiments, maximum injection times were increased from the default of 500 to 4000 ms for full FTMS, 1000 to 8000 ms for MSn FTMS, and 10 to 80 ms for full ITMS. FT resolving power was always ∼171 500 (nominally 100 000 in the software, based on a 7 T ion cyclotron resonance (ICR) cell) at m/z 400. Source-induced dissociation voltages of +10–20 V were applied to all scan events to reduce adducts.
For offline experiments, the TriVersa NanoMate was switched to direct infusion mode. An electrospray voltage of +1.8 kV and a backing gas pressure of 0.6 psi was used. The isolation width was typically 5 m/z for middle-down and 8 m/z for top-down. Collision-induced dissociation (CID) parameters were normalized collision energy (NCE) of 0.41, activation Q of 0.5, and activation time of 50 ms.
Software
All non-ProSight software was written in C# using the Microsoft .NET 2.0 Framework, with the exception of THRASH which was written in ANSI C and compiled into a dynamic link library (DLL). Development was done primarily with Microsoft Visual Studio 2005. The AUTOMATION WAREHOUSE database is implemented in MySQL 5.0. For data acquisition, Component Object Model (COM) libraries were used for control of both the Thermo Scientific LTQ (LTQInstControl.dll, March 2007 release) and the Advion TriVersa NanoMate (CSVirDevice.tlb from Chip-Soft 8.1.0.901). Reading of Thermo Scientific .raw data files was performed with the XRawfile COM library (XRawfile2.dll installed with Xcalibur). Extensive .NET wrapper libraries were written to encapsulate the functionality and simplify the interface of all three COM libraries.
Online data in the Thermo Scientific .raw file format was analyzed with an application called ONLINE AUTOMATION cRAWler, which converts isotopically resolved peaks in every FT scan into neutral masses using a modified version of the THRASH algorithm.30 These peaks were then filtered on m/z, charge, mass, and mass shift relative to previously observed species and other peaks in the same data set. The filtered species were then “binned” with a 10 ppm mass tolerance and inserted into the AUTOMATION WAREHOUSE database.
Targets for offline analysis were selected from the AUTOMATION WAREHOUSE database via an application called TARGET EXTRACTOR, saved to an extensible markup language (XML) file, and loaded into the MSn APPLICATION, which was responsible for all automated data collection, controlling both the Advion TriVersa NanoMate and the Thermo Scientific LTQ FT Ultra. The MSn APPLICATION iterated through every user-enabled target in the list and collected a user-specified number of scans of various types: FT broadband (optional), IT broadband (optional), isolation, and fragmentation. Before the main acquisition on each target occurred, the software first determined whether or not it had sufficient signal abundance in a preview isolation scan, with a cutoff of 1000 typically used. If the minimum signal threshold was met, this abundance was used to determine the number of isolation and fragmentation scans to average, otherwise the target was skipped.
For each target precursor with enough signal abundance to compel MS/MS, a separate Thermo Scientific .raw file was produced; the collection of which was then batch processed by an application called OFFLINE AUTOMATION cRAWler. This software determined the mass of the precursor(s) and fragments with a modified version of the THRASH algorithm.30 This information was passed into a XML-based .puf file for searching by ProSightHT, a module within ProSightPC 2.0 (Thermo Fisher Scientific).
Database Searching
ProSight .puf files were iteratively searched against the appropriate top-down (69 435 basic sequences, 1 565 945 protein forms, 978 MB) or middle-down (3 378 894 basic sequences, 6 051 898 peptide forms, 2.5 GB) ProSight database, both shotgun annotated.42 For top-down experiments, two absolute mass searches were performed, followed by a biomarker search, both against a heavily annotated human database previously described.43 The first absolute mass search used a 10 Da precursor mass tolerance, while the second used a 300 Da tolerance. The biomarker search was performed with a 1.1 Da precursor mass tolerance. Fragment tolerance for all three searches was 10 ppm, and the expectation value (probability score44 × database size) threshold to define a positive identification was conservatively set at ≤10−5. Final results were exported to a Microsoft Excel.xls file by ProSightPC. Due to extensive modifications in the database and experimental data, the top-down results were also manually curated to ensure that only a single protein form that shows the maximum support in the fragmentation data is reported per precursor.
For middle-down experiments, two absolute mass searches were performed against an in silico digested human database that contained all Lys-C peptides from 1–50 kDa with up to 4 missed cleavages. The first absolute mass search used a 5 Da precursor mass tolerance and a 10 ppm fragment tolerance. MS/MS experiments that did not yield an expectation value within the strict confidence threshold of ≤10−5 were automatically researched with a 200 Da intact mass window. Final results were exported to a Microsoft Excel .xls file by ProSightPC.
RESULTS
The workflow described here is shown in Figure 1, with the online portion shown in panel a (top) and the offline portion shown in panel b (bottom). The AUTOMATION WAREHOUSE database links the online and offline segments of the workflow, acting as a data repository for the entire proteome project. After converting all isotopic clusters into neutral masses, filtering and binning the results of the online analysis led to several orders of magnitude reduction in the number of species. This step minimized the number of precursor targets for offline interrogation by condensing masses observed at multiple charge states and masses eluting over multiple scans into a single target that was selected at its time of maximum elution. For complete data accountability, every peak found by THRASH was stored in the AUTOMATION WAREHOUSE database.
Figure 1.
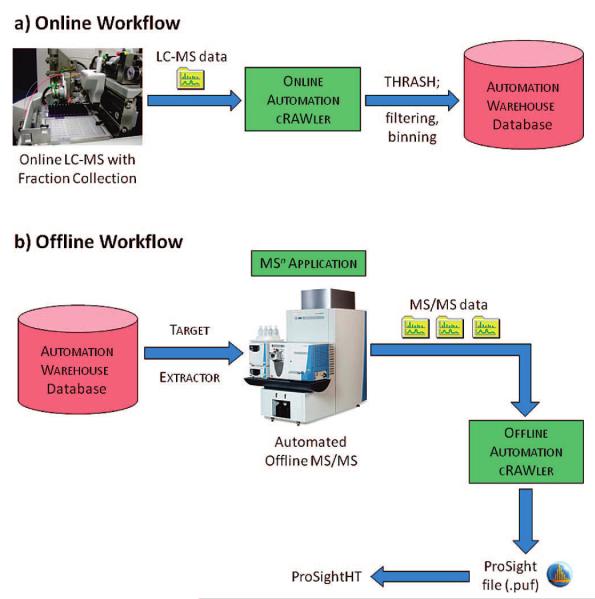
The workflow of the automation platform, with the online (a) and offline (b) portions separated. The AUTOMATION WAREHOUSE database is the link between the online and offline segments of the experiment.
A typical experimental result of the workflow for top-down is shown in Figure 2. First, an intact-only LC—MS run with no fragmentation is performed (Figure 2a), during which multiple species are isolated for detection (Figure 2b). Any given target is reisolated with a narrower m/z window in offline mode (Figure 2c) and subsequently fragmented (Figure 2d). ProSight analysis shows excellent fragmentation of several modified forms of intact human histone H4, the most abundant of which is N-terminally acetylated and dimethylated at lysine 20 (Figure 2e).
Figure 2.

An example of the online—offline strategy. A protein elutes approximately 37 min into the RPLC gradient, as depicted on the broadband ion trap base peak chromatogram (a). Zoom mapping generates an ion trap isolation window spectrum detected by FTMS, generating a high accuracy mass observation (b). After analysis of the online run, this species is automatically targeted for offline isolation (c) and fragmentation (d), both detected by FTMS. The top ProSight identification (e) shows robust fragmentation of human histone H4 that is acetylated at the N-terminus (or lysine 5) and dimethylated at lysine 20.
Top-Down Proteomics
For intact proteins obtained from acid-extracted HeLa nuclei, LC—MS (2 microscans) resulted in the system recognizing 535 targets above 25 signal-to-noise ratio (S/N) in the online, intact-only data. For the offline mode, the system set up an accurate mass list for these targets in 73 of the 99.7 μL fractions collected in the whole 96-well plate. Of the 535 species targeted, MS/MS experiments were actually performed on 382 by the instrument, yielding 305 top-down identifications with ProSight expectation scores below 10−5. Identified proteins ranged from 4–16 kDa (see Supporting Information for Microsoft Excel “offline top-down.xls” file from ProSightHT).
These 305 identifications from human HeLa cells collapse to 57 forms from 30 unique genes, including several for all core histones (H2A, H2B, H3, H4), high mobility group proteins (HMGA, HMGN2, HMGN1, HMGA1), ribosomal protein 40S, and small ribonucleoproteins. By comparison, an online zoom mapping with fragmentation run of the same sample yielded 16 identifications from 16 genes with expectation values ranging from 10−13 to 10−102 (see Supporting Information for Microsoft Excel “online top-down.xls” file from ProSightHT). Of these genes, 10 were unique to the online run.
Middle-Down Proteomics
Online RPLC was run directly on a Lys-C digest of HeLa nuclear lysate, with the column eluent automatically split and the TriVersa NanoMate collecting 99.7 μL fractions (a total of 96 fractions). Of these, 80 fractions were analyzed by automated MS/MS with an accurate mass target list obtained from peptides observed in the online run. A typical fraction is displayed in Figure 3, with a single scan shown in the center and six typical isolation windows shown as insets. Of the seven peptides identified from the six MS/MS spectra, expectation values ranged from 10−6 to 10−14, with one example of multiplexed identifications (bottom right).
Figure 3.

An example of the complexity in a typical middle-down human proteomics sample. Middle panel: offline FT mass spectrum (single scan) obtained from a 99.7 μL sample collected over 1 min of an LC—MS run. Seven peptides, all from unique proteins, were identified from these six isolation windows (insets), including an example of multiplexed identifications (bottom-right).
Data from all 1233 MS/MS experiments performed over the 80 fractions were iteratively searched with multiplexed searching enabled to intelligently manage multiple hits per spectrum. This resulted in identification of 256 peptides ranging from 1–13 kDa, of which 147 were unique, with expectation values from 10−5 to 10-84, (see Supporting Information for Microsoft Excel “offline middle-down.xls” file from ProSightHT). By comparison, an online data-dependent LC—MS/MS experiment of the same sample yielded 77 peptide identifications, of which 66 were unique (see Supporting Information for Microsoft Excel “online middle-down.xls” file from ProSightHT). Of the 66 peptide forms, 31 were unique to the online run.
In the most complex region of the chromatogram, 20–50 accurate mass targets were typically identified per well. Of the 147 unique peptides, 29 were modified with 25 of these being N-terminal acetylation. At 12 kDa, one exhaustive Lys-C peptide was particularly large (Figure 4), and the fragmentation data suggested two forms of the protein hnRNP A2/B1 (P22626) from the ProSight database. The hnRNP A2/B1 was known to harbor a monomethylation at Arg203, partially characterized in this study at ∼25% occupancy (Figure 4c) without any other modifications on this 130-residue segment of the protein.
Figure 4.

(a) A single scan FT mass spectrum of a fraction collected over 1 min of an LC—MS run. (b) FT mass spectrum (5 scans) of ions in an isolation window from targeting a 13 kDa species detected in the LC—MS run. (c) Expansion of the m/z 980–984 region of the data in part b, showing an exhaustive Lys-C peptide from the hnRNP A2/B1 protein identified in both its unmodified and monomethylated form. Of the 26 matching fragment ions observed, six were consistent with the known monomethylation at Arg203 that was stored in the ProSight database created for searching Lys-C peptide data. (d) ProSight fragment map of the methylated peptide form shown in part c.
Data Acquisition Times for High-Resolution MS/MS Spectra
For top-down, target abundances directed the system to choose between 25, 50, or 100 fragmentation scans. This, in turn, sets the overall data acquisition times (along with AGC and maximum injection time settings), which ranged from 2–13 min for intact protein samples. The data for a tray of 73 sample wells collected from the online LC—MS run took ∼15 h of instrument time to attempt 535 top-down MS/MS experiments. For middle-down, target abundances directed the system to choose between 10, 25, or 50 fragmentation scans. This resulted in MS/MS spectral acquisition times per target ranging from 1–5 min, translating to 36 h of instrument time to run the 1233 targets from the 80 fractions noted above. The duty cycle for this platform in the offline mode—the fraction of time the instrument is either accumulating or detecting ions for high-resolution MS1 or MS2 data acquisition—is typically over 90%.
DISCUSSION
There is no system currently available capable of acquiring ultrahigh-resolution tandem mass spectra with the sensitivity of an ion trap. Custom data acquisition systems have previously been developed but only for online bottom-up proteomics with low-resolution instruments (e.g., triple quadrupoles).45,46 Therefore, we have constructed an online—offline data acquisition system representing a significant advance toward using high-value mass spectrometer time automatically and more efficiently, with the midrange goal of increasing the number of unique proteins and peptides identified and characterized in complex mixtures. The AUTOMATION WAREHOUSE database functions as a high-resolution exclusion and inclusion list to support an entire proteome project.
The power of the automated system is demonstrated by comparison to more established online experiments for both top-down and middle-down human proteomics. This is illustrated with Venn diagrams in Figure 5. For top-down, the automated system identifies proteins from approximately twice as many genes than an online zoom mapping experiment (Figure 5a). However, when all protein forms were counted, the automated system identifies nearly 4 times as many (Figure 5b), exemplifying the superior characterization power of the platform. For middle-down, the automated system identifies well over twice as many peptide forms as a traditional data-dependent double-play experiment (Figure 5c).
Figure 5.

Venn diagrams (to scale) comparing traditional online experiments to the automated offline system. For top-down, approximately twice as many genes (a) and nearly 4 times as many protein forms (b) are identified with the new offline platform compared to an online-only approach. For middle-down (c), well over twice as many peptide forms are identified, including many co- and post-translational modifications.
Advanced Data Acquisition
The data acquisition system has a number of features uncommon in modern commercial software on both the source and mass spectrometer side. On the source side, the COM library included in Advion ChipSoft version 8 facilitates constant monitoring and dynamic control of electrospray conditions. Users can manually adjust the electrospray voltage and gas pressure in real time, but more importantly, the software automatically checks the electrospray current against user-specified thresholds before every scan. When the spray current is not within the user-specified range, the system executes a predefined sequence of actions until the current is restored to an acceptable level. This sequence of actions includes momentarily maximizing the gas pressure, obtaining more sample, retrieving a new tip, using a new nozzle, and finally skipping the current well, in that order. This represents an important advance in offline nanospray that is only possible due to the tight integration of the TriVersa NanoMate and the LTQ FT Ultra.
On the mass spectrometer side, the software performs a custom workflow to ensure the data acquisition system minimizes time wasted on targets unlikely to produce an identification. Before normal data acquisition begins, the system acquires a low number (usually one) of preview isolation scans on every target selected for offline interrogation. The purpose of this preview scan event is twofold: it allows the system to determine if the target detected online is present offline at sufficient absolute signal abundance to warrant further acquisition and to determine how many isolation and fragmentation scans should be acquired.
Both of the solutions above are by no means foolproof, but represent a significant advance toward emulating manual, human-controlled offline data acquisition. The overall outcome is a fully automated acquisition system at offline run time, operating continually for several days without intervention at the current stage of development.
Making “One-Hit Wonders” Routine
Expectation values for peptides that are ≤10−5 allow direct and error-tolerant identification of a protein without resorting to decoy/reverse database construction and searching47 or identifying multiple peptides from the same protein. Therefore, future comparisons of proteome coverage obtained by different data acquisition strategies will be interesting, as obtaining high-resolution MS/MS is contrasted with the lower-resolution MS/MS experiments that now dominate data acquisition for shotgun proteomics.
Offline Advantages
In performing the bulk of the data acquisition offline, the increased spray time can be used to average multiple scans with more ions accumulated before detection. An offline mode of operation also allows the prior information of the entire chromatographic run to be available in determining what to fragment; therefore, more intelligent decisions can be made in terms of when precursors should be fragmented and which charge state should be selected for MS/MS. Data analysis is also simplified because each target is acquired in a separate data file.
Although the abundance of precursors is typically reduced versus the maximal instantaneous concentration during elution (due to dilution and possibly sample degradation in sample wells), automated offline acquisition is still able to collect high-quality data often far superior to online LC—MS/MS for targets identified in both modes. The greatly increased time available during offline acquisition yields improved fragmentation through averaging spectra, as demonstrated in Figure 6 with human high mobility group protein 17 (expectation value online 10−3 versus offline 10−98). Additionally, automated offline acquisition expands the depth of the proteome’s dynamic range accessible with the characterization power of FTMS.
Figure 6.

A comparison of online (a; 6 scans) and offline (b; 25 scans) fragmentation for human high mobility group protein 17 (HMG-17), showing 95 orders-of-magnitude improvement in expectation value, turning a rejected hit into a confident identification. Offline acquisition affords the time for averaging multiple scans to improve fragmentation coverage in top-down and middle-down proteomics, facilitating protein/peptide identification and characterization by FTMS.
The ability to average scans offline also allows for routine multiplexed identifications. This occurred in 6% of the offline middle-down experiments attempted. When present at low abundance, 3–50 kDa precursor ions are particularly challenging to identify and characterize with MS/MS data obtained on a chromatographic time scale. Until mass spectrometers can produce such high-quality data sets at the resolution of a FT but with the speed and sensitivity of an ion trap, the current system now stands as a viable option for large-scale proteome projects.
Future Development
A critical development planned for the future is the linking of the ProSightHT database and the AUTOMATION WAREHOUSE database. Currently this feedback loop connecting prior database hits to future data acquisition runs must be performed manually. This enhancement will facilitate automated population of the AUTOMATION WAREHOUSE database with confident protein/peptide identifications, enabling it to function as a true high-resolution exclusion list for a proteome project. Well-characterized species in the database will be low priorities in the target selection stage, furthering the goal of increased proteome coverage using top-down and middle-down strategies.
Although the current system represents the state-of-the-art for automated offline mass spectrometry, there are numerous opportunities for improvement. One concept that has successfully been applied to similar platforms in the past is automated determination of fragmentation parameters based on empirical data.22,31,40 An even more sophisticated possibility is automated dynamic adjustment of those parameters based on data surveyed in real time. Also promising is decision-making based on real-time spectral analysis in order to determine when averaging more scans is producing diminishing returns in terms of the number of new fragment ions or significant improvement in database retrieval scores,22 further optimizing the use of instrument time. Stahl et al. pioneered this concept using either the total ion current (TIC) of the most recent product ion spectrum or “spectrum reproducibility,” based on the abundance of the top three fragment peaks, depending on the sample levels.39
In the future, it is critical that this system be compared to another promising route, the use of “smart” LC—MS/MS using data acquisition software that makes sophisticated decisions on-the-fly. Although commercial instrument firmware has progressed greatly in recent years, making concepts such as data-dependent acquisition, inclusion/exclusion lists, and neutral-loss experiments routine, there are several other advanced strategies to be implemented to better use high-value instrument time. Recent development of “decision tree” proteomics, where the fragmentation method is determined in real time based on precursor m/z and charge state, represents a significant first step toward this goal.48 In the future, such rapid experimental logic could be extended, for example, by querying a proteome project-wide database before deciding on fragmentation targets. The advantage of such a platform would mean workflows would be left relatively unchanged from current LC—MS/MS, although there is undoubtedly a limit to the proteomic depth achievable with online MS/MS alone, particularly with top-down and middle-down using contemporary instrumentation. For some applications, the recently introduced concept of a “replay” run may be a feasible alternative that lies between a completely offline or completely online approach.49
Extensibility
Although our focus is clearly top-down and middle-down analysis of proteomic samples with Fourier transform ion cyclotron resonance (FTICR) MS, the platform functions interchangeably with the Thermo Scientific LTQ Orbitrap or even standalone LTQ linear ion trap instruments. Additionally, the system could be adapted for other types of samples, such as small molecules or small peptides (i.e., bottom-up proteomics; Luo et al. recently noted the limitations of data-dependent acquisition in a shotgun experiment50), without much effort. We introduce this automated online—offline engine as a general approach to acquire high-quality, information-rich tandem mass spectra for species not identified or characterized on a chromatographic time scale.
Supplementary Material
ACKNOWLEDGMENT
The authors thank the National Institutes of Health (Grant GM 067193-06 to N.L.K.) and the Packard Foundation for support. We are grateful to Weihua Wang, Eric Hemenway, and Michael Senko at Thermo Fisher Scientific in San Jose, CA, for their work on the LTQ COM library for instrument control and Michael Lees and Simon Prosser at Advion BioSciences for their work on the TriVersa NanoMate ChipSoft software. We also thank Kelleher group members and particularly those on the ProSight development team, including Shannee Babai, Leonid Zamdborg, and Bryan Early.
Footnotes
SUPPORTING INFORMATION AVAILABLE An extended description of custom software and workflow is available, as well as Microsoft Excel .xls files from ProSightHT of top-down and middle-down identifications from online and offline runs. This material is available free of charge via the Internet at http://pubs.acs.org.
References
- (1).Aebersold R, Mann M. Nature. 2003;422:198–207. doi: 10.1038/nature01511. [DOI] [PubMed] [Google Scholar]
- (2).Kelleher NL. Anal. Chem. 2004;76:197A–203A. [PubMed] [Google Scholar]
- (3).Zubarev RA, Kelleher NL, McLafferty FW. J. Am. Chem. Soc. 1998;120:3265–3266. [Google Scholar]
- (4).Syka JE, Coon JJ, Schroeder MJ, Shabanowitz J, Hunt DF. Proc. Natl. Acad. Sci. U.S.A. 2004;101:9528–9533. doi: 10.1073/pnas.0402700101. [DOI] [PMC free article] [PubMed] [Google Scholar]
- (5).LeBlanc JC, Hager JW, Ilisiu AM, Hunter C, Zhong F, Chu I. Proteomics. 2003;3:859–869. doi: 10.1002/pmic.200300415. [DOI] [PubMed] [Google Scholar]
- (6).Syka JEP, Marto JA, Bai DL, Horning S, Senko MW, Schwartz JC, Ueberheide B, Garcia B, Busby S, Muratore T, Shabanowitz J, Hunt DF. J. Proteome Res. 2004;3:621–626. doi: 10.1021/pr0499794. [DOI] [PubMed] [Google Scholar]
- (7).Makarov A, Denisov E, Kholomeev A, Balschun W, Lange O, Strupat K, Horning S. Anal. Chem. 2006;78:2113–2120. doi: 10.1021/ac0518811. [DOI] [PubMed] [Google Scholar]
- (8).Olsen JV, de Godoy LMF, Li G, Macek B, Mortensen P, Pesch R, Makarov A, Lange O, Horning S, Mann M. Mol. Cell. Proteomics. 2005;4:2010–2021. doi: 10.1074/mcp.T500030-MCP200. [DOI] [PubMed] [Google Scholar]
- (9).Macek B, Waanders LF, Olsen JV, Mann M. Mol. Cell. Proteomics. 2006;5:949–958. doi: 10.1074/mcp.T500042-MCP200. [DOI] [PubMed] [Google Scholar]
- (10).Yates JR, Cociorva D, Liao L, Zabrouskov V. Anal. Chem. 2006;78:493–500. doi: 10.1021/ac0514624. [DOI] [PubMed] [Google Scholar]
- (11).McAlister GC, Phanstiel D, Good DM, Berggren WT, Coon JJ. Anal. Chem. 2007;79:3525–3534. doi: 10.1021/ac070020k. [DOI] [PMC free article] [PubMed] [Google Scholar]
- (12).Good DM, Wirtala M, McAlister GC, Coon JJ. Mol. Cell. Proteomics. 2007;6:1942–1951. doi: 10.1074/mcp.M700073-MCP200. [DOI] [PubMed] [Google Scholar]
- (13).Forbes AJ, Mazur MT, Patel HM, Walsh CT, Kelleher NL. Proteomics. 2001;1:927–933. doi: 10.1002/1615-9861(200108)1:8<927::AID-PROT927>3.0.CO;2-T. [DOI] [PubMed] [Google Scholar]
- (14).Quadroni M, James P. Electrophoresis. 1999;20:664–677. doi: 10.1002/(SICI)1522-2683(19990101)20:4/5<664::AID-ELPS664>3.0.CO;2-A. [DOI] [PubMed] [Google Scholar]
- (15).Bakalarski CE, Haas W, Dephoure NE, Gygi SP. Anal. Bioanal. Chem. 2007;389:1409–1419. doi: 10.1007/s00216-007-1563-x. [DOI] [PubMed] [Google Scholar]
- (16).Haas W, Faherty BK, Gerber SA, Elias JE, Beausoleil SA, Bakalarski CE, Li X, Villén J, Gygi SP. Mol. Cell. Proteomics. 2006;5:1326–1337. doi: 10.1074/mcp.M500339-MCP200. [DOI] [PubMed] [Google Scholar]
- (17).Marshall AG, Hendrickson CL, Jackson GS. Mass Spectrom. Rev. 1998;17:1–35. doi: 10.1002/(SICI)1098-2787(1998)17:1<1::AID-MAS1>3.0.CO;2-K. [DOI] [PubMed] [Google Scholar]
- (18).Solouki T, Marto JA, White FM, Guan S, Marshall AG. Anal. Chem. 1995;67:4139–4144. doi: 10.1021/ac00118a017. [DOI] [PubMed] [Google Scholar]
- (19).Solouki T, Paša-Tolíc L, Jackson GS, Guan S, Marshall AG. Anal. Chem. 1996;68:3718–3725. doi: 10.1021/ac960312d. [DOI] [PubMed] [Google Scholar]
- (20).Hofstadler SA, Wahl JH, Bruce JE, Smith RD. J. Am. Chem. Soc. 1993;115:6983–6984. [Google Scholar]
- (21).Valaskovic GA, Kelleher NL, McLafferty FW. Science. 1996;273:1199–1202. doi: 10.1126/science.273.5279.1199. [DOI] [PubMed] [Google Scholar]
- (22).Johnson JR, Meng F, Forbes AJ, Cargile BJ, Kelleher NL. Electrophoresis. 2002;23:3217–3223. doi: 10.1002/1522-2683(200209)23:18<3217::AID-ELPS3217>3.0.CO;2-K. [DOI] [PubMed] [Google Scholar]
- (23).Parks BA, Jiang L, Thomas PM, Wenger CD, Roth MJ, Boyne MT, II, Burke PV, Kwast KE, Kelleher NL. Anal. Chem. 2007;79:7984–7997. doi: 10.1021/ac070553t. [DOI] [PMC free article] [PubMed] [Google Scholar]
- (24).Purvine S, Eppel J-T, Yi EC, Goodlett DR. Proteomics. 2003;3:847–850. doi: 10.1002/pmic.200300362. [DOI] [PubMed] [Google Scholar]
- (25).Venable JD, Dong M-Q, Wohlschlegel J, Dillin A, Yates JR., III Nat. Methods. 2004;1:39–45. doi: 10.1038/nmeth705. [DOI] [PubMed] [Google Scholar]
- (26).Roth MJ, Forbes AJ, Boyne MT, II, Kim Y-B, Robinson DE, Kelleher NL. Mol. Cell. Proteomics. 2005;4:1002–1008. doi: 10.1074/mcp.M500064-MCP200. [DOI] [PMC free article] [PubMed] [Google Scholar]
- (27).Patrie SM, Robinson DE, Meng F, Du Y, Kelleher NL. Int. J. Mass Spectrom. 2004;234:175–184. [Google Scholar]
- (28).Zhang Z, Marshall AG. J. Am. Soc. Mass Spectrom. 1998;9:225–233. doi: 10.1016/S1044-0305(97)00284-5. [DOI] [PubMed] [Google Scholar]
- (29).Mann M, Meng CK, Fenn JB. Anal. Chem. 1989;61:1702–1708. [Google Scholar]
- (30).Horn DM, Zubarev RA, McLafferty FW. J. Am. Soc. Mass Spectrom. 2000;11:320–332. doi: 10.1016/s1044-0305(99)00157-9. [DOI] [PubMed] [Google Scholar]
- (31).Patrie SM, Ferguson JT, Robinson DE, Whipple D, Rother M, Metcalf WM, Kelleher NL. Mol. Cell. Proteomics. 2006;5:14–25. doi: 10.1074/mcp.M500219-MCP200. [DOI] [PubMed] [Google Scholar]
- (32).Davis MT, Stahl DC, Hefta SA, Lee TD. Anal. Chem. 1995;67:4549–4556. doi: 10.1021/ac00120a019. [DOI] [PubMed] [Google Scholar]
- (33).Davis MT, Lee TD. J. Am. Soc. Mass Spectrom. 1997;8:1059–1069. [Google Scholar]
- (34).Davis MT, Lee TD. J. Am. Soc. Mass Spectrom. 1998;9:194–201. doi: 10.1016/S1044-0305(97)00282-1. [DOI] [PubMed] [Google Scholar]
- (35).Annan RS, Huddleston MJ, Verma R, Deshaies RJ, Carr SA. Anal. Chem. 2001;73:393–404. doi: 10.1021/ac001130t. [DOI] [PubMed] [Google Scholar]
- (36).Zappacosta F, Huddleston MJ, Karcher RL, Gelfand VI, Carr SA, Annan RS. Anal. Chem. 2002;74:3221–3231. doi: 10.1021/ac025538x. [DOI] [PubMed] [Google Scholar]
- (37).Li X, Fekete A, Englmann M, Frommberger M, Lv S, Chen G, Schmitt-Kopplin P. Anal. Bioanal. Chem. 2007;389:1439–1446. doi: 10.1007/s00216-007-1524-4. [DOI] [PubMed] [Google Scholar]
- (38).Taylor GK, Kim Y-B, Forbes AJ, McCarthy R, Kelleher NL. Anal. Chem. 2003;75:4081–4086. doi: 10.1021/ac0341721. [DOI] [PubMed] [Google Scholar]
- (39).LeDuc RD, Taylor GK, Kim Y-B, Januszyk TE, Bynum LH, Sola JV, Garavelli JS, Kelleher NL. Nucleic Acids Res. 2004;32:W340–W345. doi: 10.1093/nar/gkh447. [DOI] [PMC free article] [PubMed] [Google Scholar]
- (40).Zamdborg L, LeDuc RD, Glowacz KJ, Kim Y-B, Viswanathan V, Spaulding IT, Early BP, Bluhm EJ, Babai S, Kelleher NL. Nuclei Acids Res. 2007;35:W701–W706. doi: 10.1093/nar/gkm371. [DOI] [PMC free article] [PubMed] [Google Scholar]
- (41).LeDuc RD, Kelleher NL. Curr. Protoc. Bioinformatics. 2007 doi: 10.1002/0471250953.bi1306s19. unit 13.6. [DOI] [PubMed] [Google Scholar]
- (42).Pesavento JJ, Kim Y-B, Taylor GK, Kelleher NL. J. Am. Chem. Soc. 2004;126:3386–3387. doi: 10.1021/ja039748i. [DOI] [PMC free article] [PubMed] [Google Scholar]
- (43).Roth MJ, Parks BA, Ferguson JT, Boyne MT, II, Kelleher NL. Anal. Chem. 2008;80:2857–2866. doi: 10.1021/ac800141g. [DOI] [PMC free article] [PubMed] [Google Scholar]
- (44).Meng F, Cargile BJ, Miller LM, Forbes AJ, Johnson JR, Kelleher NL. Nat. Biotechnol. 2001;19:952–957. doi: 10.1038/nbt1001-952. [DOI] [PubMed] [Google Scholar]
- (45).Stahl DC, Swiderek KM, Davis MT, Lee TD. J. Am. Soc. Mass Spectrom. 1996;7:532–540. doi: 10.1016/1044-0305(96)00057-8. [DOI] [PubMed] [Google Scholar]
- (46).Ducret A, Van-Oostveen I, Eng JE, Yates JR, III, Aebersold R. Protein Sci. 1998;7:706–719. doi: 10.1002/pro.5560070320. [DOI] [PMC free article] [PubMed] [Google Scholar]
- (47).Elias JE, Haas W, Faherty BK, Gygi SP. Nat. Methods. 2005;2:667–675. doi: 10.1038/nmeth785. [DOI] [PubMed] [Google Scholar]
- (48).Swaney DL, McAlister GC, Coon JJ. Nature Methods. accepted for publication. [Google Scholar]
- (49).Waanders LF, Almeida R, Prosser S, Cox J, Eikel D, Allen MH, Schultz GA, Mann M. Mol. Cell. Proteomics. 2008;7:1452–1459. doi: 10.1074/mcp.M800141-MCP200. [DOI] [PMC free article] [PubMed] [Google Scholar]
- (50).Luo W, Slebos RJ, Hill S, Li M, Brábek J, Amanchy R, Chaerkady R, Pandey A, Ham A-JL, Hanks SK. J. Proteome Res. 2008;7:3447–3460. doi: 10.1021/pr800187n. [DOI] [PMC free article] [PubMed] [Google Scholar]
Associated Data
This section collects any data citations, data availability statements, or supplementary materials included in this article.