

Introductory Paragraph
Though gene and protein measurements have been used to determine therapeutic action 1, develop diagnostic tests 2, and distinguish disease subtypes 3,4, they do not characterize a sample's entire phenotype, environmental, or experimental context. Here we comprehensively consider associations between components of phenotype and environment and genes to identify genes that may govern phenotype and our response to the environment. Context from the annotations of gene expression data sets in the Gene Expression Omnibus is represented using the Unified Medical Language System, a compendium of biomedical vocabularies with nearly one-million concepts. After showing how data sets can be clustered by annotative concepts, we find a network of relations between phenotypic, disease, environmental, and experimental context and genes with differential expression associated with these concepts. We identify novel genes related to concepts such as aging. Comprehensively identifying genes related to phenotype and environment is a step towards the Human Phenome Project. 5
Main text
In considering a sample of cancer, such as one extracted from a patient's lung tumor, there remain other aspects to the patient and sample besides its gene expression and proteomic pattern, such as phenotype and clinical history (e.g. chief complaint of hemoptysis, family history, or tumor size), environmental exposures (e.g. duration of exposure to asbestos or cigarette smoke), and experimental conditions (e.g. anesthesia or sample preparation). It is well known that these snapshots of genomic or physiological state cannot solely represent the entire envirome, here broadened from the initial definition by Anthony, et al., as the totality of equivalent environmental influences contributing to mental disorders, to include all disorders and organisms,6 and phenome, the physical totality of all traits of an organism as defined by Mahner and Kary,5,7 of the sample and organism.
Relations between enviromic concepts and phenomic concepts have been invaluable to medicine. For example, one such relation is the association of environmental exposure to cigarette smoke with the phenotype of lung cancer development. Comprehensively relating specific concepts in the envirome and phenome to specific genes could lead to the identification of new disease-associated genes.5 Though some phenomic data is available,8 it is greatly overshadowed in size by the 50,000+ microarray measurements in repositories such as the Gene Expression Omnibus (GEO).9 Even for microarray data stored in standardized formats like MIAME and MAGE-ML,10,11 contextual annotations are represented by unstructured narrative text; determining the phenotype and environmental context is no longer a tractable manual process. A question we have sought to answer is whether prior investments in biomedical ontologies can provide leverage in finding phenome-genome and envirome-genome relations. We show here that a large set of phenome-genome and envirome-genome relations can be found within a public repository of transcriptome measurements, if the phenotypes and environmental context can be ascertained for each experiment, along with the expression measurements. We addressed this by creating a system that extracts contextual concepts from the sample annotations in GEO, represents these concepts using the Unified Medical Language System (UMLS), unifies the gene expression measurements across data sets using LocusLink, and finally relates the gene expression measurements to the contextual concepts (Fig. 1). UMLS is the largest available compendium of biomedical vocabularies, containing over 60 biomedical vocabularies with approximately one million inter-related concepts.12 UMLS already unifies vocabularies used in molecular biology and genomics, such as the Medical Subject Headings (MeSH), NCBI Taxonomy, and the Gene Ontology, with medical vocabularies including the International Classification of Diseases and SNOMED International.9,13,14
Figure 1.

The method of extracting and relating genome, phenome and envirome data from GEO data sets. Step 1: seven fields of annotations representing the phenotype, environmental and experimental context from GEO samples, series, and data sets are parsed and mapped to UMLS concepts. Step 2: GEO platforms are manually related to LocusLink identifiers, allowing the same genes to be related across platforms. Step 3: gene expression measurements are rank-normalized within each GEO sample, then averaged across each GEO series. Step 4: mean expression measurements for each gene in each GEO data set were related to the concepts mapped from each GEO data set.
Results
After manual elimination of incorrectly assigned concepts, described in Methods and Supplementary Note online, mappings to 4,127 UMLS concepts remained (from 296,843 mappings to 5,115 strings). Concepts were from 18 source vocabularies, with MeSH (23%), Read Codes (17%), and SNOMED International (14%) contributing the most. The GEO series description annotation was the most information-rich, as it provided the most unique concepts (Supplementary Table online). This was likely because GEO series descriptions are often dissimilar to each other, compared to sample descriptions, which are often repeated. As expected, the concepts mapping to the most annotations are Cells and RNA (Table 1).
Table 1.
The top 50 UMLS concepts mapped to GEO annotations, after gross mapping errors were removed (described in Supplemental Note online). Column 3 indicates the number of mappings between a GEO annotation and the concept. Column 4 indicates the reason why several concepts were incorrectly mapped. Blanks indicate correctly chosen concepts.
| CUI | Concept Name | Count | Explanation |
|---|---|---|---|
| C0007634 | Cells | 3275 | |
| C0035668 | RNA | 2591 | |
| C0042153 | Utilization | 2383 | Correct. From the words “use” and “using” |
| C0025914 | House mice | 1738 | Too specific. From the word “mouse” |
| C0025929 | Laboratory mice | 1738 | Too specific. From the word “mouse” |
| C0441621 | Sampling - Surgical action | 1657 | Incorrect. A surgical procedure to remove, from the word “sample” |
| C0870078 | Sampling | 1657 | |
| C0332307 | With type | 1559 | Incorrect. From the phrases “type” and “wild-type” |
| C0439810 | Total | 1403 | |
| C0445392 | Wild | 1388 | Incorrect. Should have mapped to Wild-type genetics (C0678926) |
| C0037585 | Computer software | 1307 | |
| C1167624 | Labeling | 1231 | Incorrect. Stigmatizing an individual; should have mapped to Staining and Labeling (C0886517) |
| C0439227 | Hour | 1190 | Often correct. Sometimes incorrectly mapped for abbreviations such as “Protein H”, and “H. pylori” |
| C0439228 | Day | 1171 | Often correct. Sometimes incorrectly mapped for abbreviations such as “DS domain”, “oligo d(T)” |
| C0205397 | Seen | 1126 | Correct. From the word “saw” |
| C0042789 | Vision | 1124 | Imprecise. From the word “saw” |
| C0205173 | Duplicate | 1002 | |
| C0333052 | Version, NOS | 986 | Incorrect. A type of surgical manipulation; the most appropriate concept would be Editions (C0441792) |
| C0439232 | Minute of time | 953 | |
| C0441633 | Scanning | 946 | |
| C0243148 | Control | 918 | Incorrect. An attribute, like image control or volume control; should have mapped to Control Groups (C0009932) |
| C0086418 | Homo sapiens | 903 | |
| C0020114 | Human | 877 | |
| C0439242 | mL | 868 | |
| C0337051 | Pool, NOS | 849 | Incorrect. A body of water; the most appropriate concept would be Combination (C0205195) |
| C0080194 | Muscle strain | 848 | Incorrect. From the word “strain” |
| C0040300 | Tissues | 825 | |
| C0020202 | Hybridization, Genetic | 802 | |
| C0449945 | Strain typing | 793 | |
| C0681814 | experiment | 793 | |
| C0017337 | Genes | 790 | |
| C0026809 | Mus | 786 | |
| C0596988 | mutant | 786 | |
| C0205307 | Normal | 743 | |
| C0205409 | Isolated | 733 | Incorrect. Meaning a finding by itself, from phrases such as “we isolated DNA”; the most appropriate concept would be Purification (C0243114) |
| C0001779 | Age, NOS | 731 | |
| C0026845 | Muscle | 728 | Often correct. Sometimes incorrectly mapped for “Mus” |
| C0596981 | Muscle Cells | 727 | |
| C0185117 | Expression, NOS | 722 | Incorrect. A subtype of surgical manipulation; should have mapped to Gene Expression (C0017262) |
| C0024554 | Male gender | 717 | |
| C0683312 | categories | 678 | |
| C0040223 | Time | 629 | |
| C0002778 | Analysis of substances | 610 | |
| C0936012 | Analysis | 610 | |
| C0004561 | B-Lymphocytes | 601 | |
| C0443050 | Robinson | 598 | Incorrect. A named strain of organism; from the author “Mark D. Robinson” |
| C0010453 | Anthropological Culture | 593 | Incorrect. From the word “culture” |
| C0220814 | Cultural | 593 | Incorrect. From the word “culture” |
| C0430400 | Laboratory culture | 593 | |
| C0009253 | Coitus | 587 | Incorrect. From the word “sex” |
Parsing failed on too short annotations, containing only laboratory identifiers and few recognizable words, or too long for parsing to complete. Regardless, over 99% of GEO samples were successfully directly mapped to at least one UMLS concept; the remainder were subordinate to a GEO series with annotations mapping to concepts. Thus, every GEO sample can be mapped either directly to concepts, or indirectly through its parent GEO series. Similarly, every GEO data set could be mapped to concepts, either directly through the GEO data set annotations, or indirectly through subordinate series and sample annotations.
We created a taxonomy of eleven types of errors seen in determining concepts from annotations, in three broad categories: GEO annotations, UMLS vocabularies, or text processing (Table 2). Three significant errors are listed here. Several important concepts in molecular biology experimentation are missing in UMLS, including “phosphate-buffered saline”, “transgenic”, and “growth medium”. Company names and protocol details falsely map to concepts. For example, the phrase “Axon Instruments (Foster City, California)” maps to Axon and Fostering, related to foster homes. Many annotations include the entire MIAME check-list,10 literally beginning with “The MIAME Checklist...”, so the salient details cannot be parsed.
Table 2.
Taxonomy of mistakes in concept mapping.
| Error | Representative example |
|---|---|
| Errors in GEO text | |
| Poor text formatting | GEO series 91 description lists “...gene expression. <BR> <LI><u>Brain:</u>”, yet the GEO file format does not specify that descriptions written using the Hypertext Markup Language are allowed. “<li>” maps to the concept Lithium. |
| Unfortunate choice of experimental identifiers | GEO sample 6751 title lists “Ova A/J 3” which maps to the concept Ovum (), while the investigators used “Ova” to abbreviate “ovalbumen.” |
| Irrelevant text in GEO | Over seventy GEO samples reproduce the entire MIAME check list in their descriptions, literally beginning with “The MIAME Checklist Experiment Design...”; these are too long to be parsed by our software. |
| Spelling errors in GEO text | GEO sample 4100 source lists “murine subcontaneous adipose” instead of “subcutaneous” |
| Errors in UMLS | |
| Missing concepts in UMLS | “PBS” maps to the concepts Lead (the element), Lead (a homeopathic remedy), and Peripheral Blood, but there is no available concept for phosphate-buffered saline |
| Missing synonym variants in UMLS | The term “wild type,” (without a dash) is used in over 400 GEO samples, series and data sets. The most appropriate concept is wild-type genetics, but there is no listed synonym for “wild type”, so this term instead maps to Wild, a subtype of serotype typing. |
| Errors in parsing | |
| Mapping to unlisted concepts | MetaMap created 21,867 mappings using 465 string unique identifiers that were not present in our subset of UMLS. |
| Abbreviation errors | The term “CGS,” from the compounds CGS 23425, a thyroid hormone analog, and CGS 21680, a selective agonist for an adenosine receptor, maps to colloid goiter. |
| Mistaken identity from experimental description | GEO sample 12011 description lists “...GenePix software analysis... Axon Instruments...” which maps to the concept Axon. |
| Mismatch of semantic-type | Over five-hundred sample descriptions use the phrase “spot quality assessment,” which maps to the disease concept Exanthema, or “spots”. |
| Inappropriate lexical variant processing | GEO sample 51 description lists “...Gene expression profile in developing mouse cerebellum at postnatal day 7”, internally maps to abbreviation “PND”, which then maps to Paroxysmal Dyspnea (commonly also abbreviated PND) |
To verify that data sets with similar context could now be considered similar mathematically, we clustered the data sets using the directly and indirectly mapped concepts (Fig. 2a). Qualitative examination of the tree revealed multiple branches where similar concepts were used in annotations from a single submitter, while other branches indicated successful clustering of similar data sets from multiple submitters. For example, muscle expression data used to study inflammatory myopathy, muscular dystrophy, aging, and dermatomyositis clustered together, even though these were from three different submitters (Fig. 2b).
Figure 2.

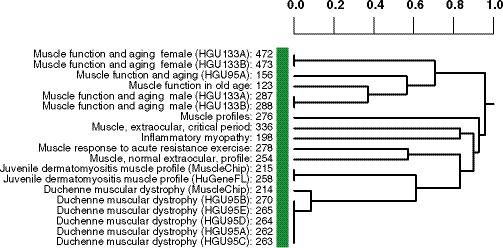
Hierarchical clustering of 448 GEO data sets by context, created by treating each as data set as a vector representing the presence or absence of a mapping from that data set to each UMLS concept, then calculating binary distance between data sets and clustering using complete linkage. (a) A total of 6,612 samples are represented in these data sets. The numeral 1 indicates a cluster with 33 data sets, all from the Alliance for Cellular Signaling, with almost identical experimental methods. (b) A magnified view of the cluster indicated by numeral 2 is shown. Numbers to the right of data set titles indicate GDS accession numbers. Within the cluster, muscle samples studied with respect to aging cluster together. Samples from inflammatory myopathy, muscular dystrophy, and dermatomyositis also cluster together. The 19 data sets in this cluster were contributed to GEO by three different submitters.
We then sought relationships between specific genes and annotative concepts, where a gene shows a statistically significant difference in expression level between data sets annotated with that concept and data sets not annotated with the concept. We controlled for multiple comparison testing by calculating q-values for each relation, or the proportion of false positive relations expected if the given relation were significant.15 We used two separate methods to reduce the noise associated with errors in concept assignment: (1) keeping only those gene-concept relations demonstrated in two or more species, and (2) keeping only those relations with a very low q-value.
Our first method to heighten stringency was to consider only those gene-concept relations where a second relation was present between the same concept and an orthologous gene, assuming functional identity for orthologous genes. This resulted in relations between 444 genes and 46 concepts, which were graphically visualized as a phenome-genome network (Fig. 3a). Four of the top five connected concepts were related to muscle, such as Skeletal Muscle, with 128 genes (38 human, 40 mouse, and 50 rat) showing significantly increased expression level in data sets annotated with these concepts and 40 decreasing genes (6 human, 18 mouse, and 16 rat) with decreased expression level (Fig. 3b). Many of these genes are known to be uniquely expressed in muscle, including Tnni1, Mybpc1, Mybph, and Pgam2; Pnliprp1, Chad, and Fgb are expressed in a few tissues including muscle. Human Pdlim3 shows the greatest differential expression between the 8 data sets annotated with the concept Muscle Cells (average normalized expression level 0.968) and the 34 data sets measuring this transcript without such an annotation (expression level 0.340), a highly significant difference by t-test with p < 1.2 × 10⁻¹⁶, with q < 0.0002 across 100 permutations of mappings between data sets and the annotated concept (Fig. 3c). A similar pattern is seen for mouse Pdlim3 (Fig. 3d, p < 6 × 10⁻⁸, q = 0.0025). Pdlim3 is thought to play a role in skeletal muscle development.16 Mouse Pdlim3 is most highly expressed in skeletal muscle, compared to 21 other tissues with EST count data in the NCBI UniGene,9 and 60 other tissues in the GNF SymAtlas panel of microarray expression measurements by Su, et al.17
Figure 3.
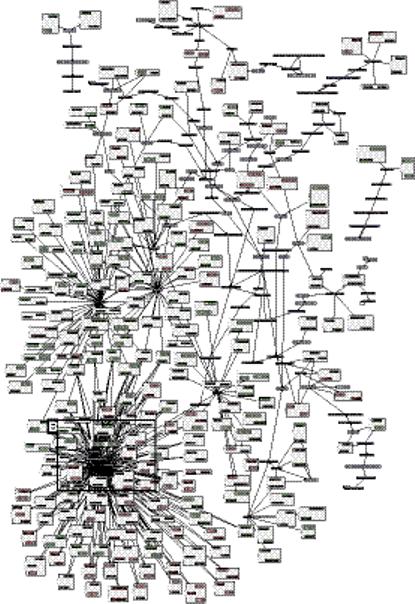
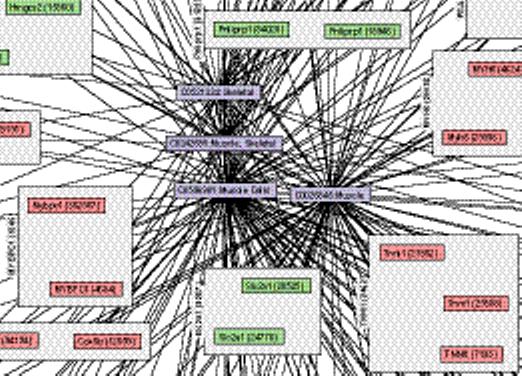
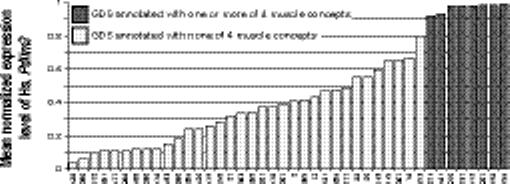
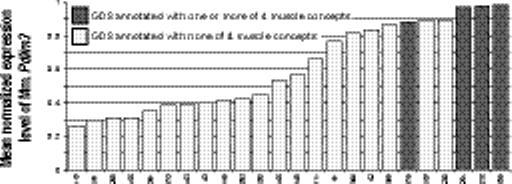
Network of relations between 46 biomedical concepts extracted from the annotations of data sets in Gene Expression Omnibus and 444 genes with differential expression associated with the presence or absence of the concept. (a) Light blue nodes are UMLS concepts. Pink nodes are genes with higher expression levels in data sets annotated with their related concept; light green nodes are genes with lower expression levels in annotated data sets. Pink and green nodes are contained within gray squares indicating ortholog families. Edges (dashed) between an ortholog family and concept indicate statistically significant relations between that concept and each included gene. The remaining edges (solid arrows) indicate existing hierarchical relations between UMLS concepts. (b) Muscle Cells and three related concepts were among the most highly connected concepts, and relate to increased Myh6, Mybpc1, Mybph, Tnni1, and other genes. (c) Of the human genes related to Muscle Cells, Pdlim3 shows the greatest differential expression. There is a significant increase in the normalized expression of Pdlim3 in the 8 data sets annotated with Muscle Cells (dark shaded bars) compared with the 34 data sets without (light shaded bars). X-axis labels indicate GEO data set numbers. (d) A similar significant pattern of association with Muscle Cells is seen with mouse Pdlim3.
To quantitate the sensitivity and validate the significance of these relations, we compared the list of genes related to the four muscle-related concepts with two lists of transcripts previously measured through sequencing or microarrays as being expressed in muscle. Of the 40 mouse transcripts found to have increased expression in data sets associated with the muscle concepts, 27 were also highly expressed transcripts in muscle in microarray measurements in the GNF SymAtlas,17 and 18 were sequenced from the mouse skeletal muscle library dbEST 8902.9 In total, at least 31 (78%) of the 40 mouse transcripts related to muscle could be independently validated.
However, only considering relations between concepts and ortholog families can be too restrictive. Few diseases have been studied in both human and model animals, and microarray data may not yet be available for both. Thus, we separately used a second approach to heighten stringency by considering only the most reliable gene-concept relations, defined as having a q-value ≤ 1%. This resulted in 64,003 relations between 281 biomedical concepts and 7,466 genes.
We explain here several of these relations involving phenotypic or environmental concepts. These relations were manually validated to ensure each of these concepts was mapped correctly to an annotation. We found 11 genes related to Aging. The mean normalized expression level of H6pd, the H form of glucose-6-phosphate dehydrogenase, drops from 0.90 in the 4 data sets annotated with Aging to 0.71 in the 35 data sets without the annotation (Fig. 4a, p = 1.2 × 10⁻⁶, q = 0.01). Glucose-6-phosphate dehydrogenase activity is known to increase with age in rat brain and other tissues.18,19 Some individuals with G6PDH deficiency have been noted to have reduced mortality from cardiovascular disease and have increased longevity, though this is associated with the X-linked gene.20
Figure 4.
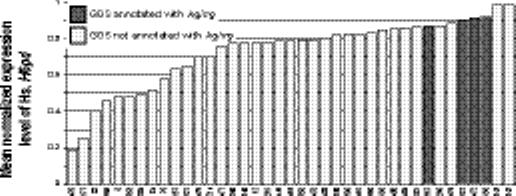
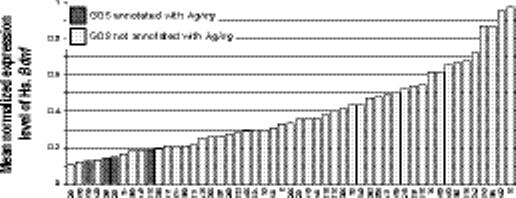
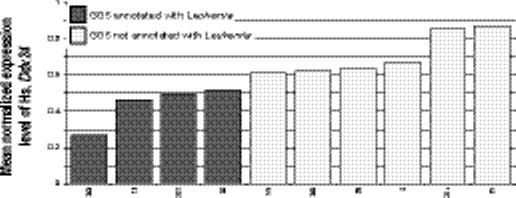
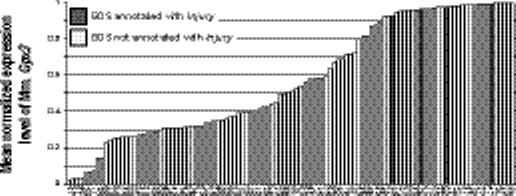
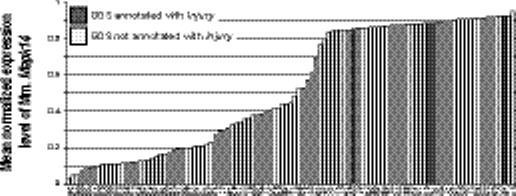
Example relations between genes and phenotypes and environment. (a) The mean normalized expression level of human H6pd is higher in the 4 data sets annotated with Aging (dark shaded bars) compared with the 35 data sets without (light shaded bars). X-axis labels indicate GEO data set numbers. (b) An opposite pattern is seen in the relation between Aging and human Bdnf. (c) Human Ddx24 is lower in GEO data sets annotated with Leukemia. (e) Mouse Gpx3 and (f) Mapk14 both shown a significant increase in expression in data sets with an annotation mapped to the concept Injury.
Bdnf was less expressed in the 4 data sets annotated with Aging compared with 47 non-annotated data sets (Fig. 4b, p = 7.3 × 10⁻¹⁰, q < 0.0001); Bdnf has been previously shown to have a significant drop in expression in human skin fibroblasts associated with advancing age.21 The other nine genes, including Tnnt1, Synj1, Tada2l, Slc7a2, Mgat2, and Kctd2, have no previously established association with aging, though Tnnt1 and Mgat2 have been associated with nemaline myopathy and type 2a congenital disorder of glycosylation, respectively. A decrease in Tnnt1 and an increase in Synj1 have been found to be associated with differentiation from human embryonic and hematopoetic stem cells, respectively.22,23
We found gene-concept relations for other phenotypic concepts, including diseases. The only gene relating to Leukemia is Ddx24; mean normalized expression of Ddx24 drops from 0.71 in the 6 data sets measuring this gene not associated with Leukemia to 0.44 in the 4 data sets with the annotation (Fig. 4c, p = 0.007, q = 0.01). Interestingly, this gene was first cloned from a leukemia cDNA library.24
The concept of Injury represents an environmental annotation and was related only to Gpx3 (plasma glutathione peroxidase) and Mapk14 (mitogen-activated protein kinase 14). Both demonstrate a significant increase in mean normalized expression levels in the four data sets associated with Injury compared with over 100 other data sets measuring these genes without this annotation (Fig. 4d and 4e, Gpx3 increases from 0.56 to 0.97; Mapk14 increases from 0.52 to 0.89; for both, p < 1 × 10⁻¹⁵ and q < 0.0002). Both genes have been shown to be related to injury of various forms. Increased expression of plasma glutathione peroxidase has been shown to be protective against toxic injury to the liver,25 presumably by preventing damaging effects of reactive oxygen species. Plasma glutathione peroxidase activity significantly drops after burn injury, and rises after spinal cord injury.26,27 The mitogen-activated protein kinase pathway is activated in a variety of processes, including in response to environmental stresses and injury. Mapk14 is activated during wound healing and increases after ischemic myocardial injury.28,29
Discussion
We have created and validated a system that identifies and represents phenotypic, environmental, and experimental context for every microarray sample and data set stored in GEO by mapping annotation phrases to biomedical concepts in UMLS. In addition to merely holding series of gene measurements, data sets can now be considered by their phenotypic, environmental, and experimental labels and even clustered based on their shared annotative concepts (Fig. 2), similar to how transcriptome measurements are commonly clustered based on expression measurements.
After finding annotative concepts in UMLS for every GEO data set, we have shown a network of relations between phenotype (e.g. aging), disease (e.g. leukemia), environmental (e.g. injury), and experimental context (e.g. muscle cells) and genes with differential expression associated with these concepts. Some of these relations exist even across orthologous genes in two or more species, and we have validated several of these phenome-genome and envirome-genome relations (Fig. 3). It is traditionally difficult to find genes associated with components of phenotype and environment. The example relations we have shown here were found because they were seen across multiple data sets (and types of microarrays) that were originally created to study many different processes, and only by integrating the data sets across the phenome and envirome were we able to find these associations. These relations immediately suggest further targeted cellular, genetic, and epidemiological study of how these genes may influence or are influenced by phenotype and environment. For example, mice that are homozygous null for Slc7a2 show a reduction in nitric oxide production in macrophages and fibroblasts, important in immune response and wound healing.30,31 Mice homozygous null for Mgat2 show early post-natal lethality and a number of other defects.32 Decreases in Tnnt1 and increases in Synj1 have been found to be markers for stem cell differentiation.22,23 Our relations link these four genes and others to aging; it is possible subtle changes in expression of these genes may impact aging of an organism. Further studies should be carried out to elucidate the roles of these genes in aging.
In addition, our findings suggest that UMLS is missing concepts important in molecular and cell biology experimentation, but is sufficient to represent many of the phenotypic, environmental, and experimental concepts held in the text-based annotations of transcriptome data. Though the representation of molecular biology concepts in UMLS could be improved and the parsing made more robust, improving the quality of the annotations is now the crucial step towards the automated determination of context. As more journals call for microarray data to be made publicly available, there is an increasing level of detail being placed in the annotations, with the goal of aiding others in reproducing the findings. In general, as more text is entered having little to do with the experimental design, or as more words are abbreviated, the potential for errors in understanding greatly rises, whether during manual or automated text processing. Findings have already been published in journals that were later judged as inaccurate because of incorrect annotations.33,34 Parsimony and precision in annotations will lead to better manual and computational understanding.
As we can now show that UMLS concepts can be used to represent the experimental context of a genomics experiment, even if only at a coarse resolution, we now have an opportunity to organize our research community to start the call for submitters of genomic data to describe their experiments using UMLS concepts. This could be done in a manner similar to how journals require that microarray data described in manuscripts be available in public repositories in standard formats.10,11,35 Software tools could become available to assist authors in choosing the correct concepts, allowing mappings to UMLS to be more accurate than those determined through automation. Finally, future successful phenome-genome and envirome-genome studies are assured, but the ease and accuracy of automating inferences across data are crucially dependent on the accuracy and consistency of the human annotation process, which will only happen when every investigator has a better prospective understanding of the long-term value of the time invested in improving annotations.
Methods
Source code for software and all relevant data sets are available at http://genotext.stanford.edu.
Gene Expression Omnibus annotations
The Gene Expression Omnibus (GEO) is an international repository for gene expression data, developed and maintained by the National Library of Medicine. 9 GEO samples (abbreviated GSM) relate expression measurements of multiple RNA transcripts with platform-specific identifiers. Though GEO holds samples from many types of parallel expression measurement systems, hereafter we will use the term “microarray” interchangeably with “sample”. The mappings between gene identifiers used in the sample and external gene identifiers, names and symbols are stored in GEO platforms (abbreviated GPL). Each GEO series (abbreviated GSE), usually corresponding to a single experiment, relates to multiple GSM. A subset of the GSE have previously been manually validated as containing internally comparable data; these are represented as GEO data sets (abbreviated GDS). The relationship between GSM, GSE, GPL and GDS is illustrated in Figure 1.
We accessed the Gene Expression Omnibus site on March 24, 2004 and downloaded each GEO series. At the time of downloading, the GEO FTP site contained 8,519 GSM in 524 GSE measured using 195 GPL, as well as 448 GDS. We wrote software in PERL that extracts and stores within a MySQL relational database seven types of annotations from the Gene Expression Omnibus: GEO sample title, description, source, and keyword; GEO series title, and description; and GEO data set title.
Unified Medical Language System concepts represent phenotype
To accurately model the context of a sample, we need a vocabulary that spans the domains to be joined, including terms describing genes and proteins and their functions, organism phenotypes, species, medical conditions, and the experiments themselves. The interlinked set of controlled vocabularies that best serves this role is the Unified Medical Language System (UMLS). UMLS is currently freely available to academic researchers, needing only a signed license agreement. UMLS has three components. The Metathesaurus contains a catalog of unified biomedical concepts, relations between concepts, and text strings mapped to each concept. The Semantic Network contains a catalog of 135 higher level categories for all concepts in the Metathesaurus, as well as relations between these categories. The SPECIALIST lexicon and other resources provide data and tools for processing the text strings associated with UMLS concepts.
The UMLS Metathesaurus relates source vocabularies by creating concepts that span the vocabularies. Each unique concept relates to one or more source vocabularies. A concept may have multiple listed synonyms and terms; each term is uniquely specified in the Metathesaurus. Two types of relations between concepts are stored in the Metathesaurus: asserted structural or hierarchical relations, and statistical relations (determined by co-occurrence of concepts in MEDLINE records). An example of the basic relations in the Metathesaurus is shown in the Supplementary Figure online.
The 2003AC release of UMLS was obtained through the National Library of Medicine (http://www.nlm.nih.gov/research/umls/). Using the METAMORPHOSYS tool, we created a subset dropping vocabularies considered less relevant, including translations of terms into alternate languages. All subsequent analysis was performed using the remaining subset, which contains 878,496 concepts described by 1,724,070 text strings. A table of all mappings between annotations and concepts is available at the web-site given above.
Parsing annotations to find UMLS concepts
MetaMap is a software program written to take free text and generate a list of potentially matching concepts from the UMLS Metathesaurus.36 Using the MetaMap programming libraries, we created a software system called GENOTEXT (GENOmic conTEXT) in Java that processes each of the seven types of GEO annotations and stores in a relational database the UMLS string unique identifier (SUI) of all candidate matches, the score of the match, and the phrase of original text in which the string was found. As concept unique identifiers (CUI) are needed in subsequent analyses, they are automatically determined using the SUI to CUI relations in the UMLS concepts table. We define gross mapping errors as those caused by the incorrect interpretation of abbreviations leading to multiple strings, such that it is highly unlikely that there is any proper reference for these mapped strings. We wrote a program that takes many manually specified SUI and text fragments (described as regular expressions) and eliminates these mappings (additional details may be found in the Supplemental Note online).
Clustering data sets by context
The value of clustering samples from multiple expression data sets by expression values has been previous demonstrated.37 Here we show how gene expression data sets themselves can be clustered by phenotypic, environmental, and experimental context, when this context is represented using a standardized vocabulary. Each data set is considered as a binary vector reflecting the presence or absence of a mapping from that data set or its subordinate GEO series and samples to a UMLS concept. Comprehensive pair-wise binary distances are then computed between vectors. Hierarchical clustering is performed using complete linkage using R.38
Creation of phenomic-genomic relations
Co-expression networks have been previously shown to relate genes by similar function.39,40 Here we show how we have comprehensively related gene expression, the transcriptome, to the rest of the envirome and phenome that remains external to these values in an automated manner. A mapping was manually created from 40% of the nearly 2.5 million GEO platform identifiers to LocusLink identifiers, allowing nearly 55 million expression measurements to be referenced using LocusLink. Mappings to genes were created using GEO platform files, and not by parsing annotations. Each gene expression measurement from each GEO sample is rank-normalized to between 0 and 1, depending on the relative ranking of the gene's expression level compared to other genes measured from the sample. A mean rank-normalized expression level is calculated for each gene across every subordinate GEO sample within a GEO data set, and the average normalized measurements are assigned to that GEO data set. Thus, each GEO data set has a panel of genes measured in its samples and a single average rank-normalized expression measurement for each gene.
We then iterate over the set of 55,619 measured genes, G, defined by LocusLink identifiers. For each gene g, we determine the GEO data sets in which the gene was measured, D, and then determine the UMLS concepts assigned to any those GEO data sets, C. For each concept c in C, we determine the subset of D annotated with c, called d1, and those data sets within D not annotated with c, called d2. Concept c is only considered if subsets d1 and d2 have a minimum of 4 data sets each. We then determine whether the rank-normalized expression measurements of g are significantly different between d1 and d2. Significance is determined using a Student's t-test with unpaired values. An f-test for significantly different variances is first performed for each comparison; if positive ([.alpha] ≤ 0.005), the t-test is performed with Welch correction for unequal variance.41 The threshold p-value for determining significance is determined using 100 random permutations: for each gene g and concept c, the assignment of GEO data sets D between d1 and d2 is randomly shuffled and the t-test is repeated. A q-value is then calculated for each relation between gene g and concept c, based on the proportion of false positive concepts in C we would expect mapped to the gene if concept c were significant. The table of all gene-concept relations (without additional filtering) is available at the web-site given above.
After all gene-concept relations are determined, those with q-values above 0.1 are discarded. Two independent methods are then used to study the remaining relations. In the first method, we study only those relations between gene g and concept c if there is another gene g’ mapped to the same concept c, such that gene g and g’ are in different species yet are in the same homology family, as defined by Homologene. 9 In other words, a concept has to be strongly related to orthologous genes in two species to be included. These relations are made into a graph, additional UMLS hierarchical relations between concepts are added, and the graph is formatted using the yEd Java Graph Editor (yWorks GmbH, Tübingen, Germany). In the second method, we study only the most reliable relations, defined as those with q-values under 0.01. With both methods, we manually verify the concept assignments to each annotation before interpretation.
Biological validation of relations between gene and muscle concepts
Two sources were used to biologically validate the genes we find related to concepts representing Skeletal (C0521324), Skeletal Muscle (C0242695), Muscle Cells (C0596981), and Muscle (C0026845). First, a symbol list was obtained from the Genomics Institute of the Novartis Research Foundation Mouse SymAtlas GNF1M for genes that were expressed in a muscle cDNA library (obtained from pooled male and female 6−11 week old C57BL/6J mice) at 2 or more times the median expression level across all measured tissues.17 Second, a list of UniGene identifiers was obtained from UniGene for clusters of cDNAs sequenced from dbEST library 8902, the adult mouse skeletal muscle library from the University of Texas Southwestern Medical Center.9 Both of these lists were compared to the list of mouse genes with increased expression in GEO data sets containing annotations mapped to any of the four concepts. Neither of these datasets was included in the version of the Gene Expression Omnibus we used.
Acknowledgements
We thank Tarangini Deshpande for critical comments on and suggestions for the manuscript. The authors thank Partners Healthcare Research Computing for use of and assistance with the Linux High Performance Computing Cluster. The work was supported by grants from the Lucille Packard Foundation for Children's Health, NIH National Center for Biomedical Computing (U54 LM008748), the National Library of Medicine (K22 LM008261), National Institute of Diabetes and Digestive and Kidney Diseases (K12 DK63696, R01 DK62948, and R01 DK060837), the Harvard-MIT Division of Health Sciences and Technology, and the Lawson Wilkins Pediatric Endocrine Society.
Supplementary Material
Supplementary Figure: An illustrative subset of concepts and relations from UMLS. Concepts, given a serial number (e.g. C0011849) differ from the multitude of terms (e.g. “diabetes mellitus”) and abbreviations (e.g. “dm”) used to describe them. Each concept is contributed from a source vocabulary (e.g. the International Classification of Diseases, 9th revision, or ICD-9), which may have its own original code or designation for the concept or term (e.g. “250”). Asserted relationships, such as hierarchical relations, are available for many, but not all concepts. Statistical relationships (based on co-occurrence in MEDLINE records) are only available for those concepts that are also represented in the MeSH vocabularies.
Supplementary Table: Number of concepts mapped to each of the seven GEO free-text annotations.
References
- 1.Carson JP, et al. Pharmacogenomic identification of targets for adjuvant therapy with the topoisomerase poison camptothecin. Cancer Res. 2004;64:2096–104. doi: 10.1158/0008-5472.can-03-2029. [DOI] [PubMed] [Google Scholar]
- 2.Zhukov TA, Johanson RA, Cantor AB, Clark RA, Tockman MS. Discovery of distinct protein profiles specific for lung tumors and pre-malignant lung lesions by SELDI mass spectrometry. Lung Cancer. 2003;40:267–79. doi: 10.1016/s0169-5002(03)00082-5. [DOI] [PubMed] [Google Scholar]
- 3.Bhattacharjee A, et al. Classification of human lung carcinomas by mRNA expression profiling reveals distinct adenocarcinoma subclasses. Proc Natl Acad Sci U S A. 2001;98:13790–5. doi: 10.1073/pnas.191502998. [DOI] [PMC free article] [PubMed] [Google Scholar]
- 4.Yanagisawa K, et al. Proteomic patterns of tumour subsets in non-small-cell lung cancer. Lancet. 2003;362:433–9. doi: 10.1016/S0140-6736(03)14068-8. [DOI] [PubMed] [Google Scholar]
- 5.Freimer N, Sabatti C. The human phenome project. Nat Genet. 2003;34:15–21. doi: 10.1038/ng0503-15. [DOI] [PubMed] [Google Scholar]
- 6.Anthony JC, Eaton WW, Henderson AS. Looking to the future in psychiatric epidemiology. Epidemiol Rev. 1995;17:240–2. doi: 10.1093/oxfordjournals.epirev.a036182. [DOI] [PubMed] [Google Scholar]
- 7.Mahner M, Kary M. What exactly are genomes, genotypes and phenotypes? And what about phenomes? J Theor Biol. 1997;186:55–63. doi: 10.1006/jtbi.1996.0335. [DOI] [PubMed] [Google Scholar]
- 8.Stoll M, et al. A genomic-systems biology map for cardiovascular function. Science. 2001;294:1723–6. doi: 10.1126/science.1062117. [DOI] [PubMed] [Google Scholar]
- 9.Wheeler DL, et al. Database resources of the National Center for Biotechnology Information: update. Nucleic Acids Res. 2004;32(Database issue):D35–40. doi: 10.1093/nar/gkh073. [DOI] [PMC free article] [PubMed] [Google Scholar]
- 10.Brazma A, et al. Minimum information about a microarray experiment (MIAME)-toward standards for microarray data. Nat Genet. 2001;29:365–71. doi: 10.1038/ng1201-365. [DOI] [PubMed] [Google Scholar]
- 11.Spellman PT, et al. Design and implementation of microarray gene expression markup language (MAGE-ML). Genome Biol. 2002;3:RESEARCH0046. doi: 10.1186/gb-2002-3-9-research0046. [DOI] [PMC free article] [PubMed] [Google Scholar]
- 12.Bodenreider O. The Unified Medical Language System (UMLS): integrating biomedical terminology. Nucleic Acids Res. 2004;32(Database issue):D267–70. doi: 10.1093/nar/gkh061. [DOI] [PMC free article] [PubMed] [Google Scholar]
- 13.Ashburner M, et al. Gene ontology: tool for the unification of biology. The Gene Ontology Consortium. Nat Genet. 2000;25:25–9. doi: 10.1038/75556. [DOI] [PMC free article] [PubMed] [Google Scholar]
- 14.International Classification of Diseases: 9th revision, Clinical Modification (ICD-9-CM) Centers for Medicare & Medicaid Services; Washington DC: 2003. [Google Scholar]
- 15.Storey JD, Tibshirani R. Statistical significance for genomewide studies. Proc Natl Acad Sci U S A. 2003;100:9440–5. doi: 10.1073/pnas.1530509100. [DOI] [PMC free article] [PubMed] [Google Scholar]
- 16.Jo K, Rutten B, Bunn RC, Bredt DS. Actinin-associated LIM protein-deficient mice maintain normal development and structure of skeletal muscle. Mol Cell Biol. 2001;21:1682–7. doi: 10.1128/MCB.21.5.1682-1687.2001. [DOI] [PMC free article] [PubMed] [Google Scholar]
- 17.Su AI, et al. A gene atlas of the mouse and human protein-encoding transcriptomes. Proc Natl Acad Sci U S A. 2004;101:6062–7. doi: 10.1073/pnas.0400782101. [DOI] [PMC free article] [PubMed] [Google Scholar]
- 18.Rikans LE, Moore DR. Influence of aging on rat liver enzymes involved in glutathione synthesis and degradation. Arch Gerontol Geriatr. 1991;13:263–70. doi: 10.1016/0167-4943(91)90048-u. [DOI] [PubMed] [Google Scholar]
- 19.Ninfali P, Aluigi G, Pompella A. Postnatal expression of glucose-6-phosphate dehydrogenase in different brain areas. Neurochem Res. 1998;23:1197–204. doi: 10.1023/a:1020734203128. [DOI] [PubMed] [Google Scholar]
- 20.Cocco P, et al. Mortality in a cohort of men expressing the glucose-6-phosphate dehydrogenase deficiency. Blood. 1998;91:706–9. [PubMed] [Google Scholar]
- 21.Kyng KJ, May A, Kolvraa S, Bohr VA. Gene expression profiling in Werner syndrome closely resembles that of normal aging. Proc Natl Acad Sci U S A. 2003;100:12259–64. doi: 10.1073/pnas.2130723100. [DOI] [PMC free article] [PubMed] [Google Scholar]
- 22.Muschen M, et al. Molecular portraits of B cell lineage commitment. Proc Natl Acad Sci U S A. 2002;99:10014–9. doi: 10.1073/pnas.152327399. [DOI] [PMC free article] [PubMed] [Google Scholar]
- 23.Bhattacharya B, et al. Gene expression in human embryonic stem cell lines: unique molecular signature. Blood. 2004;103:2956–64. doi: 10.1182/blood-2003-09-3314. [DOI] [PubMed] [Google Scholar]
- 24.Zhao Y, et al. Cloning and characterization of human DDX24 and mouse Ddx24, two novel putative DEAD-Box proteins, and mapping DDX24 to human chromosome 14q32. Genomics. 2000;67:351–5. doi: 10.1006/geno.2000.6255. [DOI] [PubMed] [Google Scholar]
- 25.Mirochnitchenko O, et al. Acetaminophen toxicity. Opposite effects of two forms of glutathione peroxidase. J Biol Chem. 1999;274:10349–55. doi: 10.1074/jbc.274.15.10349. [DOI] [PubMed] [Google Scholar]
- 26.Sandre C, et al. Early evolution of selenium status and oxidative stress parameters in rat models of thermal injury. J Trace Elem Med Biol. 2004;17:313–8. doi: 10.1016/s0946-672x(04)80034-8. [DOI] [PubMed] [Google Scholar]
- 27.Topsakal C, et al. Effects of prostaglandin E1, melatonin, and oxytetracycline on lipid peroxidation, antioxidant defense system, paraoxonase (PON1) activities, and homocysteine levels in an animal model of spinal cord injury. Spine. 2003;28:1643–52. doi: 10.1097/01.BRS.0000083163.03910.B1. [DOI] [PubMed] [Google Scholar]
- 28.Sharma GD, He J, Bazan HE. p38 and ERK1/2 coordinate cellular migration and proliferation in epithelial wound healing: evidence of cross-talk activation between MAP kinase cascades. J Biol Chem. 2003;278:21989–97. doi: 10.1074/jbc.M302650200. [DOI] [PubMed] [Google Scholar]
- 29.Schulz R, et al. Ischemic preconditioning preserves connexin 43 phosphorylation during sustained ischemia in pig hearts in vivo. Faseb J. 2003;17:1355–7. doi: 10.1096/fj.02-0975fje. [DOI] [PubMed] [Google Scholar]
- 30.Nicholson B, Manner CK, MacLeod CL. Cat2 L-arginine transporter-deficient fibroblasts can sustain nitric oxide production. Nitric Oxide. 2002;7:236–43. doi: 10.1016/s1089-8603(02)00116-7. [DOI] [PubMed] [Google Scholar]
- 31.Nicholson B, Manner CK, Kleeman J, MacLeod CL. Sustained nitric oxide production in macrophages requires the arginine transporter CAT2. J Biol Chem. 2001;276:15881–5. doi: 10.1074/jbc.M010030200. [DOI] [PubMed] [Google Scholar]
- 32.Wang Y, et al. Modeling human congenital disorder of glycosylation type IIa in the mouse: conservation of asparagine-linked glycan-dependent functions in mammalian physiology and insights into disease pathogenesis. Glycobiology. 2001;11:1051–70. doi: 10.1093/glycob/11.12.1051. [DOI] [PubMed] [Google Scholar]
- 33.Gilbertson RJ, Clifford SC. PDGFRB is overexpressed in metastatic medulloblastoma. Nat Genet. 2003;35:197–8. doi: 10.1038/ng1103-197. [DOI] [PubMed] [Google Scholar]
- 34.Tettelin H, Parkhill J. The use of genome annotation data and its impact on biological conclusions. Nat Genet. 2004;36:1028–9. doi: 10.1038/ng1004-1028b. [DOI] [PubMed] [Google Scholar]
- 35.Perou CM. Show me the data! Nat Genet. 2001;29:373. doi: 10.1038/ng1201-373. [DOI] [PubMed] [Google Scholar]
- 36.Aronson AR. Effective mapping of biomedical text to the UMLS Metathesaurus: the MetaMap program. Proc AMIA Symp. 2001:17–21. [PMC free article] [PubMed] [Google Scholar]
- 37.Segal E, Friedman N, Koller D, Regev A. A module map showing conditional activity of expression modules in cancer. Nat Genet. 2004;36:1090–8. doi: 10.1038/ng1434. [DOI] [PubMed] [Google Scholar]
- 38.R Development Core Team . R Foundation for Statistical Computing; Vienna, Austria: 2004. [Google Scholar]
- 39.Butte AJ, Tamayo P, Slonim D, Golub TR, Kohane IS. Discovering functional relationships between RNA expression and chemotherapeutic susceptibility using relevance networks. Proc Natl Acad Sci U S A. 2000;97:12182–6. doi: 10.1073/pnas.220392197. [DOI] [PMC free article] [PubMed] [Google Scholar]
- 40.Lee HK, Hsu AK, Sajdak J, Qin J, Pavlidis P. Coexpression analysis of human genes across many microarray data sets. Genome Res. 2004;14:1085–94. doi: 10.1101/gr.1910904. [DOI] [PMC free article] [PubMed] [Google Scholar]
- 41.Press WH, Teukolsky SA, Vetterling WT, Flannery BP. Numerical Recipes in C: The Art of Scientific Computing. Cambridge University Press; Cambridge: 1993. [Google Scholar]
Associated Data
This section collects any data citations, data availability statements, or supplementary materials included in this article.
Supplementary Materials
Supplementary Figure: An illustrative subset of concepts and relations from UMLS. Concepts, given a serial number (e.g. C0011849) differ from the multitude of terms (e.g. “diabetes mellitus”) and abbreviations (e.g. “dm”) used to describe them. Each concept is contributed from a source vocabulary (e.g. the International Classification of Diseases, 9th revision, or ICD-9), which may have its own original code or designation for the concept or term (e.g. “250”). Asserted relationships, such as hierarchical relations, are available for many, but not all concepts. Statistical relationships (based on co-occurrence in MEDLINE records) are only available for those concepts that are also represented in the MeSH vocabularies.
Supplementary Table: Number of concepts mapped to each of the seven GEO free-text annotations.