

Abstract
Apolipoprotein (apo) A-I is an unusually flexible protein whose lipid-associated structure is poorly understood. Thermal denaturation, which is used to measure the global helix stability of high-density lipoprotein (HDL)-associated apoA-I, provides no information about local helix stability. Here we report the use of temperature jump molecular dynamics (MD) simulations to scan the per-residue helix stability of apoA-I in phospholipid-rich HDL. When three 20 ns MD simulations were performed at 500 K on each of two particles created by MD simulations at 310 K, bilayers remained intact but expanded by 40%, and total apoA-I helicity decreased from 95% to 72%. Of significance, the conformations of the overlapping N- and C-terminal domains of apoA-I in the particles were unusually mobile, exposing hydrocarbon regions of the phospholipid to solvent; a lack of buried interhelical salt bridges in the terminal domains correlated with increased mobility. Nondenaturing gradient gels show that 40% expansion of the phospholipid surface of 100:2 particles by addition of palmitoyloleoylphosphatidylcholine exceeds the threshold of particle stability. As a unifying hypothesis, we propose that the terminal domains of apoA-I are phospholipid concentration-sensitive molecular triggers for fusion/remodeling of HDL particles. Since HDL remodeling is necessary for cholesterol transport, our model for remodeling has substantial biomedical implications.
Introduction
High-density lipoproteins (HDL) represent a heterogeneous population of particles. Apolipoprotein (apo) A-I is the major protein in this population, and apoA-I-containing lipoproteins in the form of HDL are inversely correlated with the risk of coronary artery disease and atherosclerosis (1). Of the possible mechanisms that have been suggested to explain this protective role of apoA-I, a process called reverse cholesterol transport is most completely understood at the molecular level. Reverse cholesterol transport consists of three relatively well-understood steps (Fig. 1). First, the transmembrane phospholipid (PL) pump protein, ATP-binding cassette transporter A1 (ABCA1) (2), is required for the assembly of newly synthesized (lipid-poor) apoA-I into discoidal, PL-rich HDL, which results in unesterified cholesterol (UC) efflux from cells. Second, the activation of the enzyme lecithin:cholesterol acyl transferase (LCAT) (3) by apoA-I is necessary for esterification of the cholesterol molecules of HDL to cholesteryl ester (CE) and leads to the conversion of PL-rich to spheroidal, CE-rich (circulating) HDL. Third, interaction of CE-rich HDL with receptors, such as the scavenger receptor B, type I (SR-BI) (4), leads to CE uptake by the liver and excretion into the bile. This interaction results in remodeling of the CE-rich HDL particle, a process that regenerates lipid-poor HDL (5). Thus a fuller understanding of reverse cholesterol transport demands knowledge of the detailed structure and dynamics of the various HDL particles and the intermediates in their assembly, knowledge that should help illuminate the structural mechanisms involved in HDL particle remodeling.
Figure 1.
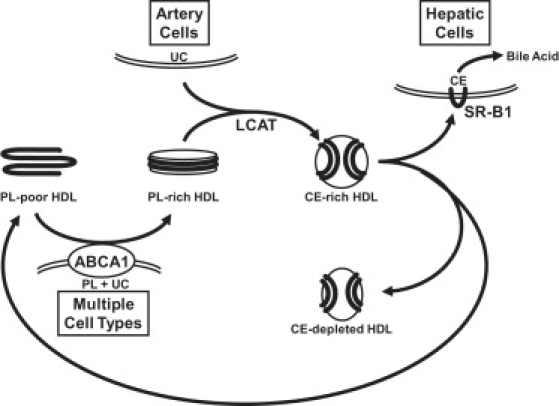
Assembly of HDL during the process of reverse cholesterol transport.
The conformation of apoA-I is highly flexible because apoA-I exists in different states: lipid-free or lipid-poor, and as discoidal or spheroidal lipoproteins of different sizes (1). Although atomic-resolution structural information on HDL is limited, a detailed understanding of the lipid-associated structure of apoA-I is crucial because the lipid environment in HDL modulates apoA-I structure and function. The size of discoidal complexes is determined primarily by the number of apoA-I molecules per particle; however, analysis of reconstituted HDL discs formed between apoA-I and PLs has revealed several discrete-sized particles in complexes containing a constant number of apoA-I per particle (6).
The common lipid-associating motif in apoA-I is the amphipathic α-helix (7,8). In 1999, our laboratory (9) proposed an atomic-resolution double-belt model for discoidal HDL that consisted of two copies of the lipid-associating domain of apoA-I arranged as continuous antiparallel amphipathic helixes around a bilayer disc containing 160 palmitoyloleoylphosphatidylcholine (POPC) molecules to form a 106 Å diameter particle. The general features of the double-belt model, particularly the LL5/5 registry of the two chains (9), have been confirmed by several laboratories using physical chemical methods (10–16).
Although the initial derivation of this model depended critically on certain features of the lipid-free x-ray structure (17), the entire model can be derived a priori from profound constraints imposed on the conformation and orientation of lipid-associated proteins by the lipid bilayer. These constraints are 1), the amphipathic structure of apoA-I; 2), the flat planar discoidal (bilayer) HDL geometry; 3), the helical curvature dictated by the difference between the low dielectric constant of the lipid and the high dielectric constant of the solvent (18); and 4), the critical role of interchain salt bridges in determining the specific antiparallel association of A-I monomers into the dimer (9). Each apoA-I monomer forms a curved, flat amphipathic α-helical ring with 11/3 (∼3.67) residues per turn (termed an α11/3 helix and since observed in other lipid-associating proteins, such as α-synuclein (19,20)) so that the hydrophobic surface faces inward toward the lipid disc.
Using nondenaturing gradient gel electrophoresis in a previous study (6), we showed that dimyristoylphosphocholine (DMPC) discs containing two apoA-I molecules, the R2 complexes, display two types of size heterogeneity. The most obvious form of size heterogeneity was the quantization of discs into five distinct, fairly monodisperse particles, with maximal Stokes diameters of 98 (R2-1), 106 (R2-2), 110 (R2-3), 114 (R2-4), and 120 Å (R2-5). This was termed stepwise heterogeneity. The more subtle form of size heterogeneity that we described was a seemingly smooth increase in size of each of the individual particles with increasing DMPC/apoA-I molar ratios, a process termed continuous heterogeneity.
We further showed that the Stokes diameters of R2-1 and R2-2 are independent of the N-terminal 43 residues of apoA-I, and these residues are necessary and sufficient for the formation of the three larger complexes. On the basis of these results, the conformation of apoA-I on the R2-2 disc was modeled quite satisfactorily as an amphipathic helical double belt extending the full length of the lipid-associating domain (Δ43apoA-I) with N- and C-termini in direct contact (6). Full-length apoA-I on R2-3, R2-4, and R2-5 models as the R2-2 conformation extended on the disc edge by one, two, or three of the 11-residue tandem amphipathic helical repeats (termed G1, G2, and G3, respectively) contained within the first 43 residues (6).
A structural explanation for the size of the smallest of the DMPC-containing discs, R2-1, requires a conformational change in the apoA-I belt. We previously proposed that R2-1 represents the R2-2 conformation with an antiparallel 15–18 residue pairwise segment of helixes hinged off the disc edge (a hinged domain) as a general mechanism to explain the size heterogeneity of DMPC/apoA-I discoidal complexes (6,21).
To test the hinged-domain hypothesis, we performed molecular dynamics (MD) simulations on a series of progressively smaller discoidal HDL particles produced by incremental removal of POPC via four different pathways (22). The starting model contained 160 POPC and a belt of two antiparallel amphipathic helical lipid-associating domains of apo A-I. After a few nanoseconds of MD simulation, independently of the starting particle and method of size reduction, each of the simulated particles changed shape: the protein changed its conformation from a planar ring to a saddle-shaped structure, and the flat POPC disc twisted into minimal surface structures.
These results provide atomic-resolution models for two of the particles produced by in synthetico reconstitution of PL-rich HDL particles from POPC and apoA-I. These particles (96 and 78 Å in diameter by nondenaturing gradient gel electrophoresis) correspond in composition and size/shape (by negative stain electron microscopy) to the simulated particles with molar ratios of 100:2 (R2-1) and 50:2 (R2-0), respectively (22). Most importantly, the apoA-I amphipathic α-helical double belt, which is held together by interhelical buried salt bridges, independently of four different conditions of particle shrinkage, twists to conform to the pseudo-D2 (saddle-shaped) symmetry (minimal surface) edge of the bilayer by closely approximating the x-ray structure of the close dimer pairs of the tetrameric lipid-free apoA-I (17), also with pseudo-D2 symmetry. The dramatic changes in the structure of protein and lipid occur with a few nanoseconds of MD simulation, an unprecedented timescale for such large supramolecular assemblies (22).
However, our MD simulations have two important limitations:
-
1.
Multiple long simulations are required to increase the confidence that equilibrium has been achieved and energy barriers (kinetic traps) have been overcome. Because of the short (<10 ns) simulation times of our PL-rich HDL simulations, we could not rule out the possibility that the saddle-shaped structures we saw represented kinetically trapped collapse intermediates.
-
2.
With current high-performance computer technology, the initial conditions (starting model) are critical. Most quaternary folding steps, even for protein-lipid interactions, are kinetically beyond the simulation times that can be reasonably achieved today. We were fortunate to have developed a good initial model for the quaternary interchain interactions between the antiparallel helical belts of discoidal HDL (9–16).
Thermal denaturation is an accepted means of determining helix stability for apoA-I in HDL. For example, studies by Mehta et al. (23) using far-ultraviolet (UV) circular dichroism (CD) spectra indicated that 1), the melting curve of HDL shows a reduction in the α-helix content from 85% at 25°C to 45% at 98°C; and 2), 40% of the original α-helical content is retained after prolonged incubation at 98°C. We therefore realized that temperature jump (T-jump) MD simulations were a potential way to examine the local, per-residue helix thermal stability of a previously described PL-rich apoA-I double-belt HDL particle. In the studies reported here, three 20 ns all-atom MD simulations were performed at 500 K on each of two initial particles independently created by MD simulations at 310 K (37°C). We found that although the bilayer remained intact, albeit expanded, the conformation of apoA-I in the particles was unusually mobile; in particular, the antiparallel overlapping N- and C-termini (terminal domain) were much more mobile than the antiparallel central region (central domain). The maintenance of buried interhelical salt bridges in the central domain appeared to partly account for the stability of this region.
Materials and Methods
MD simulations
Two independent particles containing 100 POPC and 2 Δ40apoA-I (100:2; the experimental particle is referred to as R2-1) were created from a simulated 160:2 particle (experimental particle R2-2) by means of the particle reduction methodology (22). The two independent 100:2 particles created from a starting 160:2 particle, I-1 (created by random lipid removal) and I-2 (created by central lipid removal), were then subjected to MD simulation for 7 and 5 ns, respectively, at 310 K and 1 bar. Because T-jump MD simulations at 525 K and 1 bar in explicit water under periodic boundary conditions produced rapid vaporization, T-jump MD simulations were performed at 500 K and 1 bar. Under these conditions, no vaporization occurred when I-1 and I-2 were simulated for 20 ns three times each, and the Δ43apoA-I control without lipid (from the tetrameric x-ray structure) was simulated twice for 20 ns. Both 100:2 particles were also continued at 310 K for additional time so that each had 10 ns of simulation for comparison with the 500 K simulations.
For further reference, we created and simulated two additional systems of just PL. In the first system, two 5 ns simulations of a 427 POPC bilayer membrane in solvent with periodic boundary conditions were run at 310 K and 500 K. The bilayer was created using the membrane plug-in of VMD (24), and then resolvated using the “Add Solvation Box” plug-in of VMD. In the second system, the protein was removed from a particle, leaving 100 POPC completely surrounded by solvent, and was simulated three times at 500 K for 20 ns.
All-atom simulations were performed using NAMD (25) on an IBM Blue Gene/L rack. Methods for energy minimization, creation of a cuboidic periodic water cell, and computation of short- and long-range electrostatic interactions with the particle mesh Ewald (PME) summation were as described in Catte et al. (22). Each system was ionized with NaCl to neutralize charge with the “Add Ions” plug-in of VMD. The sides of the periodic boundary box extended at least 15 Å beyond all protein or lipid molecules. The TIP3P water model was used (26). The CHARMM 22 (27,28) and 27 (29,30) force fields were used for protein and lipid molecules, respectively. Nonbonded van der Waals and electrostatic interactions were truncated using a cutoff distance of 12 Å. The pressure was held constant at 1 atm using Berendsen's pressure bath. Velocity reassignment was carried out every 1 ps during the first 50 ps of simulation, increasing the temperature in the simulation from 30 to 500 K, after which the temperature was held constant using Berendsen's temperature bath. The eight simulations containing protein were all run for 20 ns, with velocity reassignment to 500 K occurring every 1 ns to prevent the “flying ice cube” effect (31). Over their entirety, the three MD simulations of I-1 and I-2 and the two MD simulations of the lipid-free control Δ43apoA-I were analyzed by means of root mean-square deviations (RMSDs; protein equilibration), root mean-square fluctuations (RMSFs; protein mobility), changes in total helicity (helix thermal stability), and solvent-accessible surface area (SASA) of hydrophobic residues (protein unfolding). Over the last 20% of the simulations, changes in per-residue helicity (helix thermal stability), as well as radial distribution functions (RDFs) and calculated order parameters for the lipids, were measured. Over the last 40% of the simulations, lipid order parameters were measured. Additionally, the three MD simulations of I-1 and I-2 were analyzed by acyl chain SASA/POPC (bilayer thermal stability) over their entirety.
RMSD
The RMSD of protein α-carbon atoms after T-jump MD simulations was calculated for the POPC/Δ40apoA-I (100:2) particles and the control, lipid-free Δ43apoA-I over the entire length of the 20 ns trajectories. The RMSD was calculated with respect to the original two 100:2 particles, before T-jump MD to 500 K, for the six particle trajectories. For the control, the RMSD was calculated with respect to chains A and B, and then chains C and D, for both simulations, giving a total of four trajectories.
SASA
For the 100:2 particles, the SASA of the POPC acyl chain groups per POPC molecule was measured every 20 ps over all six 20 ns of the T-jump MD trajectories, as in our previous studies (22,32). The SASAs of three individual POPC molecules that broke free of the particles in three separate simulations were also measured by the same method. Additionally, the total SASA of all hydrophobic protein residues in the 100:2 particles and lipid-free control was measured every 40 ps over the course of all 20 ns simulations.
Calculated lipid order parameters
Order parameters for the 100:2 particles were calculated for the sn-1 and sn-2 POPC chains every 4–40 ps for the last 40% of the 10 ns 310 K and 20 ns 500 K T-jump MD simulations, as well as for 5 ns 310 K and 500 K T-jump MD simulations of the periodic boundary bilayer consisting of 427 POPC molecules. Because of the curvature of the PL bilayers in the particles as well as the periodic boundary bilayer at 500 K, the normals to all curved bilayers were approximated by calculating the vector differences between the centers of mass (COMs) of the POPC headgroups and tails for all residues within a radius of 40 Å from the target POPC. The results from this technique showed excellent agreement when compared with the order parameters for the periodic boundary bilayer at 310 K, with the normal fixed to the direction of the PLs (in this case the z axis; results not shown).
RDFs
The RDF for the distances between phosphorus-phosphorus, nitrogen-nitrogen, and phosphorus-nitrogen atoms of the POPC headgroups of the 100:2 particles were measured and averaged over the last 20% of the T-jump MD simulations by using the “radial pair distribution function” tool of VMD. The RDFs were calculated using the “gofr” plug-in of VMD, with periodic boundary conditions. The RDFs are unitless and not normalized; since we are not dealing with a homogeneously distributed system, proper normalization requires a more accurate estimate of the density than this algorithm provides. However, peak positions, the main point of our analyses, are not affected.
After the COM of each PL was calculated, the RDF for distances between POPC COM and POPC COM for the periodic bilayer and 100:2 particles simulated at 310 K and 500 K were measured over the last 20% of simulations (10 ns for 310 K, 20 ns for 500 K) for each POPC monolayer leaflet and averaged. Additionally, for the 100:2 particles at 310 K (and 500 K), the POPC were separated into two groups: those within 6 Å (and 8 Å) of protein and not within 6 Å (and 8 Å, respectively) of protein. For each group the RDFs for distances between POPC COM- POPC COM were measured over the last 20% of simulations (10 ns for 310 K, 20 ns for 500 K) for each POPC monolayer leaflet and averaged.
Another RDF was calculated for distances between the nonbackbone nitrogens of protein basic residues (Lys, Arg, and His) and the phosphorus of POPC for the 100:2 particles simulated at 310 K and 500 K. This was measured over the last 20% of the first 10 ns for both 310 K and 500 K simulations, and over the last 20% of the entire 20 ns for the 500 K simulations, for each POPC monolayer leaflet and averaged.
Annular distribution functions
Annular distributions of distances (or annular distribution functions (ADFs)) of POPC COM and POPC phosphorus atoms from protein were measured over the last 20% of the first 10 ns for both 310 K and 500 K simulations of the 100:2 particles. To consider only the edge POPC, only those POPC that contacted the protein were measured for each simulation snapshot.
Fraction α-helicity
The fraction of all protein residues in the 100:2 particles and the lipid-free control that were α-helical were measured every 20 ps over the course of all 20 ns trajectories of the T-jump MD simulations by using VMD's implementation of the secondary structure determination program STRIDE (33).
The fraction of the time that each protein residue was α-helical was calculated over the last 20% of the 20 ns trajectories of all T-jump MD simulations and averaged. This was measured every 20 ps by once again using STRIDE.
Root mean-square fluctuations
The RMSFs of protein residue α-carbons were calculated for the 100:2 particles and lipid-free control over the course of all 20 ns of the T-jump MD simulations as in our previous studies (22,32).
Interhelical buried salt bridge distances
Salt bridge distances for the six buried salt bridges (E78-R188, R188-E78, D89-R177, R177-D89, E111-H155, and H155-E111) were measured every 20 ps over the entire course and every 4 ps over the last 20% of all 100:2 particle trajectories during T-jump MD simulations by using the “saltbr” command in VMD.
Calculations of surface area per POPC by triangulation
To calculate the surface area per POPC for the periodic bilayer and 100:2 particles, the areas of the triangles formed from the POPC phosphorus atoms via a two-dimensional convex hull procedure were summed for each POPC monolayer leaflet and averaged, for both the 310 K and 500 K simulations. If any side of a triangle was >30 Å, it was not included. Because of the motion of the phosphorus atoms perpendicular to the POPC surface, especially at 500 K, the positions for the phosphorus atoms were smoothed by a rolling average over 0.6–2.4 ns, depending on the total length of the simulation. Because of the temperature-independent close proximity of edge phosphorous atoms to the protein (see Fig. 7 b), no edge extension factor was added to the calculations as was done in our previous study (22).
Figure 7.
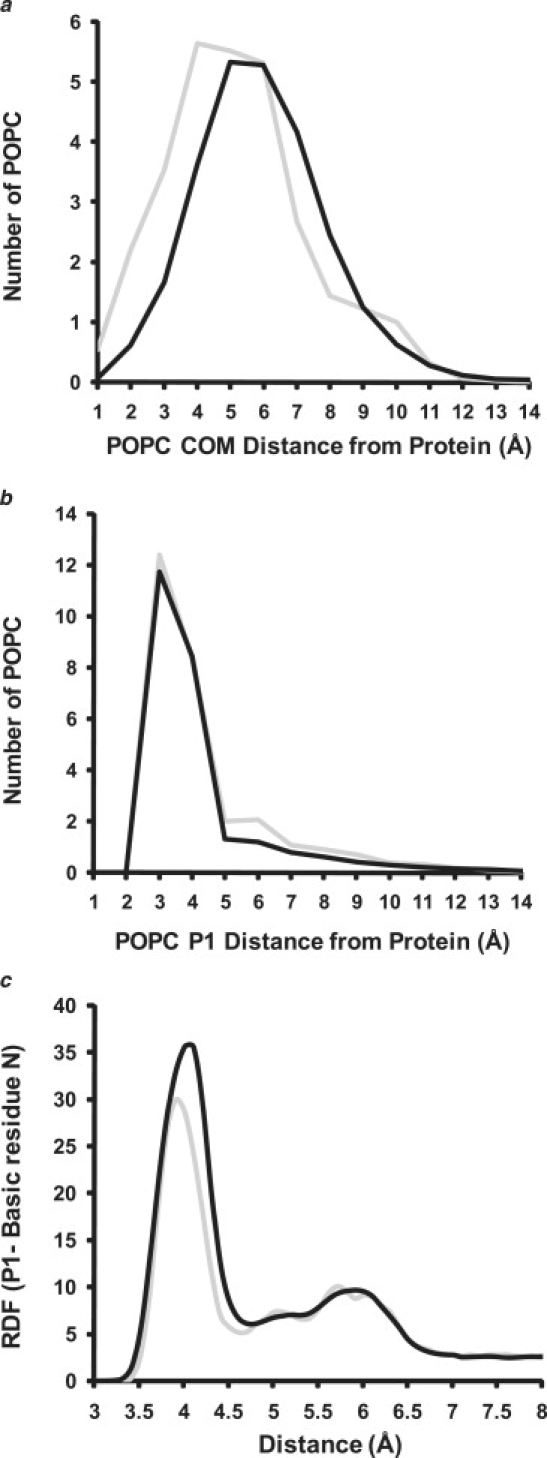
ADF analyses of COM and phosphorus of POPC molecules in 100:2 particles and RDF analysis of salt bridge formation between nonbackbone nitrogens of protein basic residues and the phosphorus atoms of POPC. (a) ADF analysis of distance of COM of POPC from protein. (Gray line) Mean ADF of the six 100:2 particle MD simulations at 310 K averaged over the last 20% of the simulations. (Black line) Mean ADF of the six 100:2 particle MD simulations at 500 K averaged over the last 20% of the simulations. (b) ADF analysis of distance of POPC phosphorous atoms from protein. (Gray line) Mean ADF of the six 100:2 particle MD simulations at 310 K averaged over the last 20% of the simulations. (Black line) Mean ADF of the six 100:2 particle MD simulations at 500 K averaged over the last 20% of the simulations. (c) RDF analysis of distances between the nonbackbone nitrogens of protein basic residues (Lys, Arg, and His) and the phosphorus atoms of POPC for the 100:2 particles simulated at (gray line) 310 K and (black line) 500 K.
Preparation and analysis of reconstituted HDL particles
The N-terminus truncated form of recombinant human apoA-I, Δ43apoA-I, was produced and purified as described by Rogers et al. (34). Briefly, human Δ43apoA-I cDNA in plasmid pGEMEX was expressed in Escherichia coli BL21/DE3 cells. The expression of apoA-I was monitored by Western blot analysis of the bacterial lysate with anti-human apoA-I antibody. The bacterial lysate containing mutant apoA-I was loaded onto a preparative reversed-phase high-performance liquid chromatography (HPLC; C4) column, and proteins were eluted and separated by a gradient of acetonitrile with 0.1% trifluoroacetic acid. Preparative HPLC fractions containing apoA-I (identified by immuno-dot-blots) were then subjected to purity and identity analyses. The purity of expressed proteins was examined by analytical HPLC (C18) and sodium dodecyl sulfate polyacrylamide gel electrophoresis (SDS-PAGE). The identity of the proteins was confirmed by mass spectrometry and N-terminal amino acid sequencing.
Lyophilized protein was solubilized in 6 M guanidine hydrochloride. The solubilized protein solution was loaded on a desalting column (Econo-Pac 10DG disposable chromatography columns; BioRad, Hercules, CA) and the protein was eluted by PBS buffer (0.02 M phosphate, 0.15 M NaCl, pH 7.4). An extinction coefficient of 0.991 mL/(mg-cm) at 280 nm was used to determine the concentration of Δ43apoA-I in 6 M guanidine hydrochloride (34). POPC were purchased from Avanti Polar Lipids, Inc. (Alabaster, AL) and used without further purification. Reconstituted HDL particles with different lipid/protein ratios were prepared by the sodium cholate dialysis procedure as described previously (34,35). The particles formed were analyzed by nondenaturing gradient gel electrophoresis (NDGGE) on a 4–20% gradient Tris-glycine acrylamide gel (Invitrogen, Carlsbad, CA). High-molecular-weight marker (Amersham catalog No. 17-0445-01) with known Stokes diameters (Sd) were used as standards, as follows: thyroglobulin (170 Å), ferritin (122 Å), catalase (104 Å), lactate dehydrogenase (82 Å), and albumin (71 Å). The gels were stained with a colloidal blue staining kit (Invitrogen, Carlsbad, CA). With reference to protein molecular markers, the Stokes diameters of different-sized particles in the complexes were calculated based on density scans of the gels by LabWorks image acquisition and analysis software (UVP Inc., Upland, CA).
Results
Structures of each of the six 500K T-jump MD simulations at 20 ns
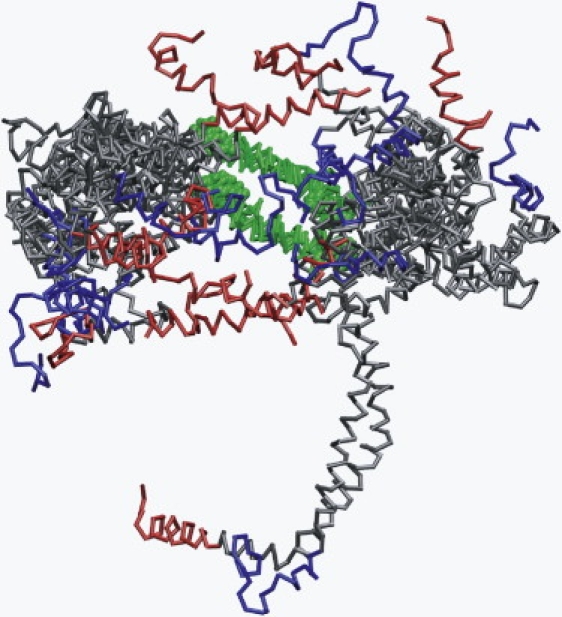
Fig. 2 shows images of the structures of the six 500 K T-jump MD simulations at 20 ns. The dominant theme in these structures is that the N- and C-terminal segments of the terminal domain (helix 1, blue; helix 10, red) are extremely mobile, whereas the central domain (helix 5, green) is much less so. In particular, in four of the six simulations (500 K-1, 500 K-3, 500 K-4, and 500 K-6), one or both members of the helix-10 pair (helix 10 has the highest lipid affinity of all the helical repeats (36)) detach themselves partially or completely from the lipid surface at some point during the simulation, often exposing the acyl chains of the POPC molecules in that region and resulting in some tendency even at 500 K for the headgroups to curve to attempt to form micelle-like regions (see the Supporting Material, Fig. S1, for full space-filling images).
Figure 2.
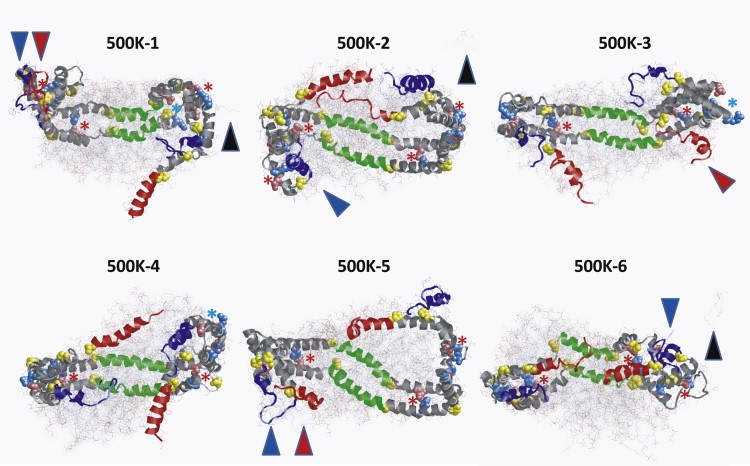
Structures of each of the six 500 K simulations of 100:2 at 20 ns. 500 K-1–3: Three simulations of independent particle I-1. 500 K-4–6: Three simulations of independent particle I-2. Protein is in ribbon representation, except for prolines (yellow space-filling). POPC is in line representation with a van der Waals dot surface display. The structures are viewed from the terminal domain side of the particles with N-terminal helix 1 in blue and C-terminal helix 10 in red. Antiparallel helix-5 pairs in green are visible behind the POPC bilayer. The remainder of the protein is in gray. The black arrowheads denote the three desorbed POPC molecules; the red arrowheads and the blue arrowheads indicate where helix 10 and helix 1, respectively, form terminal interhelical hairpins. Potential salt bridges are indicated as space-filling images of the basic (sky blue) and acid (pink) residues. Pairs forming salt bridges are indicated by a red ∗; those not forming salt bridges are indicated by a pale blue ∗.
We previously proposed (9) that there are six interhelical salt bridges buried in the lipid of the particle between antiparallel helixes 2–8 that determine the registry of the two antiparallel helical belts. It can be seen from the figure that many of these proposed salt bridges have persisted (red star; blue stars represent broken salt bridges) even after 500 K T-jump MD simulations at 20 ns. (For a quantification of the stability of these six salt bridges, see Fig. 9).
Figure 9.
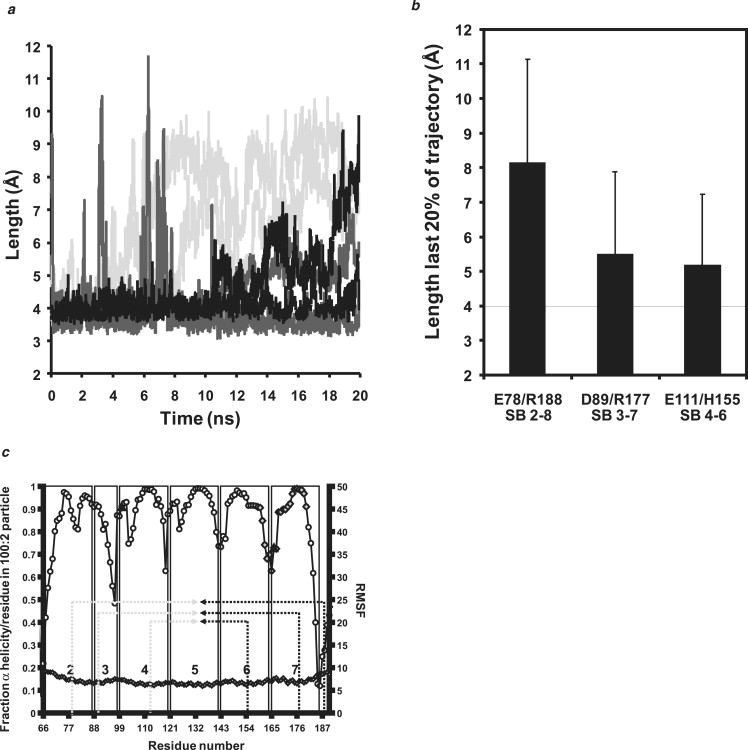
Analyses of buried interhelical salt bridges for the six 100:2 particles during 20 ns MD simulations at 500 K. (a) Plot of distance between the six buried salt bridges with time of simulation. (Black lines) SB/E111–H155, SB/H155–E111. (Dark gray lines) SB/D89–R177, SB/R177–D89. (Light gray lines) SB/E78–R188, SB/R188–E78. (b) Bar graph plot of mean distance (mean ± 1 SD) between equivalent pairs of salt bridges over the full 20 ns of MD simulation. (c) Correlation of the position of the buried salt bridges to local helix thermal stability. A plot of the helix thermal stability of individual amino acid residues of the central portion of lipid-bound apoA-I (helixes 2–7) overlaid with the locations of the three pairs of buried salt bridges. (Black dashed arrows) Basic residues. (Gray dashed arrows) Acidic residues. (Gray diamonds) Residues 159–180, suggested by Wu et al. (43) on the basis of hydrogen-deuterium exchange, to form a protruding solvent-exposed loop that they propose directly interacts with and activates LCAT. (Black triangle) Tyr166, a preferred target for site-specific oxidative modification within atheroma according to Wu et al. (43).
Fig. 3 represents an ensemble of the final 20 ns structure of the six MD simulations at 500 K. This figure graphically illustrates the hypermobility of the N- and C-terminal overlap domains (predominantly helixes 1 and 10) compared to the central domain.
Figure 3.
Ensemble of all six 500 K 20 ns simulations aligned at helix 5. The structures are viewed from the terminal domain side of the particle. (Green) helix 5; (blue) N-terminal helix 1; (red) C-terminal helix 10.
Particle equilibration during T-jump MD at 500 K
RMSDs calculated and averaged over the trajectories of the Δ40apoA-I/POPC particles and the control, lipid-free Δ43apoA-I subjected to T-jump MD are shown in Fig. 4, a and b, respectively. In both, there is a biphasic increase in RMSD, a rapid phase to ∼5 ns, followed by a much more gradual slope; the slope of the second phase for the particles is noticeably less than that for the control.
Figure 4.
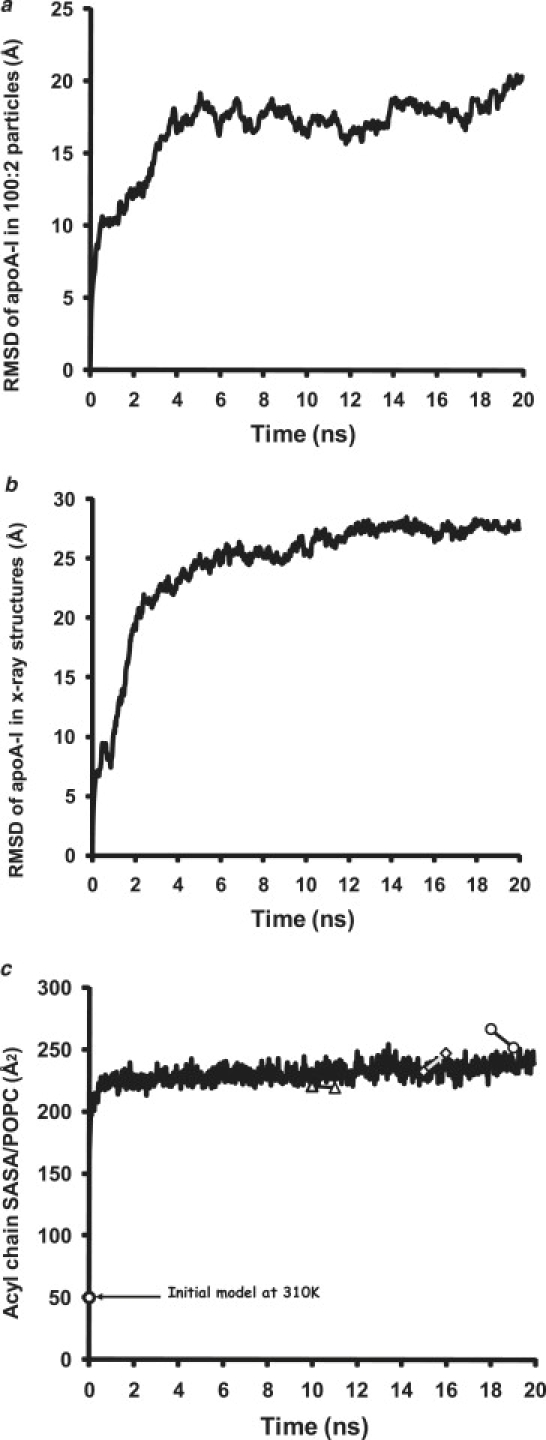
Stability of 100:2 particles during six 20 ns MD simulations at 500 K. (a) Changes in average RMSD of the six 100:2 particle MD simulations at 500 K plotted over 20 ns. (b) Changes in average RMSD of the close AB and CD pairs of each of the two MD simulations performed on the control Δ40apoA-I structure at 500 K plotted over 20 ns. (c) Changes in average SASA of the acyl chains per POPC for the six 100:2 particle MD simulations at 500 K plotted over 20 ns; (white triangles, squares, and circles connected by line) changes in total SASA for each of the three simulations over the 1 ns before and after desorption of a single POPC molecule from its 100:2 particle.
Acyl chain SASA/POPC rapidly increased fivefold for the particles upon heating to 500 K and then flattened, indicating expansion of an intact bilayer (Fig. 4 c). Although one POPC molecule was lost after 10 ns from the particle in three of six simulations (see Fig. S2), an unexpected event that will be addressed in the Discussion, this loss had little effect on the total acyl chain SASA (Fig. 4 c, white symbols).
Changes in calculated lipid order parameters during T-jump MD at 500 K
The average order parameters for the last 40% of the trajectories of the two initial particles, I-1 and I-2, simulated for 10 ns at 310 K are shown in Fig. 5 a. These order parameters are quantitatively similar to order parameters we reported earlier for the 100:2 particle (22). However, the order parameters for the 100:2 particles are noticeably smaller than the order parameters for a 5 ns, 310 K simulation of a periodic boundary bilayer (Fig. 5 b).
Figure 5.
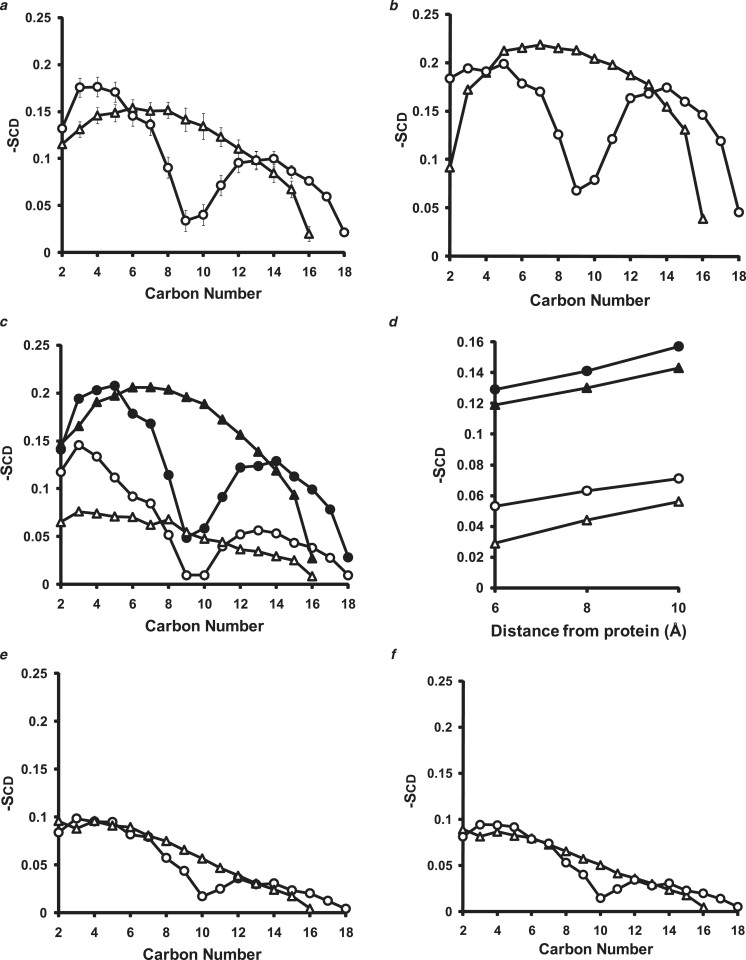
POPC order parameters calculated for the last 40% of simulations at 310 K and 500 K for the average of the I-1 and I-2 particles versus a periodic bilayer. The values for the order parameters (Scd) are averages over both hydrogen atoms on each methylene carbon and are shown as triangles for the sn-1 (palmitoyl) chain and as circles for the sn-2 (oleoyl) chain. (a) Plot of (mean ± SE) order parameters over the last 40% of the first 10 ns of the simulations for I-1 and I-2. (b) Plot of the last 40% of the 310 K 5 ns simulation of a periodic bilayer containing 427 POPC. (c) Plot of (mean ± SE) order parameters calculated for all POPC within (open symbols) and not within (solid symbols) 6 Å of protein. SE bars are too small to see. (d) Plot of average order parameters for C14 calculated for all POPC within (open symbols) and not within (solid symbols) 6, 8, and 10 Å of protein. (e) Average of the last 40% of the six 20 ns 500 K MD simulations of the 100:2 particles. (f) Plot of the last 40% of the 500 K 5 ns simulation of a periodic bilayer containing 427 POPC.
We previously suggested that the lowering of order parameters for the 100:2 particles was due to the presence in the particle of both bulk bilayer POPC and annular POPC (lipid in contact with the surrounding protein), the latter being considerably more disordered than the former (22). To demonstrate the presence of annular lipid in our current simulations, we calculated order parameters for POPC molecules throughout the last 40% of the trajectory of the 10 ns simulations of the 100:2 particles at 310 K whose COMs were within or not within three distances (6, 8, and 10 Å) of the protein. Fig. 5 c is a plot of order parameters for POPC molecules within and not within 6 Å from the protein, showing that annular lipid within 6 Å of the protein is more disordered than lipid outside that boundary. Further, order parameters for the lipid outside the boundary (bulk lipid) are similar to those of the periodic POPC bilayer (compare Fig. 5, b and c). Fig. 5 d shows that in the 6–10 Å interval examined, disorder (in the C14 position) is inversely correlated with distance from the protein (full order parameters are shown in Fig. S3). Finally, the T-jump MD simulations at 500 K for both the 100:2 particles and the periodic boundary bilayer (Fig. 5, e and f) are similar to each other and much more disordered than the 310 K simulations, indicating lipid expansion and attenuation of the bulk and annular POPC dichotomy with increasing temperature (22).
Changes in POPC bilayer surface areas during T-jump
A comparison of the RDFs for P-P, N-N, and P-N of the POPC in the particles over the last 20% of the simulations at 310 K and 500 K confirms the persistence of bilayer structure after simulation at 500 K for 20 ns (Fig. S4). However, the fivefold increase in acyl chain SASA/POPC and the dramatic decrease in calculated order parameters during T-jump clearly indicate bilayer expansion.
We used additional methodology to examine differences in bilayer properties during T-jump-induced bilayer expansion. We first measured changes in the RDF for distances between POPC COMs for the periodic bilayer and 100:2 particles simulated at 310 K and 500 K. The COM-COM RDF for the periodic bilayer clearly indicates expansion during T-jump; the COM-COM shells peak at ∼7.9 Å and 9.0 Å for simulations at 310 K and 500 K, respectively (Fig. 6 a). The results of Fig. 6 b for the RDF COM-COM analyses of the 100:2 particles are more complicated. First, the COM-COM shell for 100:2 particle simulations at 500 K peaks at a significantly lower value than for the 500 K simulations of the periodic bilayer (∼8.0 Å vs. 9.0 Å, respectively), indicating overall compression of the bilayer by the protein belt. Second, the COM-COM RDF for the 100:2 particles shows several COM-COM RDF peaks, with the best-defined occurring at ∼6.1 Å.
Figure 6.
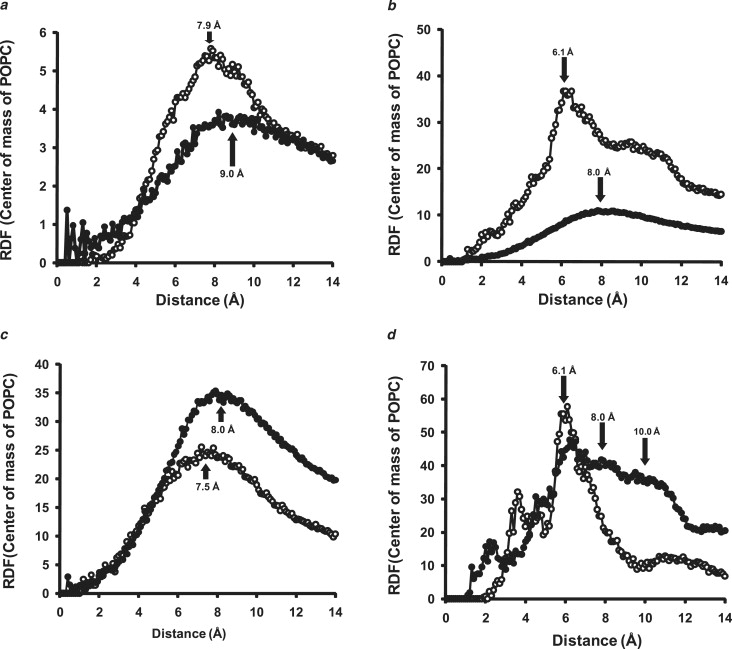
RDF analyses of the COM of POPC molecules in periodic bilayer and 100:2 particles. (a) POPC COM-COM RDF analyzed for periodic bilayers over the last 20% of their 5 ns simulations at 310 K (open circles) and 500 K (solid circles). (Arrows) Approximate center of the 310 K and 500 K POPC RDF shells measured in Å. (b) POPC COM-COM RDF analyzed for 100:2 particles over the last 20% of their simulations at 310 K (open circles) and 500 K (solid circles). (Arrows) Approximate center of the major 310 K and 500 K POPC COM-COM RDF shells for each simulation measured in Å. (c) POPC COM-COM RDF analyzed for POPC of 100:2 particles subjected to 500 K T-jump: within 8 Å (open circles) or at >8 Å (solid circles) of protein annulus. (Arrows) Approximate center of the POPC COM-COM RDF shells of the two POPC populations measured in Å. (d) POPC COM-COM RDF analyzed for POPC of 100:2 particles simulated at 310 K within 6 Å (solid circles) or at >6 Å (open circles) of protein annulus. (Arrows) Approximate center of the POPC COM-COM RDF shells of the two POPC populations measured in Å.
Based on our previous (22) and current (Fig. 5) observations that the 100:2 particles simulated at 310 K contain both bulk bilayer and annular POPC with different packing properties, we examined the effect of proximity to the protein on COM-COM RDF for the 100:2 particle simulations at 310 K versus 500 K. For 100:2 simulations at 500 K, the POPC ≤ 8 Å from the protein (chosen because the 500 K shell in Fig. 6 b peaks at ∼8 Å) has a smaller RDF peak than POPC > 8 Å from the protein, 7.5 vs. 8.0 Å, respectively (Fig. 6 c), suggesting only slight compression of the annular POPC. Thus, as suggested by the order parameter results, T-jump to 500 K appears to largely melt out the compressed “phase” of the annular POPC. For 100:2 particle simulations at 310 K, POPC ≤ 6 Å from the protein (chosen because the most prominent 310 K shell in Fig. 6 b peaks at ∼6 Å) shows a pronounced peak at 6.1 Å compared to POPC > 6 Å from the protein; the latter contains multiple peaks at ∼6.1, 8, and 10 Å (Fig. 6 d). These results indicate significant compression of the annular POPC in the 100:2 particles simulated at 310 K that largely accounts for the 6.1 Å peak in the full simulation (Fig. 6 b).
To further study the effects of T-jump on the properties of annular POPC in the 100:2 particles, we used an analytical variant of the RDF, the ADF, to examine varying properties of POPC molecules at incremental distances from the annular protein. In Fig. 7 a we have counted the average 1 Å incremental distribution of edge POPC COM for both 310 K and 500 K simulations of the 100:2 particles. Only those POPC that contacted the protein were measured for each simulation snapshot. These ADF analyses show that the COMs of the edge POPC are, on average, ∼1 Å farther from the protein at 500 K than at 310 K.
However, when the average number of phosphorus atoms of POPC molecules located at 1 Å incremental distances from the annular protein were counted for 310 K and 500 K simulations of the 100:2 particles, the results were substantially different. The ADF plots of both simulations show a sharp phosphorus peak at 3 Å and are essentially indistinguishable (Fig. 7 b), suggesting that a large population of edge phosphorus atoms is in direct contact with the protein at both temperatures, even though there is obvious expansion and increased motion at 500 K.
Of relevance to the results of Fig. 7 b, the double-belt model for discoidal HDL creates a strip of basic residues at the α11/3 helical wheel positions 7 and 11 located on the right (R) “docking” interface (9,37). In the generally accepted 5/5LL rotamer orientation of the double-belt model (38), the R interfaces are directed toward the POPC bilayer surfaces where the phosphorus atoms are located (37). Because of the very close approach of edge phosphorus atoms to the protein indicated by Fig. 7 b, we examined the possibility that the basic residues located on the R interface stabilizes edge POPC by forming salt bridges with edge phosphorus atoms. Fig. 7 c is an RDF analysis of distances between the nonbackbone nitrogens of protein basic residues (Lys, Arg, and His) and the phosphorus atoms of POPC for the 100:2 particles simulated at 310 K and 500 K. A pronounced peak at ∼4 Å appears in both analyses, showing that salt bridges formed by the edge phosphorus atoms with R interface basic residues remain stable after 20 ns MD simulations at 500 K.
Changes in global protein helicity during T-jump MD at 500 K
The average total helicity for the six Δ40apoA-I/POPC particles simulated by T-jump MD at 500 K decreased from 95% to 72% (Fig. S5 a); experimentally derived 100:2 POPC/Δ43apoA-I particles have a measured helicity of 74% by circular dichroism spectroscopy (6). The total helicity of the control, lipid-free Δ43apoA-I decreased from 90% to 67% (Fig. S5 b). The helicity curve for the 100:2 particles has a steep negative slope in the first 4 ns, presumably due to the effects of bilayer expansion on protein stability. After 4 ns, the rate of decrease in helicity slows to the point that the rate of change in helicity with increasing temperature for the lipid-bound form of apoA-I is less than that of the lipid-free control: −0.67%/degree vs. −1.01%/degree, respectively. This difference in slope implies that the lipid-bound form of apoA-I is more stable than the lipid-free form.
In reciprocal fashion to the helicity decrease with heating, the SASA of the lipid-associating hydrophobic residues of Δ40apoA-I in the 100:2 particle increased ∼60% (the increase in the first 500 ps from 2000 to 4000 Å2 reflects expansion of the POPC), whereas that of the control, lipid-free Δ43apoA-I increased ∼50% (Fig. S5, c and d). The suggestion (made on the basis of change in helicity) that the lipid-bound form of apoA-I is more stable than the lipid-free form is supported by the observation that dimeric lipid-free Δ43apoA-I at 0 ns has almost twice the exposure of hydrophobic residues to solvent (as measured on the intact tetramer) compared to dimeric lipid-bound Δ40apoA-I at 0 ns (19.2 Å2/residue vs. 10.3 Å2/residue).
Changes in local protein fluctuation and helicity during T-jump MD at 500 K
RMSFs and helicity changes of individual residues during T-jump MD simulations at 500 K were analyzed in both the lipid-associated Δ40apoA-I and the control, lipid-free Δ43apoA-I as measures of local mobility and local helix thermal stability, respectively (Fig. 8).
Figure 8.
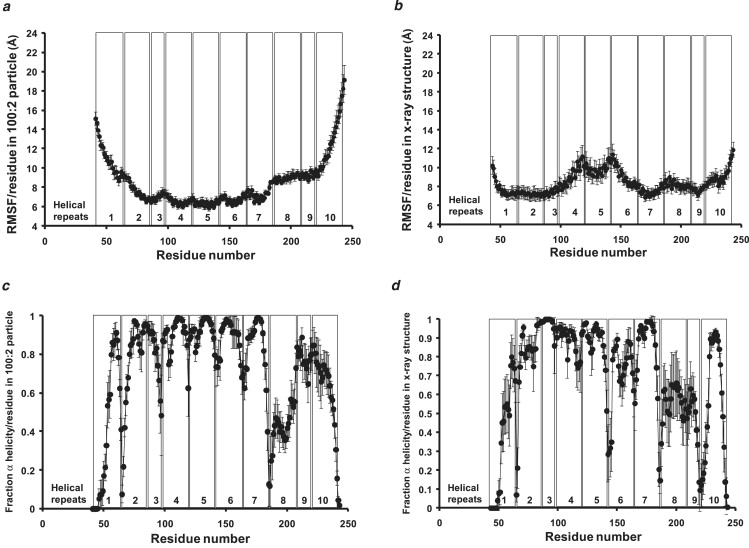
Local (per residue) changes in RMSF and fraction α-helicity during 20 ns MD simulations at 500 K for the six 100:2 particles versus the control Δ43apoA-I. The vertical boxes in each figure denote the positions of each of the 10 helical repeats. (a) Mean ± 1 SE in RMSF of the six 100:2 particle MD simulations at 500 K plotted over 20 ns. (b) Mean ± 1 SE in RMSF of the close AB and CD pairs of each of the two MD simulations performed on the control Δ40apoA-I structure at 500 K plotted over 20 ns. (c) Per-residue changes in fraction α-helicity (mean ± 1 SE) for the six 100:2 particle MD simulations for 20 ns at 500 K calculated from the last 20% of the trajectories. (d) Per-residue changes in fraction α-helicity (mean ± 1 SE) for the close AB and CD pairs of each of the two MD simulations performed on the control Δ40apoA-I structure for 20 ns at 500 K calculated from the last 20% of the trajectories.
RMSF analysis of the lipid-bound form of apoA-I confirmed that its N- and C-terminal domains are considerably more mobile than its central domain (Fig. 8 a). Since we previously showed that the N- and C-terminal domains (helix 1[44–65] and helix 10[220–241]) have significantly greater lipid affinity than the central tandem helical domains (helix 4[99–120], helix 5[121–142], and helix 6[143–164] (36)), the observation that the end domains of lipid-bound apoA-I have a much greater fluctuation than the central domain was unexpected.
Two major differences between the lipid-bound and lipid-free forms of apoA-I were demonstrated by RMSF analyses: 1), the N- and C-terminal domains of the lipid-bound form of apoA-I are more mobile than the N- and C-terminal domains of the lipid-free form (Fig. 8, a and b); and 2), the central domain of the lipid-bound form of apoA-I fluctuates very little compared to its end domains, whereas the central domain of the lipid-free form is as mobile as its end domains and more mobile than the central domain of the lipid-bound form (Fig. 8, a and b).
Fig. 8, c and d, plot the average helicity of each residue over the last 20% of the 500 K T-jump MD simulations of the lipid-bound and lipid-free forms of apoA-I, respectively. For the lipid-bound form (Fig. 8 c), helixes 4, 5, and 6 are the most stable, followed closely by helixes 2, 3, and 7. The N- and C-terminal helixes 1, 9, and 10 are less stable than the central ones, whereas the entirety of helix 8 and the portion of helix 2 adjacent to helix 1 are the least stable tandem helical repeats of the lipid-bound form of apoA-I. The junction between tandem helixes is punctuated by proline residues at all but the helix-2/helix-3 and helix-7/helix-8 junctions. The helix-2/helix-3 junction creates a continuous amphipathic helix, whereas the helix-7/helix-8 junction is punctuated by the helix-breaking residue triplet Gly-Gly-Ala, a sequence conserved in most mammals (data not shown). Tandem helical junctions are less stable than the central region of each helix for all except the helix-2/helix-3 (forms continuous amphipathic helix) and helix-9/helix-10 junctions.
The results for the lipid-free form of apoA-I are somewhat similar to those for the lipid-bound form except that, compared with the lipid-bound form: 1) central helixes 4, 5, and 6 are noticeably less stable, particularly at the junction between helixes 5 and 6; 2), helix 9 is less stable, particularly at its junction with helix 10 (a clear difference from the lipid-bound form); 3), helix 3 is more stable, particularly at its junction with helix 4; and 4), helix 1 is slightly less stable and helix 10 slightly more stable.
Role of buried interhelical salt bridges in the helix thermal stability of the central domain
We hypothesized that the relative helix thermal stability of the central domain of the lipid-bound form of apoA-I is partly the result of the buried salt bridges in the central region of the lipid-bound form of apoA-I. As one approach to test this hypothesis, we analyzed the persistence of the buried salt bridges with time of simulation (also see Fig. 2).
Fig. 9 a is a plot of the average distance between the six putative buried salt bridges over the 20 ns of the 500 K simulations. This figure shows that the two most centrally located of the three pairs of potential salt bridges in all six simulations are either generally maintained over the full 20 ns of the simulations (H155–E111 (salt bridge between helixes 6–4, termed SB6–4) and D89–R177 (SB3–7)) or for 10 of the 20 ns (E111–H155 (SB4–6) and R177–D89 (SB7–3)). The two most peripheral salt bridges, E89–R188 (SB2–8) and R188–E89 (SB8–2), are only weakly maintained and then for no more than 4 ns. The bar graph in Fig. 9 b confirms that the two central pairs of buried salt bridges are more stable over the full 20 ns of simulations than the peripheral pair.
To further test the salt bridge hypothesis, we correlated the position of the salt bridges to local helix thermal stability. Fig. 9 c is a plot of the local helix thermal stability at the individual amino acid residue level of the central portion of lipid-bound apoA-I overlaid with the locations of the three pairs of buried salt bridges. The location of the two centrally located buried salt bridge pairs correlated well with the central portions of helixes 3, 4, 6, and 7, regions of almost complete helix thermal stability, whereas the most peripheral pairs of buried salt bridges correlate poorly with regions of helix thermal stability.
Calculation of bilayer expansion during T-jump MD simulations from 310 K to 500 K
To calculate relative bilayer expansion, we developed a method for calculating the area per POPC using triangulation of time-averaged individual POPC phosphorus atom positions (Fig. 10). We calculated from the triangulation measurements of Fig. 10 a that the control periodic bilayer expands after T-jump to 500 K by a factor of ∼1.5, and we calculated from the triangulation measurements of Fig. 10 b that the 100:2 particles expand after T-jump to 500 K by a factor of ∼1.4. The calculated surface area/POPC for the periodic bilayer and the 100:2 particles of 68 Å2 and 64 Å2, respectively, at 310 K compare favorably to values of 64 ± 1 Å2 calculated in a previous MD simulation of fully hydrated POPC bilayers (39), 65 ± 1 Å2 calculated by us in a previous simulation of apoA-I/POPC discoidal particles (40), and experimentally determined values of 63 Å2 (41) and 66 Å2 (42).
Figure 10.
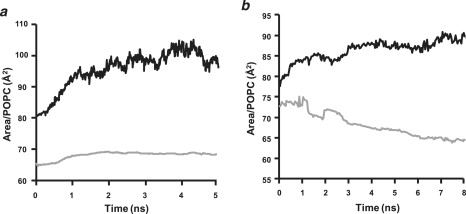
Running time-averaged surface area per POPC in periodic bilayer and 100:2 particles measured by triangulation of POPC COM (see Materials and Methods). (a) Periodic bilayer. (Gray line) 310 K simulations. (Black line) 500 K simulations. The calculated area of expansion after T-jump MD simulations at 500 K is 1.51. (b) 100:2 particles. (Gray line) 310 K simulations. (Black line) 500 K simulations. The calculated area of expansion after T-jump MD simulations at 500 K is 1.4.
Effect of bilayer expansion on a 100:2 particle (POPC/Δ43apoA-I) produced in synthetico
The degree of bilayer expansion produced by T-jump MD simulations at 500 K suggests that hypermobility of the N- and C-terminal overlap domains may be triggered by particle expansion. We turned to an experimental system to test this possibility: POPC complexes with Δ43apoA-I at eight POPC/protein molar ratios ranging from 100:2 to 600:2 were prepared by cholate dialysis and subjected to NDGGE analysis (Fig. 11). The results show that Δ43apoA-I exclusively forms 100:2 (R2-1) particles at a 100:2 molar ratio. With increasing POPC, beginning between the molar ratios of 120:2 and 140:2, larger fusion particles appear, the most prominent having a Stokes diameter of ∼170 Å. Using chemical cross-linking, we found that these larger particles contain three to four Δ43apoA-I per particle (data not shown); based on size, the most prominent fusion particle at 170 Å likely represents tetrameric R4.
Figure 11.
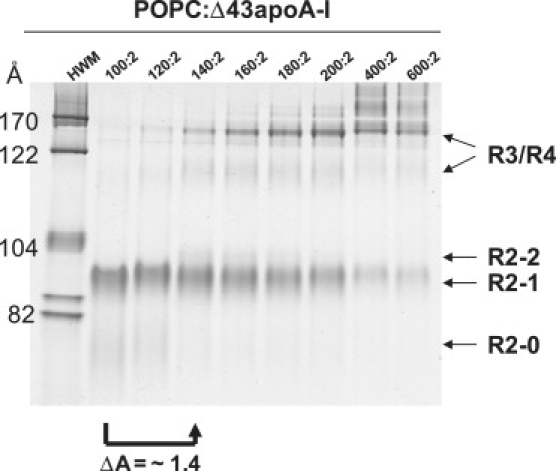
NDGGE analysis of POPC/Δ43apoA-I complexes at different POPC:protein ratios in 4–20% polyacrylamide gels run for 24 h. The arrow shows that expansion of the 100:2 particle by a factor of 1.4 through addition of POPC to produce a molar ratio of 140/2 POPC/Δ43apoA-I results in fusion of the R2-1 particle to produce larger particles in the 170 Å diameter range containing three to four Δ43apoA-I.
The next-largest R2 particle, R2-2 (160:2), appears as a minor particle at the molar ratio of 140:2 (Fig. 11). In contrast, full-length apoA-I forms mostly R2-2 particles at these molar ratios, whereas R2-1 is a minor particle (data not shown). In our previous publication (6) we showed that the R2-2 particle is modeled quite satisfactorily as an amphipathic helical double belt extending the full length of the lipid-associating domain, i.e., Δ43apoA-I, with N- and C-termini in direct contact. The failure of Δ43apoA-I to form stable R2-2 particles, therefore, was an enigma.
On the assumption that particle expansion is equivalent whether driven by additional POPC or T-jump, we applied the T-jump MD simulation expansion factor of 1.4 to the data in Fig. 11 (arrow connecting the 100:2 lane to the 140:2 lane). The results of this figure clearly show that particle expansion by a factor of 1.4 by addition of POPC, to produce a particle concentration of POPC that produces the unstable R2-2 particle, drives particle fusion.
Discussion
Application of the lipid-temperature expansion equivalence principle to the data in Fig. 11 leads to the working model that expansion of the particle PL beyond a critical value triggers instability of the N- and C-terminal overlap domains of Δ43apoA-I-containing particles (graphically illustrated in Fig. 12). From this model, we propose the hypothesis that terminal domain instability drives lipid exchange, equilibration, and remodeling between larger particles by inducing particle-particle fusion through exposure of hydrophobic patches of both lipid and protein. The lipid concentration-sensing molecular trigger model also provides a molecular rationale for the previously unexplained instability of R2-2 particles containing Δ43apoA-I.
Figure 12.
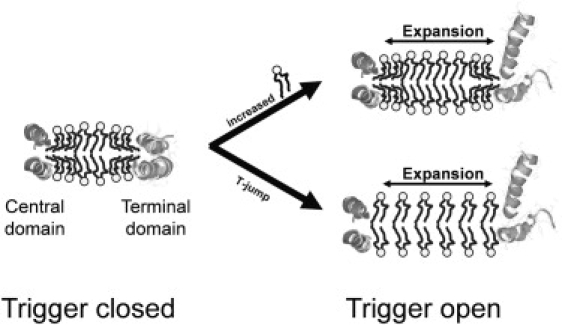
Schematic model of the terminal “trigger” domain hypothesis. PL molecules are represented schematically in the usual ball (light gray) and stick (black) motif. Particles are represented as bilayers in cross section. (Medium gray ribbon helixes) Terminal trigger domain. (Dark gray ribbon helixes) Central domain.
A simple thought experiment supports the concept that particle expansion can result in fusion: when particle size is taken to its extreme, the noncovalent bonds between the overlap regions are orders of magnitude weaker than the covalent bonds holding the remainder of the double-belt structure together, i.e., at a limiting particle size, the overlap regions would be unable to overlap. Thus hydrophobic patches of lipid would then be exposed, hydrophilic parts of amphipathic terminal domains would seek complementary partners, and fusion would result.
There are two issues with the T-jump MD simulations reported here that require discussion: 1) we employed a truncated form of apoA-I missing the N-terminal 40 amino acid residues of full-length apoA-I; and 2), we used high-temperature simulations without applying constraints to either the protein or the lipid.
We began our MD simulations with the truncated Δ40apoA-I (22) for the simple reason that we possessed a well-established detailed experimental model for 100:2 particles formed by a slightly shorter form of truncated apoA-I, Δ43apoA-I. Of importance, as shown in Fig. 11, Δ43apoA-I forms stable 100:2 particles with POPC in synthetico, but (relevant to later discussion) increased POPC concentration preferentially leads to particles containing more than two apoA-I at the expense of larger R2 particles, such as the 160:2 particle. The deletion mutant, Δ43apoA-I, contains the complete lipid-associating domain of apoA-I, a domain formed by 10 tandem repeating amphipathic helical domains between residues 44–241.
We have not yet published a detailed molecular model for particles formed with full-length apoA-I because we are uncertain about the organization of the N-terminal 43 residues of apoA-I on 100:2 particles; however, on the basis of hydrogen-deuterium exchange experiments, Wu et al. (43) suggest that this domain is disordered in lipidated apoA-I. Further, coarse-grained MD simulations of full-length apoA-I/POPC particles by Shih et al. (44,45) suggest that not only is this region disordered, but the N- and C-termini separate to expose lipid in a similar fashion to the structures we observe in Fig. 2 for Δ40apoA-I particles. Preliminary 500 K T-jump MD simulations on POPC-containing particles constructed with full-length apoA-I support the results of our simulations reported here of the structurally better-defined particle made from Δ40apoA-I. In three preliminary T-jump MD simulations at 500 K for 20 ns, we find that the N- and C-terminal overlap domain of full-length apoA-I-containing particles is at least as unstable as the N- and C-terminal overlap domain of Δ43apoA-I-containing particles (data not shown).
There are three concerns with our use of a temperature as high as 500 K for our T-jump MD simulations. One is that the water force field, TIP3P, used in our simulations is not parameterized as well at higher temperatures (to 375 K) as are other models, such as TIP5P (46). We do not consider this a serious issue, since 1), it seems reasonable that relative local helix conformational space would still be sampled through increased atomic and molecular velocities; 2), for all water force fields examined, the hydrophobic effect increases with temperature to 375 K (46); and 3), none of the available water models are parameterized to 500 K.
Because thermal denaturation is an accepted means of determining helix stability, we used T-jump MD simulations to determine the local per-residue helix thermal stability of a previously described PL-rich apoA-I double belt HDL particle. A second concern with our use of high-temperature MD simulations, therefore, is that we applied no constraints to either the protein or the lipid. The rationale for this approach was the hypothesis that the lipid in the HDL assemblies would place its own restraints on apoA-I. All of the parameters measured—RMSD, acyl chain SASA, RDF, ADF, and acyl chain order—support the persistence of a thinned and expanded, but intact, POPC bilayer. The trajectories of the six 500 K T-jump MD simulations show that each of the bilayers of the three simulations of I-1 and I-2 remained either completely intact to 10 ns or intact minus a single POPC molecule to 20 ns.
A third concern with the use of high temperatures is that the lipid bilayer may either be destroyed or so compromised as to invalidate the effects on helix stability. Clearly, the bilayer is not destroyed but is essentially intact in all six 500 K T-jump MD simulations to 20 ns, as Figs. 2, 4, 5, and 7 and Fig. S4 show. Fig. 4 shows that significant bilayer expansion has occurred. Fig. 10 provides a means to estimate this expansion as ∼1.4.
The loss of one POPC molecule from the particle in three of six simulations (Fig. 4 c and Fig. S1) was unexpected. Since POPC has a critical micelle concentration (CMC) that is minute (47), the probability of the loss of a POPC molecule from periodic boundary bilayers during MD simulations at 310 K is essentially zero, and in our single MD simulation of a periodic boundary bilayer at 500 K, no POPC loss occurred.
One possible explanation for the loss of POPC molecules from the 100:2 particles during T-jump MD simulations is that a POPC bilayer patch containing 100 molecules with edges exposed to solvent may be intrinsically unstable. To test the stability of a naked bilayer patch, we subjected a bilayer disc containing 100 POPC molecules from which the surrounding protein had been removed to three independent 20 ns MD simulations at 500 K. During these simulations, the POPC headgroups on the bilayer edges tended to curve to form partial bicelle-like structures (48) but there was no loss of POPC molecules from the lipid patch (Fig. S6).
It would appear then that the presence of protein surrounding a lipid patch is in some way related to POPC desorption. A likely explanation for the loss of POPC molecules from the 100:2 particles during T-jump MD simulations is that the protein-lipid interface may create an instability in the annular POPC molecules, resulting in flip-flop and POPC ejection from the particles. This instability could either be independent of, or the result of, increased molecular motion at higher temperatures. By comparing the RDFs of annular lipid in Figs. 6, c and d, and 7 c, one can see that the surface area/POPC of annular POPC in contact with the protein during T-jump is increased by as much as 50%, whereas the differential between the surface area/POPC of annular versus bulk POPC is decreased. Despite the differences in expansion of annular POPC at the two temperatures, the salt bridges formed by the edge phosphorus atoms with R interface basic residues appear little affected by T-jump (Fig. 7), suggesting some degree of stability in the protein-lipid interactions at the protein-lipid interface.
At this time, we cannot definitively say whether the T-jump to 500 K introduced artifacts into the behavior of the particles sufficient to call into question the assumption that particle expansion is equivalent whether driven by an excess of POPC or by T-jump. We know from examination of the trajectories of the T-jump simulations that two of the three POPC ejected from the particle during T-jump were in contact with the protein. We also know that equilibration of POPC between apoA-I/POPC particles of different sizes occurs slowly, on a timescale of days at 37°C, and that no measurable equilibration occurs between bulk POPC vesicles and particles (F. Gu, J. P. Segrest, and L. Li, unpublished data). These in synthetico results show that the presence of apoA-I on particles drives equilibration of POPC between particles by fusion and/or by movement of POPC through the solution.
We favor movement through the solution over fusion. The rate of DMPC equilibration between apoA-I/DMPC particles is three orders of magnitude faster than POPC equilibration—on the timescale of minutes at 37°C (F. Gu, J. P. Segrest, L. Li, unpublished data). However, DMPC particles are less likely to undergo fusion than POPC particles because, with increasing lipid concentration, DMPC forms the larger R2-4 and R2-5 particles with apoA-I before fusion occurs (6). Since POPC particles fuse before R2-4 and R2-5 are formed (F. Gu, J. P. Segrest, and L. Li, unpublished data), fusion is unlikely to be the predominant mechanism driving lipid equilibration between particles. The lower CMC of POPC compared to DMPC (47), on the other hand, is compatible with movement through solution. A definitive understanding of the mechanisms involved in lipid exchange between particles awaits future studies.
Our simulations show that, under the conditions of the simulations, the N- and C-terminal amphipathic helical domains of Δ40apoA-I (helix 1[44–65] and helix 10[220–241]) are much more mobile and helically less stable than the central domains (helix 4[99–120], helix 5[121–142], and helix 6[143–164]) when both domains are bound in the form of a double belt to the edge of a POPC bilayer disc. Several factors may determine this bimodality, as described below.
There are two types of end effects in action: the general instability of the ends of α-helixes due to a lack of end backbone hydrogen bonds (49), and the increased cooperativity of binding of the central portion of a flexible rod to a surface versus its end regions. It is important to note that both helix 1 and helix 10 of apoA-I, when synthesized as peptides, have significantly greater lipid affinity than peptide mimics of the central tandem helical domains (helix 4, 5, and 6) (36). Among other possible functions, this increase in lipid affinity of the end helixes may be an evolutionary adaptation to give the ends of apoA-I sufficient affinity for the disc edge to allow stable particle formation and interparticle lipid exchange. Further, as will be discussed below, helix 1 and helix 10 appear to be involved in initial binding of apoA-I to PL and assembly of PL-rich HDL particles.
One likely function of the six buried salt bridges at the center of the apoA-I double belt is to increase the stability and bilayer affinity of the central domain. Two factors may be at play here: the added cooperativity of an antiparallel pair of helixes working in tandem, and the added contribution of the amphipathic residues forming the salt bridges to the overall hydrophobicity of the antiparallel helical pairs in the center.
The structural ensemble of the six simulations in Fig. 3 shows that the conformational space is well sampled for the N- and C-terminal domain of the antiparallel Δ40apoA-I in the 100:2 particles, giving a diversity of microstates. The central domain is much less variable in all simulations; the only significant variation in structure occurred in T-jump MD simulation 500 K-1, when the central portion of the helix-5/5 pair became detached from the disc edge at ∼4 ns; the helix-5/5 pair remains attached throughout the full 20 ns of the other five simulations.
Bhat et al. (11,13), using a combination of chemical cross-linking and mass spectrometry, suggested that the N- and C-terminal regions of each apoA-I chain in the double-belt structure of PL-rich HDL are capable of forming intermolecular “hairpin” folds: 1), a cross-link between R1-K118 demonstrated contact between the N-terminus and helix 4; and 2), a cross-link between R182-K239 demonstrated contact between the C-terminal helix 10 and helix 8. These results, although implied by the authors to be the result of a rigid structure, are fully supportive of our MD thermal stability simulations suggesting dynamic motion of the N- and C-terminal open ends of the double-belt structure, since close contact during motion would result in cross-linking. An examination of the structures of the six simulations illustrated in Fig. 2 shows that, at some time point in all six simulations, either the C-terminal helix 10 (red arrowheads) or the N-terminal helix 1 (blue arrowheads), or both, form transient interhelical hairpins with adjacent regions.
The results of one additional cross-linking study also are compatible with hyperflexibility of the N-terminal domain of apoA-I (50). Further, there are electron paramagnetic resonance data suggesting that the N-terminal portion of apoA-I, including helix 1, has increased mobility in the lipid-bound form (51). Finally, as noted earlier in the Discussion, coarse-grained MD simulations by Shih et al. (44,45) suggest that the N- and C-terminal domains of particle-associated apoA-I are sufficiently flexible to expose lipid on the disc edge.
Most of the physical chemical methods used to date to examine apoA-I in HDL (fluorescence resonance energy transfer (12), cross-linking (13,14), hydrogen-deuterium exchange (43), and to a lesser extent spin-labeling (15,16)) cannot precisely quantify the fixed versus transient nature of close contacts because they tend to measure an average conformation. These procedures tend to overemphasize a “rigid” apoA-I structure at the expense of the more dynamic model suggested by our MD simulations.
In Fig. 9 a, the gray diamonds mark the position of the region of apoA1, residues 159–180, suggested by Wu et al. (43) on the basis of hydrogen-deuterium exchange to form a protruding solvent-exposed loop that they showed directly interacts with and activates LCAT. This region includes Tyr166 (black triangle), a preferred target for site-specific oxidative modification within atheroma according to Wu et al (43). Our simulations suggest that a portion of 159–180, specifically 159–173 in the junction between helixes 5 and 6, is less helically stable than regions where the salt bridges are located, but not uniquely so; 91–99 at the helix-3/4 junction is as unstable and the junctions between helixes 1 and 2, and helixes 7 and 8, as well as essentially all of helix 8, are more unstable than the Tyr166-containing loop reported by Wu et al. (43). It is perhaps significant that Shao et al. (52) suggest that Tyr192 in the unstable helix 8 is more important than Tyr166 in acting as a preferred atherogenic oxidation target.
It appears from Fig. 2 that the apoA-I double belts maintain their saddle-shaped pseudo-D2 symmetry (figure-8 shape in projection) for the full 20 ns of simulation at 500 K for all the particles except 500 K-1. However, an answer as to whether the minimal surface model we previously proposed for the structure of the 100:2 particle (22) holds with extensive sampling of conformational space will require application of a cool-down step of MD simulated annealing to the particles subjected to T-jump MD simulations at 500 K.
We propose a mobile terminal domain model for PL-rich HDL in which a portion of the double-belt apoA-I in discoidal HDL can undergo significant motion. Specifically, we propose that the terminal domain (helixes 1 and 10) is potentially more flexible and mobile than the central domain (antiparallel helixes 4–6). A critical question that we are not yet in a position to answer is, What is the relaxation time of the terminal domain dynamics in the unexpanded 100:2 state at 310 K? Based on our preliminary MD simulations mentioned above, we propose that the model will also prove valid for full-length apoA-I. It certainly is true that the first 43 residues of apoA-I provide an additional degree of particle stability, since full-length apoA-I forms the larger R2-2 and R2-3 particles containing ∼160 and 180 POPC molecules, respectively.
The roles of the N- and C termini of apoA-I, given their high intrinsic lipid affinity (36), appear to be to modulate the lipid-free structure and lipid interactions of the protein (53–55). According to the two-step mechanism for apoA-I binding to lipid particles, apoA-I initially binds to lipid through the C-terminal domain, followed by a conformational opening of the helix bundle in the N-terminal domain (53,55,56). The N-terminal domain may favor lipid binding by maintaining a certain conformation in which the initial lipid-binding sites of the protein are accessible to the lipid (53). Mutations in both the N- and C-terminal domains restore the lipid-binding capability despite the disruption/removal of the C-terminal domain that is critical for lipid binding (55). These results are fully compatible with our mobile terminal domain model for the structure of PL-rich HDL.
In conclusion, lipid exchange and equilibration and particle remodeling are critically important processes during metabolism of HDL particles (1,5,57–59); these processes, for example, are critical at every step in reverse cholesterol transport (Fig. 1). For this reason, our experimentally testable hypothesis—that the dynamic nature of the terminal domains of the double-belt structure act as PL concentration-sensitive molecular triggers for exchange, equilibration, and remodeling of HDL particles—has substantial biological implications. Additionally, the model may provide a potential conduit for additional biological processes, such as PL transfer protein (60), CE transfer protein, and the CE transporter, SR-B1 (see Fig. 1), to gain access to the lipid interior of HDL particles.
Supporting Material
Six figures are available at http://www.biophysj.org/biophysj/supplemental/S0006-3495(08)00051-9.
Supporting Material
Acknowledgments
We thank the staff of Information Technology and the Department of Mechanical Engineering, University of Alabama at Birmingham, for use of the IBM Blue Gene/L rack that they jointly maintain.
This work was supported in part by the National Institutes of Health (grant P01 HL-34343 to J.P.S.).
References
- 1.Linsel-Nitschke P., Tall A.R. HDL as a target in the treatment of atherosclerotic cardiovascular disease. Nat. Rev. Drug Discov. 2005;4:193–205. doi: 10.1038/nrd1658. [DOI] [PubMed] [Google Scholar]
- 2.Oram J.F., Heinecke J.W. ATP-binding cassette transporter A1: a cell cholesterol exporter that protects against cardiovascular disease. Physiol. Rev. 2005;85:1343–1372. doi: 10.1152/physrev.00005.2005. [DOI] [PubMed] [Google Scholar]
- 3.Nichols A.V., Blanche P.J., Gong E.L., Shore V.G., Forte T.M. Molecular pathways in the transformation of model discoidal lipoprotein complexes induced by lecithin:cholesterol acyltransferase. Biochim. Biophys. Acta. 1985;834:285–300. doi: 10.1016/0005-2760(85)90001-3. [DOI] [PubMed] [Google Scholar]
- 4.Trigatti B.L., Krieger M., Rigotti A. Influence of the HDL receptor SR-BI on lipoprotein metabolism and atherosclerosis. Arterioscler. Thromb. Vasc. Biol. 2003;23:1732–1738. doi: 10.1161/01.ATV.0000091363.28501.84. [DOI] [PubMed] [Google Scholar]
- 5.Rye K.A., Clay M.A., Barter P.J. Remodelling of high density lipoproteins by plasma factors. Atherosclerosis. 1999;145:227–238. doi: 10.1016/s0021-9150(99)00150-1. [DOI] [PubMed] [Google Scholar]
- 6.Li L., Chen J., Mishra V.K., Kurtz J.A., Cao D. Double belt structure of discoidal high density lipoproteins: molecular basis for size heterogeneity. J. Mol. Biol. 2004;343:1293–1311. doi: 10.1016/j.jmb.2004.09.017. [DOI] [PubMed] [Google Scholar]
- 7.Segrest J.P., Jackson R.L., Morrisett J.D., Gotto A.M. A molecular theory of lipid-protein interactions in the plasma lipoproteins. FEBS Lett. 1974;38:247–258. doi: 10.1016/0014-5793(74)80064-5. [DOI] [PubMed] [Google Scholar]
- 8.Segrest J.P., Garber D.W., Brouillette C.G., Harvey S.C., Anantharamaiah G.M. The amphipathic α-helix: a multifunctional structural motif in plasma apolipoproteins. Adv. Protein Chem. 1994;45:303–369. doi: 10.1016/s0065-3233(08)60643-9. [DOI] [PubMed] [Google Scholar]
- 9.Segrest J.P., Jones M.K., Klon A.E., Sheldahl C.J., Hellinger M. A detailed molecular belt model for apolipoprotein A-I in discoidal high density lipoprotein. J. Biol. Chem. 1999;274:31755–31758. doi: 10.1074/jbc.274.45.31755. [DOI] [PubMed] [Google Scholar]
- 10.Davidson W.S., Hilliard G.M. The spatial organization of apolipoprotein A-I on the edge of discoidal high density lipoprotein particles: a mass specrometry study. J. Biol. Chem. 2003;278:27199–27207. doi: 10.1074/jbc.M302764200. [DOI] [PubMed] [Google Scholar]
- 11.Bhat S., Sorci-Thomas M.G., Alexander E.T., Samuel M.P., Thomas M.J. Intermolecular contact between globular N-terminal fold and C-terminal domain of ApoA-I stabilizes its lipid-bound conformation: studies employing chemical cross-linking and mass spectrometry. J. Biol. Chem. 2005;280:33015–33025. doi: 10.1074/jbc.M505081200. [DOI] [PubMed] [Google Scholar]
- 12.Li H., Lyles D.S., Thomas M.J., Pan W., Sorci-Thomas M.G. Structural determination of lipid-bound apo A-I using fluorescence resonance energy transfer. J. Biol. Chem. 2000;275:37048–37054. doi: 10.1074/jbc.M005336200. [DOI] [PubMed] [Google Scholar]
- 13.Bhat S., Sorci-Thomas M.G., Tuladhar R., Samuel M.P., Thomas M.J. Conformational adaptation of apolipoprotein A-I to discretely sized phospholipid complexes. Biochemistry. 2007;46:7811–7821. doi: 10.1021/bi700384t. [DOI] [PMC free article] [PubMed] [Google Scholar]
- 14.Davidson W.S., Thompson T.B. The structure of apolipoprotein A-I in high density lipoproteins. J. Biol. Chem. 2007;282:22249–22253. doi: 10.1074/jbc.R700014200. [DOI] [PubMed] [Google Scholar]
- 15.Panagotopulos S.E., Horace E.M., Maiorano J.N., Davidson W.S. Apolipoprotein A-I adopts a belt-like orientation in reconstituted high density lipoproteins. J. Biol. Chem. 2001;276:42965–42970. doi: 10.1074/jbc.M106462200. [DOI] [PubMed] [Google Scholar]
- 16.Martin D.D., Budamagunta M.S., Ryan R.O., Voss J.C., Oda M.N. Apolipoprotein A-I assumes a “looped belt“ conformation on reconstituted high density lipoprotein. J. Biol. Chem. 2006;281:20418–20426. doi: 10.1074/jbc.M602077200. [DOI] [PubMed] [Google Scholar]
- 17.Borhani D.W., Rogers D.P., Engler J.A., Brouillette C.G. Crystal structure of truncated human apolipoprotein A-I suggests a lipid-bound conformation. Proc. Natl. Acad. Sci. USA. 1997;94:12291–12296. doi: 10.1073/pnas.94.23.12291. [DOI] [PMC free article] [PubMed] [Google Scholar]
- 18.Blundell T., Barlow D., Borkakoti N., Thornton J. Solvent-induced distortions and the curvature of α-helices. Nature. 1983;306:281–283. doi: 10.1038/306281a0. [DOI] [PubMed] [Google Scholar]
- 19.Bussell R., Eliezer D. A structural and functional role for 11-mer repeats in α-synuclein and other exchangeable lipid binding proteins. J. Mol. Biol. 2003;329:763–778. doi: 10.1016/s0022-2836(03)00520-5. [DOI] [PubMed] [Google Scholar]
- 20.Bussell R., Ramlall T.F., Eliezer D. Helix periodicity, topology, and dynamics of membrane-associated α-synuclein. Protein Sci. 2005;14:862–872. doi: 10.1110/ps.041255905. [DOI] [PMC free article] [PubMed] [Google Scholar]
- 21.Brouillette C.G., Jones J.L., Ng T.C., Kercret H., Chung B.H. Structural studies of apolipoprotein A-I/phosphatidylcholine recombinants by high-field proton NMR, nondenaturing gradient gel electrophoresis, and electron microscopy. Biochemistry. 1984;23:359–367. doi: 10.1021/bi00297a027. [DOI] [PubMed] [Google Scholar]
- 22.Catte A., Patterson J.C., Jones M.K., Jerome W.G., Bashtovyy D. Novel changes in discoidal high density lipoprotein morphology: a molecular dynamics study. Biophys. J. 2006;90:4345–4360. doi: 10.1529/biophysj.105.071456. [DOI] [PMC free article] [PubMed] [Google Scholar]
- 23.Mehta R., Gantz D.L., Gursky O. Human plasma high-density lipoproteins are stabilized by kinetic factors. J. Mol. Biol. 2003;328:183–192. doi: 10.1016/s0022-2836(03)00155-4. [DOI] [PubMed] [Google Scholar]
- 24.Humphrey W., Dalke A., Schulten K. VMD: visual molecular dynamics. J. Mol. Graph. 1996;14:33–38. doi: 10.1016/0263-7855(96)00018-5. 27–28. [DOI] [PubMed] [Google Scholar]
- 25.Kalé L., Skeel R., Bhandarkar M., Brunner R., Gursoy A. NAMD2: greater scalability for parallel molecular dynamics. J. Comput. Phys. 1999;151:283–312. [Google Scholar]
- 26.Jorgensen W.L., Chandrasekhar J., Madura J.D. Comparison of simple potential functions for simulating liquid water. J. Chem. Phys. 1983;79:926–935. [Google Scholar]
- 27.MacKerell A.D., Bashford D., Bellot M., Dunbrack R.L., Evanseck J. All-atom empirical potential for molecular modeling and dynamics studies of proteins. J. Phys. Chem. B. 1998;102:3586–3616. doi: 10.1021/jp973084f. [DOI] [PubMed] [Google Scholar]
- 28.Brooks B., Bruccoleri R., Olafson B., States D., Swaminathan S. CHARMM: a program for macromolecular energy, minimization, and dynamics calculations. J. Comput. Chem. 1983;4:187–217. [Google Scholar]
- 29.Feller S.E., Pastor R.W. Length scales of lipid dynamics and molecular dynamics. Pac. Symp. Biocomput. 1997:142–150. [PubMed] [Google Scholar]
- 30.Schlenkrich M., Brickmann J., MacKerell A., Karplus M. An empirical potential energy function for phospholipids: criteria for parameter optimization and applications. In: Merz K.M., Roux B., editors. Biological Membranes: A Molecular Perspective from Computation and Experiment. Birkhauser; Boston: 1996. pp. 31–81. [Google Scholar]
- 31.Harvey S.C., Tan R.K.Z., Cheatham T.E. The flying ice cube: velocity rescaling in molecular dynamics leads to violation of energy equipartition. J. Comput. Chem. 1998;19:726–740. [Google Scholar]
- 32.Catte A., Patterson J.C., Bashtovyy D., Jones M.K., Gu F. Structure of spheroidal HDL particles revealed by combined atomistic and coarse-grained simulations. Biophys. J. 2008;94:2306–2319. doi: 10.1529/biophysj.107.115857. [DOI] [PMC free article] [PubMed] [Google Scholar]
- 33.Frishman D., Argos P. Knowledge-based protein secondary structure assignment. Proteins. 1995;23:566–579. doi: 10.1002/prot.340230412. [DOI] [PubMed] [Google Scholar]
- 34.Rogers D.P., Brouillette C.G., Engler J.A., Tendian S.W., Roberts L. Truncation of the amino terminus of human apolipoprotein A-I substantially alters only the lipid-free conformation. Biochemistry. 1997;36:288–300. doi: 10.1021/bi961876e. [DOI] [PubMed] [Google Scholar]
- 35.Jonas A. Reconstitution of high-density lipoproteins. Methods Enzymol. 1986;128:553–582. doi: 10.1016/0076-6879(86)28092-1. [DOI] [PubMed] [Google Scholar]
- 36.Palgunachari M.N., Mishra V.K., Lund-Katz S., Phillips M.C., Adeyeye S.O. Only the two end helixes of eight tandem amphipathic helical domains of human apo A-I have significant lipid affinity. Implications for HDL assembly. Arterioscler. Thromb. Vasc. Biol. 1996;16:328–338. doi: 10.1161/01.atv.16.2.328. [DOI] [PubMed] [Google Scholar]
- 37.Segrest J.P., Anantharamaiah G.M. Pathogenesis of atherosclerosis. Curr. Opin. Cardiol. 1994;9:404–410. [PubMed] [Google Scholar]
- 38.Thomas M.J., Bhat S., Sorci-Thomas M.G. Three dimensional models of high density lipoprotein apoa-I: implications for its assembly and function. J. Lipid Res. 2008;49:1875–1883. doi: 10.1194/jlr.R800010-JLR200. [DOI] [PMC free article] [PubMed] [Google Scholar]
- 39.Murzyn K., Rog T., Jezierski G., Takaoka Y., Pasenkiewicz-Gierula M. Effects of phospholipid unsaturation on the membrane/water interface: a molecular simulation study. Biophys. J. 2001;81:170–183. doi: 10.1016/S0006-3495(01)75689-5. [DOI] [PMC free article] [PubMed] [Google Scholar]
- 40.Klon A.E., Segrest J.P., Harvey S.C. Molecular dynamics simulations on discoidal HDL particles suggest a mechanism for rotation in the apo A-I belt model. J. Mol. Biol. 2002;324:703–721. doi: 10.1016/s0022-2836(02)01143-9. [DOI] [PubMed] [Google Scholar]
- 41.Smaby J.M., Momsen M.M., Brockman H.L., Brown R.E. Phosphatidylcholine acyl unsaturation modulates the decrease in interfacial elasticity induced by cholesterol. Biophys. J. 1997;73:1492–1505. doi: 10.1016/S0006-3495(97)78181-5. [DOI] [PMC free article] [PubMed] [Google Scholar]
- 42.Hyslop P.A., Morel B., Sauerheber R.D. Organization and interaction of cholesterol and phosphatidylcholine in model bilayer membranes. Biochemistry. 1990;29:1025–1038. doi: 10.1021/bi00456a027. [DOI] [PubMed] [Google Scholar]
- 43.Wu Z., Wagner M.A., Zheng L., Parks J.S., Shy J.M. The refined structure of nascent HDL reveals a key functional domain for particle maturation and dysfunction. Nat. Struct. Mol. Biol. 2007;14:861–868. doi: 10.1038/nsmb1284. [DOI] [PubMed] [Google Scholar]
- 44.Shih A.Y., Freddolino P.L., Arkhipov A., Schulten K. Assembly of lipoprotein particles revealed by coarse-grained molecular dynamics simulations. J. Struct. Biol. 2007;157:579–592. doi: 10.1016/j.jsb.2006.08.006. [DOI] [PubMed] [Google Scholar]
- 45.Shih A.Y., Freddolino P.L., Sligar S.G., Schulten K. Disassembly of nanodiscs with cholate. Nano Lett. 2007;7:1692–1696. doi: 10.1021/nl0706906. [DOI] [PubMed] [Google Scholar]
- 46.Paschek D. Temperature dependence of the hydrophobic hydration and interaction of simple solutes: an examination of five popular water models. J. Chem. Phys. 2004;120:6674–6690. doi: 10.1063/1.1652015. [DOI] [PubMed] [Google Scholar]
- 47.Vogel M., Munster C., Fenzl W., Salditt T. Thermal unbinding of highly oriented phospholipid membranes. Phys. Rev. Lett. 2000;84:390–393. doi: 10.1103/PhysRevLett.84.390. [DOI] [PubMed] [Google Scholar]
- 48.Prosser R.S., Evanics F., Kitevski J.L., Al-Abdul-Wahid M.S. Current applications of bicelles in NMR studies of membrane-associated amphiphiles and proteins. Biochemistry. 2006;45:8453–8465. doi: 10.1021/bi060615u. [DOI] [PubMed] [Google Scholar]
- 49.Forood B., Feliciano E.J., Nambiar K.P. Stabilization of α-helical structures in short peptides via end capping. Proc. Natl. Acad. Sci. USA. 1993;90:838–842. doi: 10.1073/pnas.90.3.838. [DOI] [PMC free article] [PubMed] [Google Scholar]
- 50.Silva R.A., Hilliard G.M., Li L., Segrest J.P., Davidson W.S. A mass spectrometric determination of the conformation of dimeric apolipoprotein A-I in discoidal high density lipoproteins. Biochemistry. 2005;44:8600–8607. doi: 10.1021/bi050421z. [DOI] [PubMed] [Google Scholar]
- 51.Lagerstedt J.O., Budamagunta M.S., Oda M.N., Voss J.C. Electron paramagnetic resonance spectroscopy of site-directed spin labels reveals the structural heterogeneity in the N-terminal domain of apoA-I in solution. J. Biol. Chem. 2007;282:9143–9149. doi: 10.1074/jbc.M608717200. [DOI] [PubMed] [Google Scholar]
- 52.Shao B., Oda M.N., Bergt C., Fu X., Green P.S. Myeloperoxidase impairs ABCA1-dependent cholesterol efflux through methionine oxidation and site-specific tyrosine chlorination of apolipoprotein A-I. J. Biol. Chem. 2006;281:9001–9004. doi: 10.1074/jbc.C600011200. [DOI] [PubMed] [Google Scholar]
- 53.Fang Y., Gursky O., Atkinson D. Lipid-binding studies of human apolipoprotein A-I and its terminally truncated mutants. Biochemistry. 2003;42:13260–13268. doi: 10.1021/bi0354031. [DOI] [PubMed] [Google Scholar]
- 54.Fang Y., Gursky O., Atkinson D. Structural studies of N- and C-terminally truncated human apolipoprotein A-I. Biochemistry. 2003;42:6881–6890. doi: 10.1021/bi034152t. [DOI] [PubMed] [Google Scholar]
- 55.Tanaka M., Vedhachalam C., Sakamoto T., Dhanasekaran P., Phillips M.C. Effect of carboxyl-terminal truncation on structure and lipid interaction of human apolipoprotein E4. Biochemistry. 2006;45:4240–4247. doi: 10.1021/bi060023b. [DOI] [PubMed] [Google Scholar]
- 56.Saito H., Lund-Katz S., Phillips M.C. Contributions of domain structure and lipid interaction to the functionality of exchangeable human apolipoproteins. Prog. Lipid Res. 2004;43:350–380. doi: 10.1016/j.plipres.2004.05.002. [DOI] [PubMed] [Google Scholar]
- 57.Rye K.A., Wee K., Curtiss L.K., Bonnet D.J., Barter P.J. Apolipoprotein A-II inhibits high density lipoprotein remodeling and lipid-poor apolipoprotein A-I formation. J. Biol. Chem. 2003;278:22530–22536. doi: 10.1074/jbc.M213250200. [DOI] [PubMed] [Google Scholar]
- 58.Liang H.Q., Rye K.A., Barter P.J. Remodelling of reconstituted high density lipoproteins by lecithin: cholesterol acyltransferase. J. Lipid Res. 1996;37:1962–1970. [PubMed] [Google Scholar]
- 59.Rye K.A., Duong M., Psaltis M.K., Curtiss L.K., Bonnet D.J. Evidence that phospholipids play a key role in pre-β apoA-I formation and high-density lipoprotein remodeling. Biochemistry. 2002;41:12538–12545. doi: 10.1021/bi025998k. [DOI] [PubMed] [Google Scholar]
- 60.Pussinen P.J., Jauhiainen M., Metso J., Pyle L.E., Marcel Y.L. Binding of phospholipid transfer protein (PLTP) to apolipoproteins A-I and A-II: location of a PLTP binding domain in the amino terminal region of apoA-I. J. Lipid Res. 1998;39:152–161. [PubMed] [Google Scholar]
Associated Data
This section collects any data citations, data availability statements, or supplementary materials included in this article.