Abstract
We demonstrate the application of polydimethylsiloxane (PDMS) thin films in highly sensitive pressure and oxygen sensors, designed for pressure and oxygen content measurements within the heart and blood vessels. PDMS thin film displacement as a result of pressure changes was transduced by a capacitive detection technique to produce quantitative measurement of absolute pressures. Oxygen measurements were obtained by transducing the current change between a Pt and an Ag/AgCl electrode on a glass substrate, with KCl soaked filter paper as the electrolytic media that is separated from the oxygen carrying fluid by a thin PDMS membrane. The best sensitivity for the pressure sensor was ~0.1 nA/KPa, with a noise limited resolution of ~0.09 KPa. For the oxygen sensor, the best sensitivity was ~2.75 μA for 1% change in oxygen content of the surrounding media, with a noise limited resolution of ~6.18 ppm oxygen. These experimental results agree with theoretical modeling predictions, and suggest that the semi-permeable and biocompatible PDMS can be successfully adopted as the contacting membrane in an integrated sensor design to quantify pressure and oxygen content in blood.
Keywords: Implantable, biocompatible, oxygen sensor, pressure sensor, polydimethylsiloxane thin film
1. Introduction
Reliable and accurate blood pressure and oxygenation measurements within the cardiovascular system have important clinical applications. In particular, following pediatric heart surgery, pressures and oxygen content in the various heart chambers provide important clinical information on the functional status of the cardiopulmonary system, and therefore require constant monitoring during postoperative recovery. Presently, intracardiac pressures are monitored by fluid-filled catheters that traverse the wall of the heart and body wall to connect to an external transducer. There are associated significant bleeding, infection, and malfunction risks. Oxygen measurements require removing significant volume of blood from the patient for blood gas analysis. This not only wastes blood volume in sometimes very small patients, blood gas analysis does not allow for continuous oxygenation monitoring in critically ill patients. There is a clinical need to develop an integrated sensor system that can simultaneously, and continuously, monitor pressure and oxygenation within the cardiovascular space. And because of the size constraints in infants and small children, this novel sensor system needs to allow for sufficient miniaturization.
A variety of pressure sensors exist based on optical, capacitive, piezoelectric, and piezoresistive transduction mechanisms [1] - [4], with piezoresistive and capacitive most commonly adopted in the clinical setting. The piezoresistive sensor, developed in the 1980s, has gained popularity because of its high linearity within the sensitivity range. However, it is prone to temperature variations, so temperature compensation circuits are necessary. In addition, it requires a very thin diaphragm to obtain sufficient sensitivity, which in turn requires sophisticated fabrication processes (i.e. ion implantation or thermal diffusion processes). On the other hand, capacitive pressure sensors have improved sensitivity, and are largely independent of environmental temperature fluctuations. In addition, capacitive pressure sensors are relatively simple and less expensive to fabricate, and their high scalablility allows for easier miniaturization.
Oxygen sensing in blood has primarily been developed using either optical or electrochemical methods. Optical sensing method applies a light source into blood, and requires fluorescence or luminescence technology to detect absorption. Typically the intensity of luminescence decreases along with time and the oxygen concentration in the sample can be calculated from the degree of quenching. Because of the high power requirement, and the need for sizable components, application in the pediatric cardiovascular system is prohibitive. However, electrochemical methods that apply a Clark electrode using platinum electrode (cathode), silver electrode (anode) and KCl electrolyte hold great promise as an implantable sensor system for intra-cardiac oxygen sensing. For example, Suzuki et al. suggested an integrated miniaturized system to measure pO2, pCO2 and pH using glass fabrication technology [5], and further developed an electrochemical microsystem to measure pO2 in blood sample using Clark type electrode to characterize its sensitivity [6].
In order to develop an integrated pressure and oxygen sensor, we report the application of PDMS thin films in a novel capacitive and electrochemical sensor design. The application of PDMS offers distinct advantages over other biocompatible materials: (i) higher sensitivity due to low young’s modulus of PDMS (<100 MPa), (ii) very high permeability to oxygen but impervious to liquids, and (iii) proven biocompatibility. Due to low young’s modulus of PDMS, highly sensitive pressure sensors can be fabricated by transducing the PDMS membrane deflection [7]. This is especially critical for sensors with small dimensions, as in pediatric cardiovascular application, which in general have reduced sensitivity due to reduced deflection. Integrating the PDMS thin film as the separation membrane in the electrochemical Clark electrode, the high permeability for oxygen also allows for fast response time for oxygen sensing. In this study, we report the feasibility of using thin PDMS membranes for measuring changes in oxygen content and pressure in a fluid environment. These results suggest that PDMS thin films can be successfully adopted in an integrated pressure and oxygen sensor design, with potential for clinical cardiovascular applications.
2. Materials and methods
2.1 Pressure sensor design
The operation of the pressure sensor is based on the change in deflection of a thin PDMS membrane with change in fluid pressure. The pressure induced deflection of the PDMS membrane can be estimated from the change in capacitance between the membrane (which can be made conductive by coating with a metal film), and another conductive stationary electrode placed in close proximity [see Fig. 1 (a)]. The change in capacitance can be determined from the change in ac current flowing between the two plates of the capacitor upon application of an externally applied ac voltage [3]. The deflection of a thin membrane w(r) at a given radial distance r [see Fig. 1 (b)] is given by [8]:
Figure 1.
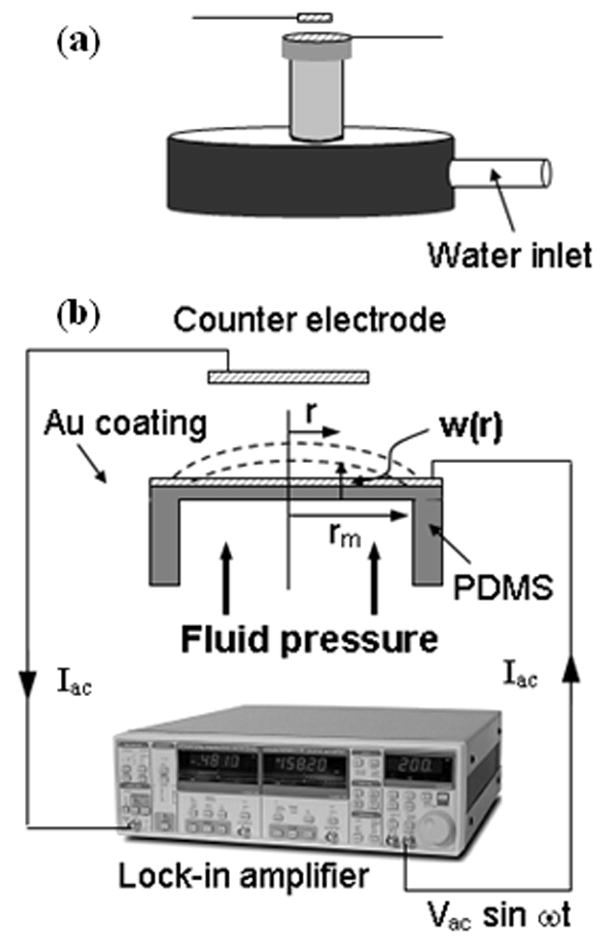
Schematic diagram of the (a) pressure sensor and (b) measurement set up.
| (1) |
where, p is the uniform differential pressure applied at the bottom of the membrane, rm, ν, E and t are the radius, poisson’s ratio, elastic constant, and thickness of the membrane, respectively. The calculated variations of w(r) as a function of its thickness and radius based on Eq. (1) are shown in Figs. 2 (a) and (b). The relationship between the current Iac flowing through the capacitor (C), and the membrane deflection Δd, is given as:
Figure 2.
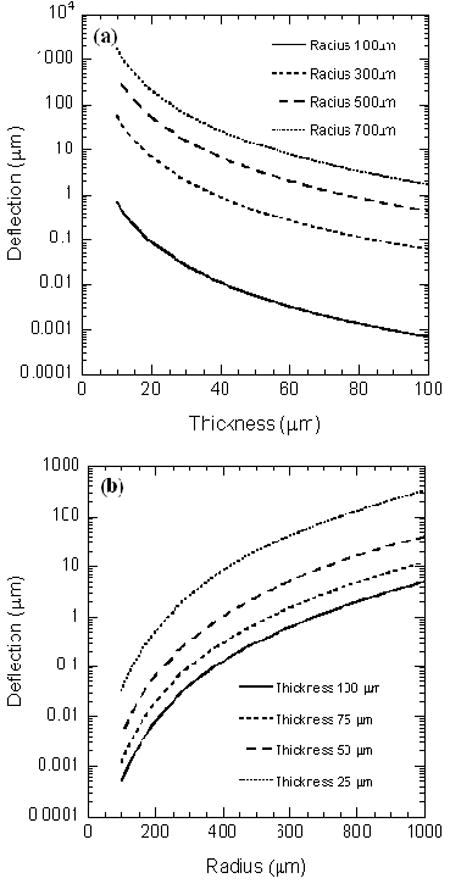
Variation of PDMS membrane deflection as a function of its (a) thickness, and (b) radius.
| (2) |
Here the capacitance has been calculated based on parallel plate approximation, and assuming Δd ≪ d.
We built a pressure sensor prototype using PDMS membrane with diameter 3 mm and thickness 30 μm, which was coated with a layer of Cr (5nm)/Au (25 nm) to make it conductive. Figure 3 shows an optical image of the PDMS membrane as well as a cross-sectional scanning electron micrograph (SEM) image of a typical PDMS film. The membrane pressure was varied by changing the height of a water column in a vertical tube which was attached to the fluid cavity. The change in pressure was determined by measuring the ac current flowing between the metal coated PDMS film and another Au coated Si wafer counter electrode with nominal size 2 × 2 mm, by applying an ac voltage of 1 V rms and frequency 1 KHz. The separation d, between the two electrodes was kept at 3 mm. The pressure on the PDMS membrane was changed by varying the height of the water column in a pipe attached to the fixture as shown in Fig. 1(a).
Figure 3.
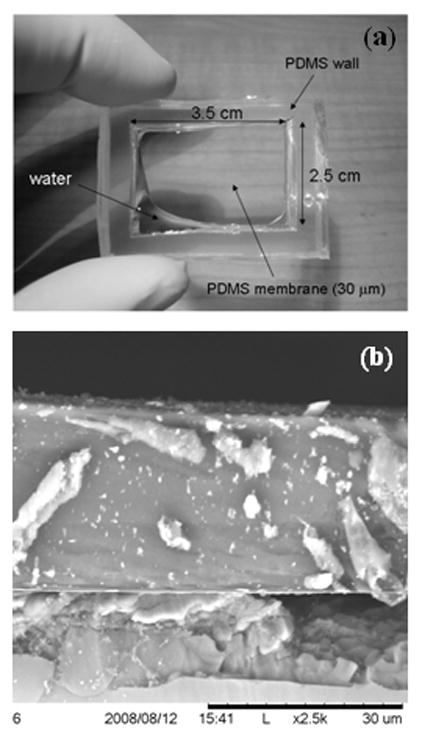
(a) Optical image showing the PDMS membrane and thick cavity walls, (b) Cross-sectional SEM image showing the thickness and uniformity of a typical 30 μm thick PDMS film.
2.2 Oxygen sensor design
The blood oxygen sensing was performed based on the change in current flowing between a Pt and an Ag/AgCl electrode kept in contact with KCl solution soaked filter paper. The current flowing between the electrodes, which were maintained at a potential difference equal to the reduction potential of dissolved oxygen, can respond to any change in the dissolved oxygen content in the KCl solution with high sensitivity [9], [10]. For estimating the oxygen content of a given test liquid, the sensor (and KCl soaked filter paper) can be separated from the liquid using a PDMS thin film as the intervening membrane. Due to high oxygen permeability of the PDMS membrane [11], the dissolved oxygen in the KCl solution will track the dissolved oxygen content in the test liquid quite accurately.
The fabricated sensor consisted of three layers: a gas-permeable membrane (PDMS, film thickness: 30 μm), a membrane filter with the dimension of 20mm × 12mm (Isopore VMTP4700, Millipore Corp., USA) containing electrolytic solution (KCl 0.1 mol/L). The schematic diagram of the sensor is shown in Fig. 4. Pt working electrode and Ag/AgCl reference electrode are fabricated on the top layer with electron beam deposition (electrode thickness: 100 nm). The electrode is a simple stripe design: the width of the Pt electrode 10 mm and that of the Ag/AgCl electrode is 5 mm. The sensor is fabricated by stacking the electrodes, gas-permeable membrane and solution-permeable filter together. Its chemical reactions are followings:
Figure 4.
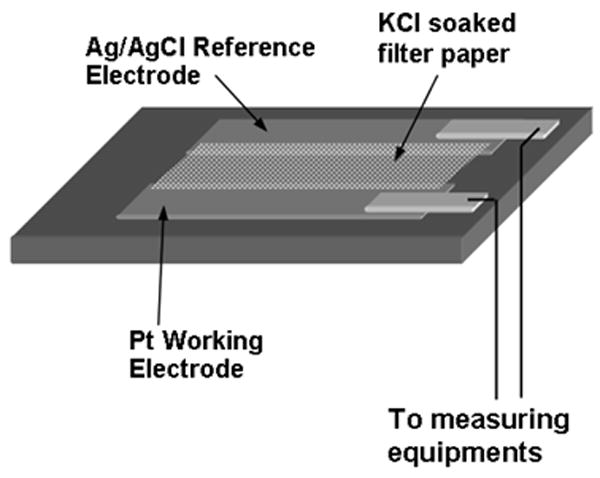
Schematic diagram of the oxygen sensing set up.
3. Results and discussion
3.1. Pressure sensor
To evaluate the pressure sensor, we varied the height of the water column in a polyethylene pipe attached to the text fixture in Fig. 1(a) over a range of 350 mm, or equivalent of ~26 mm Hg, which is on the order of the expected range of cardiac pressure variation (usually several tens of mm of Hg). The change in the measured output current plotted against the change in pressure is shown in Fig. 5. The theoretically calculated response based on Eqs. (1) and (2) is also shown for reference. A very nice theoretical fit to the experimental data can be observed. For theoretical calculations we assumed: d = 3.0 mm, t = 30 μm, rm = 1.5 mm, E = 92 MPa, and effective area of 18 mm2. The effective area used in the theoretical simulation is larger than the actual area of the electrode due to parasitic effects associated with the metallic holder holding the counter electrode. The young’s modulus of 92 MPa was determined for the PDMS films based on Eq. (1), using their deflection of 1 mm for a pressure change of 3.5 KPa. We observe from Fig. 5 that the maximum sensitivity of this pressure sensor is > 0.1 nA/KPa. To find out the noise limited sensitivity, we measured the noise of the sensor, which is shown in the inset of Fig. 5. The rms noise is measured to be ~0.009 nA, making the noise limited resolution of the sensor as ~0.09 KPa or ~0.68 mm Hg. This is more than sufficient for blood pressure sensing applications which typically have resolutions of ~1 mm Hg. The non-linearity observed for entire range of ~26 mm Hg is also quite small, enabling high resolution operation in the entire range of interest. This resolution can be further improved by reducing the distance between the PDMS membrane and the counter electrode (see Fig. 1). In addition, the sensor can be easily miniaturized and even microfabricated, since the PDMS films can be easily miniaturized and electrodes can be deposited by micro-lithographic techniques.
Figure 5.
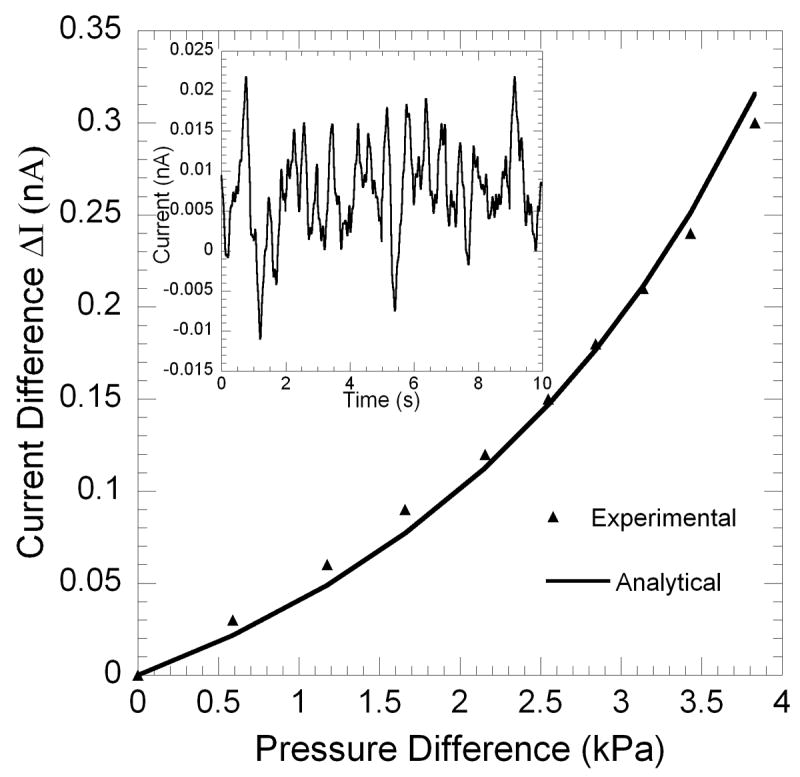
Variation of capacitive current with pressure on the PDMS membrane. The theoretical simulation is also shown for comparison. Inset shows the rms noise plotted as a function of time.
3.2 Oxygen sensor
In the beginning, we performed cyclic voltammetric measurements using KCl solution (0.1 mol/L) with equilibrium concentration of dissolved oxygen from air at room temperature. For the measurements, a voltage bias varying from 0 to -1.2 V was applied to the sensor using a function generator (33250A, Agilent, USA) at a very slow rate of 9.6 mV/s. The output current from the electrodes was measured using a current preamplifier (DL 1211) and stored in a computer via a data acquisition system. The calibration measurements were performed in an air filled plastic cylinder chamber (radius = 40 mm, and height = 15 mm). The cyclic IV characteristics are shown in Fig. 6. A current plateau can be observed around E = ~-1.0V, with respect to to Ag/AgCl electrode. The limit of the current plateau is given by Levich equation [12], which is controlled by the diffusion rate of the dissolved oxygen in solution at this potential. For best performance, electrochemical oxygen sensors usually operate at the potential where the plateau current occurs [13] – [15]. Thus, in our experiments, a steady dc bias of -1.0 V was applied to the Ag/AgCl reference electrode of the sensor. To calibrate our sensor, we compared its output current against a commercially available dissolved oxygen meter (DO6 Acorn series, Oaklon, USA). For this, the analyzing port of the oxygen meter was placed right next to our sensor inside the chamber, and covered with the same KCl solution. The dissolved oxygen in KCl solution was changed from 0.9 mg/L to 8.0 mg/L by flowing 5%, 15% and 25% O2 (in mixture with pure Ar) gas into the chamber in stages. The output current of the sensor was measured and correlated with the measurement results from the oxygen meter. The calibration curve based on the sensor and this oxygen meter is shown in Fig. 7. The regression analysis between the output current and the dissolved oxygen concentration was performed, and a least-square fit line was obtained with the following relationship: Output sensor current (μA) = 123.5 + 23.2 × dissolved oxygen conc. (mg/L).
Figure 6.
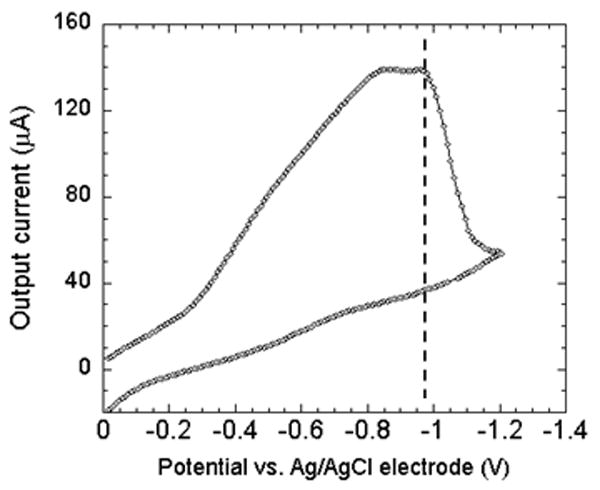
Cyclic voltammogram plot for the Pt and Ag/AgCl electrode. The sensor is made to operate at the largest current by biasing at ~ -1 V, which is marked by the dotted line.
Figure 7.
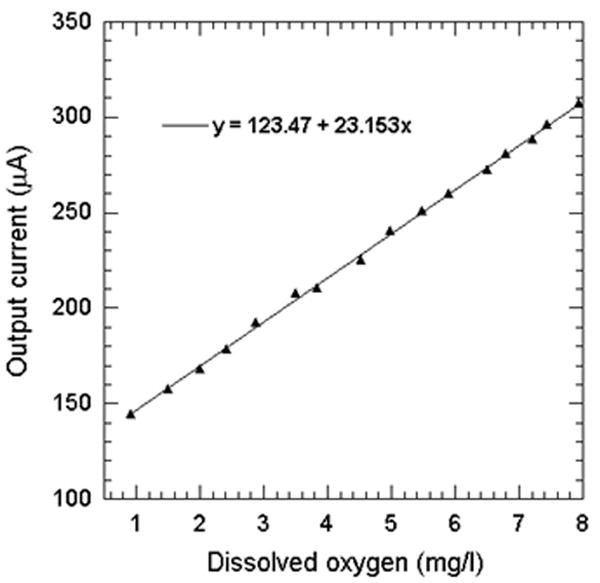
Correlation between the maximum electrode current and the oxygen concentration measured by a commercial oxygen sensor.
After the initial calibration experiments, the sensor was subject to pure Ar, 10% and 30% O2 and the responses are shown in Fig. 8(a). The output current was significantly reduced by ~30 μA, when 10% O2 gas (10 % O2 and 90 % Ar) was flown into the air-filled chamber. The response time to reach a steady current level is approximately 40s. The current began to recover right after the gas flow was stopped, as air started to flow in the chamber. The recovery time to return to the original level of current was almost four times higher than the decay response time, which however, can be reduced by flowing fresh air into the chamber at a high flow rate. As shown in Fig. 8(a), the sensor output shows repeatable current response in presence of 10% O2, and the current is reduced by ~30 μA for each cycle. In contrast to the 10% O2, exposure to 30% O2 makes the output current change in the reverse direction, and increase sharply by ~25 μA. This is because the oxygen current content in the sensor ambient is now increased compared to the baseline value of 20%. The response time for the current to reach a steady value in this case is also ~40 sec, similar to decay response time observed for 10% O2. However, the recovery time observed is even longer than the first case. The ratio of the recovery to response time is comparable to other Clark electrodes based sensors [16].
Figure 8.
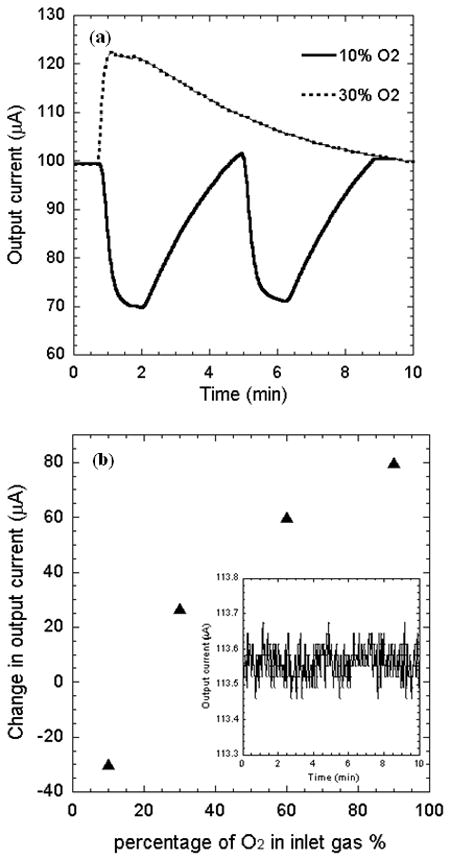
(a) Time dependent electrode current as the ambient air is replaced by oxygen-argon mixture with oxygen content of 10% and 30%. (b) Variation of maximum electrode current with oxygen concentration. Inset shows the rms noise plotted as a function of time.
To determine the sensor performance over a large range of oxygen concentration, it was further exposed to 60% and 90% O2. We observed that the change in output current is +60 μA for 60% O2 gas, and +75 μA for 90% O2. Figure 8(b) shows the change in output current as the sensor is exposed to different oxygen composition from the baseline air environment. We observe that the output current changes much faster with change in oxygen composition for lower oxygen concentration, but gradually tends to saturate for higher oxygen concentration. This is possibly because the oxygen generated current starts to get affected by the diffusion-limitation of dissolved oxygen at the Pt electrode [12].
From Fig. 8(b), we find the highest sensitivity is 2.75 μA per % O2 change (calculated by simple interpolation in the range of 10% - 30%), which corresponds to 0.118 mg/L in term of the dissolved oxygen in KCl solution from the calibration curve shown in Fig. 6. On the other hand the lowest sensitivity of the sensor is determined as 0.83 μA per % O2 change (calculated by interpolation in the range of 60% - 90%), and that of the sensor could be 0.035 mg/L. The RMS noise associated with the output signal as determined from its variance is 0.0017 μA. Thus, the best and worst noise limited resolutions for the sensor are 6.18 and 146.55 ppm O2 in gas phase, respectively.
Finally, to determine the applicability of the sensor for measuring dissolved oxygen content in unknown liquids, we varied the oxygen concentration of a test KCl solution separated from the sensor electrolyte by a 30 μm PDMS membrane. We compared the response of the sensor for 10% and 30% O2 exposure of the test KCl solution. The output current response of the sensor is shown in Fig. 9. We observe that the change in output current of the sensor for 10% O2 gas exposure is -26 μA, which is marginally less than the response of the sensor when directly exposed to the gas. However, the change in current due to 30% O2 gas exposure to the test liquid is only +12 μA, which is much less than direct gas exposure. In addition, the response time is also much larger, in the order of a few minutes. This reduction is obviously associated with the presence of the PDMS barrier, which slows down the diffusion of the carriers to the sensor from the test solution. The presence of the PDMS thin film is essential, however, since it separates the test liquid from the sensor, and only allows the diffusion of the dissolved gas (es). This is necessary for testing sensitive liquids, such as blood, where no contamination is permissible. We believe that making the PDMS film thinner, and preparing better contact between the test solution, PDMS film, and sensor electrolyte, will help to reduce the response time and enhance the sensitivity.
Figure 9.
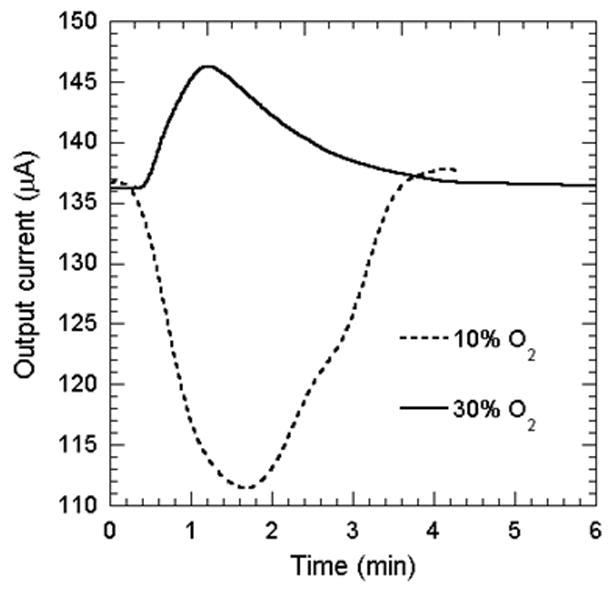
Sensor response for 10% and 30% oxygen exposure to the test KCl solution separated with a thin PDMS membrane from the actual sensor.
4. Conclusions
In conclusion, we have utilized biocompatible PDMS thin films to fabricate scalable pressure and oxygen sensors that may be integrated and implanted in heart and blood vessels. We have shown high sensitivity of the sensor for pressure changes up to ~0.68 mm Hg. The oxygen sensor also demonstrated a high sensitivity of 0.83 μA per % O2 change, which translates to a noise limited resolution of 6.18 ppm O2 in Ar mixture. Measurement of dissolved oxygen in a test liquid with an intervening PDMS film placed between the sensor and a test liquid was also successfully demonstrated. This study demonstrates encouraging performance of the sensors in both pressure and oxygen measurements, and underlines the feasibility of fabrication of an implantable miniaturized integrated pressure/oxygen sensor for a wide variety of biomedical applications.
Acknowledgments
Partial support for this work from the University of South Carolina Nanocenter is gratefully acknowledged.
Footnotes
This manuscript demonstrates the operation of novel pressure and oxygen sensors, based on bio-compatible polydimethysiloxane thin films, which can be easily integrated and miniaturized for implantation in heart and blood vessels.
Suggested Reviewers:
Hongchen Gu, Professor/Ph.D., 800, Dongchuan Road, Research Institute of Micro/Nano Science and Technology, Shanghai Jiao Tong University, Shanghai, 200240, China, E-mail: hcgu@sjtu.edu.cn, Tel: +86-21-62932974
Sheila Grant, Ph.D., Associate Professor, University of Missouri, Phone: 573-884-9666, E-mail: GrantSA@missouri.edu
Yunzhi Yang, Ph.D., Assistant Professor, School of Biomedical Engineering and Imaging College of Medicine University of Tennessee, Health Science Center, Memphis, TN yyang19@utmem.edu Tel: 901-448-1742, Fax: 901-448-1755
References
- 1.Eaton WP, Smith JH. Smart Mater Struct. 1997;6:530–539. [Google Scholar]
- 2.Bae BH, Flachsbart BR, Park KH, Shannon MA, Micromech J. Microeng. 2004;14:1597–1607. [Google Scholar]
- 3.Singo RJ, Ngo LL, Seng HS, Mok FNG. IEEE Computer Society, Berlin. 2002 [Google Scholar]
- 4.Obiet I, Gracia FJ. Sensor Actuator A. 1994;41:521–528. [Google Scholar]
- 5.Suzuki H, Hirakawa T, Sasaki S, Karube I. Analytica Chimica Acta. 2000;405:57–65. [Google Scholar]
- 6.Suzuki H, Hirakawa T, Watanabe I, Kikuchi Y. Analytica Chimica Acta. 2001;431:249–259. [Google Scholar]
- 7.Dong-Weon Lee, Young-Soo Choi. Microelectronic Engineering. 2008;85:1054–1058. [Google Scholar]
- 8.Meuwissen MHH, Veninga EP, Tijdink MWWJ, Meijerink MGH. Proceedings of the Institute of Mechanical Engineers, Part C: Mechanical Engineering Science. 2006;220:1633–1643. [Google Scholar]
- 9.Chuanmin Ruan, Liju Yang, Yanbin Li. Journal of Electroanalytical Chemistry. 2002;519:33–38. [Google Scholar]
- 10.Shigehito Iguchi, Kohji Mitsubayashib, Takayuki Uehara, Mitsuhiro Ogawa. Sensors and Actuators B. 2005;108:733–737. [Google Scholar]
- 11.Wu CC, Yasukawa T, Shiku H, Matsue T. Sensors and Actuators B. 2005;110:342–349. [Google Scholar]
- 12.Bard J, Faulkner LR. electrochemical methods. John Wily & Sons; New York: 1980. [Google Scholar]
- 13.Lam YZ, Atkinson JK. Med Biol Eng Comput. 2003;41:456. doi: 10.1007/BF02348089. [DOI] [PubMed] [Google Scholar]
- 14.Meruva RK, Meyerhoff ME. Analytica Chin&a Acta. 1997;341:187. [Google Scholar]
- 15.Westbroek P, Temmerman E, Govaert F, Kiekens P, De Strycker J. Electroanalysis. 1999;11:517. [Google Scholar]
- 16.Cui Y, Barford John P, Renneberg R. Sensors and Actuators B. 2007;123:696. [Google Scholar]


