

Abstract
We present a multipurpose nanomechanical force probe that combines a sideways-mounted elastic cantilever and an optical-lever detection module with automated micropipette manipulation. It allows us to apply and measure compression, stretching, adhesion, and dissociation forces in the horizontal direction while providing a “side view” of ongoing experiments. The integrated micropipette setup facilitates the easy manipulation and mechanical interrogation of individual cells, functionalized particles, and synthetic membrane capsules. Pipette-held test objects are translated perpendicularly to and from the stationary cantilever, eliminating the need to attach them to a carrier surface and substantially reducing unwanted hydrodynamic coupling effects. Moreover, the test objects can be brought into contact with the cantilever anywhere along its length, which considerably enlarges the range of forces that can be applied with a single cantilever. Advantages of this instrument are demonstrated in example measurements of single-cell compression, membrane-tether extrusion, oligonucleotide stretching, and extraction of individual lipids from surfactant-monolayer surfaces of microbubbles.
Introduction
A key element of the physical characterization of nanoscale objects is the examination of their mechanical properties, including their cohesive and adhesive strengths. Striking differences exist between the largely deterministic mechanics of the macroscopic world and the probabilistic nature of thermally susceptible, “weak” interactions that govern nanoscale function. A hallmark corollary of the young field of dynamic force spectroscopy (DFS) is that even minuscule forces have a dramatic impact on weak interactions, and that understanding the force-dependent behavior of such interactions requires mechanical tests over a large dynamic range of force application (1,2).
Such tests recently have been made possible by the development of sensitive force probes with distinct ranges of transducer spring constants, including optical tweezers (3–5), magnetic pullers (6), the biomembrane force probe (BFP) (7–10), and various cantilever-based instruments (11–14). Elastic microbeams were used as early as 1980 to inspect piconewton “cellular forces” (11). The same concept became the core of the now widely used atomic force microscope (AFM), which originally was designed as a scanning probe to map physical and/or chemical properties of test surfaces into high-resolution images (15). In addition to its predominant role as an imaging device, a properly calibrated AFM can also be used as a force-spectroscopy instrument. In this article we refer to the AFM exclusively in the latter capacity.
Changes in cantilever deflection can be measured with exquisite resolution by tracking a detection-laser beam that is reflected off the back side of the cantilever (“optical-lever method” (16); Fig. 1 A). However, accurate force measurements with relevance to nanoscale function require special care and remain a veritable challenge, in particular when one is dealing with objects in solution such as live cells or biomolecules. For example, the range of forces that are accessible with a single cantilever is limited. In live-cell studies, the cells are often immobilized on the substrate or cantilever surface. It is largely unclear how the biochemical interactions that “glue” a cell to the carrier surface affect the forces measured at its opposite side. Irregular cell geometry and an elevated, unknown cortical tension cause additional uncertainties in the results of such studies. Further, relative movement of an extended substrate to or from the cantilever produces considerable bias forces as a result of hydrodynamic coupling.
Figure 1.

Overview of the horizontal force probe. (A) The core components of a conventional scanning probe are turned by 90° and assembled on the stage of an inverted microscope. A variety of pipette-held test objects can be translated to or from the stationary cantilever by a closed-loop piezo actuator (indicated by double arrows). (B) Collage of videomicrographs of example experiments showing the cantilever in a “side view.” The test objects are (top to bottom): a human neutrophil, a human red blood cell, and a functionalized microsphere. (Bar = 10 μm.) (C) Integration of the force module with a micropipette system. Glass coverslips form the top and bottom of the chamber. The front side remains open to allow for pipette access. Capillary forces retain the buffer solution inside the thin chamber. The pipette is connected via flexible tubing to a pressure-application and measurement system consisting of two vertically movable water reservoirs and a differential pressure transducer. (D) An AFM chip is clamped against the rear wall of the experiment chamber. The detection laser beam is focused onto the reflective back side of the cantilever.
Addressing most of these limitations, our force probe is designed for mechanical tests on objects submerged in an aqueous solution with a primary focus on biological samples. It entails two main innovations (Fig. 1). First, the core components of the force module—a cantilever, a focusable diode laser, and a photodetector—are mounted in a “horizontal” configuration on the motorized stage of an optical research microscope (Fig. 1 A). This arrangement provides a “side view” of ongoing nanomechanical experiments (Fig. 1 B) while retaining the high spatial and temporal resolution of the optical-lever-based cantilever-deflection measurement. Second, this configuration has allowed us to combine the force module with a micropipette-manipulation system (Fig. 1 C) (17). The principal idea of this setup follows the “pre-AFM” footsteps of what appears to have been the first cantilever-based piconewton force probe (11), upgrading the early design with an optical-lever module, microfabricated cantilevers, and a high degree of automation. We note that a combination of scanning probe and micropipetting was previously also used to image surfaces of pipette-held cells (18) and membrane patches (19); however, no force measurements were reported by those studies.
The advantages of our new instrument have recently enabled us to carry out a thorough examination of the mechanics of pipette-aspirated red blood cells (10,20). Growing interest (21) in the design of the horizontal force probe has prompted us to present an in-depth description of the instrument and to showcase its capabilities with a diverse set of example experiments.
Design Overview of the Horizontal Force Probe
Our instrument currently uses commercially available AFM cantilevers. The cantilever chips have a standard width of ∼1.6 mm and can easily be mounted sideways on research microscopes with long-working-distance optics. However, the commonly used chip holders are too wide to be accommodated in this orientation. We have instead incorporated a simple chip holder directly into the design of our experiment chamber (Fig. 1, C and D). The chip is mounted on its side so that cantilever tips (if present) point toward the pipette-held test object. A small opening in the rear chamber wall (covered during experiments with a thin glass plate cut from a coverslip) allows for the unhindered propagation of the detection laser to and from the back side of the cantilever. Two coverslips are sandwiched to the top and bottom of the chamber while the front of the chamber remains open to provide for micropipette access (Fig. 1 C). The pipette is attached to a three-axis motorized stage for coarse positioning. A closed-loop piezo actuator is used for computer-controlled translation of the micropipette to and from the cantilever with subnanometer resolution.
The combination of the force module with micropipette manipulation allows us to select and test a broad variety of individual particles or cells (cf. Fig. 1 B), dramatically enhancing the versatility of the instrument. Details of our automated pipette-aspiration system are given elsewhere (17). Micropipette pressures are generated by motorized vertical translation of a water reservoir that is connected to the pipette (Fig. 1 C). The pressure difference between this main reservoir and a precalibrated reference reservoir reports the pipette-suction pressure. (For more details see the Methods section.)
Materials and Methods for Example Experiments
Instrument
Commercially available cantilevers were mounted sideways in a custom-made experiment chamber that had been machined from polycarbonate (Fig. 1, C and D). The detection laser was a fiber-coupled 670-nm, 1-mW diode laser (Edmund Optics, Barrington, NJ). The photodetector was a quadrant photo diode (QPD, S5981, Hamamatsu, Bridgewater, NJ) that had been mounted on a sum-and-difference circuit board (Pacific Silicon Sensor, Westlake Village, CA). We also tested the duolateral position sensor DL100-7PCBA3 (Pacific Silicon Sensor), which offered superior linearity over the full chip area but, unfortunately, produced only ∼1/6 of the voltage change generated by the QPD for the same lateral laser-spot displacement. The diode laser and the QPD were attached to three-axis translation stages (Newport, Irvine, CA) that were mounted to a motorized flat-top stage (Prior Scientific, Rockland, CA) on an inverted research microscope (Zeiss Axiovert 200, Carl Zeiss Microimaging, Thornwood, NY).
Our automated micropipette-manipulation system was described in detail in a previous tutorial (17). In short, micropipettes were fabricated by pulling borosilicate glass capillaries to the desired tip diameter and shape on a pipette puller (Sutter Instruments, Novato, CA). Sharp-tipped needles were pulled for optical-lever-sensitivity measurements (Fig. 2), whereas pipettes used to hold test objects in force experiments were further postprocessed on a microforge (Narishige, East Meadow, NY) to obtain an evenly broken tip. The holding pipettes were filled with the appropriate buffer, connected to a “main” water reservoir by flexible tubing, and inserted into the microscope chamber. A motorized vertical translator (Velmex, Bloomfield, NY) was used to lower the main reservoir relative to the height of the pipette tip to generate pipette suction pressure. Alternatively, the air above the water in the main reservoir could be evacuated through a mouthpiece or syringe for quick application of pressure. A separate reference reservoir remained fixed at the height of the micropipette tip, so that the pressure difference between this reference reservoir and the main reservoir reported the pipette suction pressure (measured with a differential pressure transducer, Validyne, Northridge, CA). For coarse positioning, the holding pipette was attached to a three-axis motorized translation stage. Additionally, a closed-loop piezo actuator (PI, Irvine, CA) allowed for computer-controlled subnanometer translation of the micropipette to and from the cantilever.
Figure 2.

Dependence of the optical-lever sensitivity on the cantilever-contact position. The cantilever was deflected at eight different positions, as illustrated by two videomicrographs (bar = 10 μm). The sensitivity at each position was given by the ratio of the resulting (linear) change in photodetector voltage and the known velocity of cantilever displacement. The normalized distances (λ) are defined in the text. Our model (Eq. 2). predicts two different functional forms for the sensitivity. If λlas ≤ λ, the only adjustable parameter is a common scaling factor whose value we obtain by matching the model to the sensitivities measured at the three largest values of λ (light solid line). If λlas > λ, the value of λlas itself becomes an adjustable parameter in the model function. The best match to the data (up to the respective value of λlas where each lower line merges with the light-gray solid line) is obtained for λlas = 0.26 (dark solid line). For the cantilever used, this corresponded to a distance of 27 μm between the laser spot and the cantilever tip, in good agreement with our laser alignment during the experiment.
The horizontal force microscope was placed on an active antivibration platform (TS-140, Herzan, Laguna Hills, CA) and housed inside an acoustic enclosure (AEK 5004, Herzan).
Live-cell experiments using human blood cells
Red blood cells were collected from a small drop of whole blood obtained by finger prick and diluted in ∼0.5 mL of ∼150 mOsm phosphate-buffered saline (PBS) buffer. About 2 μL of this cell suspension was added to the chamber test volume for cell-compression experiments.
Neutrophils were isolated from 5 mL of whole blood obtained by venipuncture. Blood was deposited on a density gradient (Matrix PMN Isolation Medium, Fisher Scientific, Pittsburgh, PA) and centrifuged at 700 × g for 30 min. The neutrophil layer was removed and diluted in 9 mL of calcium- and magnesium-free Hanks' buffer containing 0.1% (w/v) human serum albumin. About 5 μL of this cell suspension was deposited into the buffer-filled experiment chamber for neutrophil-compression and tether-extrusion experiments.
The cantilevers used in all cell-compression and tether-extrusion experiments were rectangular biolever probes (OBL-35, Veeco, Plainview, NY) with nominal spring constants of 2–16 pN/nm. Each cantilever was plasma cleaned (Harrick Plasma, Ithaca, NY) for ∼1 min before experiments. Coverslips used to form the top and bottom chamber walls were washed in ethanol, rinsed with deionized water, and dried. To passivate both the cantilever and the coverslips against nonspecific adhesion with the test cells, the experiment chamber was filled with PBS containing 0.5–1% (w/v) bovine serum albumin. The buffer osmolarity was ∼150 mOsm for red-cell experiments, whereas most neutrophil tests were conducted at physiological osmotic pressure (with the exception of control tether-extrusion experiments that also used ∼150 mOsm buffer). Compression measurements on both cell types were performed at a pipette-translation speed of 1 μm/s. Tether-extrusion experiments were carried out using three retraction speeds: 1, 5, and 25 μm/s.
DNA-stretching experiments
Custom-ordered oligonucleotides (ssDNA consisting of 100 thymidine monophosphate (TMP) nucleotides and functionalized at both ends with biotin (Sigma, St. Louis, MO)) were suspended with streptavidin-coated silica beads (Bangs Laboratories/Fisher) in Tris buffer with EDTA (TE buffer, United States Biochemical (USB), Cleveland, OH) for 30 min and briefly vortexed every 10 min. Although both ends of the ssDNA molecules could potentially bind to streptavidin on the beads, a subpopulation of immobilized DNA is expected to retain a free end that could interact with the streptavidin-coated cantilever.
Triangular AFM cantilevers (Novascan, Ames, IA) were used in the DNA-stretching experiments as well as in the lipid-extraction experiments (see below). The cantilevers were prefunctionalized with streptavidin and had a nominal spring constant of 10 pN/nm. Each cantilever was calibrated using the thermal method, which gave actual spring constants from 11.9 to 17 pN/nm. Force measurements were performed in TE buffer (USB) with 150 mM NaCl adjusted to pH 8.0. The retraction speed of the pipette-held beads away from the cantilever was 1 μm/s.
Lipid-extraction from surfactant microbubbles
Microbubbles filled with decafluorobutane were made from aqueous suspensions of two lipid mixtures, each containing 90 mol % of a saturated diacyl phosphocholine (PC), 5 mol % of a diacyl phosphoethanolamine (PE) coupled with polyethylene glycol (molecular weight 2000, PEG2000), and 5 mol % of the same PE lipid coupled with PEG2000-biotin (22). All lipids were purchased from Avanti Polar Lipids (Alabaster, AL). The PC lipids were 1,2-diacyl-sn-glycero-3-PC with fatty acid chain lengths of 16 (DPPC, phase transition temperature Tm = 41°C) and 20 carbons (DAPC, Tm = 66°C). PEG-coupled lipids were 1,2-distearoyl-sn-glycero-3-PE-N-[methoxy-PEG2000] (DSPE-PEG2000) and 1,2-distearoyl-sn-glycero-3-PE-N-[biotinyl-PEG2000] (DSPE-PEG2000-biotin). Each lipid mixture was prepared from 25 mg/mL stock lipids dissolved in chloroform. Chloroform was evaporated by vortexing under nitrogen, and the lipids were dried in a vacuum for 30 min. After adding purified water to the dry lipid mixture (final lipid concentration 1.5 mg/mL), the suspension was sonicated at a temperature well above the PC lipid's phase-transition temperature (for at least 20 min) until it appeared transparent and homogeneous. Lipid solutions were then placed in 3-mL vials with a decafluorobutane headspace for storage until use.
Microbubble activation was performed by mechanical agitation of the lipid solution vial with a Vialmix shaker (Bristol-Myers Squibb Medical Imaging Inc., North Billerica, MA) (23). Each bubble suspension was washed several times (3 min per wash; centrifugation at 350 × g) with PBS to remove free lipid from the solution and used in adhesion experiments within 10 h after the wash. The purified water used in the experiments had a resistivity ≥ 17.9 MΩ. The experiments were performed at room temperature where the lipid-monolayer surfaces of the bubbles were in the gel phase.
The force measurements on bubbles used the same streptavidin-coated cantilevers (Novascan) as the above-described DNA-stretching experiments. Pipette-held microbubbles were brought into feedback-controlled contact with the cantilever (tip or flat), then retracted at different speeds that resulted in nominal force-loading rates (retraction speed × cantilever spring constant) of ∼2,000, 10,000, and 50,000 pN/s, respectively.
Instrument Characterization
Position-dependent optical-lever sensitivity
An advantage of the horizontal configuration is that chosen test objects can be brought into repeated feedback-controlled contact with the cantilever at any position along its length, which allows us to use a large range of spring constants with a single cantilever. The position-dependent spring constant of a cantilever with uniform cross section is
| (1) |
where ℓ measures the distance from the cantilever tip, L is the full length of the cantilever, and ktip ≡ k(0) denotes the spring constant at the tip that we calibrate using established techniques (24,25). More subtly, the “optical-lever sensitivity,” i.e., the conversion cy between the cantilever displacement and the photodetector voltage, must also be recalibrated at every contact position. An analytical approximation predicts that
| (2) |
(the derivation is given in the Appendix). Here, n2 is the refractive index of the chamber medium, and λ ≡ ℓ/L and λlas ≡ ℓlas/L are the respective normalized distances of the cantilever-contact position and of the laser-spot position from the cantilever tip. Importantly, this conversion is different in air and water. We experimentally verified Eq. 2 by pushing a sharp-tipped glass needle into the cantilever at several different positions. Fig. 2 demonstrates the excellent agreement between Eq. 2 and the measured data.
Equation 2 also predicts the effect of laser-spot displacements on the calibration of conventional AFMs. The standard AFM uses only the cantilever tip to apply and measure forces; thus, λ = 0 in this case, and cy is given as a function of λlas by the (simplified) first version of Eq. 2.
Dramatically reduced hydrodynamic coupling
The characterization of any force-spectroscopy instrument should establish its usable dynamic range, in particular the role of hydrodynamic-coupling effects at higher translation speeds. Stokes drag on a “free” cantilever moving relative to the surrounding (ideally infinite) fluid is common to both the conventional AFM and our horizontal force probe. However, there is a large difference between the hydrodynamic coupling resulting from relative cantilever movement in the vicinity of an extended, parallel substrate and from a thin cylinder moving in an axial direction normal to the cantilever (i.e., the pipette in our horizontal force probe, Fig. 3 B).
Figure 3.
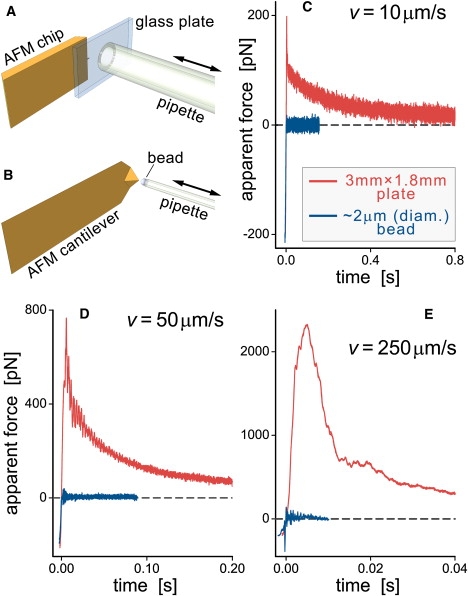
(A and B) Sketches of the experiments used to examine hydrodynamic coupling. Double arrows denote the direction of pipette translation. Note that the pipette diameters in A and B differ by a factor of ∼250. (C–E) Comparison of the cantilever-force bias caused by hydrodynamic coupling with a moving plate and a pipette-held bead at three different translation speeds (v). At least two individual measurements were plotted on top of each other for each of the curves, demonstrating the repeatability of this experiment. (The legend in C also applies to D and E.)
In Fig. 3, C–E, we compare typical hydrodynamic coupling forces generated by our horizontal force probe and by an experimental configuration that mimics a conventional AFM. In the latter case we attached a thin glass plate (with lateral dimensions much larger than those of the cantilever) to the end of a glass capillary (Fig. 3 A). We used our automated pipette-translation system to slowly bring the plate into feedback-controlled contact with the cantilever tip (to a maximum pushing force of about −200 pN) and then retract it at various speeds v (Fig. 3, C–E). Although no adhesion occurred between the cantilever and the plate, the maximum apparent forces at all pulling speeds were one to two orders of magnitude larger than those produced by a retracting pipette-held bead (Fig. 3 B). Even when the plate was translated at v = 10 μm/s, apparent forces as high as ∼150–200 pN were reported by the cantilever deflection (yet if there had been a molecular linkage between the cantilever and the plate, at the same speed and separation distance it would experience no force at all). Only at large separation distances did the decaying force gradually approach the plateau given by Stokes drag on a “free” cantilever, consistently yielding a damping coefficient of ∼1 pN/(μm/s) for the cantilever used. The striking reduction in hydrodynamic bias forces is another advantage of our horizontal force probe.
Example Experiments
We have used the horizontal force probe in a variety of experiments on single cells and molecules as well as on synthetic microparticles and surfactant microbubbles. Here, we showcase five examples: compression of pipette-aspirated human red blood cells and neutrophils, tether extrusion from neutrophils, stretching tests of short ssDNA oligonucleotides, and lipid extraction from surfactant monolayers.
Cell compression
The mechanical interrogation of individual live cells is increasingly recognized as a highly sensitive technique to distinguish cells and to monitor cellular development in biology and medicine (26,27). Compared with existing methods, our horizontal force probe offers a number of advantages in addition to its versatility. For example, the use of micropipettes allows us to hold each cell in a gentle, nonintrusive, and chemically inert manner at the pipette tip with small, known suction rather than having to immobilize it biochemically on the cantilever surface or substrate. Moreover, the rotational symmetry of pipette-aspirated cells, along with the planar geometry of the (passivated) cantilever surface against which the cells are pushed in compression experiments, make our results considerably more amenable to quantitative interpretation than measurements using cantilever tips on irregularly shaped cells.
In particular, the force-indentation behavior of red blood cells can precisely be predicted in the axisymmetric configuration (20). The recent successful experimental verification of these predictions has provided a first, sound validation of the innovative potential of the horizontal force probe (10) and is briefly reviewed in our first example. Fig. 4 illustrates the agreement of red-cell-indentation experiments with our numerical analysis (20). Remarkably, these measurements have allowed us to accurately calibrate the spring constants of AFM cantilevers based on the well-established mechanical properties of aspirated red cells (10). The calibration gave a tip spring constant of 5.0 ± 0.1(SD) pN/nm for the cantilever shown in Fig. 4, whereas other, more common calibration methods yielded spring constants of 4.6 pN/nm (Sader method (25)) and 5.3 pN/nm (thermal method (24)) for the same cantilever. These values confirm that there is reasonable agreement among the different calibration techniques, and they indicate that the (somewhat less practical) red-cell-based calibration using the horizontal force probe may well be the most accurate of the three methods.
Figure 4.
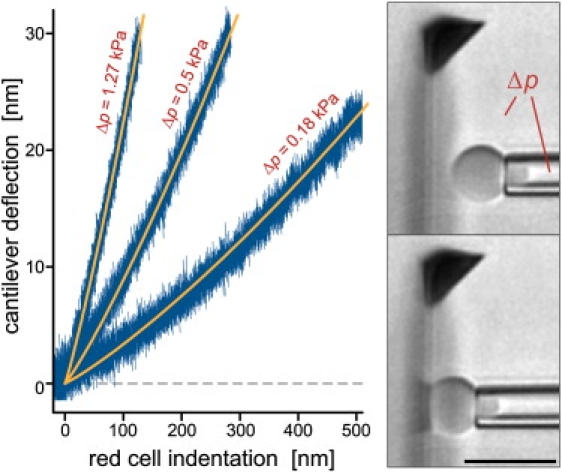
A red blood cell was aspirated at three different pipette-suction pressures Δp and pushed against the cantilever, as illustrated in the included video snapshots (bar = 10 μm). Each noisy data curve consists of at least three superimposed individual graphs, illustrating the excellent repeatability of this measurement. Overlaid are graphs of the theoretical predictions of our numerical analysis (20) that were matched to the data by fine-tuning the only adjustable parameter, i.e., the cantilever spring constant (10).
A different behavior was observed in compression experiments of human neutrophils (Fig. 5, A and B; see also Supplementary Movie 1). For these cells, the initial force-deformation curves remained roughly linear over a moderate range of cell indentation. Comparing the slope of the linear segments (kN; most frequent value ∼0.32 pN/nm, Fig. 5 B) with raw deformation data reported by other studies allows us to assess how well our force probe reproduces established results. We apply a Derjaguin-type approximation (28) to account for different indenter-tip geometries, i.e., the spherical probe tips used previously (29) and the flat cantilever surface used here. Assuming free slip at the interface between an indenter bead and the cell, the external axial force f is balanced by the integral of the axial stress σz over the region of contact (see Fig. 5 C for notation). Switching to the axial indentation Δz as independent variable, the force balance reads for small indentations (i.e., for |Δz − Δzmax| << Rb + Rcell),
| (3) |
where Δzmax is the change in axial cell dimension measured along the axis of rotation. Ignoring variations in cell size, the factor (1 + Rcell/Rb) is the main difference between the force-deflection curves measured with a spherical indenter of radius Rb and the curves obtained with a flat cantilever (Rb → ∞). Applying this conversion factor (using a nominal cell radius Rcell = 4.25 μm) to the recently reported slope of 0.054 pN/nm for neutrophil indentation with a bead of ∼0.9 μm radius (29) gives a kN-value of 0.31 pN/nm. This value is in excellent agreement with the slope measured with our horizontal force probe, despite a 10-fold difference in the imposed deformation rates (the cell-translation speeds were 0.1–0.5 μm/s (29), whereas we used 1 μm/s). Intriguingly, kN appears to be conserved even between pushing and pulling measurements, the latter giving kN ≈ 0.2–0.3 pN/nm over an enormous range (0.4–150 μm/s) of cell-retraction speeds (9,30). This weak rate dependence signifies an (at least transiently) elastic-like behavior of neutrophils at the considered time scales.
Figure 5.
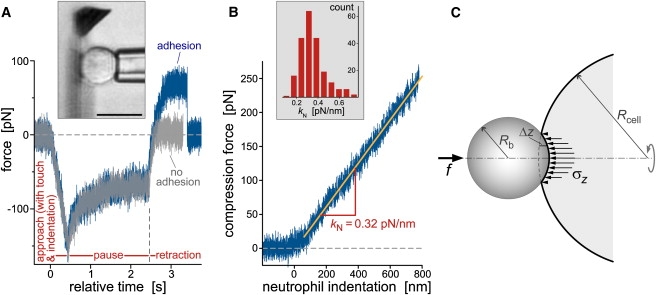
(A) Test cycles of neutrophil-compression experiments (illustrated by the videomicrograph in the inset; bar = 10 μm) were automated via remote pipette translation in three stages: approach, pause, and retraction. Contact between the pipette-held cell and the cantilever was detected in real time, and the maximum cell-indentation force was controlled by feedback. The plot includes two force-time curves that were overlaid on top of each other, demonstrating the repeatability of cell indentation (during approach) and relaxation (during pause). During cell retraction, the force usually remained flat after reaching zero, signifying the absence of adhesion (light curve). However, we also observed nonspecific adhesion between the cell and the cantilever (dark curve), occasionally leading to the extrusion of membrane tethers (Fig. 7). (B) The cell-compression segments of the force-time traces were converted to force-indentation graphs (defining the compression force as positive). The exposed, roughly linear force-indentation behavior was analyzed in terms of a “neutrophil spring constant,” kN. The included histogram revealed a most frequently observed kN-value of ∼0.32 pN/nm at a neutrophil-translation speed of 1 μm/s. (C) Sketch defining the notation used for the Derjaguin approximation that allows us to compare indentation experiments conducted with differently shaped probe tips.
At a first glance, a seemingly plausible origin of this elastic-like behavior is the neutrophil's static resistance to expansion of its apparent surface area, i.e., its cortical tension (29). We examine this notion by considering the leukocyte as a liquid droplet with a persistent cortical tension σ (31) (keeping in mind that although the assumption of a constant cortical tension has been refuted by careful experimentation (32–34), it remains a rough approximation that captures key mechanical properties of neutrophils). One of the disadvantages of this simple model is that it precludes the existence of a stable equilibrium solution for pipette-held cells whose projection lengths in the pipette exceed the pipette radius. Therefore, we will instead consider the compression of a model cell between two plates. This scenario should indeed be a reasonable description of experiments such as shown in Fig. 5 if thick-walled pipettes with small inner diameters are used to hold and translate the cell.
In the absence of adhesive interactions, the equilibrium shape of such a model cell is governed by the force balance at the contact area, , and by Laplace's law,
| (4) |
(Rc is the radius of the contact disk between the cell and the plate, f denotes the axial force exerted on the cell, Δp is the pressure drop across the cell surface, and H is the mean curvature of the free part of the cell contour.) Importantly, the appropriate boundary condition requires that the cell contour emerge parallel to the plate at the rim of the contact area (20). The cell volume is assumed to remain constant throughout the deformation. The equilibrium cell shape is obtained by immersing the numerical solution of the differential equation Eq. 4 in an iterative “point-and-shoot” procedure that adjusts the initial guess of Δp until the volume constraint is satisfied.
This “exact” numerical solution allows for arbitrary axisymmetric cell shapes. To simplify the calculations, one also may resort to approximate solutions that constrain the free cell contour to suitable trivial shapes. One choice is a central spherical section (29,35), although it is at odds with the appropriate boundary condition. Another choice that fulfills the boundary condition is the outer part of a torus. In both cases, the equilibrium shape is easily obtained by minimizing the energy of cell deformation, E = σΔA + fΔD, while keeping the cell volume constant. (ΔA and ΔD are the changes in total cell-surface area and axial cell extension during the deformation, respectively.)
Our analysis of the liquid-droplet model using these three geometries is summarized in Fig. 6. Fig. 6 A compares the respective force-indentation behaviors predicted for a constant cortical tension of σ = 0.02 mN/m, typical for resting human neutrophils. Both the force-indentation curves as well as the included example contours (Fig. 6 C, obtained at an indentation ΔD = 2 μm of a cell with a relaxed initial diameter of D0 = 8.5 μm) evince an excellent agreement between the exact solution and the toroidal approximation (apart from a moderate difference of the contact radii). However, the solution that approximates the free cell contour as a spherical section (dotted line) deviates strongly from the exact solution. Particularly unreliable in this approximation is the calculated value of the contact radius Rc, as demonstrated in Fig. 6 C.
Figure 6.
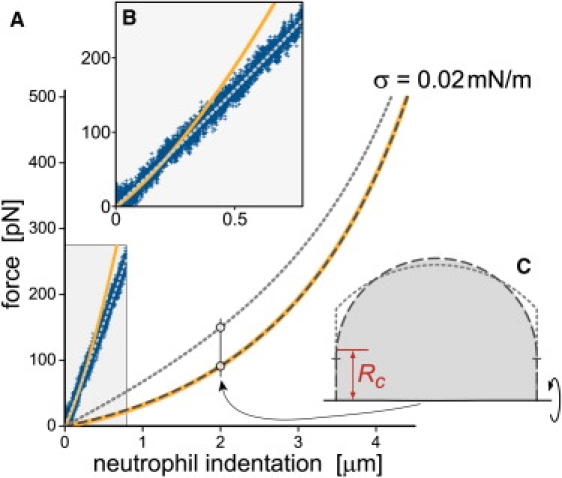
Analysis of neutrophil compression between two plates. The cell is described as a liquid droplet with constant cortical tension σ. (A) Static force-indentation curves predicted for σ = 0.02 mN/m by three different axisymmetric models: (i) the free cell contour is allowed to assume an arbitrary shape (“exact” solution of Eq. 4; thick, solid line), (ii) the contour has the shape of the outer part of a torus (dashed line), and (iii) the contour is a spherical section (dotted line). Also included are the experimental data of Fig. 5B (at forces < ∼270 pN, shaded rectangle). (B) The inset enlarges the experimental data of A. The overlaid model curves matching the data were obtained with the exact solution (σ = 0.3 mN/m, solid line) and the spherical approximation (σ = 0.1 mN/m, dotted line). (C) Example contours obtained at the same cell indentation and cell volume using the three models. The shaded area depicts the exact solution; its contact radius Rc is labeled. The contour obtained with the toroidal model (dashed line) is very close to the exact solution except for a noticeably different contact radius (labeled by a short horizontal dash). The dotted line is the contour found using the spherical approximation.
The comparison of the above solutions with our experimental neutrophil-indentation data reveals that the predictions for σ = 0.02 mN/m grossly underestimate the actual indentation force (shaded area of Fig. 6 A; enlarged in Fig. 6 B). To obtain a reasonable match to the data, much larger tensions had to be used in the calculations, i.e., σ = 0.3 mN/m in the exact solution (although its curvature makes it incompatible with the measurements; solid line in Fig. 6 B), and σ = 0.1 mN/m in the spherical approximation (dotted line). These large values rule out the possibility that the neutrophil behavior under compression at the given rate is governed solely by the cortical resting tension. The slow relaxation of compressed neutrophils during the “pause” phase of test cycles, such as that shown in Fig. 5 A, further supports this conclusion. It agrees well with the characteristic time of ∼1 s frequently reported for neutrophil relaxation (30,35–37). Deformations on faster time scales necessarily involve dynamic features beyond such equilibrium properties as the resting cortical tension.
In summary, to match the static liquid-drop model to our experimental data, one would have to invoke tension values that are ∼10 times higher than the known neutrophil resting tension. Therefore, neutrophil-indentation experiments at translation speeds of ∼1 μm/s or faster cannot be interpreted in terms of the cells' cortical resting tension. Furthermore, a perilous side effect of the spherical approximation is that it artificially dilutes discrepancies between experimental observations and the predictions of the liquid-drop model. This applies not only to calculations of the cortical tension but also to the predicted shape of the force-indentation curve (Fig. 6 B). A more suitable description of cell-compression experiments in terms of a trivial geometry approximates the free cell contour as part of a torus.
A definitive explanation of the observed neutrophil force-indentation behavior requires further investigation. Empirically, the linear force-deflection curves, along with the weak rate dependence of their slopes over a large range of rates, reveal a serial elastic component in the neutrophil response to imposed, fast deformations. The structural origin of this behavior remains to be discovered. Promising numerical models of leukocyte mechanics have recently been developed (38) and should be adaptable to our experimental configuration. For the purpose of this article, the example presented here demonstrates how our horizontal force probe paves the road toward new, high-resolution, quantitative cell-mechanical studies that will allow us to discriminate among various models of cell deformability currently in use.
Membrane-tether extrusion
It is well known that a sufficiently large tensile point force acting on a fluid membrane will extrude a bilayer nanotube or “tether” (39,40). Tether-pulling experiments have produced a wealth of new insights about the behavior of synthetic (6,41) and biological (37,39,42,43) membranes, and the formation of membrane tethers is also well understood theoretically (44,45). Recent BFP experiments that extruded neutrophil tethers at exceptionally high speeds prompted a revision of our understanding of neutrophil-tethering dynamics (37), underlining the importance of being able to apply a large range of tethering rates. The new horizontal force probe not only allows us to use similarly high tether-pulling speeds (unlike conventional AFMs; cf. the above section on hydrodynamic coupling), it also considerably enlarges the range of applicable tethering forces and greatly improves the time resolution in comparison with the BFP (37), thus facilitating, for example, the reliable detection and analysis of short-lived tethers and of multiple tethering events.
The typical signature of a fluid-membrane tether during constant-speed retraction of a cell from the force probe is a plateau in the recorded force-versus-time data (37). The tether length easily reaches several micrometers in these experiments, indicating that the plateau force is primarily a property of the tether itself and exhibits little dependence on the manner in which a tether is held at its end. Two of the example curves in Fig. 7 include several such plateaus, revealing the simultaneous formation of multiple neutrophil tethers during tests with the horizontal force probe. The stepwise reduction of the tethering force reflects the successive failure of the (nonspecific) adhesive attachments between tethers and the cantilever, allowing us to determine the force contribution needed to extrude each of the tethers.
Figure 7.
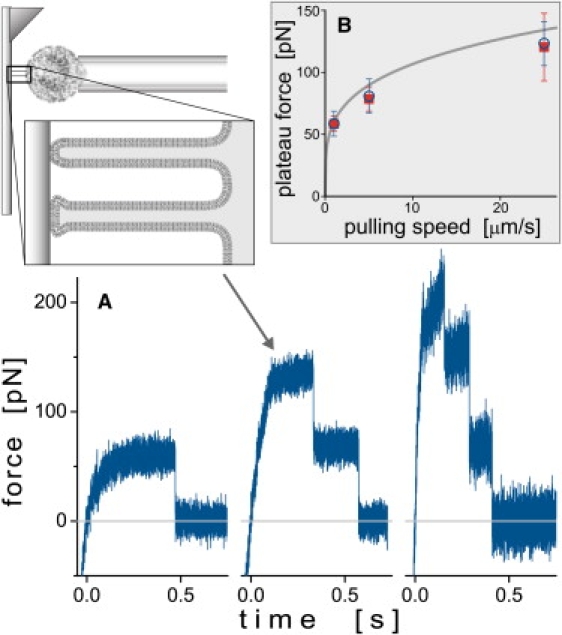
(A) Example force-time curves exhibiting the typical signatures of the extrusion of (initially) one, two, and three neutrophil tethers, respectively (left to right). The sketch at the upper left illustrates the two-tether case. Each force plateau observed during constant-speed retraction of the cell corresponds to an integer number of tethers. Precipitous drops in force denote the detachment of one or more tethers. In the depicted cases, the equally spaced force-plateau levels suggest that the tethers detached from the cantilever one by one. (B) Most frequently measured plateau forces of single tethers that were extruded at three different, constant speeds. A total of 269 tethers were pulled from 22 human neutrophils suspended in PBS buffer at physiological osmolarity (open circles). A second set of experiments performed in ∼150 mOsm buffer (five cells, 219 tethers, solid squares) gave similar results. (Error bars denote standard deviations.) Also shown is the dependence of the plateau forces on the pulling speed established by Heinrich et al. (37) (Eq. 5, solid line).
A previous analysis (9,37) established a simple power-law dependence of the plateau force f∞ of individual neutrophil tethers on the tether-pulling speed vpull, i.e.,
| (5) |
This empirical model successfully reproduced the measured plateau forces over a 1000-fold range of pulling speeds. It thus provides a suitable template for comparison with our preliminary results obtained with the horizontal force probe at three different speeds. Fig. 7 B illustrates the fair agreement between our data (open circles, obtained at physiological buffer osmolarity) and the predictions of Eq. 5 (based on BFP measurements conducted in ∼150 mOsm buffer). We also examined tethering forces at 150 mOsm (solid squares in Fig. 7 B) and found no significant deviation from the forces obtained at physiological osmolarity. Overall, the close agreement (Fig. 7 B) between the results obtained with two different piconewton force instruments is quite satisfactory, especially if one takes into account the large spread that inevitably characterizes highly sensitive force measurements on live cells as well as the possibility of a small effect resulting from the differently attached tethers in these two studies (nonspecific here versus P-selectin-coated probe tips (37).
Stretching of individual short DNA oligonucleotides
This single-molecule example measurement emphasizes our force probe's versatility by demonstrating that even small single biopolymers can be successfully tethered and stretched between the cantilever tip and a pipette-held carrier bead (see also Supplementary Movie 2). Fig. 8 combines several force-extension curves of individual ssDNA molecules consisting of only 100 TMP nucleotides. Here, the total contour length (∼65 nm) was much smaller than what is commonly used in AFM-based DNA-stretching experiments. The plot nonetheless reveals a clear force-extension signature of a polymer chain, allowing us to discriminate DNA tethers from the background of nonspecific cantilever-bead interactions and to compare the behavior of this short biopolymer with theoretical predictions. The figure includes a force-extension curve predicted by the “extensible freely jointed chain” model (46,47) with typical parameters for ssDNA. Good agreement between data and theory is found at forces up to ∼150 pN. The deviation at higher forces agrees with the literature as well (47); it has been attributed to electrostatic self-avoidance interactions of the DNA strand (48). This example verifies that our horizontal force probe can be used to characterize synthetic short oligonucleotides with precisely known base content and sequence and thus to systematically quantify base-specific contributions to the structure and energetics of DNA.
Figure 8.
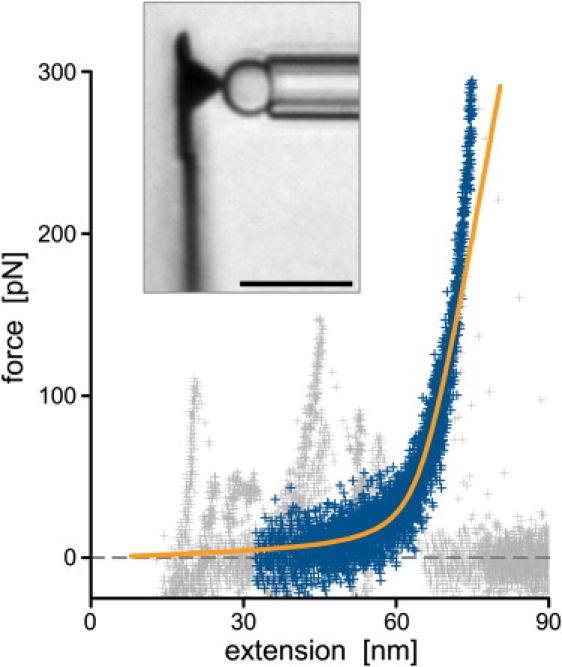
Short, synthetic ssDNA molecules with an exactly known nucleotide number (100 TMP) were tethered and stretched between the cantilever tip and pipette-held carrier beads (bar = 10 μm in the included videomicrograph). Eight measured force-extension curves were plotted on top of each other and aligned, revealing a clear signature of a polymeric stretching behavior (dark symbols). The remaining data points (light symbols) of several curves exhibit additional positive forces of short-range, nonspecific cantilever-bead interactions. The overlaid smooth line is a graph of the extensible freely jointed chain model, d(f) = D(cotht − 1/t)(1 + f/ES) with t = bf/(kBT), where d and f are the extension and force, respectively, D = 65 nm is the DNA's contour length, b = 1.5 nm its Kuhn segment length (46), and ES = 1170 pN the elastic stretch modulus giving the best match to the data (kBT denotes thermal energy).
Single-lipid extraction from gel-phase surfactant-monolayer surfaces of microbubbles
DFS is increasingly recognized as a proficient approach to characterize the dynamic strengths of weak molecular interactions. Force-dependent, noncovalent biomolecular interactions play a pivotal role in cell-cell adhesion, governing, for example, the reversible bonds between stress-bearing surface receptors and extracellular ligands. As a key prerequisite, the receptors themselves must be anchored within the cell membrane with sufficient strength. Such anchoring strength often is provided by linkages between the receptors' cytoplasmic domain and the actin cytoskeleton (9,30). Even if a cytoskeletal anchor is missing or fails under force, the cytoplasmic domain will still be trapped inside the cell because the hydrophobic interior of the plasma membrane opposes the domain's extraction. In fact, in such cases an external pulling force will typically cause the formation of a membrane tether (provided that the membrane tension is not too high; see the above section on tether extrusion).
What, then, will happen if a tensile force acts on a membrane constituent that does not have a cytoplasmic domain? In this case the dominant resistance to its extraction from the membrane will be the energetic cost of exposing its hydrophobic region to the aqueous environment. Our final example addresses this question by introducing a new type of DFS measurement made possible by the horizontal force probe. It uses air-filled, micrometer-sized bubbles whose surfaces are stabilized by phospholipid monolayers. Unlike conventional AFMs, our force probe is well suited to perform mechanical tests on buoyant bubbles, requiring only one minor modification, i.e., angling the pipette slightly upward to be able to select individual bubbles from the chamber ceiling. Then, feedback-controlled contact between the chosen bubble and the cantilever allows for the formation of attachments between biotin lipids and the streptavidin-coated cantilever (tip or flat, Fig. 9 A). Subsequently, the pipette-held bubble is retracted to break any attachments that may have formed, and the force at separation is recorded. If the biotin-streptavidin bond is stronger than the lipid-anchoring strength, the failure of an attachment signifies the extraction of lipids from the bubble surface (Fig. 9 D).
Figure 9.
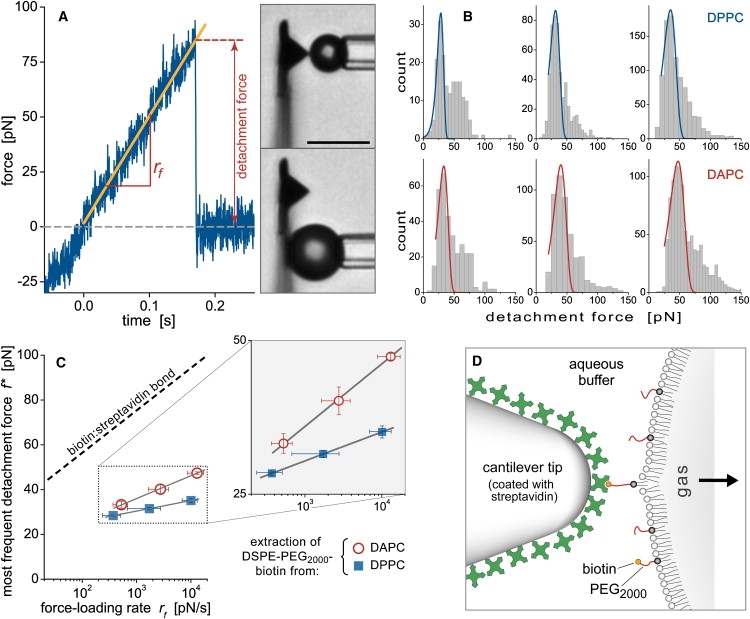
Analysis of the lipid-extraction measurements. (A) Positive forces recorded during force-ramp tests marked attachments between the microbubble and the cantilever. The detachment forces and slopes (rf) of ∼3400 such attachments were measured. The videomicrographs (bar = 10 μm) illustrate tests using different bubble sizes and cantilever-contact locations. (B) Histograms of detachment forces for two different bubble-surface compositions, DPPC (top) and DAPC (bottom). Each row of histograms was obtained using three different nominal force-loading rates. The histogram peaks at low forces were locally matched with the Evans distribution. (C) The peak forces (error bars denote the standard error in peak location) are plotted as a function of log(rf), where rf is the most frequently measured loading rate (horizontal error bars give the standard deviation of the individual rf-measurements). Included is the dynamic force spectrum of the biotin:streptavidin bond (8) (dashed line). The force spectra for lipid extraction are enlarged in the inset. (D) Illustration of the serial linkage comprising the bond between streptavidin and a biotin lipid as well as the latter's hydrophobic anchor in the lipid monolayer at the bubble surface. Our measurements suggest that the lipid anchor is significantly weaker than the biotin:streptavidin bond and will usually fail first when stressed.
The results of our force measurements indeed strongly suggest that most observed detachment events are caused by lipid extraction, in agreement with a previous study that tested giant vesicles with the BFP (49). In contrast to that study, microbubbles are easier to prepare and have much higher visibility under standard brightfield illumination. Furthermore, the lipid monolayers tested here are in the gel phase at room temperature, unlike the fluid bilayer membranes of the previously used vesicles.
A typical force-time curve recorded during constant-speed retraction of a bubble is shown in Fig. 9 A. The detachment forces obtained using two different bubble formulations (bubbles made from DPPC and DAPC, respectively) at three nominal loading rates rf0 (= retraction speed × cantilever spring constant) were collected into the histograms of Fig. 9 B. It is important to note that even though the ∼3400 forces constituting these histograms were obtained from a total of ∼27,000 bubble-cantilever contacts, this low attachment frequency (∼13%) unfortunately did not reflect a very high probability of single unbinding events in this case. Instead, we observed that detachment events often occurred “in bursts,” i.e., during test sequences in which almost every touch resulted in an attachment. On the other hand, these bursts were embedded within long stretches of tests that produced very few attachments, suggesting that the bond participants were not uniformly distributed over the bubble and/or cantilever surface. (Bubble surfaces indeed have been reported to form lipid microdomains (23).) This means that our results likely represent a mixture of (mostly) single and multiple detachment events. Accordingly, our analysis of the force histograms (Fig. 9 B) focuses on the lower force range and matches the observed peaks locally with the Evans distribution of unbinding forces, ρ(f) = CSsexp(−s), where CS is a scaling factor, and (9,50). Here, f∗ denotes the most frequent detachment force, and b is a fitting parameter characterizing the width of the histogram. Ideally, b equals the characteristic force scale fβ (see below); however, measurement uncertainties (mainly from the relatively low force resolution of the stiff AFM cantilevers) considerably broadened the force histograms and precluded the identification of b with fβ.
The dynamic force spectra of Fig. 9 C present the peak forces f∗ as a function of the logarithm of the actual loading rate rf (i.e., the most frequent slope of the force-versus-time ramp recorded during bubble retraction; see Fig. 9 A). The figure also includes the previously measured spectrum of the biotin:streptavidin bond (8). Two observations strongly support the conclusion that the majority of the observed detachment events reflect the extraction of lipids from the bubble surface. First, rupturing the bond between streptavidin and biotin would require about twice the force level of what caused the majority of detachments in our experiments. Second, the results obtained with two different lipid monolayers are clearly distinct.
The slope of each lipid-extraction spectrum (multiplied by loge) serves as a good estimate for the respective characteristic force scale fβ=kBT/xts (where kBT is the thermal energy, and xts denotes the distance between the energy minimum and the barrier impeding detachment in the interaction-energy landscape, measured along the direction of force application (8)). We obtained fβ-values of 2 pN and 4.4 pN for the extraction of DSPE-PEG2000-biotin from DPPC and DAPC monolayers, respectively, corresponding to xts-values of 2 nm (for DPPC) and 0.92 nm (for DAPC). It may seem surprising that extraction of the biotin lipid from the thicker monolayer (made from DAPC) is governed by a narrower energy landscape. However, lipid extraction is very likely accompanied by the formation of a small funnel-shaped monolayer protrusion (Fig. 9 D). The length of this protrusion is set by the membrane's elasticity, in particular its resistance to bending and in-plane shear. The thicker monolayer (made from DAPC) has a higher stiffness and will, therefore, form a shorter protrusion when locally strained by a given point force. Because the length of the protrusion directly contributes to the width of the energy landscape, this results in a narrower landscape in the case of the DAPC monolayer.
Summarizing this section, we note that despite a fairly large number of analyzed lipid-extraction events included in Fig. 9, the data presented here should be viewed as the starting point of a more thorough investigation. Nonetheless, the relatively low anchoring strength of the tested lipid (DSPE) in two different gel-phase membranes is an intriguing result on its own. Together with the similarly low lipid-anchoring strengths reported for fluid bilayers (49), these findings have wide-ranging implications for force measurements that rely on a purportedly high hydrophobic anchoring strength of test molecules embedded in supported lipid layers.
Conclusions
We have designed, built, and tested a new, exceptionally versatile force probe that allows us to apply and measure compressive and tensile forces in the horizontal direction. The integration of a micropipette setup enables us to perform nanomechanical tests on a variety of submerged objects, including live cells, single molecules, synthetic microparticles, and membrane capsules. This article presents the instrument's design and showcases its capabilities with an eclectic set of example experiments.
The videomicrographs included with the examples underline the advantage of a side view of ongoing experiments. Without sacrificing the high spatial and temporal resolution of the optical-lever method, this side view allows us, for instance, to inspect the overall morphology of test objects while they are being deformed or to use optical feedback to correct for drifts in longtime experiments. Other advantages of the horizontal force probe include the large range of spring constants available with a single cantilever, the ability to hold test objects in a gentle and chemically inert manner rather than fixing them biochemically on carrier surfaces, and a dramatic reduction in bias forces caused by hydrodynamic coupling.
Although the horizontal force probe combines the benefits of cantilever-based force sensing, optical-lever detection, and micropipette manipulation, it also retains some of those methods' limitations. For example, unless softer cantilevers are custom-manufactured, the force resolution of our probe is currently in the range of 10–15 pN. To examine biomechanical phenomena that involve lower forces, more sensitive instruments, such as optical tweezers, are the technology of choice. Further, the use of micropipettes imposes very strict requirements on vibration-isolation measures and generally will cause higher noise levels and more drift than can be achieved with a commercial AFM. On the other hand, a modular instrument such as ours affords the user much greater flexibility at a fraction of the cost of a high-end AFM capable of DFS measurements.
Although the primary purpose of the example measurements has been to demonstrate the instrument's potential to advance nano- to microscale biophysics, these first applications of the horizontal force probe inevitably have revealed a number of interesting insights. For example, we were able to “reverse” a central paradigm of biophysics in that we used biological objects—red blood cells—to accurately calibrate a man-made device, i.e., a micromachined elastic beam (10). Furthermore, our analysis of neutrophil-indentation experiments against a flat plate (the cantilever surface) has cast new light on previous results, suggesting key improvements to their interpretation. Finally, the first measurements of the dynamic anchoring strengths of a lipid in gel-phase monolayer membranes have suggested that the forces required to extract individual lipids from such monolayers may be lower than previously thought.
Acknowledgments
This work was supported in part by National Institutes of Health grant R01 A1072391. C.O. was partially supported by University of California Systemwide Biotechnology Research & Education Program GREAT Training Grant 2008-13. P.A.D. and H.X. were partially supported by the NIH Roadmap for medical research, grant 1R21EB005325. We are grateful to Mehmet Kaya for helping with the preparation of the microbubbles.
Appendix: Optical-lever sensitivity as a function of the cantilever-contact position
The large range of spring constants (and thus of forces) that can be used with a single cantilever is a substantial benefit of our horizontal force probe. On the other hand, the ability to bring test objects into contact with the cantilever anywhere along its length requires a careful reassessment of the instrument's calibration. For a cantilever with uniform cross section, the dependence of the spring constant k(ℓ) on the distance ℓ between the contact position and the cantilever tip is given by Eq. 1 (main text), expressing k(ℓ) in terms of ktip ≡ k(0), i.e., of the tip spring constant commonly used for AFM cantilevers.
A somewhat more subtle effect is the dependence of the “optical-lever sensitivity” cy on the cantilever-contact position ℓ. Here, we denote by cy = VPD/yp the conversion factor between the cantilever deflection yp (at the contact position xp = L – ℓ; see Fig. 10) and the photodetector (PD) voltage VPD. (This assumes that the PD voltage is zero when the cantilever is relaxed, and that VPD depends linearly on yp. L is the full cantilever length, and all x-values are measured relative to the cantilever base.) Fig. 2 (main text) shows example calibrations of cy at different values of ℓ/L. Clearly, the strong dependence of cy on ℓ must not be neglected in force measurements.
Figure 10.
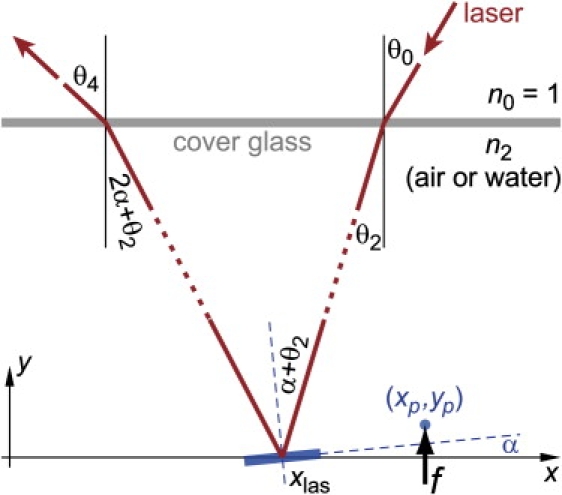
Geometry and notation for tracing the detection-laser beam. The cantilever (a part of which is shown as a short, tilted, thick bar) is deflected from its relaxed shape by a force f that acts at the position (xp,yp). The laser beam passes through the coverslip, is reflected off the cantilever at the position xlas, and passes again through the coverslip. The local cantilever slope at xlas equals tanα.
In this appendix, we derive the approximate dependence of the optical-lever sensitivity cy on ℓ. Tracing the path of the diode-laser beam, we neglect small beam translations that result from passage through the coverslip. We consider only angular displacements of the cantilever (i.e., changes of its local slope) and neglect cantilever translations. We also neglect the distance between the cantilever and the coverslip because it is small compared with the distance between the chamber and the photodetector. Finally, we assume that all angles used in the derivation are small. (For notation see Fig. 10.)
The optical-lever sensitivity can be expressed as
| (A1) |
where s is the displacement of the laser spot at the photodetector itself. We assume that the photodetector is a linear position detector (or that we operate within the linear range of a quadrant photo diode), which allows us to replace the ratio between the PD voltage and s by the constant CPD = VPD/s.
The relation between s and yp follows from simple geometry (Fig. 11). Denoting by dPD the (large) distance between the chamber and the photodetector, we may approximate
| (A2) |
for small angles θ4 and θ0. From Snell's law we have
| (A3) |
where we have used that also . Combining Eqs. A2 and A3, we get
| (A4) |
Figure 11.
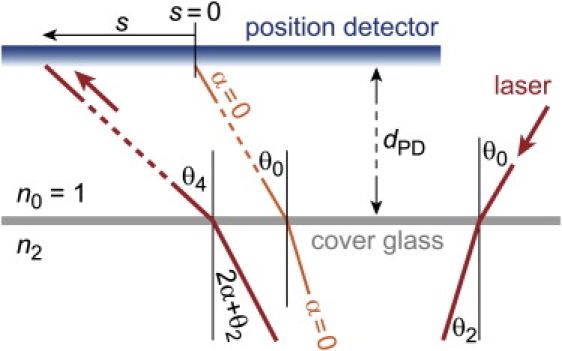
Laser-beam displacement at the photodetector. The displacement s of the laser spot at the position detector is measured with respect to the laser-spot position obtained at α = 0, i.e., when the cantilever is relaxed.
As expected, displacements of the laser spot at the photodetector are proportional to changes of the slope of the cantilever. Interestingly, in this approximation the optical-lever sensitivity is found to be independent of the particular direction θ0 of the diode laser.
The slope tanα ≈ α of a cantilever with uniform cross section is given by beam mechanics as (Fig. 10)
| (A5) |
In our above calculations of the optical-lever sensitivity, α denoted the cantilever slope at the particular position x = xlas = L – ℓlas where the laser is reflected off the cantilever's back side. (We denote by ℓlas the distance of this position from the cantilever tip.) We also replace xp = L − ℓ and switch to dimensionless distances λ ≡ ℓ/L and λlas≡ℓlas/L, both measured from the cantilever tip. Then, combining Eqs. A5, A4, and A1, we find,
| (A6) |
This gives Eq. 2 of the main text. Equation A6 is also the relation used to match the experimentally obtained optical-lever sensitivities in Fig. 2 (main text).
Supporting Material
References
- 1.Bell G.I. Models for the specific adhesion of cells to cells. Science. 1978;200:618–627. doi: 10.1126/science.347575. [DOI] [PubMed] [Google Scholar]
- 2.Evans E., Ritchie K. Dynamic strength of molecular adhesion bonds. Biophys. J. 1997;72:1541–1555. doi: 10.1016/S0006-3495(97)78802-7. [DOI] [PMC free article] [PubMed] [Google Scholar]
- 3.Sheetz M.P. Academic Press; San Diego: 1998. Laser Tweezers in Cell Biology. [Google Scholar]
- 4.Lang M.J., Block S.M. Resource Letter: LBOT-1: Laser-based optical tweezers. Am. J. Phys. 2003;71:201–215. doi: 10.1119/1.1532323. [DOI] [PMC free article] [PubMed] [Google Scholar]
- 5.Heinrich V., Wong W.P., Halvorsen K., Evans E. Imaging biomolecular interactions by fast three-dimensional tracking of laser-confined carrier particles. Langmuir. 2008;24:1194–1203. doi: 10.1021/la7027059. [DOI] [PubMed] [Google Scholar]
- 6.Heinrich V., Waugh R.E. A piconewton force transducer and its application to measurement of the bending stiffness of phospholipid membranes. Ann. Biomed. Eng. 1996;24:595–605. doi: 10.1007/BF02684228. [DOI] [PubMed] [Google Scholar]
- 7.Evans E., Ritchie K., Merkel R. Sensitive force technique to probe molecular adhesion and structural linkages at biological interfaces. Biophys. J. 1995;68:2580–2587. doi: 10.1016/S0006-3495(95)80441-8. [DOI] [PMC free article] [PubMed] [Google Scholar]
- 8.Merkel R., Nassoy P., Leung A., Ritchie K., Evans E. Energy landscapes of receptor-ligand bonds explored with dynamic force spectroscopy. Nature. 1999;397:50–53. doi: 10.1038/16219. [DOI] [PubMed] [Google Scholar]
- 9.Heinrich V., Leung A., Evans E. Nano-to-microscale mechanical switches and fuses mediate adhesive contacts between leukocytes and the endothelium. J. Chem. Inf. Model. 2005;45:1482–1490. doi: 10.1021/ci0501903. [DOI] [PubMed] [Google Scholar]
- 10.Heinrich V., Ounkomol C. Biophysics in reverse: Using blood cells to accurately calibrate force-microscopy cantilevers. Appl. Phys. Lett. 2008;92:153902. [Google Scholar]
- 11.Evans E.A., Kwok R., McCown T. Calibration of beam deflection produced by cellular forces in the 10−9-10−6 gram range. Cell Biophys. 1980;2:99–112. doi: 10.1007/BF02795837. [DOI] [PubMed] [Google Scholar]
- 12.Marszalek P.E., Lu H., Li H., Carrion-Vazquez M., Oberhauser A.F. Mechanical unfolding intermediates in titin modules. Nature. 1999;402:100–103. doi: 10.1038/47083. [DOI] [PubMed] [Google Scholar]
- 13.Tees D.F., Waugh R.E., Hammer D.A. A microcantilever device to assess the effect of force on the lifetime of selectin-carbohydrate bonds. Biophys. J. 2001;80:668–682. doi: 10.1016/S0006-3495(01)76047-X. [DOI] [PMC free article] [PubMed] [Google Scholar]
- 14.Rief M., Grubmuller H. Force spectroscopy of single biomolecules. ChemPhysChem. 2002;3:255–261. doi: 10.1002/1439-7641(20020315)3:3<255::AID-CPHC255>3.0.CO;2-M. [DOI] [PubMed] [Google Scholar]
- 15.Binnig G., Quate C.F., Gerber C. Atomic force microscope. Phys. Rev. Lett. 1986;56:930–933. doi: 10.1103/PhysRevLett.56.930. [DOI] [PubMed] [Google Scholar]
- 16.Meyer G., Amer N.M. Novel optical approach to atomic force microscopy. Appl. Phys. Lett. 1988;53:1045–1047. [Google Scholar]
- 17.Heinrich V., Rawicz W. Automated, high-resolution micropipet aspiration reveals new insight into the physical properties of fluid membranes. Langmuir. 2005;21:1962–1971. doi: 10.1021/la047801q. [DOI] [PubMed] [Google Scholar]
- 18.Horber J.K., Haberle W., Ohnesorge F., Binnig G., Liebich H.G. Investigation of living cells in the nanometer regime with the scanning force microscope. Scanning Microsc. 1992;6:919–929. (discussion 929–930) [PubMed] [Google Scholar]
- 19.Horber J.K., Mosbacher J., Haberle W., Ruppersberg J.P., Sakmann B. A look at membrane patches with a scanning force microscope. Biophys. J. 1995;68:1687–1693. doi: 10.1016/S0006-3495(95)80346-2. [DOI] [PMC free article] [PubMed] [Google Scholar]
- 20.Heinrich V., Ounkomol C. Force versus axial deflection of pipette-aspirated closed membranes. Biophys. J. 2007;93:363–372. doi: 10.1529/biophysj.107.104091. [DOI] [PMC free article] [PubMed] [Google Scholar]
- 21.Nassoy P. How accurate are ultrasensitive biophysical force probes? Biophys. J. 2007;93:361–362. doi: 10.1529/biophysj.107.109355. [DOI] [PMC free article] [PubMed] [Google Scholar]
- 22.Zhao S., Borden M., Bloch S.H., Kruse D., Ferrara K.W. Radiation-force assisted targeting facilitates ultrasonic molecular imaging. Mol. Imaging. 2004;3:135–148. doi: 10.1162/1535350042380317. [DOI] [PMC free article] [PubMed] [Google Scholar]
- 23.Borden M.A., Martinez G.V., Ricker J., Tsvetkova N., Longo M. Lateral phase separation in lipid-coated microbubbles. Langmuir. 2006;22:4291–4297. doi: 10.1021/la052841v. [DOI] [PubMed] [Google Scholar]
- 24.Hutter J.L., Bechhoefer J. Calibration of atomic-force microscope tips. Rev. Sci. Instrum. 1993;64:1868–1873. [Google Scholar]
- 25.Sader J.E., Chon J.W.M., Mulvaney P. Calibration of rectangular atomic force microscope cantilevers. Rev. Sci. Instrum. 1999;70:3967–3969. [Google Scholar]
- 26.Cross S.E., Jin Y.-S., Rao J., Gimzewski J.K. Nanomechanical analysis of cells from cancer patients. Nat. Nano. 2007;2:780–783. doi: 10.1038/nnano.2007.388. [DOI] [PubMed] [Google Scholar]
- 27.Pajerowski J.D., Dahl K.N., Zhong F.L., Sammak P.J., Discher D.E. Physical plasticity of the nucleus in stem cell differentiation. Proc. Natl. Acad. Sci. USA. 2007;104:15619–15624. doi: 10.1073/pnas.0702576104. [DOI] [PMC free article] [PubMed] [Google Scholar]
- 28.Heinrich V., Ritchie K., Mohandas N., Evans E. Elastic thickness compressibility of the red cell membrane. Biophys. J. 2001;81:1452–1463. doi: 10.1016/S0006-3495(01)75800-6. [DOI] [PMC free article] [PubMed] [Google Scholar]
- 29.Simon S.I., Nyunt T., Florine-Casteel K., Ritchie K., Ting-Beall H.P. Dynamics of neutrophil membrane compliance and microstructure probed with a micropipet-based piconewton force transducer. Ann. Biomed. Eng. 2007;35:595–604. doi: 10.1007/s10439-007-9260-7. [DOI] [PubMed] [Google Scholar]
- 30.Evans E., Heinrich V., Leung A., Kinoshita K. Nano- to microscale dynamics of P-selectin detachment from leukocyte interfaces. I. Membrane separation from the cytoskeleton. Biophys. J. 2005;88:2288–2298. doi: 10.1529/biophysj.104.051698. [DOI] [PMC free article] [PubMed] [Google Scholar]
- 31.Yeung A., Evans E. Cortical shell-liquid core model for passive flow of liquid-like spherical cells into micropipets. Biophys. J. 1989;56:139–149. doi: 10.1016/S0006-3495(89)82659-1. [DOI] [PMC free article] [PubMed] [Google Scholar]
- 32.Needham D., Hochmuth R.M. A sensitive measure of surface stress in the resting neutrophil. Biophys. J. 1992;61:1664–1670. doi: 10.1016/S0006-3495(92)81970-7. [DOI] [PMC free article] [PubMed] [Google Scholar]
- 33.Herant M., Heinrich V., Dembo M. Mechanics of neutrophil phagocytosis: behavior of the cortical tension. J. Cell Sci. 2005;118:1789–1797. doi: 10.1242/jcs.02275. [DOI] [PubMed] [Google Scholar]
- 34.Kim S.V., Mehal W.Z., Dong X., Heinrich V., Pypaert M. Modulation of cell adhesion and motility in the immune system by Myo1f. Science. 2006;314:136–139. doi: 10.1126/science.1131920. [DOI] [PubMed] [Google Scholar]
- 35.Lomakina E.B., Spillmann C.M., King M.R., Waugh R.E. Rheological analysis and measurement of neutrophil indentation. Biophys. J. 2004;87:4246–4258. doi: 10.1529/biophysj.103.031765. [DOI] [PMC free article] [PubMed] [Google Scholar]
- 36.Shao J.Y., Ting-Beall H.P., Hochmuth R.M. Static and dynamic lengths of neutrophil microvilli. Proc. Natl. Acad. Sci. USA. 1998;95:6797–6802. doi: 10.1073/pnas.95.12.6797. [DOI] [PMC free article] [PubMed] [Google Scholar]
- 37.Heinrich V., Leung A., Evans E. Nano- to microscale dynamics of P-selectin detachment from leukocyte interfaces. II. Tether flow terminated by P-selectin dissociation from PSGL-1. Biophys. J. 2005;88:2299–2308. doi: 10.1529/biophysj.104.051706. [DOI] [PMC free article] [PubMed] [Google Scholar]
- 38.Herant M., Marganski W.A., Dembo M. The mechanics of neutrophils: synthetic modeling of three experiments. Biophys. J. 2003;84:3389–3413. doi: 10.1016/S0006-3495(03)70062-9. [DOI] [PMC free article] [PubMed] [Google Scholar]
- 39.Hochmuth R.M., Mohandas N., Blackshear P.L., Jr. Measurement of the elastic modulus for red cell membrane using a fluid mechanical technique. Biophys. J. 1973;13:747–762. doi: 10.1016/S0006-3495(73)86021-7. [DOI] [PMC free article] [PubMed] [Google Scholar]
- 40.Waugh R.E. Surface viscosity measurements from large bilayer vesicle tether formation. II. Experiments. Biophys. J. 1982;38:29–37. doi: 10.1016/S0006-3495(82)84527-X. [DOI] [PMC free article] [PubMed] [Google Scholar]
- 41.Evans E., Yeung A. Hidden dynamics in rapid changes of bilayer shape. Chem. Phys. Lipids. 1994;73:39–56. [Google Scholar]
- 42.Dai J., Sheetz M.P. Mechanical properties of neuronal growth cone membranes studied by tether formation with laser optical tweezers. Biophys. J. 1995;68:988–996. doi: 10.1016/S0006-3495(95)80274-2. [DOI] [PMC free article] [PubMed] [Google Scholar]
- 43.Shao J.Y., Hochmuth R.M. Micropipette suction for measuring piconewton forces of adhesion and tether formation from neutrophil membranes. Biophys. J. 1996;71:2892–2901. doi: 10.1016/S0006-3495(96)79486-9. [DOI] [PMC free article] [PubMed] [Google Scholar]
- 44.Bozic B., Svetina S., Zeks B. Theoretical analysis of the formation of membrane microtubes on axially strained vesicles. Phys. Rev. E Stat. Phys. Plasmas Fluids Relat. Interdiscip. Topics. 1997;55:5834–5842. [Google Scholar]
- 45.Heinrich V., Bozic B., Svetina S., Zeks B. Vesicle deformation by an axial load: from elongated shapes to tethered vesicles. Biophys. J. 1999;76:2056–2071. doi: 10.1016/S0006-3495(99)77362-5. [DOI] [PMC free article] [PubMed] [Google Scholar]
- 46.Smith S.B., Cui Y., Bustamante C. Overstretching B-DNA: the elastic response of individual double-stranded and single-stranded DNA molecules. Science. 1996;271:795–799. doi: 10.1126/science.271.5250.795. [DOI] [PubMed] [Google Scholar]
- 47.Storm C., Nelson P.C. Theory of high-force DNA stretching and overstretching. Phys. Rev. E Stat. Nonlin. Soft Matter Phys. 2003;67:051906. doi: 10.1103/PhysRevE.67.051906. [DOI] [PubMed] [Google Scholar]
- 48.Dessinges M.N., Maier B., Zhang Y., Peliti M., Bensimon D. Stretching single stranded DNA, a model polyelectrolyte. Phys. Rev. Lett. 2002;89:248102. doi: 10.1103/PhysRevLett.89.248102. [DOI] [PubMed] [Google Scholar]
- 49.Evans E., Ludwig F. Dynamic strengths of molecular anchoring and material cohesion in fluid biomembranes. J. Phys. Condens. Matter. 2000;12:A315–A320. [Google Scholar]
- 50.Evans E., Williams P.M. Physics of Bio-Molecules and Cells, Ecoles des Houches d'Ete LXXV. EDP Sciences; Springer-Verlag: 2002. Dynamic force spectroscopy: I. Single bonds; pp. 145–185. [Google Scholar]
Associated Data
This section collects any data citations, data availability statements, or supplementary materials included in this article.