

Abstract
By using skinned-rabbit skeletal muscle fibers, the time courses of changes of thin filament-based x-ray reflections were followed at a 3.4-ms time resolution during thin-filament activation. To discriminate between the effects of calcium binding and myosin binding on thin-filament activity, measurements were performed after caged-calcium photolysis in fibers with full-filament or no-filament overlap, or during force recovery after a quick release. All three reflections examined, i.e., the second actin layer line (second ALL, reporting the tropomyosin movement), the sixth ALL (reporting actin structural change), and the meridional troponin reflections, exhibited calcium-induced and myosin-induced components, but their rate constants and polarities were different. Generally, calcium-induced components exhibited fast rate constants (>100 s−1). The myosin-induced components of the second ALL had a rate constant similar to that of the force (7–10 s−1), but that of the sixth ALL was apparently faster. The myosin-induced component of troponin reflection was the only one with negative polarity, and was too slow to be analyzed with this protocol. The results suggest that the three regulation-related proteins change their structures with different rate constants, and the significance of these findings is discussed in the context of a cooperative thin-filament activation mechanism.
Introduction
Contraction of skeletal muscle is regulated by intracellular calcium levels. Calcium ions, released from the sarcoplasmic reticulum, bind to troponin, the calcium sensor on the thin filament. Troponin then causes tropomyosin, another regulatory protein, to move on the thin filament so that the myosin-binding site on actin is exposed (1,2). The field of muscle research dealing with these regulatory processes is often referred to as “calcium regulation”.
Despite this simple term, the actual entity of regulation is quite complex because of at least three factors. The first factor involves the bidirectional nature of regulation, in which myosin binding to actin also activates the thin filament and facilitates calcium binding to troponin (3). Regarding the second factor, the thin filament is not activated by calcium binding alone, but also requires myosin binding (4). Taking these factors together, we always have to consider both calcium-induced and myosin-induced components in the context of calcium regulation. The third factor involves the cooperativity of ligand binding, which occurs in both calcium and myosin (5,6). Calcium binding to troponin C facilitates further calcium binding to the same and other troponin C molecules. Myosin binding to an actin molecule also facilitates myosin binding to nearby actin molecules. For more references and the consequences of these factors for contractile properties, see Iwamoto (3).
These complex regulatory events are enacted by the structural changes and movements of these regulatory proteins, and to elucidate their roles in the dynamics of muscle contraction, the rate of structural change of each regulatory protein must be measured in contracting muscle fibers, and must be correlated with mechanical events. One of the best techniques to elucidate these roles would involve time-resolved x-ray fiber diffraction. The movement of tropomyosin molecules may be followed by monitoring the far off-meridional part of the second actin layer line (ALL), at 1/19 nm−1. This reflection is known to be enhanced upon thin-filament activation, as the thin filament approaches a four-stranded helix structure with a basic repeat of 19 nm (7,8).
The structural changes of the troponin complex may be followed by monitoring a series of meridional reflections based on its 38-nm repeat. According to previous time-resolved measurements using living frog muscles, the intensity of the strongest first-order reflection shows complex behavior after stimulation (i.e., enhancement followed by diminution) (9–14).
Beyond these regulatory proteins, evidence is accumulating that actin itself changes its molecular shape upon activation. The sixth ALL at 1/5.9 nm−1 is substantially enhanced during contraction without changing its peak position (15–17), and this behavior is best explained by the structural change of actin itself.
Each of these structural/positional changes may have multiple rate processes, which may range from ∼10 s−1 in myosin-induced processes to ∼500 s−1 in processes directly associated with calcium binding to troponin C (18). This means that a high time resolution is required to record the fastest structural changes that could occur. The previous time-resolved measurement using living frog and mouse muscles (17) was conducted in a conventional undulator-based beamline of SPring-8, and the time resolution was 19 ms/frame. Apparently this is insufficient for our purposes here. As in other time-resolved measurements, the use of living muscle by itself limits the time resolution, because of the slow calcium release from the sarcoplasmic reticulum (∼10 ms) (19).
Here the limitation on time resolution has been removed in two ways. One is the use of the high-flux BL40XU beamline of SPring-8, which can deliver 1000-fold more intense x-ray beams with reasonable monochromaticity (bandwidth, ∼2%) (20). When combined with a fast 3-CCD camera, this high flux allows for a time resolution of 3.4 ms/frame in full-frame two-dimensional recordings. The other is the use of skinned-rabbit skeletal muscle fibers, in which the calcium concentration can be increased well within 1 ms by the ultraviolet flash photolysis of caged calcium (NP-EGTA) (21,22).
To distinguish between calcium-induced and myosin-induced components in structural changes, we incorporated a quick-release maneuver in the protocols. These protocols included: 1), photolysis of caged calcium within fibers with full-filament overlap, to extract both calcium-induced and myosin-induced components; 2), photolysis of caged calcium within fibers stretched beyond filament overlap, to extract calcium-induced components alone; and 3), quick release applied to fully activated fibers with full-filament overlap, to extract myosin-induced components alone. In this protocol, calcium would remain bound to troponin-C, whereas myosin would temporarily detach from actin and slowly reattach.
The results show that all three constituents of the thin filament (actin, tropomyosin, and troponin) show calcium-induced and myosin-induced components, but their rate constants are not necessarily the same. These results have profound implications for the mechanism of calcium regulation, as will be discussed. Preliminary accounts of this study have appeared (23).
Materials and Methods
Specimens and experimental setup
Skinned muscle fibers were prepared from rabbit psoas muscle as described (24), and were stored in a 50% mixture of a relaxing solution and glycerol in a freezer (−20°C) for up to 2 months. The specimen remains stable during this period, with force-pCa curves (25,26) no different from those in other studies. For quick-release experiments, an array of ∼30 single fibers was mounted to a specimen chamber, as in previous caged-ATP experiments (27). Both ends of these fibers were individually clamped to half-split gold meshes for electron microscopy (width, ∼3 mm), that had been glued to precision-machined ceramic chips (width, 3 mm) designed to fit the specimen chamber. For caged-calcium experiments, a bundle of unseparated fibers was clamped as a whole, with aluminum clips glued to precision-machined ceramic chips (width, 1.5 mm), also designed to fit another specimen chamber designed for caged-calcium experiments. The number of fibers contained in each bundle was ∼60, as estimated from the active force of the bundle (∼24 mN) and the average force of a single fiber (∼0.37 mN) (see legends of Figs. 2 and 4). The specimen chamber had a quartz window for YAG-laser pulses, as in Wakayama et al. (27), but the width of the window was narrower (1.5 mm vs. 3 mm in Wakayama et al. (27)), so that laser pulses could be focused to a narrower area. We used specimens of narrower width than in the caged ATP experiment to photolyze effectively the caged calcium, which has a lower quantum yield (0.20) (21). Each ceramic chip had a hole to fit a movable arm of the specimen chamber, to be connected to a servomotor (VM-500, GSI Lumonics, Billerica, MA) or a force transducer (AE801, Memscap, Bernin, France). The arrays of single fibers were prepared in advance of experiments, and were stored in the relaxing solution/glycerol mixture until x-ray measurements. Bundles were prepared and mounted at the beamline.
Figure 2.
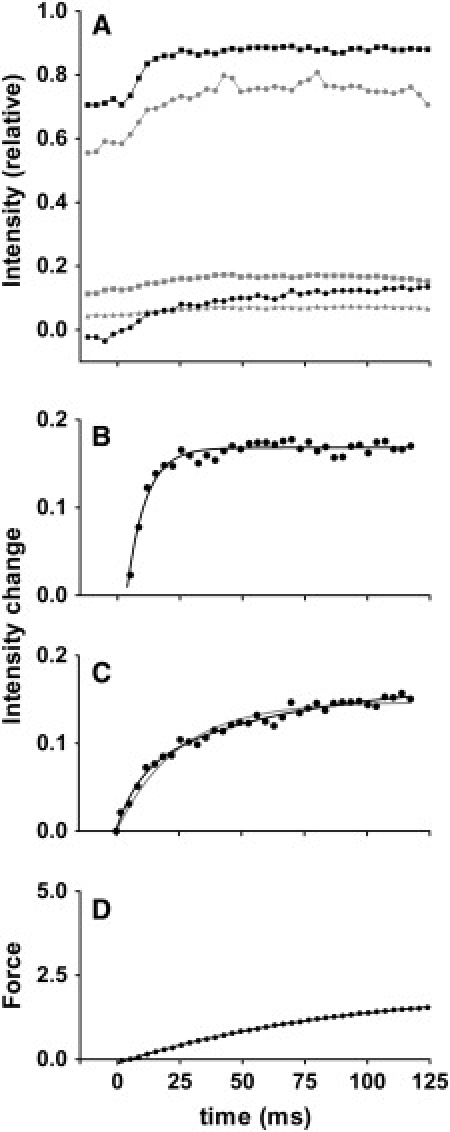
Time courses of change of integrated intensities in caged-calcium experiments performed at full-filament overlap (from 12 fiber bundles). (A) Intensities above background level (black squares, sixth ALL; black circles, second ALL; gray circles, first-order troponin; gray squares, second-order troponin, gray triangles, third-order troponin). Intensities were normalized with respect to total intensity of sixth ALL before flash (Fig. 1, magenta box). Intensity of second ALL often becomes negative, because the subtraction was performed by connecting the two edges of reflection by a straight line, but the actual background is likely to be concave. The time for flash is set as 0. (B) Fit of intensity change of sixth ALL after flash. Averaged intensity before flash was subtracted from record in A. The curve is the best-fit single-exponential association function. (C) Fit of intensity change of second ALL after flash. Data can be fitted by either a double-exponential (black curve) or single-exponential (gray curve) association function, but the double-exponential function gives a better fit. (D) Time course of force development after flash, recorded simultaneously in x-ray recording (sum of data from all specimens, in arbitrary units). Data can be fitted with a single-exponential association function (curve). Isometric force generated by each fiber bundle was 24.3 ± 9.0 mN (n = 11, mean ± SD).
Figure 4.
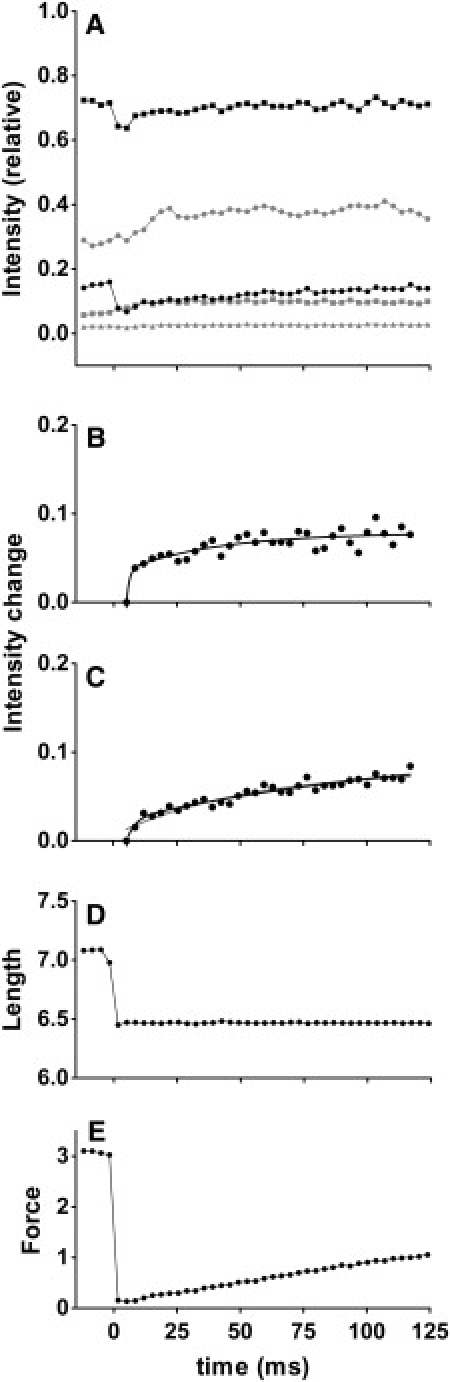
Time courses of changes of integrated intensities in quick-release experiments (from 16 arrays of ∼30 single fibers). Intensities were normalized to total intensity of sixth ALL before release, which is expected to be up to 50% greater than in the relaxed state. (A) Intensities above background level. Symbols are same as in Fig. 2. (B) Fit of intensity change of sixth ALL after flash. Data are above lowest intensity after release. (C) Fit of intensity change of second ALL after release. Both curves can be fitted with a double-exponential association function. The rate constants for faster processes are large, and may represent recovery from a disoriented state immediately after release. (D) Fiber length (output of length signal from servomotor; sum of data from all specimens). Release amplitude was 2% of fiber length, and was complete in ∼1.5 ms. (E) Force (sum of data from all specimens, in arbitrary units). Recovery after release is fitted with a single exponential association function. The isometric force generated by each fiber array was 11.0 ± 2.2 mN (n = 10, mean ± SD). If diameter of a single fiber is 70 μm, the force per cross-sectional area is ∼1.0 × 10⁵ N/m2, in agreement with previous report of 1.24 × 10⁵ N/m2 (24).
There was no way to measure sarcomere length inside the experimental hutch, where diffraction recordings were conducted. In quick-release experiments, fiber length was adjusted before closing the hutch, so that a small amount of resting tension was generated. This usually gave a sarcomere length of ∼2.4 μm. For caged-calcium experiments, the fiber length was fixed by tightening the screw of the specimen chamber before it was brought to the experimental hutch. For full-filament overlap experiments, fiber bundles were fixed at their just-taut lengths, which gave sarcomere lengths, on average, of 2.33 μm by He-Ne laser diffraction. For nonoverlap experiments, individual fiber bundles were manually stretched while monitoring the sarcomere length until it reached 3.5 μm.
The design of the specimen chamber was basically the same as that used for caged-ATP experiments (27), except for the force transducer built into it and the capability of length change through an externally placed servomotor. The setup for time-resolved x-ray diffraction recording, photolysis, movement of the experimental chamber by a pulse-motor-driven Z-stage to reduce radiation damage, and their method of synchronization were identical to those used for caged-ATP experiments. The geometry of the experimental setup is detailed in Fig. 1 in Wakayama et al. (27), except that the stage was moved at a speed of 25 mm/s (previously, 100 mm/s) to obtain longer records; the maximal recording time was equal to the fiber length (∼6 mm) divided by the Z-stage speed. This slowdown made the fibers four times more susceptible to radiation damage, and we had to reduce the x-ray flux accordingly by limiting the aperture of the front-end slit of the beamline.
Figure 1.
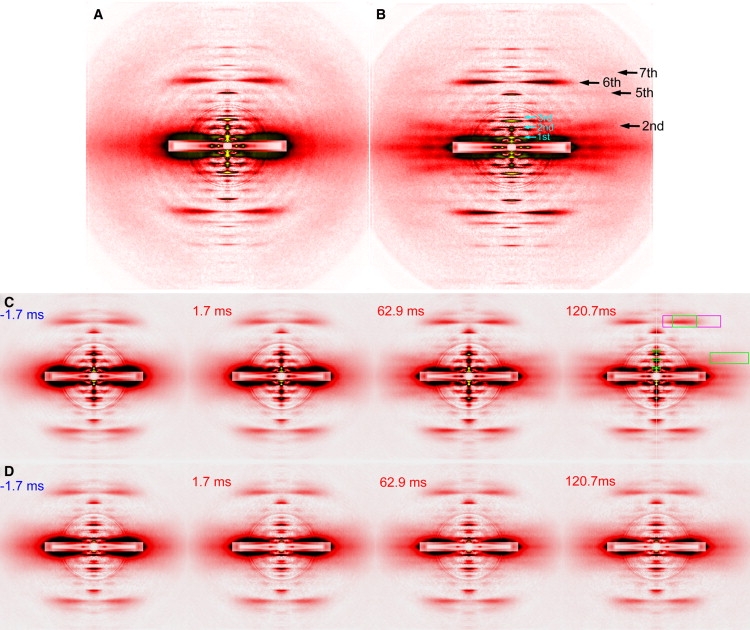
Diffraction patterns from skinned-rabbit psoas fibers. (A, B) Static diffraction patterns recorded at BL45XU beamline of SPring-8. (A) Pattern in relaxing solution. (B) Pattern during isometric contraction, recorded from same fibers as in A. Black arrows indicate actin layer lines that are enhanced during contraction. Cyan arrows indicate meridional reflections from troponin. Summed image is of three fiber arrays consisting of 30 single fibers. Total exposure time, 120 s. Background scattering was subtracted by method described elsewhere (17). Four quadrants of patterns were folded and averaged. Overlapping circles in pattern are attributable to correction for the round aluminum attenuator, placed in front of the detector to prevent it from saturating. (C and D) Selected frames from time-resolved diffraction recordings in caged-calcium experiments performed at BL40XU beamline. (C) At full-filament overlap. (D) Overstretched fibers. Summed image is of 11–12 fiber bundles consisting of ∼60 fibers. Exposure time of each frame is 3.4 ms. Number in each panel is time after (red) or before (blue) flash photolysis. Areas of intensity integration are indicated as boxes in rightmost panel in C. Green box flanking the right edge is the area of second ALL. Green box on top is the area of sixth ALL, and magenta box is area of total intensity of sixth ALL, used as reference for all reflections. Small green boxes on meridian comprise area for troponin reflections.
Solutions
For quick-release experiments, the relaxing, preactivating, and activating solutions (pCa = 4.49) had compositions as described (24,27,28), with 20 mM glutathione and 1000 U/mL catalase for protection from radiation damage. The caged-calcium solution was as described elsewhere (29), and basically contained 180 mK K-propionate, 10 mM NP-EGTA (N-6802, Molecular Probes, Eugene, OR), 7.5 mM CaCl2, 5 mM MgCl2, 4 mM ATP, 20 mM imidazole, 20 mM creatine phosphate, 324 U/mL creatine phosphokinase, 20 mM glutathione, and 1000 U/mL catalase (pH 7.2). This composition should give a pCa value of ∼6.5., i.e., a value at which muscle fibers barely stay relaxed. The relatively high ionic strength (300 mM vs. 200 mM in normal solutions) was intended to make the force-pCa relation steep (with a greater Hill coefficient) (29), to facilitate full activation of fibers by photoreleased calcium. The concentrations of CaCl2 and NP-EGTA were further fine-adjusted before experiments, to make sure that a small test piece of muscle fiber remained barely relaxed in the photolysis solution. The preactivating solution for caged-calcium experiments had basically the same composition as in the caged-calcium solution, except that it lacked NP-EGTA and CaCl2 but contained 0.1 mM EGTA. The energy of the YAG-laser was ∼120 mJ/pulse at a frequency-tripled wavelength of 355 nm, and its beam was focused to an area of ∼1.5 × 7 mm by using a cylindrical lens. The molar extinction coefficient of NP-EGTA was determined to be 525 M−1cm−1 at 355 nm. With a laser path length of 0.5 mm, the laser beam could be attenuated to ∼55% at the bottom of the specimen chamber. The amount of released calcium was not directly measured after experiments, but based on the rate of force development (11 s−1; see Results), it was estimated to be sufficient to activate the fibers fully. (In Iwamoto (29), it was 7.2 s−1 when fibers were fully activated at a 200-mM ionic strength at comparable temperatures of 3–5°C. The rate of force development is known to be very sensitive to calcium concentration, and the fast rate is not obtained unless fibers are fully activated.) The rate of photolysis of NP-EGTA was reported to be very fast (6.8 × 10⁴ s−1) (22), so that it is unlikely to affect the rate of force development.
For quick-release experiments, fibers were first placed in the specimen chamber filled with the preactivating solution, and ∼10 s before exposure, the solution was replaced by the activating solution by using a remote-controlled pump. In caged-calcium experiments, fibers were first placed in the preactivating solution, and then the solution was manually replaced by photolysis solution outside the experimental hutch, before the specimen chamber was set in the x-ray beam path. In all experiments, the specimen chamber was cooled to ∼5°C. Each specimen was exposed to x-ray beams only once.
X-ray diffraction recording and data analysis
Static diffraction patterns (results in Fig. 1, A and B) were recorded at the BL45XU beamline of SPring-8 (17,30–32), with a wavelength of 0.09 nm and a specimen-to-detector distance of ∼2 m.
Time-resolved recordings were performed at the high-flux BL40XU beamline of SPring-8. The conditions for these recordings were identical to those for caged-ATP experiments (27). In short, the energy of the x-ray beam was 15 keV (λ = 0.083 nm), with a bandwidth of ∼2%. The specimen-to-detector distance was ∼2.4 m. This combination of short wavelength and a moderate-length camera was optimized for recording the far off-meridional second ALL and sixth ALL. With this setting, the first meridional reflection of troponin (1/38 nm−1) was on the steep slope of background scattering, and was not well-separated from the neighboring reflection from myosin-binding protein C at 1/44 nm−1. Thus, the accuracy of its measured intensity should be considered accordingly. The detector was a fast 3-CCD camera (model C7770 pilot version, Hamamatsu Photonics, Hamamatsu, Japan), in combination with an image intensifier (V5445P, Hamamatsu Photonics). This detector was capable of recording at 3.4 ms/frame, with a frame size of 640 × 480 pixels.
Background scattering was subtracted, and reflection intensities were determined as described elsewhere (17,27). The curve-fitting for the time course of intensity changes was performed using a commercial software package (Prism, Graphpad Software, San Diego, CA). In principle, curve-fitting should be applied to the square root of intensities rather than intensities as they are, because the intensity is proportional to the square of the number of scattering objects (i.e., square law). However, in many circumstances, the measured intensity can deviate from this law, and approaches a linear relationship with the number of scattering objects (33–35). Here, both the intensities and their square roots were subjected to curve-fitting where possible. The fitted values for square roots are enclosed within square brackets.
Results
Static diffraction patterns of fibers in relaxing and contracting solutions
The diffraction patterns of skinned fibers from rabbit psoas with full-filament overlap, as recorded in the BL45XU beamline, are shown in Fig. 1, A and B. Compared with the relaxed pattern (Fig. 1 A), the second, sixth, and seventh ALLs are intensified in the pattern from contracting fibers (Fig. 1 B). In addition to the intensification of these well-documented reflections, the intensification of the far off-meridional part of the fifth (as well as seventh) ALL is also evident, confirming previous observations of living frog and mouse muscles (17). These observations were interpreted to indicate the structural change of actin monomer upon thin-filament activation (17). Although the first meridional peak of the troponin reflection (1/38 nm−1) seems to be weakened during contraction, its off-meridional part is intensified, suggesting that the reflection is broadened along the equator because of decreased filament-lattice order (13). The integrated intensities of major thin-filament-based reflections, as determined in the same manner as in time-resolved measurements, are summarized in Table 1.
Table 1.
Integrated intensities of major thin filament-based reflections in static recordings shown in Fig. 1, A and B
| Second ALL | Sixth ALL | First troponin | Second troponin | Third troponin | |
|---|---|---|---|---|---|
| Relaxed | −0.01 | 0.73 | 0.67 | 0.119 | 0.027 |
| Contracting | 0.31 | 1.08 | 0.45 | 0.058 | 0.016 |
| Change on activation (%) | +48 | −33 | −51 | −42 |
Time course of intensity changes after flash photolysis of caged calcium
Fibers with full-filament overlap
A gallery of diffraction patterns, recorded with a 3.4-ms time resolution from fibers with full-filament overlap, is shown in Fig. 1 C, with regions of intensity integration indicated by green boxes in the rightmost pattern. As in the static pattern (Fig. 1 A), the far off-meridional part of the second ALL is not visibly apparent in the pattern before and immediately after the flash, but it becomes better defined in later patterns. Likewise, the sixth ALL becomes visibly more intense.
The time course of change of reflection intensities is summarized in Fig. 2 A. After photolysis, the intensities of both the second (solid circles) and sixth (solid squares) ALLs increase with time, but the sixth ALL rises more quickly than the second ALL. These time courses of photolysis-induced intensifications are fitted by a single-exponential or double-exponential association function in Fig. 2, B–D, along with the force, and the fitted values are summarized in Table 2. In the 125-ms time window, the intensity increase in the sixth ALL (Fig. 2 B) is adequately fitted with a single-exponential function with a rate constant of ∼130 s−1, i.e., much greater than that of the force development (11 s−1; Fig. 2 D). The amplitude of increase is only ∼20%, whereas in the static measurements (Fig. 1, A and B), a 48% increase is attained at the plateau of force (Table 1). Therefore, the sixth ALL is expected to rise farther, although slowly, as the force also continues to rise after the 125-ms time window. The rise of the second ALL is better fitted with a double-exponential function than with a single-exponential function (Fig. 2 C). As in the sixth ALL, the faster rate constant exceeds 100 s−1, whereas the slower rate constant is only slightly higher than that of the force. The amplitudes of faster and slower components are almost equal (Table 2).
Table 2.
Fitted rate constants for intensity changes and rise of force
| Faster rate constant | Slower rate constant | Percentage of faster component | Goodness of fit (R2 value) | |
|---|---|---|---|---|
| Full overlap | ||||
| Second ALL | 113 s−1 [164 s−1] | 15.9 s−1 [18.0s−1] | 62% [58%] | 0.9857 [0.99] |
| Sixth ALL | 132 s−1 [136 s−1] | 0.9736 [0.9753] | ||
| Force | 11 s−1 | 0.9996 | ||
| Overstretched | ||||
| Second ALL | 88 s−1 | 0.9385 | ||
| 264 s−1 | 41 s−1 | 50% | 0.9564 | |
| Sixth ALL | 179 s−1 [244 s−1] | 0.9554 [0.8994] | ||
| Quick release | ||||
| Second ALL | 307 s−1 [315 s−1] | 7.9 s−1 [9.7 s−1] | 23% [29%] | 0.9388 [0.9459] |
| Sixth ALL | 858 s−1 [861 s−1] | 27 s−1 [28 s−1] | 47% [48%] | 0.7728 [0.7790] |
| Force | 7 s−1 | 0.9972 | ||
When intensity change is fitted to a single exponential function, value is placed in “Faster rate constant”. Values enclosed within square brackets were determined for square roots of intensities.
The intensities of meridional troponin reflections, as measured within the limitations of the settings described in Materials and Methods, are plotted in Fig. 2 A (gray symbols). The intensity of the first-order reflection (circles) rose after the flash, in parallel with the sixth ALL. After an initial fast phase, the rate of rise decreased, and finally the intensity began to decline. A transient rise of the first-order reflection, followed by a decline, was observed in living frog muscle (9,13,14), but the process seems to be slower in rabbit fibers. The behavior of the second reflection is similar to that of the first reflection. As the isometric force approaches a plateau, the intensities of the first and second reflections are expected to keep declining until they reach 67% and 49%, respectively, of their levels before activation (Table 1).
Fibers stretched beyond filament overlap
A gallery of diffraction patterns recorded from overstretched fibers is shown in Fig. 1 D. The times of recording of the selected frames are the same as those for the full-overlap fibers. The intensification of the sixth ALL is not visibly apparent, but the second ALL gradually shows up with time, although it is fainter than in the full-overlap fibers.
The time course of change of reflection intensities is summarized in Fig. 3 A. The amplitudes of intensity changes are generally smaller than in fibers with full-filament overlap. The sixth ALL rises rapidly after the flash, but tends to decrease slightly after 50 ms from the flash (Fig. 3 A, solid squares). Therefore, curve fitting was applied only to the initial 50-ms time segment (Fig. 3 B). This segment was fitted with a single-exponential function, and the rate constant was close to 200 s−1 (Table 2). The amplitude of increase was ∼10%, i.e., half of the value for fibers with full-filament overlap. This amplitude is comparable to the value reported for overstretched specimens (7–10%) (16,36), and is considered to represent the calcium-induced components of the change in actin structure. If this is true, the 20% increase in the sixth-ALL intensity in fibers with full-filament overlap (Fig. 2 B) should contain both calcium-induced and myosin-induced components, although only a single exponential process is resolved. It is possible that the myosin-induced change in actin structure proceeds faster than the increase in actin-attached myosin heads.
Figure 3.
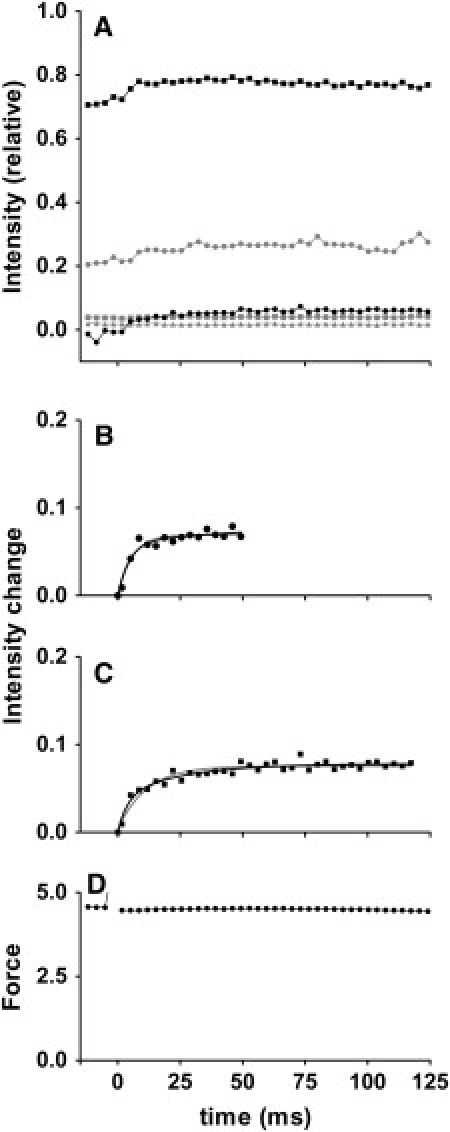
Time courses of changes of integrated intensities in caged-calcium experiments performed in overstretched fibers (from 11 fiber bundles). (A) Intensities above background level. Symbols are same as in Fig. 2. (B) Fit of intensity change of sixth ALL after flash. Because intensity tended to decrease again, the fitting was performed only for first 50 ms after flash. (C) Fit of intensity change of second ALL after flash. Data can be fitted by either a double-exponential (black curve) or single-exponential (gray curve) association function. (D) Time course of change of force after flash, recorded simultaneously in x-ray recording (sum of data from all specimens in arbitrary units, but on same scale as in Fig. 2D). Fibers show high passive force before flash. No active force develops after flash. Passive force that existed before flash in each fiber bundle was 47.4 ± 11.3 mN (n = 11, mean ± SD). This is twice as large as the active force, i.e., ∼2 × 10⁵N/m2. This is in agreement with the previously reported value (51).
The amplitude of change of the second ALL is also smaller than with full-filament overlap (Fig. 3 A, solid circles). The time course of its change can be fitted by either a single-exponential or double-exponential function (Fig. 3 C and Table 2). Even with a double-exponential fit, the slower rate constant is 41 s−1, and no slowly rising component was observed.
The amplitudes of intensity changes of troponin reflections are also smaller than in the case of full-filament overlap (Fig. 3 A, gray symbols). The time course of change of the first-order reflection seems to have a fast component, as with the sixth ALL, and the reflection seems to stay elevated, at least for the 125-ms time segment. The second-order reflection is very weak, but becomes slightly more intense after the flash.
Time course of intensity changes during force recovery after quick release
Fully activated, isometrically contracting fibers were subjected to a quick release (amplitude, 2% of fiber length; duration, 1.5 ms). This amplitude was large enough to bring the force almost to zero. This operation was expected to dissociate a substantial part of the attached myosin heads from actin, followed by a slow reattachment process. Meanwhile, calcium was expected to remain bound to the thin filament because of its high concentration (pCa ∼4). The time courses of changes of thin-filament-based reflections during the recovery process are shown in Fig. 4.
Both the second and sixth ALLs show a concomitant drop of intensities at release, followed by slow recovery processes (Fig. 4 A, solid symbols). The drop of the sixth ALL is only ∼10% of the level immediately before release, i.e., 1/4–1/5 of the increment upon the transition from relaxed to fully activated states. Likewise, the second ALL does not seem to drop to the level of the relaxed state. The phases of recovery from the lowest intensities are fitted with exponential functions, for both reflections (Fig. 4, B and C). Both are fitted with double-exponential association functions, with a very fast component followed by a much slower component. In the case of the sixth ALL, the faster rate constant reaches ∼860 s−1, and the lower rate constant is still several times greater than that of the rise of force (7.0 s−1; Fig. 4 E and Table 2). In the case of the second ALL, the faster rate constant is ∼300 s−1. The slower component has greater amplitude (77% of the total), and its rate constant is similar to that of the force. In both cases, the faster components are even faster than the calcium-induced components in the caged-calcium experiments (Fig. 2), which could be attributable to recovery from a temporarily buckled state of the fibers, because the outer reflections lose their sharpness immediately after release (not shown).
Unlike the ALLs, the troponin reflections do not show a temporal drop in intensity, but simply rise after the quick release (Fig. 4 A, gray symbols). The rise of the first reflection (Fig. 4 A, circles) is almost complete ∼25 ms after release, and seems to remain elevated for the rest of the period. Although the amplitude is smaller, the second reflection behaves in a similar manner.
Discussion
Here, we examined the time courses of change of thin-filament-based reflections during activation events of skinned-rabbit skeletal muscles fibers in time-resolved two-dimensional x-ray recordings, at a 3.4-ms time resolution. Most time-resolved x-ray diffraction studies of calcium regulation were performed using living frog muscles (9–13,17,37), and the intensity of changes was not analyzed in terms of exponential rate processes. This, as far as we know, is the first fast time-resolved study of this subject performed using skinned-rabbit fibers, in which calcium concentrations within the filament lattice can be changed within a millisecond by using caged calcium (21,22). The sources of reflections examined included tropomyosin, actin, and troponin, and the experimental settings were optimized for the former two components. The experiments were also designed to distinguish between calcium-induced and myosin-induced components.
The second ALL
This second ALL is the best-documented of all regulation-related reflections from muscles. This reflection is intensified when tropomyosin molecules move on the thin filament, to expose the hydrophobic amino-acid residues of actin essential for stereospecific actin-myosin interactions (7,8). Myosin heads stereospecifically attached to actin should also contribute to this reflection, but the contribution should be negligible during contraction because of myosin disorder (32).
The first time-resolved measurement of this reflection was performed in living frog muscles by Kress et al. (37), who reported that this reflection was the fastest to rise after stimulation and suggested that the rise was strongly correlated with calcium binding to the thin filament. Later static measurements indicated that the rise of this reflection was greater in full-filament overlap than in overstretched muscles (38), and time-resolved measurements by Iwamoto et al. (17) also suggested that the intensity of this reflection was correlated with active force rather than intracellular calcium. In the caged-ATP photolysis experiment, in which ATP was released into the filament lattice of fibers in rigor, the rigor force was temporarily replaced by active force, and the intensity of the second ALL was maintained even in the absence of calcium (27). These results suggest a myosin-induced component in the rise of this reflection, an idea supported by the electron-microscopic observation of regulated thin filaments by Vibert et al. (39), who demonstrated further movement of tropomyosin upon myosin binding.
In our results, the calcium-induced and myosin-induced components are clearly distinguished in the caged-calcium experiments through the comparison between fibers with full-filament overlap and overstretched fibers (Figs. 2 C and 3 C). With full-filament overlap, the rise of the second ALL consists of fast and slow exponential components, and the rate constant for the slow exponential components is close to that of the rise of isometric force. On the other hand, the slow component is largely missing in overstretched fibers. Thus the fast component, with a rate constant of more than 100 s−1, is thought to represent the calcium-induced component, and its amplitude is ∼10% of the integrated intensity of the sixth ALL, consistent with previous reports (32). The slow, myosin-induced component contributes an additional ∼10%, also consistent with a previous report on skinned-rabbit fibers (31). The slow, myosin-induced component was also apparent in the quick-release experiment (Fig. 4 C), in which troponin molecules retained their bound calcium and the fast component was largely missing (the residual fast component had a rate constant much greater than in the caged-calcium experiment, and was possibly a motion-induced artifact).
The sixth ALL
The sixth ALL is also known to rise after stimulation, and as mentioned earlier, the rise is likely to be caused by the structural change of actin monomers themselves, rather than by stereospecific myosin attachment. The rise of this reflection is also known to have calcium-induced and myosin-induced components, because with full-filament overlap, the rise could reach ∼50% (Fig. 1, A and B), whereas in overstretched muscle or fibers, the rise is only 7–10% (16,32,36). The myosin-induced component also seems to rise even in the absence of calcium in the caged-ATP experiment, as mentioned above (27).
The two components are also evident in our results, but their separation in terms of rate constants is not as simple as for the case of the second ALL. In the caged-calcium experiment with full-filament overlap, only a single exponential component was resolved (Fig. 2 B), with a fast rate constant of ∼130 s−1. However, its amplitude was much greater (∼20%) than in overstretched fibers (∼10%, Fig. 3 B), suggesting that the fast rise of this reflection with full-filament overlap contains both calcium-induced and myosin-induced components (the fast exponential process observed with full-filament overlap may be followed by a much slower process, which would eventually bring the intensification to ∼50%). It is also evident from the quick-release experiment that the rise of the sixth ALL does have a slow exponential component (Fig. 4 B), although its rate constant (27 s−1) is substantially greater than that of the force (∼7 s−1). The myosin-induced component of the sixth ALL rises faster than that of the second ALL, and may consist of multiple exponential processes.
Troponin reflections on the meridian
The present combination of specimen-to-detector distance and x-ray wavelength was not optimized for these reflections, the first order of which appeared at a low-angle position of 1/38 nm−1. Possibly reflecting this, the results for these reflections are somewhat variable, and we limit the discussion to their qualitative aspects.
The behavior of the troponin reflections may be more complex than that of other regulation-related reflections. It was reported for living frog muscle that the first-order reflection rises after stimulation, but the direction of change is quickly reversed, and at the plateau of tetanic contraction, it may drop to only 20–40% of its initial value at temperatures ≤10°C (9,11–13), and even to 13% after a double-shock at 16°C (14). The initial rise of intensity may reflect the gross conformational/orientational change of the movable part of troponin complex (including troponin C, I, and the “IT-arm”, an arm-like structure consisting mainly of α-helical parts of troponin I and T), so as to increase the contrast of densities along the thin filament (40–42). This structural change should be calcium-induced, and should directly cause the tropomyosin movement. Therefore, the rise of intensity is expected to be very fast. The secondary drop of intensity may be attributable to the decrease in contrast because of myosin attachment to the segment of thin filaments between the two neighboring troponin complexes (9), and in fact, the reflections remain enhanced in the presence of calcium and in the absence of filament overlap (32). This mechanism does not fully account for the nonlinear relationship between the drop of intensity and the amount of developed force (14). An order-to-disorder transition may also be implicated in the intensity change (10). Moreover, myosin binding may reduce the intensity because the movable part of troponin “comes loose”, owing to its reduced affinity for tropomyosin (14). If myosin binding is the major determinant of the secondary decrease in intensity, its time course is expected to be close to that of the force, even if the myosin scattering does not directly interfere with troponin scattering.
Although curve-fitting was not performed for troponin reflections, the results presented here for caged-calcium experiments suggest that 1), the initial rise of intensity is no faster than that of the second and sixth ALLs; 2), unlike the case for frog muscle, the secondary decrease of intensity is so slow that it barely starts within the 125-ms time window of observation; and 3), there seems to be a myosin-induced component, because smaller changes were observed in overstretched fibers (Fig. 3 A).
The difference in the magnitude and rate of intensity change between frog and rabbit muscles may occur because 1), the kinetics of rabbit proteins is generally much slower than that of frog proteins at the same temperature; and 2), in rabbits, the movable part of troponin is more stably associated with the rest of the thin filament. In addition, the substantial broadening of the troponin reflection, as observed upon the activation of frog muscle (14), was not observed in rabbits (data not shown). As the broadening further decreases the uncorrected intensities (13,14), this may also contribute to the differences between the two muscles.
It is notable that the intensity of the first-order reflection does not drop upon quick release, but monotonically rises afterward (Fig. 4 A). This observation is consistent with the idea that troponin stays activated, and its contrast is enhanced because the release makes some of the myosin heads detach from the thin filament, and possibly because of the partial restoration of the interaction between the movable part of troponin and the rest of the thin filament.
Relationship to troponin kinetics determined by fluorescent labeling
The present x-ray results on the activation kinetics of thin filaments may be compared with those determined by the fluorescence change of labeled troponin molecules incorporated into thin-filament preparations or muscle fibers. One such study involved fluorescence energy transfer measurements between troponin I and actin in reconstituted thin filaments (18). This stopped-flow study showed that at a saturating calcium level (pCa = 4), the fluorescence energy transfer efficiency can change at a rate of ∼530 s−1. Comparable values were reported in studies using myofibrils (43). One study directly relevant to the study presented here involved the fluorescence polarization measurement of labeled troponin C introduced into skinned cardiac muscle preparations, which were activated by caged-calcium photolysis (44). This study resolved fast (∼100 s−1) and slow components in the troponin-C rotation, and the rate constant for the latter was found to track that of force development. These findings are similar to our present observations of the second or sixth ALL, suggesting that the rotation of troponin C also has calcium-induced and myosin-induced components. The rotation (41) by itself should enhance the x-ray reflections. Thus it would be either the myosin-induced movement of the IT-arm or an exogenous factor (such as destructive interference by attached myosin heads) that makes the intensity change biphasic.
Behavior of regulatory protein in the context of thin filament cooperativity
Traditionally, it was thought that a thin-filament regulatory unit (consisting of seven actin monomers, one troponin complex, and one tropomyosin molecule) was turned on by calcium binding alone. However, later studies showed that the regulatory unit cannot be turned on by calcium binding alone, but requires myosin binding to be activated fully (4). Such observations led McKillop and Geeves (45) to propose a three-state model of thin-filament regulation, consisting of blocked, closed, and open states. The blocked state is the calcium-free state. The closed state is the calcium-induced (but still inhibited) state, and the open state is the myosin-induced, fully turned-on state. Electron-microscopic studies suggest that in the closed state, the tropomyosin molecule is located midway between the blocked and open positions (39). The calcium-induced and myosin-induced components in the rise of the second ALL would be explained by the presence of such an intermediate position. It is unclear whether an intermediate state also exists in actin structure, to explain the similar behavior of the sixth ALL.
Alternatively, there may be only one structural transition in both tropomyosin and actin. Both the blocked and closed states are functionally “off” states, and may be structurally indistinguishable from each other. In an earlier simulation study on cooperative thin-filament activation, we showed that such a single-transition scheme can explain the calcium-induced and myosin-induced components in intensity changes (3). In that study, two definitions were proposed for the quantitative measurement of thin-filament activity: one was the proportion of regulatory units with bound calcium (θCa), and the other was the proportion of regulatory units that were fully turned on by myosin binding (θon). This proposal led to a question regarding which of the parameters the x-ray reflection intensities reported. At a saturating calcium concentration, the simulation showed that θCa stayed close to 1, and was not affected much by a quick release or shortening. On the other hand, θon was much more sensitive to the states of muscle fibers, and showed both the fast (calcium-induced) and slow (myosin-induced) components in full overlap, only the fast component in overstretched fibers, and only the slow component after a quick release (Fig. 7 in Iwamoto (3).). This simulation seems to reproduce our observation of the second ALL better than that of the sixth ALL.
An important result of this study is that the intensity of the sixth ALL increases faster than that of the second ALL. Although the smaller rate constant for the second ALL is comparable to that of force development, the smaller rate constant for the sixth ALL is several times greater than this. It seems as if the structural change of the actin monomer is transmitted farther than the positional shift of tropomyosin. This could be caused by a cooperative transmission of structural changes along the F-actin filament (46,47). Currently, the role of actin structural change in thin-filament regulation is unknown (causing allosteric effects?), but its role may prove essential for the following reasons.
There is increasing evidence that the size of a thin-filament regulatory unit is substantially greater than the set of seven actin monomers and one each of troponin and tropomyosin (48,49), and it was even proposed that the size of a regulatory unit increases as muscle fibers are activated further (50). If so, the activity of thin filaments (θon; see above) is expected to saturate faster than the force with a greater rate constant, because θon is proportional to the number of regulatory units with at least one bound myosin, whereas the force is directly proportional to the number of attached myosin molecules. In our study, such a discrepancy in rate constants was found for the sixth ALL, and to a much lesser extent for the second ALL. In light of the large size of the regulatory unit and the similarity of rate constants between the force and the second ALL, one cannot completely rule out the possibility that the observed intensity change of the second ALL (at least the myosin-induced part) reported the passive movement of tropomyosin segments as they were pushed aside by the binding myosin heads.
Conclusions
In this study, the activation-associated intensity changes of thin filament-based reflections were analyzed in skinned-rabbit fibers by means of fast two-dimensional x-ray diffraction recordings. Calcium-induced and myosin-induced components were resolved in both the second and sixth ALLs. The calcium-induced component had rate constants of more than 100 s−1, but these were substantially slower than the value reported for calcium binding to troponin C (530 s−1). Thus the calcium-induced component may represent some major conformational changes after the calcium-binding step. The myosin-induced component for the second ALL (reporting tropomyosin movement) had a rate constant close to that of force development, but the component for the sixth ALL (reporting actin structural change) had a rate constant substantially greater than that. This large rate constant is in accordance with a large unit size of cooperative activation of thin filaments, as proposed recently (48–50). As for the troponin reflections, our results suggest that the behavior of these reflections may differ from that in living frog muscle. It is worth repeating these measurements under optimized recording conditions, to improve the spatial resolution at low-angle regions.
Acknowledgments
We thank Dr. T. Fujisawa for his help with the BL45XU beamline at SPring-8. These experiments were performed with the approval of the SPring-8 Proposal Review Committee (2003A0185-NL2-np, 2003B0188-NL2a-np, 2004A0585-NL2a-np, 2005A0117-NL2a-np, and 2005B0267).
This work was supported by the SPring-8 Joint Research Promotion Scheme of the Japanese Science and Technology Corporation, and by Special Coordination Funds of the Ministry of Education, Culture, Sports, Science, and Technology of Japan.
Footnotes
Takumi Tamura's present address is Godo Shusei Co. Ltd., Matsudo, Chiba 271-0064, Japan.
Jun'ichi Wakayama's present address is the Nano-Biotechnology Laboratory, National Food Research Institute, Ibaraki 305-8642, Japan.
References
- 1.Ebashi S., Endo M. Calcium and muscle contraction. Prog. Biophys. Mol. Biol. 1968;18:123–183. doi: 10.1016/0079-6107(68)90023-0. [DOI] [PubMed] [Google Scholar]
- 2.Gordon A.M., Homsher E., Regnier M. Regulation of contraction in striated muscle. Physiol. Rev. 2000;80:853–924. doi: 10.1152/physrev.2000.80.2.853. [DOI] [PubMed] [Google Scholar]
- 3.Iwamoto H. Physiological consequences of thin filament cooperativity for vertebrate striated muscle contraction: a theoretical study. J. Muscle Res. Cell Motil. 2006;27:21–35. doi: 10.1007/s10974-005-9049-y. [DOI] [PubMed] [Google Scholar]
- 4.Lehrer S.S., Morris E.P. Dual effects of tropomyosin and troponin-tropomyosin on actomyosin subfragment-1 ATPase. J. Biol. Chem. 1982;257:8073–8080. [PubMed] [Google Scholar]
- 5.Bremel R.D., Weber A. Cooperation within actin filament in vertebrate skeletal muscle. Nat. New Biol. 1972;238:97–101. doi: 10.1038/newbio238097a0. [DOI] [PubMed] [Google Scholar]
- 6.Greene L.E., Eisenberg E. Cooperative binding of myosin subfragment-1 to the actin-troponin-tropomyosin complex. Proc. Natl. Acad. Sci. USA. 1980;77:2616–2620. doi: 10.1073/pnas.77.5.2616. [DOI] [PMC free article] [PubMed] [Google Scholar]
- 7.Huxley H.E. Structural changes in the actin- and myosin-containing filaments during contraction. Cold Spring Harb. Symp. Quant. Biol. 1973;37:361–376. [Google Scholar]
- 8.Parry D.A.D., Squire J.M. Structural role of tropomyosin in muscle regulation: analysis of the x-ray diffraction patterns from relaxed and contracting muscles. J. Mol. Biol. 1973;75:33–55. doi: 10.1016/0022-2836(73)90527-5. [DOI] [PubMed] [Google Scholar]
- 9.Maeda Y., Popp D., Stewart A.A. Time-resolved x-ray diffraction study of the troponin-associated reflections from the frog muscle. Biophys. J. 1992;63:815–822. doi: 10.1016/S0006-3495(92)81648-X. [DOI] [PMC free article] [PubMed] [Google Scholar]
- 10.Martin-Fernandez M.L., Bordas J., Diakun G., Lowy J., Mant G.R. Time-resolved x-ray diffraction studies of myosin head movements in live frog sartorius muscle during isometric and isotonic contractions. J. Muscle Res. Cell Motil. 1994;15:319–348. doi: 10.1007/BF00123484. [DOI] [PubMed] [Google Scholar]
- 11.Yagi N. An x-ray diffraction study on early structural changes in skeletal muscle contraction. Biophys. J. 2003;84:1093–1102. doi: 10.1016/S0006-3495(03)74925-X. [DOI] [PMC free article] [PubMed] [Google Scholar]
- 12.Yagi N. A structural origin of latency relaxation in frog skeletal muscle. Biophys. J. 2007;92:162–171. doi: 10.1529/biophysj.106.090696. [DOI] [PMC free article] [PubMed] [Google Scholar]
- 13.Sugimoto Y., Takezawa Y., Matsuo T., Ueno Y., Minakata S. Structural changes of the regulatory proteins bound to the thin filaments in skeletal muscle contraction by x-ray fiber diffraction. Biochem. Biophys. Res. Commun. 2008;369:100–108. doi: 10.1016/j.bbrc.2007.11.088. [DOI] [PubMed] [Google Scholar]
- 14.Matsuo T., Yagi N. Structural changes in the muscle thin filament during contractions caused by single and double electrical pulses. J. Mol. Biol. 2008;383:1019–1036. doi: 10.1016/j.jmb.2008.09.007. [DOI] [PubMed] [Google Scholar]
- 15.Wakabayashi K., Ueno Y., Amemiya Y., Tanaka H. Intensity changes of actin-based layer lines from frog skeletal muscles during an isometric contraction. Adv. Exp. Med. Biol. 1988;226:353–367. [PubMed] [Google Scholar]
- 16.Yagi N., Matsubara I. Changes in the 5.9 nm actin layer-line on activation of frog skeletal muscles. Adv. Exp. Med. Biol. 1988;226:369–380. [PubMed] [Google Scholar]
- 17.Iwamoto H., Wakayama J., Fujisawa T., Yagi N. Static and dynamic x-ray diffraction recordings from living mammalian and amphibian skeletal muscles. Biophys. J. 2003;85:2492–2506. doi: 10.1016/s0006-3495(03)74672-4. [DOI] [PMC free article] [PubMed] [Google Scholar]
- 18.Miki M., Iio T. Kinetics of structural changes of reconstituted skeletal muscle thin filaments observed by fluorescence resonance energy transfer. J. Biol. Chem. 1993;268:7101–7106. [PubMed] [Google Scholar]
- 19.Claflin D.R., Morgan D.L., Stephenson D.G., Julian F.J. The intracellular Ca2+ transient and tension in frog skeletal muscle fibres measured with high temporal resolution. J. Physiol. 1994;475:319–325. doi: 10.1113/jphysiol.1994.sp020072. [DOI] [PMC free article] [PubMed] [Google Scholar]
- 20.Inoue K., Oka T., Suzuki T., Yagi N., Takeshita K. Present status of high flux beamline (BL40XU) at SPring-8. Nucl. Instrum. Methods Phys. Res. A. 2001;467:674–677. [Google Scholar]
- 21.Ellis-Davies G.C.R., Kaplan J.H. Nitrophenyl-EGTA, a photolabile chelator that selectively binds Ca2+ with high-affinity and releases it rapidly upon photolysis. Proc. Natl. Acad. Sci. USA. 1994;91:187–191. doi: 10.1073/pnas.91.1.187. [DOI] [PMC free article] [PubMed] [Google Scholar]
- 22.Ellis-Davies G.C.R., Kaplan J.H., Barsotti R.J. Laser photolysis of caged calcium: rates of calcium release by nitrophenyl EGTA and DM-nitrophen. Biophys. J. 1996;70:1006–1016. doi: 10.1016/S0006-3495(96)79644-3. [DOI] [PMC free article] [PubMed] [Google Scholar]
- 23.Tamura T., Wakayama J., Yagi N., Iwamoto H. Behavior of thin-filament-based x-ray reflections from skeletal muscle fibers during force development. Biophys. J. 2004;86:218a. (Abstr.) [Google Scholar]
- 24.Iwamoto H. Strain sensitivity and turnover rate of low force cross-bridges in contracting skeletal muscle fibers in the presence of phosphate. Biophys. J. 1995;68:243–250. doi: 10.1016/S0006-3495(95)80180-3. [DOI] [PMC free article] [PubMed] [Google Scholar]
- 25.Iwamoto H. Thin filament cooperativity as a major determinant of shortening velocity in skeletal muscle fibers. Biophys. J. 1998;74:1452–1464. doi: 10.1016/S0006-3495(98)77857-9. [DOI] [PMC free article] [PubMed] [Google Scholar]
- 26.Iwamoto H. Effect of a cardiotonic agent, MCI-154, on the contractile properties of skinned skeletal muscle fibers. Eur. J. Pharmacol. 1998;341:243–252. doi: 10.1016/s0014-2999(97)01469-6. [DOI] [PubMed] [Google Scholar]
- 27.Wakayama J., Tamura T., Yagi N., Iwamoto H. Structural transients of contractile proteins upon sudden ATP liberation in skeletal muscle fibers. Biophys. J. 2004;87:430–441. doi: 10.1529/biophysj.103.035063. [DOI] [PMC free article] [PubMed] [Google Scholar]
- 28.Iwamoto H. Evidence for increased low force cross-bridge population in shortening skinned skeletal muscle fibers: implications for actomyosin kinetics. Biophys. J. 1995;69:1022–1035. doi: 10.1016/S0006-3495(95)79977-5. [DOI] [PMC free article] [PubMed] [Google Scholar]
- 29.Iwamoto H. Influence of ionic strength on the actomyosin reaction steps in contracting skeletal muscle fibers. Biophys. J. 2000;78:3138–3149. doi: 10.1016/S0006-3495(00)76850-0. [DOI] [PMC free article] [PubMed] [Google Scholar]
- 30.Fujisawa T., Inoue K., Oka T., Iwamoto H., Uruga T. Small-angle x-ray scattering station at the SPring-8 RIKEN beamline. J. Appl. Cryst. 2000;33:797–800. [Google Scholar]
- 31.Iwamoto H., Oiwa K., Suzuki T., Fujisawa T. X-ray diffraction evidence for the lack of stereospecific protein interactions in highly activated actomyosin complex. J. Mol. Biol. 2001;305:863–874. doi: 10.1006/jmbi.2000.4334. [DOI] [PubMed] [Google Scholar]
- 32.Iwamoto H., Oiwa K., Suzuki T., Fujisawa T. States of thin filament regulatory proteins as revealed by combined cross-linking/x-ray diffraction techniques. J. Mol. Biol. 2002;317:707–720. doi: 10.1006/jmbi.2002.5449. [DOI] [PubMed] [Google Scholar]
- 33.Tsaturyan A.K. Diffraction by partially occupied helices. Acta Crystallogr. A. 2002;58:292–294. doi: 10.1107/s0108767302001307. [DOI] [PubMed] [Google Scholar]
- 34.Koubassova N.A., Tsaturyan A.K. Direct modeling of x-ray diffraction pattern from skeletal muscle in rigor. Biophys. J. 2002;83:1082–1097. doi: 10.1016/S0006-3495(02)75232-6. [DOI] [PMC free article] [PubMed] [Google Scholar]
- 35.Tamura T., Wakayama J., Fujisawa T., Yagi N., Iwamoto H. Intensity of x-ray reflections from skeletal muscle thin filaments partially occupied with myosin heads: effect of cooperative binding. J. Muscle Res. Cell Motil. 2004;25:329–335. doi: 10.1007/s10974-004-6061-6. [DOI] [PubMed] [Google Scholar]
- 36.Kraft T., Xu S., Brenner B., Yu L.C. The effect of thin filament activation on the attachment of weak binding cross-bridges: a two-dimensional x-ray diffraction study on single muscle fibers. Biophys. J. 1999;76:1494–1513. doi: 10.1016/S0006-3495(99)77309-1. [DOI] [PMC free article] [PubMed] [Google Scholar]
- 37.Kress M., Huxley H.E., Faruqi A.R., Hendrix J. Structural changes during activation of frog muscle by time-resolved x-ray diffraction. J. Mol. Biol. 1986;188:325–342. doi: 10.1016/0022-2836(86)90158-0. [DOI] [PubMed] [Google Scholar]
- 38.Popp D., Maeda Y., Stewart A.A.E., Holmes K.C. X-ray diffraction studies on muscle regulation. Adv. Biophys. 1991;27:89–103. doi: 10.1016/0065-227x(91)90010-b. [DOI] [PubMed] [Google Scholar]
- 39.Vibert P., Craig R., Lehman W. Steric-model for activation of muscle thin filaments. J. Mol. Biol. 1997;266:8–14. doi: 10.1006/jmbi.1996.0800. [DOI] [PubMed] [Google Scholar]
- 40.Takeda S., Yamashita A., Maeda K., Maeda Y. Structure of the core domain of human cardiac troponin in the Ca2+-saturated form. Nature. 2003;424:35–41. doi: 10.1038/nature01780. [DOI] [PubMed] [Google Scholar]
- 41.Narita A., Yasunaga T., Ishikawa T., Mayanagi K., Wakabayashi T. Ca2+-induced switching of troponin and tropomyosin on actin filaments as revealed by electron cryo-microscopy. J. Mol. Biol. 2001;308:241–261. doi: 10.1006/jmbi.2001.4598. [DOI] [PubMed] [Google Scholar]
- 42.Murakami K., Yumoto F., Ohki S., Yasunaga T., Tanokura M. Structural basis for Ca2+-regulated muscle relaxation at interaction sites of troponin with actin and tropomyosin. J. Mol. Biol. 2005;352:178–201. doi: 10.1016/j.jmb.2005.06.067. [DOI] [PubMed] [Google Scholar]
- 43.Solzin J., Iorga B., Sierakowski E., Alcazar D.P.G., Ruess D.F. Kinetic mechanism of the Ca2+-dependent switch-on and switch-off of cardiac troponin in myofibrils. Biophys. J. 2007;93:3917–3931. doi: 10.1529/biophysj.107.111146. [DOI] [PMC free article] [PubMed] [Google Scholar]
- 44.Bell M.G., Lankford E.B., Gonye G.E., Ellis-Davies G.C.R., Martyn D.A. Kinetics of cardiac thin-filament activation probed by fluorescence polarization of rhodamine-labeled troponin C in skinned guinea pig trabeculae. Biophys. J. 2006;90:531–543. doi: 10.1529/biophysj.105.072769. [DOI] [PMC free article] [PubMed] [Google Scholar]
- 45.McKillop D.F.A., Geeves M.A. Regulation of the interaction between actin and myosin subfragment 1: evidence for three states of the thin filament. Biophys. J. 1993;65:693–701. doi: 10.1016/S0006-3495(93)81110-X. [DOI] [PMC free article] [PubMed] [Google Scholar]
- 46.Orlova A., Egelman E.H. Cooperative rigor binding of myosin to actin is a function of F-actin structure. J. Mol. Biol. 1997;265:469–474. doi: 10.1006/jmbi.1996.0761. [DOI] [PubMed] [Google Scholar]
- 47.Siddique M.S.P., Mogami G., Miyazaki T., Katayama E., Uyeda T.Q.P. Cooperative structural change of actin filaments interacting with activated myosin motor domain, detected with copolymers of pyrene-labeled actin and acto-S1 chimera protein. Biochem. Biophys. Res. Commun. 2005;337:1185–1191. doi: 10.1016/j.bbrc.2005.09.159. [DOI] [PubMed] [Google Scholar]
- 48.Brandt P.W., Diamond M.S., Rutchik J.S., Schachat F.H. Co-operative interactions between troponin-tropomyosin units extend the length of the thin filament in skeletal muscle. J. Mol. Biol. 1987;195:885–896. doi: 10.1016/0022-2836(87)90492-x. [DOI] [PubMed] [Google Scholar]
- 49.Geeves M.A., Lehrer S.S. Dynamics of the muscle thin filament regulatory switch: the size of the cooperative unit. Biophys. J. 1994;67:273–282. doi: 10.1016/S0006-3495(94)80478-3. [DOI] [PMC free article] [PubMed] [Google Scholar]
- 50.Smith D.A., Geeves M.A. Cooperative regulation of myosin-actin interactions by a continuous flexible chain II: actin-tropomyosin-troponin and regulation by calcium. Biophys. J. 2003;84:3168–3180. doi: 10.1016/S0006-3495(03)70041-1. [DOI] [PMC free article] [PubMed] [Google Scholar]
- 51.Granzier H.L.M., Wang K. Passive tension and stiffness of vertebrate skeletal and insect flight muscles: the contribution of weak cross-bridges and elastic filaments. Biophys. J. 1993;65:2141–2159. doi: 10.1016/S0006-3495(93)81262-1. [DOI] [PMC free article] [PubMed] [Google Scholar]