

Abstract
Key biological and nano-technological processes require the partial or complete association and dissociation of complementary DNA strands. We present a variant of the Poland-Scheraga model for DNA melting where we introduce a local, sequence-dependent salt correction of the nearest-neighbor parameters. Furthermore, our formulation accounts for capping and interfacial energies of helical and coiled chain sections. We show that the model reproduces experimental data for melting temperatures over the full experimental range of strand length, strand concentration, and ionic strength of the solution. In particular, we reproduce a phenomenological relation by Frank-Kamenetskii for very long chains using a parameterization based on melting curves for short oligomers. However, we also show that the parameters of the Poland-Scheraga model are still not known with sufficient precision to quantitatively predict the fine structure of melting curves. This formulation of the Poland-Scheraga model opens the possibility to overcome this limitation by optimizing parameters with respect to an extended base of experimental data for short-, medium-, and long-chain melting. We argue that the often-discarded melting data for longer oligomers exhibiting non-two-state transitions could play a particularly important role.
Introduction
A quantitative understanding of basepairing and opening of the double-helix in DNA or RNA strands is relevant for many fundamental biological processes like transcription, replication (1), or RNA folding (2) and interference (3), as well as bio- and nanotechnological applications like DNA chips (4), DNA self-assembly (5) or guided nano-assembly of colloidal nanoparticles with DNA linkers (6,7). There are two standard theoretical descriptions of DNA thermal denaturation: the nearest-neighbor (NN) model quantitatively describes the melting of short oligonucleotides (8–10), which exhibit a two-state transition from a fully paired, double-helical complex to two separated single strands with random coil conformations; and the Poland-Scheraga (PS) model of polynucleotide melting (11,12) describes longer chains on the secondary structure level as an alternating sequence of double-stranded (helical) parts and (coiled) loops. The NN- and the PS-model have been employed routinely for several decades to describe a large variety of DNA- and RNA melting experiments, and the same formalism is widely used to investigate RNA folding (13,14). A possible point of criticism is the large number of adjustable parameters, which makes it (too) easy to fit individual sets of experiments. Not surprisingly, much effort has been devoted to the comparison of parameters extracted from different systems. Ten years ago, SantaLucia concluded, “A unified set of NN-parameters is now available for making accurate predictions of DNA oligo- and polymer thermodynamics” (10).
However, the compilation of results in SantaLucia (10) also shows a large number of unrelated boundary terms and salt corrections to be used in different limits. Furthermore, the available descriptions were limited to two-state melting transitions of short oligomers and to stepwise melting of long polymers, i.e., to the limit where DNA denaturation becomes independent of the DNA concentration in the sample. The situation is more complicated for longer oligomers exhibiting partial internal melting before strand separation. Recent experiments of Zeng et al. (15) and Zeng and Zocchi (16) have shed some doubts on the applicability of the standard formalism in this biologically (3,17) and technologically (4,5) important limit.
In this article, we present a unified PS like model covering the full experimental range of chain lengths, strand, and salt concentrations and compare its predictions to available experimental data. In the first section, we augment a recent, unified formulation for oligomer and polymer melting (18) by a systematic extension of oligomer salt corrections (19) to the longer chains limit. Furthermore, we pay particular attention to the estimation of confidence limits on model predictions, illustrated here for a parameterization of the model, which is essentially based on published data for oligomer melting. In a second section, we discuss the generic behavior of the model, i.e., the influence of variations of strands and ionic concentrations on the result of melting experiments for DNA duplexes of different length. The following quantitative comparison to experiment data shows that the model reproduces experimental data from short oligomers to long DNA polymers. This includes the controversial non-two-state melting of long oligomers where, however, the uncertainty of the predictions becomes particularly large. We conclude that experiments along the lines of Zeng et al. (15) and Zeng and Zocchi (16) could play an important role in future attempts to improve the parameterization.
Model and Methods
Association equilibria and internal melting
We treat a complex AB in equilibrium with two strands A and B, each consisting of N basepairs (bps). For the association equilibrium A + B ↔ AB between bound and unbound states, we can write the law of mass action
| (1) |
where c0 is a reference concentration (usually c0 = 1 M), cA, cB, and cAB are, respectively, the concentration of A, B, and AB, and
| (2) |
is the Gibbs free energy difference between the bound and unbound forms at the reference concentration. ΔG0 depends on both, the internal free energy difference, ΔGint = GABint – GAint – GBint, and the difference of the mixing entropies with the solvent ΔG0mix. For chains of length N the latter can be estimated as ΔGmix0 = −kBT log(0.44(N − 1)) (see (18) and Appendix A of this article).
From Eq. 1 and using the definitions of the total, strand, and complex concentrations which are related via cT = cA(T) + cB(T) + 2cAB(T), cA(T) = cB(T) = (1 – Θext(T))cT/2 and cAB(T) = Θext(T) cT/2, we can derive the degree of association Θext(cT, T) (20)
| (3) |
with (α = 4 for self-similarity strand A = B, otherwise α = 1).
Internal hybridization of the complex and the individual strands can be described in terms of the fraction Θint(T) of bound basepair steps as a function of temperature. Here we assume that only the complex can form double-helical sections, hence, the experimentally observable overall fraction of bound basepair steps (see note below Eq. 4) is given by
| (4) |
(Note that experimental data used in this article for Θ are UV absorbance data. Typically, optical absorbance curves exhibit a linear increase in the pre- and post-transition regimes due, respectively, to a slight elevation in the average stacking of the double-stranded DNA and to the unstacking of bases in the single strands (21). The Θ-curves are obtained from a normalization of the absorbance data (22) that deletes these linear contributions.)
Unified Poland-Scheraga model
To proceed, we need to determine the free energy ΔGint, as well as the degree of pairing Θint(T) from a statistical mechanical description of single- and double-stranded DNA. In this article, we employ a recent formulation (18) of the PS model with a direct mapping to a lattice model.
The PS model describes DNA at the secondary structure level as a sequence of double-stranded sections and denatured loop- or end-domains. We write the association free energy in the double-stranded regions in the so-called “doublet format” (21) as a sum over sequence-dependent nearest-neighbor pair formation free energies ΔgNN(T) = ΔhNN – TΔsNN for the 10 different basepair steps. Furthermore, our description includes boundary terms. We consider two different capping energies ωA/T and ωG/C for double-stranded chain ends with ω(T) ≡ Δhω – T Δsω as well as cooperativity factors σ and suppressing the opening of loop and end domains respectively.
In Fig. 1, we show the contributions of the different free energies to the total partition function of the system. The reference state is the helical state (Zhelix = 1). Therefore, the contribution of an internal loop (size n) is and the contribution of a free end (size ) is . Here, n–c and account for, respectively, the number of self-avoiding polygons of length 2n and the number of possible conformations for a free end of length . The values c and c′ take into account the steric interactions in the loops and in the free ends. The values of c and c′ have to be derived from polymer theory. The parameter c has been extensively discussed (11,22–25) and is equal to 1.764 for noninteracting self-avoiding loops and 2.15 for interacting self-avoiding loops. The value of c′ is equal to 0.16 (26,27). The total partition function is the product of the different partial partition functions. Here we only consider the formation of native contacts in double-stranded DNA, but the general case can be discussed in the same framework (28,29). Furthermore, it is possible to treat secondary-structure formation in DNA or RNA single strands using the same formalism (13,14).
Figure 1.
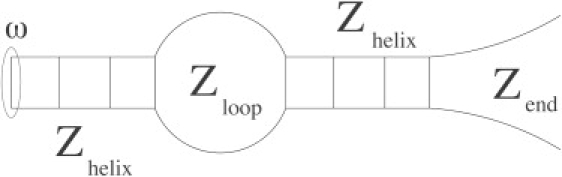
Example of a secondary structure, definition of the different contributions in the partition function. Zhelix is the contribution of an helical stem, Zloop is the contribution of an internal loop of size n, and Zend is the contribution for a free end of size . The term ω refers to the capping free energy. The total partition function is the product Z = exp(−βω)ZhelixZloopZhelixZend.
The PS model can be solved using dynamic algorithms based on recursion relations (11,12,28,29). In Appendix B, we show how the method proposed by Garel and Orland (29) for the calculation of partition functions and free energies can be adapted to the doublet format. Use of the Fixman-Freire algorithm (29,30) substantially accelerated the calculations.
Parameters and confidence limits
Despite the large number of adjustable parameters (10 ΔhNN, 10 ΔsNN, 2 Δhω, 2 Δsω, σ, and ), the PS model clearly represents a drastic simplification of the true problem. The key assumption is that all nongeneric contributions to the melting free energy difference can be written as a sum of independent basepairs contributions. Furthermore, it is common to only partially consider the sequence dependence of the boundary terms. For example, since the 5′ and 3′ of the sugar-phosphate backbone are chemically different (with correspondingly modified solvation and stacking effects, etc.) there is no reason to expect identical free energy penalties for 5′ – A/3′ – T and 5′ – T/3′ – A ends as well as for 5′ – G/3′ – C and 5′ – C/3′ – G ends. Similarly, one would, in general, expect sequence- and salt-dependent forking energies; yet the available experimental data does not allow us to determine these values reliably. In general, the basic assumptions and ad hoc choices can only be corrected or justified a posteriori by evaluating the success of the model in describing (and even more importantly) predicting the results of experiments (10,21,31). Some care has thus to be taken in estimating parameter values and the associated confidence limits from comparisons to experimental data. In this article we use Monte Carlo methods (32) to account for the propagation of these errors in the calculation of model predictions, i.e., results are calculated for (and averaged over) an ensemble of models with parameters drawn from a multidimensional Gaussian distribution defined by the mean values and the covariance matrix resulting from the parameter fits.
Nearest-neighbor parameters
Short oligomers exhibiting a two-state melting transition can be used to determine the association and capping free energies. In the NN-model, , where ΔgNN and Δgini are pair formation and initiation NN-parameters (10). In the unified PS-model, . Equating the two expressions yields ω(T) = Δhini – T(Δsini – ΔS0mix/2), where ΔS0mix = 1.5 kB accounts for the mixing entropy of oligomers at a typical size of 10 bps used in experiments employed for parameterizing the NN-model (an arbitrary standard deviation of 30% is assumed for ΔS0mix). The corresponding total of 24 relevant parameters in the limit of short oligomers undergoing two-state melting (10 ΔhNN, 10 ΔsNN, 2 Δhini = Δhω, 2 and Δsini = Δsω + ΔS0mix/2) corresponds to the number of independent parameters, which can be determined uniquely from the corresponding experiments (31,33–35).
Correlations between NN-parameters are not negligible (correlation between ΔhNN and ΔsNN approaches 99% for a given basepair step). To have access to the covariance matrix, we repeated the analysis of Allawi and SantaLucia (33) (singular value decomposition (32) and of error evaluation via the Bootstrap method (36)), which consists in optimizing the melting temperatures prediction for short two-state oligomers, using the same experimental data. Our results (Table 1) slightly deviate from Allawi's values due to the larger number of resampling trials carried out (>100,000, compared to 30 in Allawi and SantaLucia (33)).
Table 1.
Unified PS parameters and their standard deviations in a 1 M [Na+]-buffer
| Sequence | Δh (kcal/mol) | Δs (cal/mol/K) |
|---|---|---|
| AA/TT | −7.93 ± 0.31 | −22.4 ± 1.0 |
| AT/TA | −7.15 ± 0.78 | −20.2 ± 2.6 |
| TA/AT | −7.23 ± 0.82 | −21.6 ± 2.7 |
| CA/GT | −8.44 ± 0.77 | −22.9 ± 2.5 |
| GT/CA | −8.47 ± 0.66 | −22.9 ± 2.2 |
| CT/GA | −7.73 ± 0.66 | −20.9 ± 2.2 |
| GA/CT | −8.29 ± 0.61 | −22.6 ± 2.0 |
| CG/GC | −10.54 ± 0.82 | −27.1 ± 2.7 |
| GC/CG | −9.81 ± 0.73 | −24.6 ± 2.4 |
| GG/CC | −8.02 ± 0.68 | −19.6 ± 2.3 |
| Cap with G/C | 0.08 ± 0.99 | −3.7 ± 3.4 |
| Cap with A/T | 2.22 ± 1.02 | 2.8 ± 3.3 |
| Log σ | −9.0 ± 2.7 | |
| Log | −5.7 ± 1.4 | |
| γS (cal/mol/K) | −8.9 ± 2.7 | |
| ΔS0mix (cal/mol/K) | 3.0 ± 0.9 | |
| Ks1 (K−1) | (4.29 ± 0.29) × 10−5 | |
| Ks2 (K−1) | (−3.95 ± 0.16) × 10−5 | |
| Ks3 (K−1) | (9.4 ± 0.29) × 10−6 | |
Salt correction
Experimental observations (19) show that changing the salt concentration from 1 M to 100 mM shifts the melting temperature by ∼10 K. These variations are described by a number of phenomenological salt corrections that are different for short oligomers and polymers (10,19). A systematic, statistical-mechanical approach should derive the observed melting temperatures from a model with salt-dependent parameters. Given that DNA is a highly charged molecule, such a dependence is not surprising and is formally the result of integrating out microscopic degrees of freedom of the DNA along with those of the solvent molecules and salt ions.
The correction most used in bioinformatics programs (DINAmelt (37), MELTING (38)) is the one given by SantaLucia (10) for oligomer NN-parameters:
| (5) |
This correction is sequence-independent, while Owczarzy et al. (19) have recently shown that the melting temperatures of oligomers undergoing two-state melting follow the phenomenological rule
| (6) |
where Ks1, Ks2, and Ks3 are empirical numbers of the same order (see Table 1) and f(GC) is the GC content of the sequence. Equation 6 cannot be used directly for our purposes. To infer the salt-dependence of the local NN-parameters ΔhNN and ΔsNN we proceed in two steps: firstly, we follow the literature (39,40) and assume that the complexation enthalpy is independent of salt-concentration. In contrast, the gain in mixing entropy of counterions released from molten chain sections does depend on the salt concentration (41,42). With
| (7) |
for two-state melting, we can rewrite Eq. 6 in the form
| (8) |
Secondly, instead of applying Eq. 8 to the whole sequence, we use the local GC content fl(GC) of a basepair step. This results in a correction of the form
| (9) |
for the NN-pair formation and capping entropies. We have checked that our results do not change significantly if larger environments up to 5 bps are taken into account for calculating fl(GC). Typical values of δs([Na+]) ≡ Δs([Na+]) – Δs(1 M) for the different basepairs are reported in Table 2. Note that the fits of the salt correction parameters and of the NN-parameters have been realized separately. Correlations between Ks1, Ks2, and Ks3 exist and are considered in the error propagation analysis.
Table 2.
Salt correction from Eq. 9
|
δs([Na+]) (cal/mol/K) |
||||
|---|---|---|---|---|
| Sequence | 0.01 M | 0.05 M | 0.1 M | 0.5 M |
| AA/TT | 3.0 ± 0.2 | 1.6 ± 0.1 | 1.1 ± 0.05 | 0.3 ± 0.01 |
| AT/TA | 2.7 ± 0.3 | 1.5 ± 0.2 | 1.0 ± 0.1 | 0.2 ± 0.03 |
| TA/AT | 2.8 ± 0.3 | 1.5 ± 0.2 | 1.0 ± 0.1 | 0.2 ± 0.03 |
| CA/GT | 2.4 ± 0.2 | 1.2 ± 0.1 | 0.8 ± 0.1 | 0.1 ± 0.02 |
| GT/CA | 2.4 ± 0.2 | 1.2 ± 0.1 | 0.8 ± 0.05 | 0.1 ± 0.02 |
| CT/GA | 2.2 ± 0.2 | 1.1 ± 0.1 | 0.7 ± 0.05 | 0.1 ± 0.02 |
| GA/CT | 2.3 ± 0.2 | 1.1 ± 0.1 | 0.8 ± 0.05 | 0.1 ± 0.02 |
| CG/GC | 1.9 ± 0.2 | 0.8 ± 0.1 | 0.4 ± 0.05 | 0.0 ± 0.02 |
| GC/CG | 1.8 ± 0.2 | 0.7 ± 0.1 | 0.4 ± 0.05 | 0.0 ± 0.02 |
| GG/CC | 1.5 ± 0.2 | 0.6 ± 0.1 | 0.3 ± 0.05 | 0.0 ± 0.02 |
| Cap with G/C | 0.0 ± 0.2 | 0.0 ± 0.1 | 0.0 ± 0.05 | 0.0 ± 0.01 |
| Cap with A/T | 0.8 ± 0.4 | 0.5 ± 0.2 | 0.3 ± 0.1 | 0.0 ± 0.03 |
Cooperativity
There is no a priori reason why the cooperativity parameters should not have an enthalpic contribution, or why they should be independent of DNA sequence and of the salt concentration. To date, the interfacial parameters σ and are not known with sufficient precision. The cooperativity σ is in the range 10−4−10−5 (24,25,29,43) corresponding to a loop nucleation free energy 2γ ≡ −kBT log σ ≡ −2γST of ∼10 kBT. The bare free-end formation parameter is of course correlated to σ (with the opening of a free-end there is a creation of one interface whereas, with a loop, two interfaces appear) and . In the following, we assume . The numerical values of the different parameters are listed in Table 1. The lack of data concerning σ forces us to assume an high arbitrary standard deviation of 30% for log σ and to neglect possible correlations between σ and NN-parameters.
Generic melting behavior
The generic behavior of the model is shown in Fig. 2 for random sequences (f(GC) = 0.5) of different lengths (N = 10, 50, 500, or 50,000). In the two columns of the figure, we compare the evolution of the hybridization observable −dΘ/dT as a function of the strand concentration cT and the ionic strength of the [Na+]-buffer.
Figure 2.
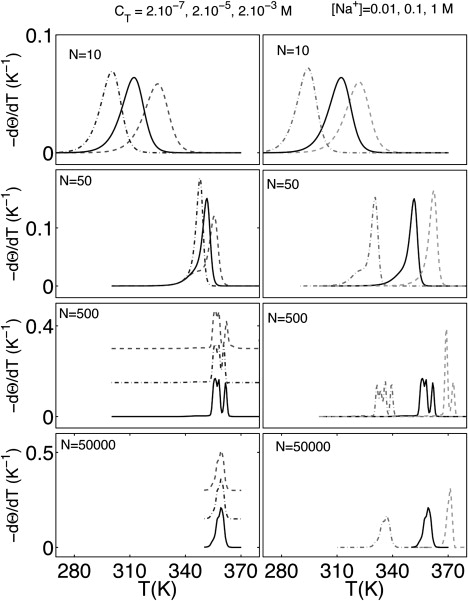
−dΘ/dT versus T for different random sequences (f(GC) = 0.5): N = 10 (first line), N = 50 (second line), N = 500 (third line), and N = 50,000 (fourth line). (Left) [Na+] = 0.1 M and cT = 2 × 10⁻³ M (dashed lines), cT = 2 × 10⁻⁵ M (solid lines), and cT = 2 × 10⁻⁷ M (dotted and dashed lines). (Right) cT = 2 × 10⁻⁵ M and [Na+] = 1 M (dashed lines), [Na+] = 0.1 M (solid lines), and [Na+] = 0.01 M (dotted and dashed lines).
Oligomer melting curves (N = 10, 50) show one or two peaks. The height and width of the main peak are related to the chain length. For short oligomers, the transition occurs in a temperature interval of ∼40 K and centers around physiological temperatures (310 K). Melting curves for short- (N = 500) and medium-sized DNA polymers exhibit several peaks due to successive domain opening. For very long chains (N = 50,000), −dΘ/dT becomes again featureless due to the superposition of large numbers of simultaneously occurring domain-melting events.
The strand concentration cT has a strong influence on oligomer hybridization, but has negligible effects for long chains. Generally, larger concentrations reduce the single-strand gain in mixing entropy and stabilize the complex. The relative importance of the strand translational entropy is highest for short chains at low concentrations resulting in two-state transitions. For longer oligomers and higher concentrations, internal melting competes with strand dissociation, and the two-state character of the transition is lost.
Variation of the salt concentration leads to comparable shifts of melting curves in all length regimes, and only to small changes in curve shapes. Low concentrations tend to stabilize bubbles and single strands (due to the decreasing screening effect of counterions (19,42)). Closer inspection reveals effects of the sequence-dependence of the salt correction (shown in Eq. 9). Lower salt concentrations tend to favor the partial opening of AT-rich domains like TATA boxes (promoter region in eukaryote genes and transcription initiator (44)).
Quantitative Comparison To Experiment—Predictive Power
In the following, we compare available experimental data to the predictions of the model. Good agreement for the short oligomers used for the parameterization is to be expected, but not trivial: the experimentally observed two-state melting behavior (i.e., the irrelevance of fluctuations) has to be a property of the correctly parameterized model including fluctuations. The following comparisons for long polymers and intermediate chain lengths constitute true tests of the predictive power of the model, since the experimental data was not used for the parameterization.
Short oligomers (∼10 bps)
The average error in the predicted melting temperatures
| (10) |
for the data sets from the literature (19,33) that we used for the parameterization is 〈ΔTm〉 = 1.7 K (compared to 〈ΔTm〉 = 2.4 K using Eq. 5 for the salt correction and to the average experimental error of 0.3 K). The more detailed comparison of calculated and experimental melting temperatures in Fig. 3 shows that there are no preferred salt or strand concentrations over the entire experimentally available range of [Na+] ∈ [0.01 M, 1 M] and cT ∈ [3.7 × 10⁻⁶ M, 6.3 × 10⁻⁴ M]: all data points are uniformly aggregated along the bisectors with error estimates corresponding to the typical deviation from the experimental value. Moreover, the two-state behavior of the transition can be shown by evaluating the maximum Σmax of Σ = Θext – Θ (15). If the sequence presents a two-state transition, Θext = Θ or Σmax = 0 (Fig. 4). Note that the comparison is made to the full model including fluctuations, which were neglected for the parameterization. Thus, the model properly reproduces the experimental observation of two-state melting for the sequences in question. Neglecting the cooperativity factors would lead to drastically different results (18).
Figure 3.
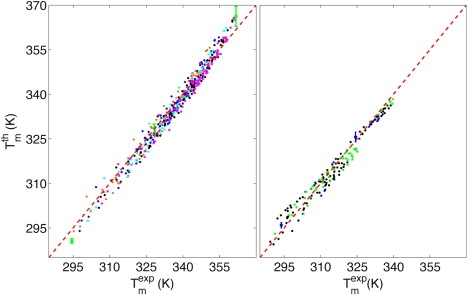
Calculated melting temperatures Tmth as a function of the experimental ones Tmexp for (left) 92 sequences from Owczarzy et al. (19) at five different salt concentrations (cT = 2 × 10⁻⁶ M): 69 mM (orange), 119 mM (blue), 220 mM (cyan), 621 mM (black), and 1.02 M (violet) (green dots are representative of the standard deviations); and for (right) 20 sequences from SantaLucia et al. (53) at various strand concentrations ([Na+] = 1 M): cT ∈ [3.65 × 10⁻⁶, 10−5] (blue), cT ∈ [10−5, 10−4] (black), and cT ∈ [10−4, 6.32 × 10⁻⁴] (green).
Figure 4.
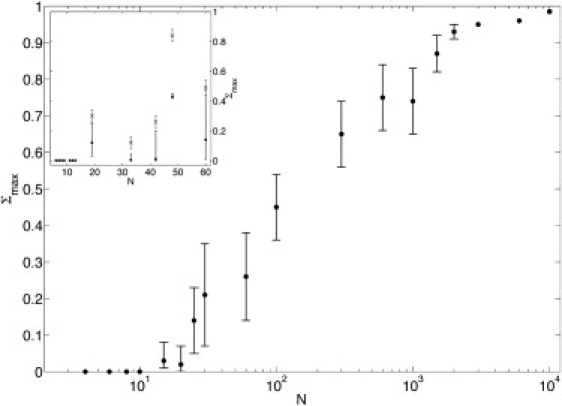
Σmax for different chain length (N) random sequences (f(GC) = 0.5) in a 0.1 M [Na+]-buffer with cT = 2 × 10⁻⁴ M (dots). The oligomers of Zeng et al. (15) in a 0.05 M [Na+]-buffer with cT = 2 × 10⁻⁶ M (crosses, experimental results; dots, calculated results) and typical short oligomers (37) in a 1 M [Na+]-buffer with cT = 2 × 10⁻⁶ M (dots) are shown in the inset.
Long polymers (≥10 kbps)
In the opposite limit of very long DNA, melting curves become again relatively featureless (see Fig. 2) and can be characterized by a melting temperature, which depends on the GC-content, fGC. More than 30 years ago, Frank-Kamenetskii (45) and Vologodskii et al. (46) proposed the following empirical relations:
| (11) |
We have generated random DNA sequences of length N = 50,000 with 0.4 ≤ fGC ≤ 0.6 within the experimental range. Fig. 5 A shows excellent agreement between our results and Eq. 11, provided our variant Eq. 9 of the Owczarzy's salt correction is used. We consider this agreement to be a key result of this work, since it presents a systematic derivation of long-chain experimental behavior from short-chain data used in the parameterization on the basis of a statistical mechanical model. In particular, Fig. 5 A provides strong evidence for the validity of our local salt correction (9) for the NN parameters.
Figure 5.
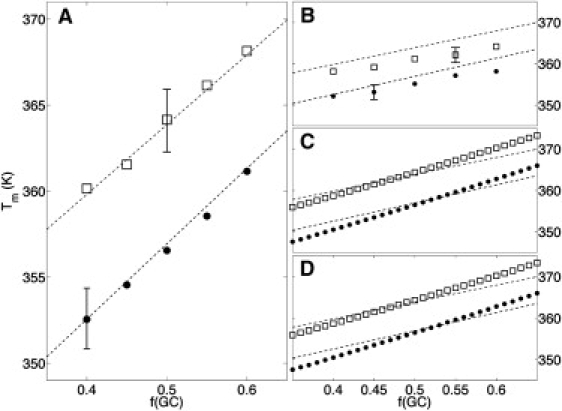
(A and B) Computed Tm with the unified PS-model for random heteropolymers (50,000 bp) with different GC content f(GC) in 74.5 mM (dots) and 220 mM (squares) [Na+] buffer. Salt corrections are Eq. 9 (A) or Eq. 5 (B). The drawn error bars are representative of the standard deviations due to parameterization. (C and D) Theoretical Tm computed for random polymers if the transition was two-stated (C) or if the nucleation entropy was null (D); we use the salt correction we introduced in the article. Dashed lines represent the empirical relations given by Frank-Kamenetskii (45) for very long polymers (Eq. 11).
Short polymers (100 bps ≤ … ≤ 10 kbps)
Melting curves for short- and medium-sized polymers show a rich structure, but can be discussed independently of strand concentration (Fig. 2). To test the predictive power of our model, we have chosen PN/MCS-13 (note that this sequence is a 4660-bp duplex composed by a pBR322 mixed 245-bp repetitive sequence. pBR322 is associated with the primary accession number J01749 (43)). Fig. 6 shows that our model reproduces the melting temperature of PN/MCS-13 fairly well, but fails to predict the fine structure of the curves. In particular, calculated and measured differential melting curves agree only qualitatively. Other bioinformatics programs (DINAmelt (37), MELTSIM (47), etc.) give similar results for these sequences.
Figure 6.
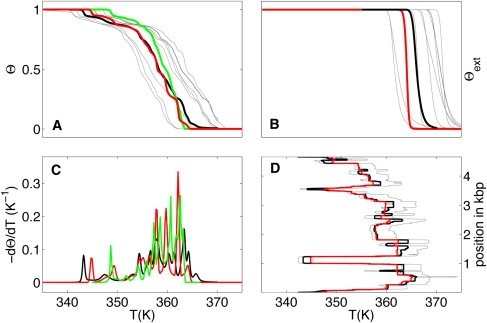
Melting curves Θ (A), Θext (B), −dΘ/dT (C), and evolution of the local basepair melting temperature (D) for PN/MCS-13 (43,47) in a 74.5 mM [Na+] buffer. Green lines are experimental data, black lines are computed results with standard parameters, and other colored lines (gray, red) represent simulations with different random set of parameters (see text).
How are these deviations to be interpreted? Apart from melting curves calculated using the standard parameters, Fig. 6 contains several other curves for parameter combinations drawn randomly within the correlated confidence limits from the parameterization. The curves work equally well (or badly), in particular the deviations from the experimental curve are actually within the confidence limits of the theoretical predictions and do not reveal shortcomings of the model itself.
This raises the question whether the model has any predictive power for polymer melting beyond Eq. 11. Judging from the ensemble of differential melting curves, the answer appears to be negative. However, the position-dependent melting temperature, which allows for a convenient identification of simultaneously opening basepairs, appears extremely robust with respect to the small uncertainties in the parameterization (48). Errors on local Tm are of the same order of magnitude as for oligomers. Testing these more detailed predictions using techniques based on the one-electron oxidative modifications of guanine induced by UV-laser (49) is therefore an interesting challenge.
Long oligomers (20 bps ≤ … ≤ 100 bps)
While short oligomers show two-state melting, this is no longer true for longer chains. Compared to the polymer case, the additional difficulty arises that results depend on the strand concentration (Fig. 2).
Attention recently focused on this regime with the development of an experimental protocol by Zeng et al. (15) and Zeng and Zocchi (16) for measuring the degree of strand association Θext independently of the degree of basepairing and stacking. In Fig. 7 we compare calculated and experimentally measured results for an oligomer L60B36 (15) with one AT-rich domain in the center. Using the standard parameters, our model incorrectly predicts a two-state transition. However, other parameter combinations within the confidence limits correctly reproduce the opening of an internal bubble before strand separation and lead to good agreement with both Θ and Θext (see Fig. 7). Fig. 4 compares the calculated and experimental results for Σmax for the five sequences (inset) of Zeng et al. (15) and Zeng and Zocchi (16) and shows the generic behavior of Σmax for random sequences. The large, asymmetric error bars for long oligomers highlight the particular sensitivity of the predicted behavior to the parameterization uncertainty.
Figure 7.
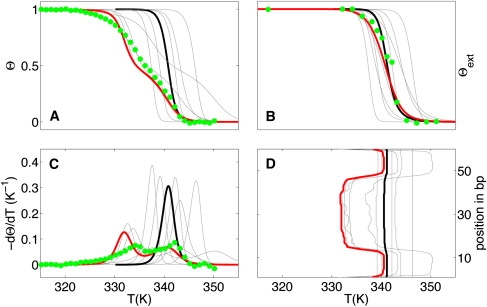
Melting curves Θ (A), Θext (B), −dΘ/dT (C), and evolution of the local basepair melting temperature (D) for the sequence L60B36 of Zeng et al. (15) in a 50 mM [Na+]-buffer (cT = 2 × 10⁻⁶ M). Green dots are experimental data, black lines are computed results with standard parameters and other colored lines (gray, red) represent simulations with different random set of parameters. Red curve underlines a set of parameters that reproduce well the experimental plots for L60B36.
Conclusion
We have presented a unified Poland-Scheraga model of DNA thermal denaturation. In contrast to previously available formulations, our description covers the entire crossover from oligo- to polynucleotide melting behavior and is applicable in the full experimental range of DNA strand and salt concentrations. We have used this Ansatz to discuss generic aspects of DNA melting and were able to obtain a systematic link between the different phenomenological sequence and salt dependences of short- and long-chain melting temperatures. Within the expected margin of error, our model reproduces experimental data for DNA of arbitrary length including the case of non-two-state-melting of longer DNA-oligomers. However, here (and to some degree in the case of domain melting of polymeric DNA) the model predictions for easily observable qualitative features are particularly sensitive to the remaining parameterization uncertainty.
Fig. 8 shows how the uncertainty in the knowledge of particular parameters (or parameter classes) affects predictions for melting curves in the various length regimes. In most cases, the dominant contribution comes from the set of 20 NN-parameters for the dinucleotide steps. They are most easily determined using data for short oligomers undergoing a two-state melting transition (10,21), since results in this case become independent of the cooperativity parameters σ and . We emphasize that the Frank-Kamenetskii relations cannot be used directly to determine (linear combinations (34) of) the microscopic parameters of the PS Hamiltonian. They represent a sequence average over highly cooperative domain opening events and are not given by a trivial average over the employed NN-parameters (see Fig. 5, C and D). However, Figs. 5 A and 8 suggest that a proper comparison to averaged melting temperatures calculated from the full PS-model might be an excellent (albeit computationally expensive) strategy to refine the NN parameters. The cooperativity parameters σ and affect the melting profiles of short polymers and, in particular, long oligomers. The sensitivity of these sequences has to be used to minimize errors during the parameterization process (50). The best strategy to determine their values is to devise comparative melting experiments along the lines of Blake and Delcourt (43), which allow us to isolate their effect (for more details, see Appendix C).
Figure 8.
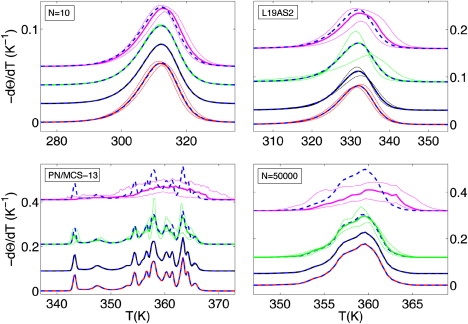
Melting curves −dΘ/dT for short random (N = 10) and long (L19AS2 (15)) oligomers and for short (PN/MCS-13) and long random (N = 50,000) polymers. For each chain-length DNA, we vary different parameters: initiation (red), capping (black), cooperativity (green), and NN-parameters (violet). The thick lines represents the mean curve over the variation of parameters. The thin lines are the confidence limits. The standard parameters curves are the dashed blue lines.
However, there will still exist inherent error bars that reflect the hypothesizes of the model and the ad hoc simplifications made. To reduce the intrinsic errors, one solution should be to increase the number of parameters describing chemical or physical effects not taken into account in the PS model (elasticity, basepair dependence of cooperative factors, etc.). Nevertheless, this could make the model difficult to parameterize and computationally more demanding.
For future work, our results suggest (a combination of) several strategies:
-
1.
The analysis of the importance of the various parameter types for particular melting experiments (Fig. 8).
-
2.
The design of (comparative) melting experiments isolating particular parameters following the framework used in Blake and Delcourt (43) (more details and examples can be found in Appendix C).
-
3.
A simultaneous fit of the model to an extended base of experimental data for short-, medium-, and long-chain melting. This option is finally available with this formulation of the Poland-Scheraga model where all cases are treated within the same statistical-mechanical framework.
Acknowledgments
R.E. acknowledges support from the chair of excellence program of the Agence Nationale de la Recherche (ANR/France).
Appendix A: Mixing Entropy and Chemical Equilibrium
To calculate the chemical equilibrium between the individual strands and the dimer, we need to account for the translational entropy, i.e., the entropy of mixing with the solvent. Using a lattice approach, one can show that the entropy of mixing per unit volume for two species P and Q is given by (51)
| (12) |
where Φ is the volume fraction of species P, and VP and VQ are the respective molecular volumes. We have Φ = cPVP and 1 – Φ = cQVQ, where cP and cQ are the respective concentrations (cP = nP/V with nP the number of particles P, and the same for Q). Now we apply precedent equation to the DNA-water problem. P is either a single strand (A or B) or a double-strand (AB), and Q is water. All the studies are made at very low DNA concentration, i.e., Φ << 1, then (1 – Φ)/VQ log(1 – Φ) ≈ −Φ/VQ = −cPVP/VQ. Therefore, the entropy of mixing per molecule P can be obtained as
| (13) |
Finally, if concentrations are measured in units of a reference concentration c0 (typically c0 = 1 M),
| (14) |
where vP and vQ are the respective molar volumes.
Now we combine the entropy of mixing with the single-chain partition functions to obtain the free energy per molecule
| (15) |
(and the same for B and AB). The chemical potential per molecule can be calculated by differentiating the free energy density with respect to density,
| (16) |
(and the same for B and AB). To obtain the law of mass action, we equate the chemical potentials of the bound and unbound molecules μAB = μA + μB:
| (17) |
By assuming that the molar volumes in the complex simply add up vAB = (vA + vB), this simplifies to
| (18) |
By defining Gint = (GABint – GAint – GBint) and ΔGmix0 = −kBT(log(c0vAB/4) + 1), we find Eq. 2. The molar volume of the duplex is proportional to the number of dinucleotide steps in the double-strand: vAB = (N − 1)vs, where vs is the molar volume of one dinucleotide step. Numerically, we obtain ΔGmix0 = −kBT log(0.44(N – 1)).
Appendix B: Solving The Unified PS Model
Recursion relations
First, we consider the forward partition function Zf(α + 1) starting at base 1, ending at base α + 1, bases α and α + 1 being paired. There are three ways to have these bases closed: either the dinucleotide basepair step (α – 1, α) is double-stranded, or there is a loop starting at any base α′ and ending at α, or the duplex is completely open from base 1 to base α (Fig. 9). Therefore, considering the closed state as the reference state, we can write
| (19) |
where (α – α′)–c accounts for the number of self-avoiding polygons of length 2(α – α′) (i.e., the number of loops starting at base α′ and ending at base α); (α – 1)c′ accounts for the number of possible conformations for a free end, , with ΔgNN(i, i + 1) the NN-stacking free energy of basepairs (i, i + 1); c and c′ take into account the steric interactions between loop or the free end with the rest of the chain. The value of c has been extensively discussed (11,22–25) and is equal to 1.764 for noninteracting self-avoiding loops and 2.15 for interacting self-avoiding loops. The value of c′ is derived from polymer theory (26) and is equal to 0.16 = 1.16 – 1.
Figure 9.

Graphical representation of the recursion relation for Zf(α + 1).
In a similar way, we consider Zb(α) the backward partition function, starting at base α and ending at base N, with base α being paired. So,
| (20) |
Finally, we denote by Zsf(α) the second forward partition function, starting at base 1 and ending at base α, base α being closed and base α – 1 being opened. In the same way, Zsf satisfies
| (21) |
The probability p(α) that basepair α is bound can be expressed as
| (22) |
where Z is the total partition function (Fig. 10)
| (23) |
Figure 10.

Graphical representation of total partition function Z.
We can now express Θint
| (24) |
and . The technical issue is now to solve numerically Eqs. 19–21. An answer is to simplify the recursion relations and speed up their numerical resolutions by using the Fixman-Freire algorithm (29,30).
Fixman-Freire algorithm
We first fine-tune the recursion relations. With
| (25) |
| (26) |
| (27) |
we derive
| (28) |
| (29) |
| (30) |
where , , and . The Fixman-Freire approximation consists in developing
| (31) |
We introduce new variables
| (32) |
| (33) |
Therefore
| (34) |
| (35) |
and we obtain new recursions relations
| (36) |
| (37) |
with
and for Zsf∗,
| (38) |
To solve this relation, we have to know initial conditions
| (39) |
| (40) |
| (41) |
Then
| (42) |
| (43) |
| (44) |
In the same way for νi,
| (45) |
| (46) |
| (47) |
Hence,
| (48) |
| (49) |
| (50) |
For Zsf∗,
| (51) |
| (52) |
| (53) |
The algorithm consists in solving recursion relations for μi and νi, in deducting values for Zf∗, Zb∗, and Zsf∗. Then it is easy to compute p(α), Θint, and Θext.
Appendix C: Improving The Model Parameterization
For example, to parameterize γS = kB/2 log σ, we propose to study two types of sequences: Sloop = GPANGP (one central bubble) and S2loop = G2P/3AN/2G2P/3AN/2G2P/3 (two internal bubbles) with P large enough to neglect border effects. Following Blake and Delcourt (43), we can compute the difference of melting temperatures Tm2loop – Tmloop of the different bubbles (Tmloop for Sloop and Tm2loop for S2loop) for various N. As both sequences have the same basepair composition, this observable should not be very sensitive to NN parameters and should be responsive to the energy difference between the two types of strands, which is ∼2γ. Fig. 11 shows the simulated evolution of Tm2loop – Tmloop versus 1/N for different γS values with the error bars due to standard deviations of NN-parameters. We remark that the observable is more and more sensitive to γS as long as 1/N increases. Therefore, experiments have to be done with short bubbles (N must be big enough to permit to observe the bubble subtransition). Moreover, we notice that errors due to NN-parameters uncertainty limit the accuracy of theγS parameterization by ∼10%. Nevertheless, as experimental error are ∼0.3 K, a precise evaluation of γS is possible with sequences in the range N ∈ [20–40].
Figure 11.
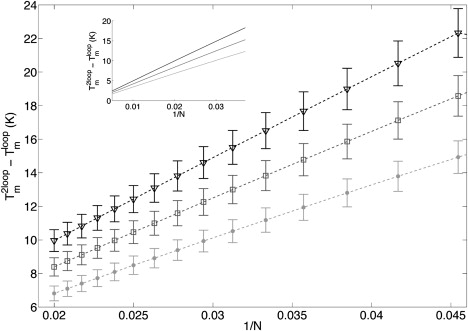
Tm2loop – Tmloop as a function of 1/N for different values of γS: −10.9 cal/mol/K (triangles), −8.9 cal/mol/K (squares), and −6.9 cal/mol/K (dots). Error bars reflect the confidence limit on NN-parameters.
In the same manner, to parameterize ΔS0mix, we can study Sloop and Send = AN/2G2PAN/2. Fig. 12 reveals the sensitivity of Tmloop – Tmend according to ΔS0mix for little N. Nonetheless, error bars do not allow a precise evaluation of ΔS0mix. This difference with the previous example comes from the important role played by the borders. Indeed, NN-initiation parameters have large standard deviations that automatically reflect on the theoretical errors. Without an improvement on the errors of the initiation enthalpies and entropies, there is no hope to parameterize ΔS0mix with these types of experiments.
Figure 12.
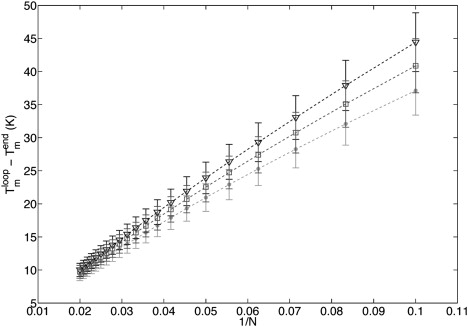
Tmloop – Tmend as a function of 1/N for different values of ΔS0mix: 5 cal/mol/K (triangles), 3.0 cal/mol/K (squares), and 1 cal/mol/K (dots). Error bars reflect the confidence limit on NN-parameters.
Moreover, as seen in Fig. 4, the two-state parameter Σmax is highly σ-dependent for long oligomers. Therefore, more experimental data for long oligomers would allow better estimates for the cooperativity factors by including the Σmax values in the global parameterization process.
References
- 1.Calladine C., Drew H., Luisi B., Travers A. Elsevier Academic Press; New York: 2004. Understanding DNA; The Molecule and How It Works. [Google Scholar]
- 2.Schuster P. Prediction of RNA secondary structures: from theory to models and real molecules. Rep. Prog. Phys. 2006;69:1419–1477. [Google Scholar]
- 3.Fire A., Xu S., Montgomery M.K., Kostas S.A., Driver S.E., Mello C.C. Potent and specific genetic interference by double-stranded RNA in Caenorhabditis elegans. Nature. 1998;391:806–811. doi: 10.1038/35888. [DOI] [PubMed] [Google Scholar]
- 4.Shoemaker D.D., Schadt E.E., Armour C.D., He Y.D., Garrett-Engele P. Experimental annotation of the human genome using microarray technology. Nature. 2001;409:922–927. doi: 10.1038/35057141. [DOI] [PubMed] [Google Scholar]
- 5.Seeman N.C. Biochemistry and structural DNA nanotechnology: an evolving symbiotic relationship. Biochemistry. 2003;42:7259–7269. doi: 10.1021/bi030079v. [DOI] [PubMed] [Google Scholar]
- 6.Nykypanchuk D., Maye M.M., van der Lelie D., Gang O. DNA-guided crystallization of colloidal nanoparticles. Nature. 2008;451:549–552. doi: 10.1038/nature06560. [DOI] [PubMed] [Google Scholar]
- 7.Park S.Y., Lytton-Jean A.K.R., Lee B., Weigand S., Schatz G.C. DNA-programmable nanoparticle crystallization. Nature. 2008;451:553–556. doi: 10.1038/nature06508. [DOI] [PubMed] [Google Scholar]
- 8.Crothers D.M., Zimm B.H. Theory of the melting transition of synthetic polynucleotides evaluation of the stacking free energy. J. Mol. Biol. 1964;9:1–9. doi: 10.1016/s0022-2836(64)80086-3. [DOI] [PubMed] [Google Scholar]
- 9.DeVoe H., Tinoco I., Jr. The stability of helical polynucleotides: base contributions. J. Mol. Biol. 1962;4:500–517. doi: 10.1016/s0022-2836(62)80105-3. [DOI] [PubMed] [Google Scholar]
- 10.SantaLucia J., Jr. A unified view of polymer, dumbbell, and oligonucleotide DNA nearest-neighbor thermodynamics. Proc. Natl. Acad. Sci. USA. 1998;95:1460–1465. doi: 10.1073/pnas.95.4.1460. [DOI] [PMC free article] [PubMed] [Google Scholar]
- 11.Poland D., Scheraga H.A. Phase transition in one dimension and the helix-coil transition in polyamino acids. J. Chem. Phys. 1966;45:1456–1464. doi: 10.1063/1.1727785. [DOI] [PubMed] [Google Scholar]
- 12.Poland D., Scheraga H.A. Academic Press; New York: 1970. Theory of Helix-Coil Transition in Biopolymers. [Google Scholar]
- 13.Zuker M. Mfold web server for nucleic acid folding and hybridization prediction. Nucleic Acids Res. 2003;31:3406–3415. doi: 10.1093/nar/gkg595. [DOI] [PMC free article] [PubMed] [Google Scholar]
- 14.Hofacker I.L. Vienna RNA secondary structure server. Nucleic Acids Res. 2003;31:3429–3431. doi: 10.1093/nar/gkg599. [DOI] [PMC free article] [PubMed] [Google Scholar]
- 15.Zeng Y., Montrichok A., Zocchi G. Bubble nucleation and cooperativity in DNA melting. J. Mol. Biol. 2004;339:67–75. doi: 10.1016/j.jmb.2004.02.072. [DOI] [PubMed] [Google Scholar]
- 16.Zeng Y., Zocchi G. Mismatches and bubbles in DNA. Biophys. J. 2006;90:4522–4529. doi: 10.1529/biophysj.105.069591. [DOI] [PMC free article] [PubMed] [Google Scholar]
- 17.Daneholt B. The Nobel Assembly at Karolinska Institutet; Stockholm, Sweden: 2006. Advanced Information on The Nobel Prize Generally in Physiology or Medicine 2006—RNA Interference. [Google Scholar]
- 18.Everaers R., Kumar S., Simm C. Unified description of poly- and oligonucleotide DNA melting: nearest-neighbor, Poland-Scheraga, and lattice models. Phys. Rev. E Stat. Nonlin. Soft Matter Phys. 2007;75:041918–041930. doi: 10.1103/PhysRevE.75.041918. [DOI] [PubMed] [Google Scholar]
- 19.Owczarzy R., You Y., Moreira B.G., Manthey J.A., Huang L. Effects of sodium ions on DNA duplex oligomers: improved predictions of melting temperatures. Biochemistry. 2004;43:3537–3554. doi: 10.1021/bi034621r. [DOI] [PubMed] [Google Scholar]
- 20.Wartell R.M., Benight A.S. Thermal denaturation of DNA molecules: a comparison of theory with experiment. Phys. Rep. 1985;126:67–107. [Google Scholar]
- 21.Owczarzy R., Vallone P.M., Gallo F.J., Paner T.M., Lane M.J. Predicting sequence-dependent melting stability of short duplex DNA oligomers. Biopolymers. 1998;44:217–239. doi: 10.1002/(SICI)1097-0282(1997)44:3<217::AID-BIP3>3.0.CO;2-Y. [DOI] [PubMed] [Google Scholar]
- 22.Fisher M.E. Effects of excluded volume on phase transitions in biopolymers. J. Chem. Phys. 1966;45:1469–1473. [Google Scholar]
- 23.Kafri Y., Mukamel D., Peliti L. Melting and unzipping of DNA. Eur. Phys. J. B. 2002;27:135–146. [Google Scholar]
- 24.Kafri Y., Mukamel D., Peliti L. Kafri, Mukamel, and Peliti reply. Phys. Rev. Lett. 2003;90:159802. [Google Scholar]
- 25.Blossey R., Carlon E. Reparameterizing the loop entropy weights: effect on DNA melting curves. Phys. Rev. E Stat. Nonlin. Soft Matter Phys. 2003;68:061911–061918. doi: 10.1103/PhysRevE.68.061911. [DOI] [PubMed] [Google Scholar]
- 26.de Gennes P.-G. Cornell University Press; Ithaca, NY: 1979. Scaling Concepts in Polymer Physics. [Google Scholar]
- 27.Vanderzande C. Cambridge University Press; Cambridge, UK: 1998. Lattice Models of Polymers. [Google Scholar]
- 28.Dimitrov R.A., Zuker M. Prediction of hybridization and melting for double-stranded nucleic acids. Biophys. J. 2004;87:215–226. doi: 10.1529/biophysj.103.020743. [DOI] [PMC free article] [PubMed] [Google Scholar]
- 29.Garel T., Orland H. Generalized Poland-Scheraga model for DNA hybridization. Biopolymers. 2004;75:453–467. doi: 10.1002/bip.20140. [DOI] [PubMed] [Google Scholar]
- 30.Fixman M., Freire J.J. Theory of DNA melting curves. Biopolymers. 1977;16:2693–2704. doi: 10.1002/bip.1977.360161209. [DOI] [PubMed] [Google Scholar]
- 31.Goldstein R.F., Benight A.S. How many numbers are required to specify sequence-dependent properties of polynucleotides? Biopolymers. 1992;32:1679–1693. doi: 10.1002/bip.360321210. [DOI] [PubMed] [Google Scholar]
- 32.Press W.H., Teukolsky S.A., Vetterling W.T., Flannery B.P. Cambridge University Press; Cambridge, UK: 1996. Numerical Recipes in Fortran 77: the Art of Scientific Computing. [Google Scholar]
- 33.Allawi H.T., SantaLucia J., Jr. Thermodynamics and NMR of internal G·T mismatches in DNA. Biochemistry. 1997;36:10581–10594. doi: 10.1021/bi962590c. [DOI] [PubMed] [Google Scholar]
- 34.Gray D.M. Derivation of nearest-neighbor properties from data on nucleic acid oligomers. I. Simple sets of independent sequences and the influence of absent nearest neighbors. Biopolymers. 1997;42:783–793. doi: 10.1002/(sici)1097-0282(199712)42:7<783::aid-bip4>3.0.co;2-p. [DOI] [PubMed] [Google Scholar]
- 35.Gray D.M. Derivation of nearest-neighbor properties from data on nucleic acid oligomers. II. Thermodynamic parameters of DNA/RNA hybrids and DNA duplexes. Biopolymers. 1997;42:795–810. doi: 10.1002/(sici)1097-0282(199712)42:7<795::aid-bip5>3.0.co;2-o. [DOI] [PubMed] [Google Scholar]
- 36.Efron B., Tibshirani R. Chapman & Hall; London, UK: 1993. An Introduction to the Bootstrap. [Google Scholar]
- 37.Markham N.R., Zuker M. DINAMelt web server for nucleic acid melting prediction. Nucleic Acids Res. 2005;33:W577–W581. doi: 10.1093/nar/gki591. [DOI] [PMC free article] [PubMed] [Google Scholar]
- 38.Le Novere N. MELTING, computing the melting temperature of nucleic acid duplex. Bioinformatics. 2001;17:1226–1227. doi: 10.1093/bioinformatics/17.12.1226. [DOI] [PubMed] [Google Scholar]
- 39.Erie D., Sinha N., Olson W., Jones R., Breslauer K. A dumbbell-shaped, double-hairpin structure of DNA: a thermodynamic investigation. Biochemistry. 1987;26:7150–7159. doi: 10.1021/bi00396a042. [DOI] [PubMed] [Google Scholar]
- 40.Record M.T., Lohman T.M. A semiempirical extension of polyelectrolyte theory to the treatment of oligoelectrolytes: application to oligonucleotide helix-coil transitions. Biopolymers. 1978;17:159–166. [Google Scholar]
- 41.Manning G.S. Limiting laws and counterion condensation in polyelectrolyte solutions. J. Chem. Phys. 1969;51:924–933. doi: 10.1016/0301-4622(78)87016-1. [DOI] [PubMed] [Google Scholar]
- 42.Manning G.S. On the application of polyelectrolyte “limiting laws” to the helix-coil transition of DNA.I. Excess univalent cations. Biopolymers. 1972;11:937–949. doi: 10.1002/bip.1972.360110502. [DOI] [PubMed] [Google Scholar]
- 43.Blake R.D., Delcourt S.G. Thermal stability of DNA. Nucleic Acids Res. 1998;15:3323–3332. doi: 10.1093/nar/26.14.3323. [DOI] [PMC free article] [PubMed] [Google Scholar]
- 44.Smale S.T., Kadonaga J.T. The RNA polymerase II core promoter. Annu. Rev. Biochem. 2003;72:449–479. doi: 10.1146/annurev.biochem.72.121801.161520. [DOI] [PubMed] [Google Scholar]
- 45.Frank-Kamenetskii M. Simplification of the empirical relationship between melting temperature of DNA, its GC content and concentration of sodium ions in solution. Biopolymers. 1971;10:2623–2624. doi: 10.1002/bip.360101223. [DOI] [PubMed] [Google Scholar]
- 46.Vologodskii A., Amirikyan B., Lyuchenko Y., Krank-Kamenetskii M. Allowance for heterogeneous stacking in the DNA helix-coil transition theory. J. Biomol. Struct. Dyn. 1984;2:131–148. doi: 10.1080/07391102.1984.10507552. [DOI] [PubMed] [Google Scholar]
- 47.Blake R.D., Bizzaro J.W., Blake J.D., Day G.R., Delcourt S.G. Statistical mechanical simulation of polymeric DNA melting with MELTSIM. Bioinformatics. 1999;15:370–375. doi: 10.1093/bioinformatics/15.5.370. [DOI] [PubMed] [Google Scholar]
- 48.Yeramian E., Jones L. GeneFizz: a web tool to compare genetic (coding/non-coding) and physical (helix/coil) segmentations of DNA sequences. Gene discovery and evolutionary perspectives. Nucleic Acids Res. 2003;31:3843–3849. doi: 10.1093/nar/gkg627. [DOI] [PMC free article] [PubMed] [Google Scholar]
- 49.Spassky A., Angelov D. Temperature-dependence of UV laser one-electron oxidative guanine modifications as a probe of local stacking fluctuations and conformational transitions. J. Mol. Biol. 2002;323:9–15. doi: 10.1016/s0022-2836(02)00878-1. [DOI] [PubMed] [Google Scholar]
- 50.Bevington P.R., Robinson D.K. McGraw-Hill; New York: 1992. Data Reduction and Error Analysis for the Physical Sciences. [Google Scholar]
- 51.Rubinstein M., Colby R.H. Oxford University Press; New York: 2003. Polymer Physics. [Google Scholar]
- 52.Cantor C.R., Schimmel P.R. Freeman; New York: 1980. Biophysical Chemistry. [Google Scholar]
- 53.SantaLucia J., Jr., Allawi H.T., Seneviratne P.A. Improved nearest-neighbor parameters for predicting DNA duplex stability. Biochemistry. 1996;35:3555–3562. doi: 10.1021/bi951907q. [DOI] [PubMed] [Google Scholar]