

Abstract
The neonatal rat ventricular myocyte culture is one of the most popular experimental cardiac cell models. To our knowledge, the excitation-contraction coupling (ECC) of these cells, i.e., the process linking the electrical activity to the cytosolic Ca2+ transient and contraction, has not been previously analyzed, nor has it been presented as a complete system in detail. Neonatal cardiomyocytes are in the postnatal developmental stage, and therefore, the features of their ECC differ vastly from those of adult ventricular myocytes. We present the first complete analysis of ECC in these cells by characterizing experimentally the action potential and calcium signaling and developing the first mathematical model of ECC in neonatal cardiomyocytes that we know of. We show that in comparison to adult cardiomyocytes, neonatal cardiomyocytes have long action potentials, heterogeneous cytosolic Ca2+ signals, weaker sarcoplasmic reticulum Ca2+ handling, and stronger sarcolemmal Ca2+ handling, with a significant contribution by the Na+/Ca2+ exchanger. The developed model reproduces faithfully the ECC of rat neonatal cardiomyocytes with a novel description of spatial cytosolic [Ca2+] signals. Simulations also demonstrate how an increase in the cell size (hypertrophy) affects the ECC in neonatal cardiomyocytes. This model of ECC in developing cardiomyocytes provides a platform for developing future models of cardiomyocytes at different developmental stages.
Introduction
Excitation-contraction coupling (ECC) forms the basis of cardiac function at the cellular level. The ECC process involves several nonlinear components that connect the electrical excitation at the cell membrane to the generation of cytosolic Ca2+ signals triggering cell contraction (1). Due to the complexity of ECC, mathematical modeling has been used to facilitate understanding of the behavior and features of this system. At the present time, several mathematical models exist for ECC in myocytes from different species and different regions of the adult mammalian heart (2–8). In contrast, only a few models of action potential (AP) or ECC in developing cardiomyocytes have been developed (9,10).
Cardiomyocytes isolated from adult heart are terminally differentiated and do not divide or grow if cultured. However, if cardiomyocytes are isolated before differentiation is complete, e.g., just after birth, when they still have the ability to grow, divide, and differentiate, they can be used for long-term cell culture applications. Consequently, these primary cultures of rat neonatal ventricular cardiomyocytes are among the few cardiac cell culture models and are therefore widely used in biochemical, molecular biology and cellular signaling research (11,12). Neonatal cardiomyocytes are isolated for culture at the transitional period where the cells undergo dramatic changes from the phenotype of fetal myocytes to postnatal and adult myocytes (13). Culturing itself further shapes the phenotype of these neonatal cells (14,15). The neonatal cells have unique features. For example, they lack the T-tubule system (1,15) that plays a central role in the ECC of adult ventricular myocytes, and unlike their adult counterparts, they have the ability to maintain cytosolic Ca2+ signaling without sarcoplasmic reticulum (SR) Ca2+ release (1,16,17). The lack of T-tubules leads to more heterogeneous cytosolic Ca2+ signals than in adult myocytes (1). From the mathematical modeling point of view, this requires a more complex description of cytosolic [Ca2+] ([Ca2+]i) in the neonatal model compared to the common-pool cytosol with one or a few additional compartments that is generally used in adult ventricular myocyte models (2,6,8). From a physiological point of view, this may attribute some unanticipated features to neonatal cells.
The purpose of this study was to 1), characterize the special features involved in the ECC of cultured rat neonatal ventricular myocytes; and 2), develop a mathematical model of the ECC in these cells that runs in a normal desktop PC but is complex enough to explain the important ECC features of these cells that distinguish them from other ventricular myocytes. In our experiments on neonatal myocytes, we quantified the AP, the SR Ca2+ storage capacity, and the cytosolic Ca2+ signaling with the contributions of sarcolemmal (SL) and SR Ca2+ fluxes. Based on our experimental AP and Ca2+ signaling data, as well as data from other studies with rat neonatal myocytes in the literature, we developed and validated a mathematical model that faithfully reproduces the ECC of rat neonatal myocytes. This model is unique in that it includes cytosolic Ca2+ as a function of time and spatial coordinates. A similar approach has been used in models of cytosolic Ca2+ diffusion in atrial cardiomyocytes (18) and rabbit neonatal cardiomyocytes (19), but never in conjunction with both AP-generating SL ion currents and components of SR Ca2+ dynamics.
Here, using experiments and modeling, we present the first complete analysis of ECC in cultured rat neonatal ventricular cardiomyocytes and propose a novel mathematical model to be used as a tool to study ECC function in these cells. With the simulations, we show that the largest differences between adult and neonatal cells are in AP length and how Ca2+ signals are generated and regulated from SL and SR sources during the AP. The simulations also show how the ECC of a neonatal cardiomyocyte during hypertrophy is likely to be shaped by the increase in cytosol volume.
Materials and Methods
Cell isolation and culturing
The isolation and culturing of neonatal rat ventricular cardiomyocytes was performed as previously described (11,12). Briefly, neonatal rat cardiomyocytes were isolated 1–2 days after birth. Ventricles were excised, cut into small pieces, and incubated for 1 h in a solution containing 100 mM NaCl, 10 mM KCl, 1.2 mM KH2PO4, 4.0 mM MgSO4, 50 mM taurine, 20 mM glucose, 10 mM HEPES, 2 mg/ml collagenase type II (Worthington, Lakewood, NJ), 2 mg/ml pancreatin (P-3292, Sigma, St. Louis, MO) and 1% penicillin-streptomycin. After incubation, the detached cells were collected in 15-ml Falcon tubes and centrifuged for 5 min at 160 g. The supernatant and the top layer of the pellet containing damaged cells were discarded and the isolated cardiomyocytes were plated on 35-mm fibronectin-coated plastic dishes. The cells were cultured to reach confluence in Dulbecco's modified Eagle's medium (DMEM) containing 10% FBS and 1% penicillin-streptomycin. The experiments were performed after 4–5 days of culturing.
Electrophysiology and Ca2+ imaging
For AP recording and Ca2+ imaging, the culturing dishes were placed in a custom-made perfusion system built into an Olympus Fluoview 1000 confocal inverted microscope. Cells were held at a steady 32–35°C by continuous superfusion with preheated DMEM + Glutamax I (Gibco, Carlsbad, CA) culturing medium (pH 7.4, bubbled with 95% O2/5% CO2). For Ca2+ imaging, cells were loaded in DMEM + 1 mM probenecid solution for 1 h at 37°C in incubator with Fluo-4-AM-ester or Fluo-3-AM-ester (10 μM, dissolved in pluronic DMSO, Molecular Probes, Eugene, OR). The solution was changed two times and cells were incubated at room temperature (20–22°C) at least 30 min for the dye to de-esterify.
To measure myocyte calcium signals, Fluo-loaded myocytes were excited at 488 nm and the emitted light was collected with a spectral detector from 520 to 620 nm through a 20× or 60× objective lens. To excite the cells, myocytes were stimulated with 1-ms voltage pulses at 50% over the excitation threshold through two platinum wires located one on each side of the petri dish. At the time of electrical stimulation or spontaneous activity, cells were line-scanned at 400–600 Hz, depending on the length of the scanning line, with a fixed pixel time of 10 μs with the 20× objective and 2 μs with the 60× objective. Fluo- fluorescence intensity is expressed as an F/F0 ratio, where F is the background-subtracted fluorescence intensity and F0 is the background-subtracted minimum fluorescence value measured from each cell at rest.
To record action potentials, the whole-cell patch-clamp method in current-clamp mode was used. Electrode resistances were 10–15 MΩ and the pipette solution was (in mM) 130 KCl, 5 Na2-phosphocreatine, 5 Mg-ATP, 1 EGTA, and 10 HEPES (pH adjusted to 7.2 with KOH). APs were filtered at 2 kHz and acquired at 10 kHz. Clampex 9.2 software, an Axopatch-1D amplifier, and Digidata 1322A A/D-D/A (Axon Instruments, Union City, CA) were used for data acquisition.
Mathematical modeling
A model of cultured rat neonatal ventricular cardiomyocytes was developed. The purpose of the modeling was to define the fundamental components needed to reproduce the intracellular Ca2+ signaling and AP features observed in the experiments. The model includes SR and SL membranes with ion channels and an SR Ca2+ store. Intracellular Ca2+ signals and diffusion of the [Ca2+]i was modeled as a function of a space coordinate in addition to a time coordinate. For a complete list of model equations and parameters, see the Appendix and Tables 2–5. The model parameters were estimated, whenever possible, based on experimental data. The data used were from rat neonatal cardiomyocytes cultured for 3–5 days, or, when necessary, very similar cells. The parameters were estimated by direct fitting (e.g., for inactivation and activation of ion current) or indirect fitting (e.g., for amount of SERCA based on the decay of Ca2+ transient). In either case, the fit was considered satisfactory when the values and the curves of the fits were within the standard error of the mean experimental values.
Table 2.
Structural and environmental parameters of the model
| Parameter | Definition | Value |
|---|---|---|
| rnucleus | Radius to the surface of nucleus | 5.7934 μm |
| rSR | Radius to the surface of SR | 6 μm |
| rSL | Radius of the cell | 10.5 μm |
| VSRrelease | Velocity of SRrelease compartment | 0.009030 pl |
| VSRuptake | Velocity of SRuptake compartment | 0.08127 pl |
| Vcyto | Velocity of the cytosol | 3.94 pl |
| Acap | Capacitive membrane area | 1.38544 × 10⁻⁵ cm2 |
| F | Faradays constant | 96.5 C/mmol |
| T | Temperature | 32°C = 305 K |
| R | Ideal gas constant | 8.314 J / (mol K) |
| Cm | Specific membrane capacitance | 1.0 μF/cm2 |
| [Ca2+]o | Extracellular Ca2+ concentration | 1796 μM |
| [Na+]o | Extracellular Na+ concentration | 154578 μM |
| [K+]o | Extracellular K+ concentration | 5366 μM |
Table 3.
Parameters of the SL membrane currents
| Parameter | Definition | Value | |
|---|---|---|---|
| GCaL | Maximum ICaL conductance | 6.3 × 10⁻⁵ dm3 / (F ms) | |
| GCaT | Maximum ICaT conductance | 0.2 mS/μF | |
| kNCX | Scaling factor INCX | 2.268 × 10⁻¹⁶ pA / (pF (μM)4) | |
| dNCX | Denominator constant for INCX | 10−16 (μM)-4 | |
| γ | Energy barrier parameter for INCX | 0.5 | |
| GCab | ICab conductance | 0.0008 mS/μF | |
| GNab | INab conductance | 0.0026 mS/μF | |
| Maximum NaK-ATPase current | 2.7 pA/pF | ||
| Km,Nai | Na+ half saturation constant for INaK | 18600 μM | |
| nNaK | Hill coefficient for Na+ in INaK | 3.2 | |
| Km,Ko | K+ half saturation constant for INaK | 1500 μM | |
| GNa | Maximum INa conductance | 35 mS/μF | |
| Gf | Maximum If conductance | 0.021 mS/μF | |
| Gto | Maximum Ito conductance | 0.1 mS/μF | |
| GKs | Maximum IKs conductance | 0.05 mS/μF | |
| GKr | Maximum IKr conductance | 0.06 mS/μF | |
| kf | Rate constant for IKr | 0.023761 ms−1 | |
| kb | Rate constant for IKr | 0.036778 ms−1 |
Table 4.
Sarcoplasmic reticulum parameters
| Parameter | Definition | Value |
|---|---|---|
| kRyR | Scaling factor for JRyR | 0.01 ms−1 |
| kopen | Rate constant for RyR opening | 1 ms−1 |
| kclose | Rate constant for RyR closing | 0.16 ms−1 |
| Vmax | Maximum SERCA flux | 0.9996 μM/ms |
| Kmf | Half-saturation for forward SERCA | 0.5 μM |
| Kmr | Half-saturation for reverse SERCA | 7000 × Kmf = 3500 μM |
| H | Hill coefficient for SERCA | 2 |
| kleak | SR leak rate constant | 5 × 10⁻⁶ ms−1 |
| τtr | Time constant for Jtr | 200 ms |
| [CSQN]tot | Total calsequestrin concentration | 24750 μM |
| KmCSQN | Half-saturation for calsequestrin | 800 μM |
Table 5.
Cytosol parameters
| Parameter | Definition | Value |
|---|---|---|
| Δr | Length of spatial discretization of cytosol | 0.1 μm |
| [TRPN]tot | Total troponin concentration | 35 μM |
| KmTRPN | Half-saturation for troponin | 0.5 μM |
| [CMDN]tot | Total calmodulin concentration | 50 μM |
| KmCMDN | Half-saturation for calmodulin | 2.38 μM |
| DCa | Diffusion coefficient for Ca2+ | 7 μm2/ms |
| [EGTA]tot | Total EGTA concentration | 1000 μM |
| kEGTAon | Ca2+ on rate constant for EGTA | 1.5 × 10⁻³ (μM ms)−1 |
| kEGTAoff | Ca2+ off rate constant for EGTA | 0.3 × 10⁻³ ms−1 |
Structure of the model
The model cell was assumed to have a spherical shape. As in real cells, the nucleus was located at the center of the cell, surrounded by a thin layer-like compartment representing the SR (Fig. 1). The radius from the center of the cell to the surface of the SR (rSR) was set to 6 μm according to our measurements of the diameters of the nucleus + SR in the center of neonatal cardiomyocytes (6.0 ± 0.2 μm, n = 25). The distance between the rSR and rnucleus determines the volume of the SR (Fig. 1). Based on the fitting of the SR volume (see Sarcoplasmic reticulum in Methods), rnucleus was set to 5.7934 μm. The distance between the SR and SL is 4.5 μm based on our cytosolic Ca2+ diffusion recordings (see Results). The radius of the cell (rSL) is thus 10.5 μm, which reproduces the cell membrane capacitance of 13.9 pF, comparable to experimental results (13.8 ± 1.3 pA/pF (20); ∼15 pA/pF in cells cultured for 3 days (14)).
Figure 1.
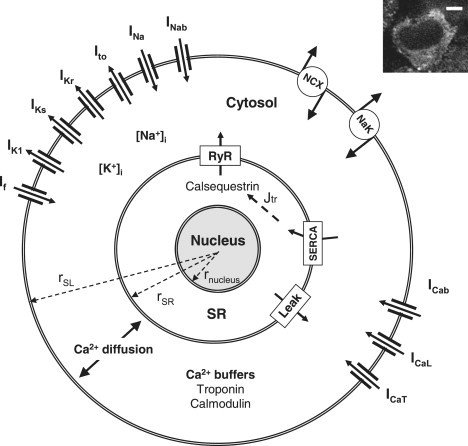
Schematic diagram of the spherically shaped model of a cultured rat neonatal ventricular cardiomyocyte (the radii rSL, rSR, and rnucleus are not to scale). The SL ion currents are the hyperpolarization-activated current (If), the time-independent K+ current (IK1), the slow and rapid delayed rectifier K+ currents (IKs and IKr), the transient outward K+ current (Ito), the fast Na+ current (INa), the background Na+ current (INab), the Na+/Ca2+ exchanger (NCX), the Na+/K+-ATPase (NaK), the background Ca2+ current (ICab) and the L- and T-type Ca2+ currents (ICaL and ICaT). The Ca2+ diffuses radially and is buffered by troponin and calmodulin in the cytosol. The SR is located on the surface of the nucleus. The SR is divided into uptake and release compartments (SRuptake and SRrelease, respectively, not shown in figure). The Ca2+ is transported between these compartments by diffusion (Jtr). Ca2+ fluxes between SRuptake and cytosol are passive diffusion (leak) and Ca2+ uptake by SERCA. In the SRrelease compartment, Ca2+ is buffered by calsequestrin. Ca2+ is released from SRrelease to the cytosol via ryanodine receptors (RyR). The inset shows a real cultured rat neonatal ventricular cell loaded with Fluo-4 Ca2+ indicator in a confocal microscope (scale bar, 5 μm). The nucleus (black area in the center) and the surrounding cytosol with Fluo-4 signal can be seen.
Sarcolemmal ion channels
L- and T-type Ca2+ currents
Both L- and T-Type Ca2+ channels (ICaL and ICaT, respectively) are functionally expressed in cultured neonatal ventricular rat cardiomyocytes (14,21), providing a voltage-activated Ca2+ intrusion to the cell. The model of ICaL is described by the equation
| (1) |
which is adapted from the model of Tusscher et al. (5). The model has one voltage-dependent activation gate (d) and two inactivation gates for voltage-dependent inactivation (f) and for [Ca2+]i-dependent inactivation (fCa). The steady-state curves for the voltage-dependent gates (d and f) were set to those recorded from 3-day-cultured ventricular neonatal rat cardiomyocytes (21). The time-constant curve of f was scaled to correspond to the experimental value for slow Ca2+-independent inactivation (21). The Ca2+-dependent inactivation is rapid (1), and thus, the time constant for fCa was set to the same as the fast component of the experimental ICaL inactivation (21).
Our model simulates the spatial Ca2+ gradients within the cytosol and the Ca2+-dependent inactivation of ICaL was set to depend on the subsarcolemmal [Ca2+] ([Ca2+]subSL). The Ca2+-dependent inactivation of the ICaL model was originally formulated to depend on the total cytosolic [Ca2+]i in the common-pool cytosol (5). The [Ca2+]subSL increases to higher values more quickly than the total cytosolic [Ca2+]i, and thus, we adjusted the original steady-state curve of the Ca2+-dependent inactivation (5) to higher [Ca2+] values (Fig. 2 A).
Figure 2.
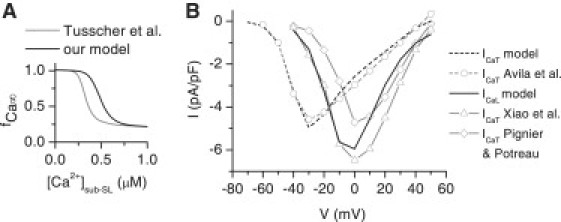
Properties of voltage-activated Ca2+ currents of the model. (A) The steady-state curve for the Ca2+-dependent inactivation gate of the ICaL model versus the cytosolic Ca2+ concentration below SL (sub-SL) in our model (black) and in the model of Tusscher et al. (gray) (5). (B) The I/V relations of ICaT and ICaL. The simulated I/V relation of ICaT (black dashed line) is compared to the I/V relation recorded by Avila et al. (14) (gray circles with dashed line). The simulated I/V relation of ICaL (black solid line) is compared to the I/V relations recorded by Xiao et al. (gray triangles with solid line) (22) and Pignier and Potreau (gray diamonds with solid line) (21). The I/V relation of Xiao et al. is constructed from their peak current in neonatal cells and the normalized I/V relation for adult myocytes, which is, according to Xiao et al., the same for neonatal cells (22). The ICaT was simulated as an individual ion channel model with the environmental conditions of Avila et al. (14). The simulated ICaL was taken from the voltage-clamp simulation of the whole myocyte model to provide a realistic sub-SL [Ca2+]i contribution to the Ca2+-dependent inactivation of the ICaL, as is the case in the experimental whole-cell voltage-clamp data. The error bars of the experimental data were left out to clarify the figure.
The maximum conductance for ICaL (GCaL) was fitted to reproduce the SL-originated cytosolic [Ca2+] signals observed in our experiments (see Results). In the voltage-clamp simulation, the fitted conductance produced an I/V relation and peak current of −5.9 pA/pF, which are in line with the I/V relations and peak currents measured from 3- to 5-day-cultured rat neonatal ventricular cardiomyocytes (−5.3 ± 0.5 pA/pF (21) and −6.6 ± 0.5 pA/pF (22); Fig. 2 B).
The model of the T-type Ca2+ channel is described by the equation
| (2) |
which is adapted from the model by Dokos et al. (4). The steady-state curves for activation (b) and inactivation (g), the maximum conductance (GCaT), and the reversal potential of the current were fitted to the data from 2- to 3-day-cultured cardiomyocytes (14) (Fig. 2 B).
Na+/Ca2+ exchanger
The model of the Na+/Ca2+ exchanger (NCX) was taken from the adult rat ventricular myocyte model of Pandit et al. (6). Fitting of the magnitude of INCX was based on its effects on the decay of the Ca2+ transient, resting potential (RP) and the duration of the AP.
Background currents
Background Na+ and Ca2+ leak currents (INab and ICab) were modeled as linear ohmic currents. These currents represent the leak of these ions through the SL via nonspecific routes. The magnitudes were set to reproduce physiologically relevant diastolic concentrations and correct RP.
Na+/K+ ATPase
The model of NaK ATPase was taken from the Luo and Rudy model (7) and fitted to maintain physiologically correct intracellular Na+ and K+ concentrations.
Fast Na+ current
The model of the fast Na+ current (INa) is from the Pandit et al. model (6). The maximum conductance of the current was fitted to reproduce AP amplitude comparable to our experimental data.
Hyperpolarization-activated current
The model of the hyperpolarization-activated current (If) carried by Na+ (20%) and K+ (80%) is described by the equation
| (3) |
which is adapted from the Pandit et al. model (6). The steady-state and time-constant curves for the gate y (Fig. 3 A) were estimated from Fig. 2 C of Shi et al. (23). This reproduces the If current with an approximately −70 mV activation threshold (Fig. 3 A), in line with the experimental data (24). The maximum conductance (Gf) was fitted to reproduce the current density of −0.71 ± 0.23 pA/pF at −95 mV (24) (Fig. 3 A). The data in these two studies (23,24) were recorded from 5- to 7-day-cultured rat neonatal ventricular cardiomyocytes.
Figure 3.
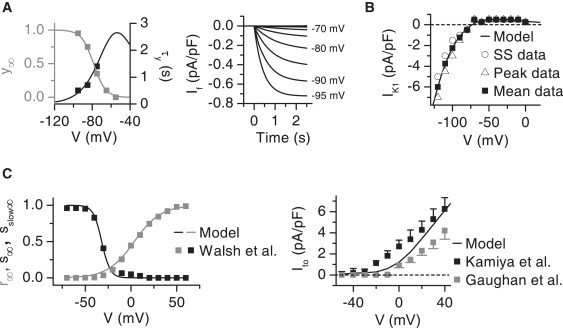
Properties of the pacemaker current (If) and repolarizing potassium currents. (A, left) The voltage-dependent steady-state curve (gray) and the activation time constant (black) of If in the model (solid lines) and in the experimental data of Shi et al. (squares) (23). (A, right) The simulated If current in the voltage-clamp experiment from a holding potential of −50 mV. At the time point of 0 s, voltage clamps were applied in the range of −55 mV to −95 mV with 5-mV intervals. Corresponding clamp voltages are shown with the current traces. The model of If was simulated in the conditions of Robinson et al. (24). (B) The I/V relation of the model of IK1 (solid line) compared to steady-state (SS), peak, and average of SS and peak current (symbols) measured by Wahler (25). The model of IK1 was simulated in the environmental conditions of Wahler (25). (C, left) The voltage-dependent steady-state activation (r∞, gray) and slow and fast (s∞, sslow∞, black) inactivation curves in the model (solid lines) and as recorded by Walsh et al. (squares) (26). (C, right) Simulated I/V relation of the peak Ito current (solid line) compared to those recorded by Kamiya et al. (black squares) (27) and Gaughan et al. (gray squares) (28).
Time-independent K+ current
The model of the time-independent K+ current (IK1) is described by the equation
| (4) |
which is adapted from the Bondarenko et al. model (2). The model was fitted to data measured from freshly isolated rat neonatal ventricular cardiomyocytes (25). This is justified since the IK1 does not change during 0–3 days of culturing (25). We fitted the IK1 model to the average of the measured peak and steady-state currents, because the IK1 model does not distinguish between these current types. This was considered reasonable as the difference between the peak and steady-state values is zero at membrane voltage (Vm) values above −90 mV and small at Vm values below −90 mV (Fig. 3 B).
Transient outward K+ current
The model of the transient outward current (Ito) is from the Pandit et al. model (6). The model is described by the equation
| (5) |
where r is the activation gate and s and sslow are the fast and slow inactivation components. The steady-state curves for the activation and inactivation gates were fitted to data from 3- to 4-day-cultured myocytes (26) (Fig. 3 C). The time-constant curves of the inactivation time constants and the fractions for fast and slow inactivation were scaled to compare values measured at +30 mV from 5-day-cultured myocytes (27). The maximum conductance was fitted to reproduce an I/V relation comparable to the experimental recordings from 3- and 5-day-cultured myocytes (27,28) (Fig. 3 C).
Slow and rapid delayed rectifier K+ currents
The slow and rapid delayed rectifier K+ currents (IKs and IKr) are present in rat neonatal ventricular myocytes (20,29). For modeling the IKs we used the Bondarenko et al. model (2) with a reduced activation time constant (based on the experimental IKs traces (29)). For modeling the IKr, we used the Wang et al. model (30) with the previously described reversal potential modification (2). The approximate magnitudes of IKs and IKr were fitted to the experimental values (20,29). As previously (5), due to the difficulties in recording IKr and IKs magnitudes accurately with the whole-cell voltage clamp (20,31), the final fitting of the magnitudes of these currents was based on their effect on the AP repolarization.
Sarcoplasmic reticulum
The SR was modeled to consist of two compartments, the release and the uptake compartments (SRrelease and SRuptake, respectively). The time taken by the diffusion from SRuptake to SRrelease provides a realistic delay for the uptaken Ca2+ to be available for the release again. The release compartment was assumed to be 10% of the total SR volume.
The Ca2+ flux between the SRuptake and cytosol is described by the Shannon et al. model for the SR Ca2+ ATPase (SERCA) and SR Ca2+ leak (32). The model of SERCA was fitted according to our Ca2+ transient decay measurements. In 4-day-cultured rat neonatal cardiomyocytes, the calsequestrin Ca2+ buffer is expressed in the SR (33). We assume that the calsequestrin is located near the ryanodine receptors (RyRs), as in adult cardiomyocytes (1). The Ca2+ is released from the SRrelease via RyR, which is described by the model of Sobie et al. (34) with two modifications. 1), In our model, the RyR represents the average behavior of all RyR molecules. The “coupling” factors used by Sobie et al. to model an RyR cluster constructed from several individual RyR models were thus removed. 2) The model of Sobie et al. includes regulation of the RyR openings by the cytosolic Ca2+ concentration near the SR ([Ca2+]subSR) and the [Ca2+]SR-release. The linear dependence of the Km for [Ca2+]subSR from [Ca2+]SR-release was replaced with sigmoidal dependence (Appendix, Eq. 88). We consider it more realistic that the Km for [Ca2+]subSR tends to saturate at low and high [Ca2+]SR-release values. The RyR parameters were fitted to provide Ca2+ release and Ca2+ transients comparable to those in our experiments. The size of the SR and the amount of calsequestrin were fitted to reproduce the Ca2+ storing capacity as evaluated by experimentally determined caffeine-induced Ca2+ transients.
Cytosol
Ca2+ diffusion between the SL and the perinuclear SR is amplified with local calcium-induced calcium releases (CICRs) (see Results). The Ca2+ travels thus via fire-diffusion-fire propagation (35). The model for the fire-diffusion-fire Ca2+ propagation is
| (6) |
where c is [Ca2+]i, r is the spatial coordinate in cytosol, βi is the function determining Ca2+ buffering, DCa-cytosol is the diffusion coefficient of Ca2+ in cytosol, and JCa is the SR Ca2+ flux when r is rSR, the SL Ca2+ flux when r is rSL, and zero with other values. Jrelease and Juptake are the release and uptake Ca2+ fluxes at each spatial release site between the SR and SL (35,36). However, due to the lack of experimental data on Ca2+ dependence, spatial distribution, activation and inactivation kinetics, and the rate of Ca2+ uptake and release fluxes at the spatial release sites (Jrelease and Juptake), the models for these release sites would require several equations and parameters without experimental justification. Thus, we simplify the Ca2+ diffusion equation to
| (7) |
where
| (8) |
and DCa is fitted to a single numerical parameter (DCa = 7 μm2/ms (see Table 5)) based on our data on the Ca2+ propagation velocity in cytosol. The DCa in this study, therefore, does not represent the diffusion coefficient of free Ca2+ diffusion in the cytosol (DCa-cytosol), but also includes the average CICR-induced (ryanodine-sensitive (see Fig. 6)) amplification of the diffusion (left term of the sum on the right of Eq. 8). Equation 7 is used in spherical coordinates with the radial symmetry assumption in the model cell (see Appendix).
Figure 6.
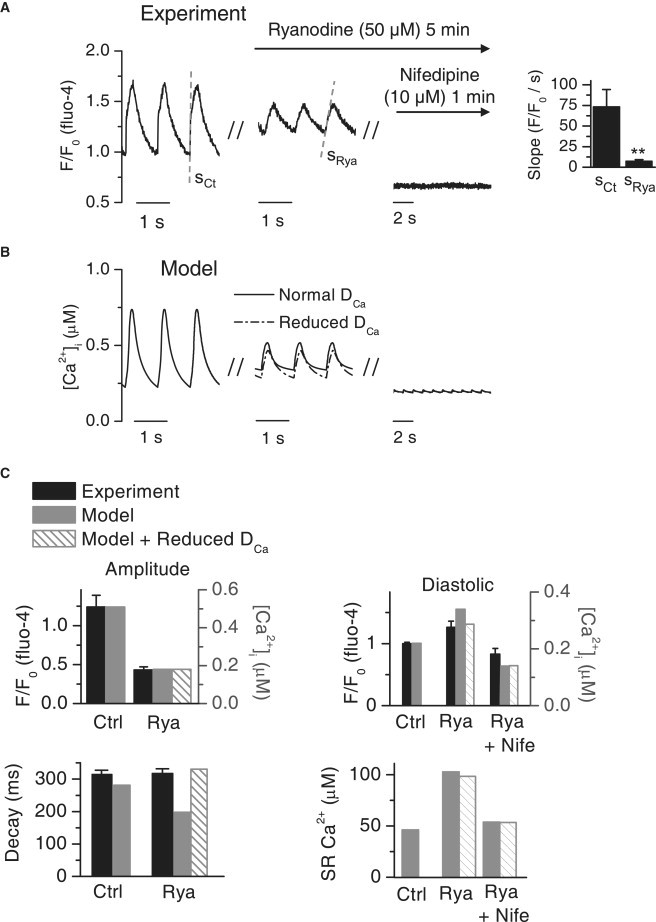
The experimental and simulated effects of ryanodine and nifedipine on the cytosolic Ca2+ signals. (A) Average cytosolic Ca2+ was recorded from a single cardiomyocyte during 1-Hz pacing using the line-scan method (left). The middle panel shows the Ca2+ signal from the same cell after 5 min perfusion of ryanodine (50 μM). After this, the ryanodine perfusion was continued with nifedipine (10 μM), and after 1 min of perfusion, the Ca2+ signal was recorded from the same cell (right). The average value of the initial slope of the Ca2+ transient (dashed gray line) in control conditions and after exposure to ryanodine (right, n = 14, ∗∗p < 0.01). (B) The experiment was reproduced by simulation with the model (see Methods). The effects of ryanodine and ryanodine + nifedipine were simulated with the DCa fitted to our data (normal, solid line) and with the DCa in water (reduced, dash-dotted line). The figure shows the average cytosolic Ca2+ from the simulations. (C) The simulated data with normal DCa (solid gray bars) and with reduced DCa (gray-hatched bars) and the average experimental data (black bars) from the experiments (n = 14). The left panels show the Ca2+-transient amplitude and decay in control conditions and after exposure to ryanodine. The upper right panel shows the diastolic [Ca2+]i in control, with ryanodine, and with ryanodine + nifedipine. The lower right panel shows the simulated diastolic SR Ca2+ content in cytosol volume in control, ryanodine, and ryanodine + nifedipine conditions.
In the cytosol, Ca2+ is buffered with troponin C (TnC) and calmodulin (CMDN), which were assumed to be stationary. In neonatal rat ventricular myocytes, the cytosolic Ca2+ buffering capacity is significantly smaller than in adult rat ventricular myocytes (37). During cardiomyocyte development, the lower cytosolic Ca2+ buffering capacity is caused mostly by a lower TnC concentration (38). If the amount of TnC is considered to depend on the amount of myofibrils, the cultured rat neonatal ventricular myocytes contain 40–64% of TnC/cell volume compared to freshly isolated adult rat ventricular myocytes (15,39). Based on these data, we used 50% of the value for TnC concentration compared to the estimate of 70 μM generally used in myocyte models (7). In some simulations, the cytosolic Ca2+ buffering to 1 mM EGTA was simulated using previously published kinetic parameters (40). Since Ca2+ binding to EGTA is very slow compared to other Ca2+ buffers in cytosol, we did not use the rapid buffering approximation for EGTA (1,7).
Simulations of the model
Our model is a combined system of one partial differential equation (PDE) and a system of ordinary differential equations (ODEs). In simulations, the PDE part of the model was approximated to a system of ODEs (see Appendix). Thus, we were able to simulate the complete model with the “ode15s” Matlab 6.5 (The MathWorks, Natick, MA) solver for stiff ODEs. The simulation results were analyzed with Origin 7.5 (OriginLab, Northampton, MA) and Matlab 6.5 (The MathWorks).
The model was driven by a 1-Hz stimulus current (Istim, −80 pA/pF, 0.5 ms), except in Figs. 2 and 3, where the cell model or models of individual ion channels were driven with the voltage-clamp protocol. The stimulus current was set to be carried by K+ ions (41). The model was driven to the steady state by applying the stimulus until the intracellular ion concentrations were stable. The temperature and the extracellular ion concentrations were the same as in our experiments (32°C = 305 K, [Na+]o = 154.578 mM, [K+]o = 5.366 mM, [Ca2+]o = 1.796 mM) unless stated otherwise.
The effects of ryanodine (50 μM) and nifedipine (10 μM) were simulated by setting RyR Ca2+ flux and ICaL, respectively, to zero. The effect of caffeine (10 mM) was simulated by setting the diffusion rate of RyR Ca2+ flux to a large constant value (see Appendix). The SERCA Ca2+ flux was set to zero as the Ca2+ is extruded almost completely with SL mechanisms when caffeine is applied to cardiomyocytes (1). The increment of diffusion distance was simulated by increasing the rSL, whereas the nucleus and SR dimensions remained constant. The SL ion current densities (current/membrane area) were kept constant.
Data analysis
Data analysis was made using Clampfit 9.2 (Axon Instruments), Origin 7.5 (OriginLab) and Matlab 6.5 (The MathWorks). Matlab's second-order Butterworth low-pass filter was used when necessary in the analysis of Ca2+ recordings. Decay of the Ca2+ transient was defined as the time required for 2/3 decline of the Ca2+ transient amplitude. The experimental data is expressed as the mean ± SE.
Results
Action potential
The major difference between APs of adult and neonatal rat ventricular myocytes is the significantly longer repolarization phase in neonatal cells (∼150–300 ms) compared to adult cells (∼50–70 ms) ((42), our data in Fig. 4 A and Table 1, and data in the literature (20,28,43)). The simulated AP of the cultured neonatal rat ventricular myocyte is initiated by INa peaking at −78.9 pA/pF (Fig. 4, B and C). This triggers an AP with an amplitude of 92.0 mV, in line with our experimental result (Table 1). The depolarization activates the L-type Ca2+ current, which further depolarizes the cell membrane and initiates Ca2+ intrusion to the cell (Fig. 4 C). Although a significant amount of functional T-type Ca2+ current is present in the model cell (Fig. 2 B), it plays a minor role compared to the L-type Ca2+ current in shaping the simulated AP (Fig. 4 C). The net Ca2+ intrusion via the T-type Ca2+ channel is 7.7% of the Ca2+ intrusion via the L-type Ca2+ channel. In addition to the ICaL, NCX provides a significant Ca2+ intrusion (69% compared to ICaL) to the cell from 0 to 182 ms in the beginning of the AP (Fig. 4 C). In addition to the actively regulated Ca2+ intrusion, neonatal cardiomyocytes have a background Ca2+ current, the magnitude of which is −0.15 pA/pF or less over the cycle. However, even though the magnitude of ICab is small, the integral of Ca2+ intrusion via ICab is large, since the current is constantly active throughout the ECC cycle. Taken together, the fractions for Ca2+ intrusion are 32.0% (INCX in the Ca2+ intrusion mode), 46.6% (ICaL), 3.6% (ICaT), and 17.7% (ICab). The SL Ca2+ intrusion via these channels is balanced by the INCX in the Ca2+ extrusion mode. This occurs 182 ms from the beginning of the AP, when the INCX generates a negative depolarizing current (Fig. 4 C).
Figure 4.
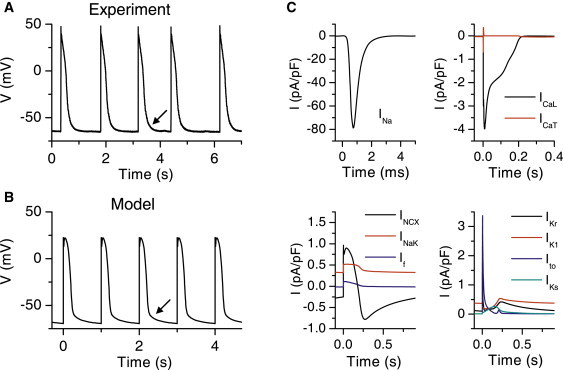
Action potential features and contributing currents of the neonatal cardiomyocytes. (A) Trace of APs recorded from a spontaneously beating rat neonatal cardiomyocyte culture. (B) Trace of simulated APs from 1-Hz pacing of the cell model. In A and B, the arrows indicate the slow repolarization at the end of the experimental and simulated AP. (C) Underlying simulated SL membrane ion currents during AP (see text and Fig. 1 legend for abbreviation definitions).
Table 1.
Simulated and experimental action potential parameters
| Magnitude | Model | (+ EGTA) | Experiment |
|---|---|---|---|
| RP | −69.4 mV | (−64.1 mV) | −67.1 ± 1.9 mV (n = 10) |
| Action potential amplitude | 92.0 mV | (82.0 mV) | 87.8 ± 5.3 mV (n = 15) |
| APD25 | 153.9 ms | (135.6 ms) | 122.9 ± 10.8 ms (n = 15) |
| APD50 | 192.7 ms | (218.0 ms) | 197.1 ± 12.1 ms (n = 15) |
| APD80 | 232.6 ms | (246.4 ms) | 264.3 ± 13.4 ms (n = 15) |
The K+ currents involved in the repolarization of the simulated AP are IKr, IK1, Ito, and IKs (Fig. 4 C). These currents produce a simulated AP repolarization and duration comparable to those in our experimental data (Fig. 4, A and B, and Table 1). The AP durations at 25, 50, and 80% repolarization (APD25, APD50, and APD80) are in agreement with the experimental values. Also, the slow repolarization phase at the very end of the experimental AP is reproduced in the simulated APs (Fig. 4, A and B). The simulated Ito activates rapidly and provides a repolarizing peak current of 3.4 pA/pF at 3.6 ms after initiation of the AP (Fig. 4 C). The IKs starts to activate slowly at the very beginning of the AP and reaches its maximum of 0.26 pA/pF at 154 ms, after which IKs is inactivated. The amplitude of IKs is small and has a minor impact on the APD; without IKs APD50 is 37 ms longer than in the normal cell (data not shown). The IKr and IK1 show similar activity at the end-phase of the repolarization of the AP, with maximum values of 0.42 pA/pF and 0.54 pA/pF, respectively, at 220–230 ms. After the AP is repolarized, IKr inactivates, whereas IK1 remains active at negative membrane potentials, thus contributing to the RP regulation. Other contributors to the RP are the INCX, INaK, and the background Ca2+ and Na+ currents (data not shown). The simulated RP (−69.4 mV) is in agreement with our experimental data (Table 1). In addition to the RP regulation, the main function of the INaK is to maintain the intracellular Na+ and K+ concentrations at physiologically relevant values of 13.8 mM and 151 mM, respectively. The simulated [Na+]i is in line with the experimental values of 15.1 ± 4.0 mM and 11.3 ± 5.0 (44) and ∼16 mM (estimated from Fig. 4 B of Hayasaki-Kajiwara et al. (45)). The high [Na+]i explains the large amount of Ca2+ intrusion via NCX (1,46). We further estimated the possible effect of the Ca2+ buffer EGTA, present in the patch-clamp pipette, on our AP characterization. Based on our simulation, however, EGTA makes only a minor contribution to the AP parameters (Table 1).
The individual neonatal cells are quiescent, but after a few days of culturing, the confluent culture of cells shows rhythmic contractions. Our model cell was also quiescent, because the steady-state activation range and the amount of the pacemaker current (If) (Fig. 3 B) (23,24) are such that If makes no contribution to the RP, nor is it capable of triggering spontaneous action potentials or even detectable Vm depolarizations. Since the modeled electrophysiological properties of the cell membrane represent the averages of those defined experimentally (see Methods), this might suggest that in culture only a small fraction of cells are differentiated enough to initiate APs spontaneously, which would then spread in culture and trigger the APs in the quiescent cells. In line with this, most of the neonatal ventricular myocytes are quiescent when cultured individually or at a sparse density (47–49).
Ca2+ diffusion and SR Ca2+ release
In adult ventricular cardiomyocytes, the voltage-activated Ca2+ channels at the SL and at the invaginations of the SL (T-tubules) are spatially tightly coupled with the RyRs of the SR. This provides a rapid three-dimensionally uniform CICR in the whole cardiomyocyte (1). The neonatal cells, especially when cultured on laminin dishes, lack a proper T-tubule system (1,15). Thus, in neonatal cells, the SL ion channels are located almost completely at the non-T-tubule surface of the SL. On the other hand, based on the immunostaining of SR proteins SERCA2a (16) and RyR (50), the majority of SR is located far from the SL on the perinuclear area. Therefore, the Ca2+ entering via the SL has to diffuse a relatively long distance to activate Ca2+ release from the SR.
We recorded the spatial distribution of Ca2+ within the cultured neonatal rat cardiomyocyte at the time of electrical excitation. We found that the Ca2+ entering the cell via the SL during an AP diffuses 4.5 ± 0.8 μm at a velocity of 0.31 ± 0.07 μm/ms (n = 4) in the cytosol (Fig. 5 A). A similar diffusion velocity (0.269 ± 0.015 μm/ms) has been measured in atrial cardiomyocytes (51), which also lack T-tubules. In the model, the diffusion distance between the SR and SL (4.5 μm) and the Ca2+ diffusion velocity (0.30 μm/ms) agree with the experimental values. With this speed of diffusion, it takes 15 ms before the SL Ca2+ influx initiated by the AP reaches the surface of the SR and triggers the SR Ca2+ release (Fig. 5 B). To obtain this diffusion velocity, the diffusion coefficient (DCa) was set to 7 μm2/ms, which is 10-fold in order of magnitude compared to the DCa in water (0.79 μm2/ms (52)) or that estimated to be in cytosol (∼1/2 the DCa in water (53)). This might suggest that the Ca2+ diffusion in the cultured rat neonatal myocytes is amplified by smaller local CICRs during the Ca2+ propagation, as in adult atrial myocytes (1,51,54). The amplitudes of sub-SL and sub-SR Ca2+ transients were equal in the experiments, as the average amplitude relation (SL/SR) was 0.98 ± 0.02 (n = 4). This feature is reproduced in our model as the same relation in simulation is 0.93. The absolute values for simulated [Ca2+]i are ∼0.2 μM in diastole and ∼0.7 μM in systole. These values are in line with the general estimates of absolute [Ca2+]i in cardiac muscle cells (1).
Figure 5.
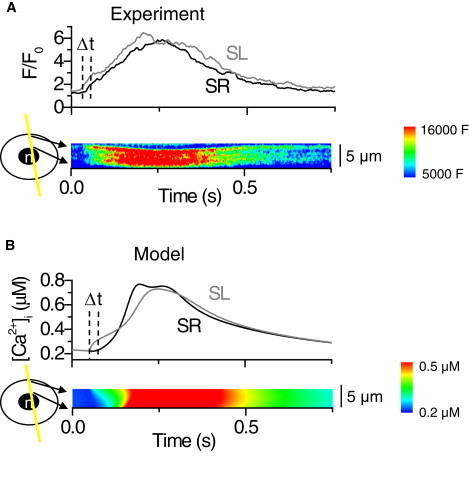
Spatiotemporal distribution of the cytosolic calcium during excitation. (A) Line-scan recording of Ca2+ diffusion within the cytosol. The contour plot shows the radial distribution of cytosolic Ca2+ in a single cardiomyocyte after electrical excitation of the cell. (B) The experimental recording reproduced by the model. The contour plot shows the simulated cytosolic Ca2+ after electrical stimulation of the model cell. The upper panels in A and B show the traces of Ca2+ signals near the SR and nuclear region (SR, black line) and near the cell membrane (SL, gray line). Dashed vertical lines indicate the time delay for the Ca2+ diffusion from sub-SL to sub-SR.
From the line-scan images of radial Ca2+ concentration (Fig. 5, A and B) in both the experiment and the model simulation, the last region where Ca2+ concentration reaches the maximum (red) is located halfway between the SR and SL. This suggests that after a small amount of Ca2+ has diffused to the sub-SR region from SL, it induces a Ca2+ release from the SR via RyRs. Subsequently, for a period of time during excitation, Ca2+ enters the cytosol from both the SL and SR sides and diffuses from these sources toward the central region of the cytosol.
In adult rat ventricular myocytes, ∼90% of the Ca2+-transient Ca2+ is released from the SR (1), and subsequently, inhibition of SR release by blocking SERCA suppresses cell shortening by 90% (55). Cultured rat neonatal ventricular myocytes express the necessary proteins for SR Ca2+ storing (33), release (50), and uptake (16) and therefore, neonatal cells are capable of producing SR Ca2+ release, but this release is not very well developed, nor is it a prerequisite for cytosolic Ca2+ transients. For example, neonatal cardiomyocytes with genetically downregulated SERCA2 expression generate Ca2+ transients upon electrical excitation by Ca2+ influx through the SL (16). To verify the contribution of Ca2+ release from the SR to the cytosolic Ca2+ transients, we recorded the average cytosolic Ca2+ signals while modifying the Ca2+ sources to cytosol. A large concentration of ryanodine (50 μM) was used to inhibit SR Ca2+ release via RyR. The cells lacking SR Ca2+ release showed on average 0.37 ± 0.04-fold Ca2+-transient amplitude and 1.3 ± 0.1-fold diastolic [Ca2+]i compared to control conditions (Fig. 6, A and C). Thus, the SR Ca2+ release plays a significant role in the Ca2+ signaling of neonatal myocytes, but the cells are also capable of producing competent Ca2+ signals with only SL Ca2+ influx. The Ca2+ signals in the cells with inhibited SR Ca2+ release were immediately stalled with the application of the L-type Ca2+ channel blocker nifedipine (Fig. 6 A). The application of nifedipine also reduced the diastolic [Ca2+]i to, on average, 0.83 ± 0.09-fold that of controls (Fig. 6 C, upper right).
The model cell produced Ca2+ signals without SR Ca2+ release via RyR (Fig. 6 B), just like neonatal cardiomyocytes in the experiments. When the RyRs are blocked, the model cell provides the Ca2+ intrusion to the cytosol via the L-type Ca2+ channel and NCX. The simulated effect of ryanodine produced a decrease in Ca2+-transient amplitude (0.35-fold) and increase in diastolic [Ca2+]i (1.5-fold) similar to those of the experiments (Fig. 6 C). The simulation of the concerted effect of nifedipine and ryanodine inhibited the Ca2+ signals and reduced diastolic [Ca2+]i (0.64-fold), as in the experiments (Fig. 6 C). In these conditions, the Ca2+ intrusion via NCX at positive membrane voltages is also reduced significantly as the inhibition of the L-type Ca2+ channel extinguishes the plateau phase of the AP (data not shown).
It has been suggested that in atrial myocytes, propagation of the Ca2+ signal within the cytosol is amplified by local CICRs (54). In support of this suggestion, Ca2+ diffusion velocity in the cytosol is reduced if SR Ca2+ releases are inhibited (51). In the global Ca2+ transient, the amplified Ca2+ diffusion accounts for the initial slope, whereas the Ca2+ release from the central regions of the cell accounts for the secondary slower component (54). Just as in atrial myocytes, the upstroke of the Ca2+ transients of neonatal cardiomyocytes has two distict components (Fig. 6 A), as well as a distinct diffusion pattern in the linescan images (Fig. 5 A), suggesting that cytosolic Ca2+ diffusion and Ca2+ release in neonatal cardiomyocytes might resemble those in atrial myocytes. In addition, the Ca2+ diffusion velocity of the neonatal cells is significantly higher than expected. We therefore tested whether inhibition of CICR reduces the Ca2+ diffusion velocity in neonatal myocytes in a manner similar to that in atrial cardiomyocytes (51). When we inhibited the CICR with ryanodine, not only was the amplitude of the calcium transients decreased, but also the slope of the [Ca2+] rise was reduced by ∼85%, suggesting that Ca2+ diffusion might be amplified by propagating local CICRs (Fig. 6 A). Based on this, we tested in our model how the altered diffusion velocity changes the global Ca2+ signals. We ran the same RyR and RyR + ICaL block simulations as described above, with the DCa reduced to the value in water (0.79 μm2/ms (52)), simulating nonamplified diffusion. With the reduced DCa we obtained better agreement between our simulated and experimental results for the effects of ryanodine. The decay of the Ca2+ did not decrease as it did with normal DCa (Fig. 6 C). In fact, the decay increased slightly with reduced DCa, suggesting that some of the amplified diffusion might have been still present in the experiment. Also the diastolic Ca2+ with ryanodine compared better with the experimental value when we used the reduced DCa (Fig. 6 C). Other simulated Ca2+ signaling parameters were the same with normal and reduced DCa (Fig. 6 C).
The simulated inhibition of SR Ca2+ release leads to the accumulation of Ca2+ in the SR (Fig. 6 C), and consequently, SERCA cannot pump Ca2+ against the increased concentration gradient between the SR and cytosol. This leaves NCX as the only possible Ca2+ extrusion route during relaxation. Compared to control conditions, where Ca2+ is removed from both sides of the cytosol (SERCA and NCX), the Ca2+ now has to diffuse a longer distance (from the sub-SR to sub-SL) before it is extruded from the cell. This slows down the Ca2+ extrusion and leads to the accumulation of cytosolic Ca2+ and increased diastolic [Ca2+]i. Subsequently, when the Ca2+ intrusion to the cytosol is reduced significantly with nifedipine, the diastolic [Ca2+]i decreases (Fig. 6 C). The reduced cytosolic Ca2+ decreases the uptake flux of SERCA, and the SR Ca2+ content with ryanodine and nifedipine is returned to near the control value (Fig. 6 C).
The amount of the releasable Ca2+ stored in the SR was studied by emptying the SR Ca2+ to the cytosol after the SR Ca2+ content was normalized with 1-Hz pacing. The SR Ca2+ was emptied to the cytosol by the rapid application of 10 μM caffeine with SL Ca2+ intrusion prevented by the simultaneous application of 5 μM nifedipine. The amplitude of Ca2+ transients during 1-Hz pacing was 0.42 ± 0.05 F/F0 (fluo-3, n = 9), and the amplitude of caffeine-induced Ca2+ transients was 0.51 ± 0.05 F/F0 (fluo-3, n = 9) (Fig. 7, A and B). The average ratio for the caffeine/twitch Ca2+-transient amplitude was 1.26 ± 0.06. The SR Ca2+ storing capacity in our model is in good agreement with experiments, as the simulated ratio for the caffeine/twitch Ca2+-transient amplitude was 1.25 (Fig. 7, A and B).
Figure 7.
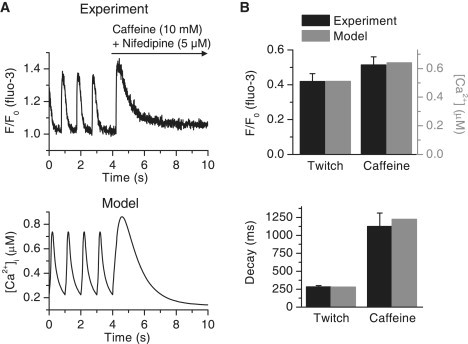
SR calcium stores of the neonatal cardiomyocytes. (A, upper) Cytosolic Ca2+ signal recorded from a single cell during 1-Hz electrical excitation. At 4 s, the pacing was stopped and caffeine (10 mM) and nifedipine (5 μM) were rapidly applied to the dish via the perfusion system. (Lower) Average cytosolic Ca2+ signal of the model when the experiment was reproduced in simulations. The model was paced at 1 Hz and at 4 s, the effect of caffeine and nifedipine was simulated (see Methods) with the pacing halted. (B) The parameters of Ca2+ transients from simulated data (gray) and from the experimental data (black, n = 9). (Upper) Normal and caffeine-induced twitch Ca2+-transient amplitudes. (Lower) Decays of the Ca2+ transients.
The functional amount of cytosolic Ca2+ extrusion mechanisms, the SERCA in the surface of the SR and NCX in the surface of the SL, can be analyzed by observing the decay of the Ca2+ transients. The Ca2+ released during the caffeine-induced Ca2+ release is removed completely by NCX (1). The experimental and simulated Ca2+ extrusion capacities of the NCX are in good agreement, as caffeine-induced Ca2+ transients have the same decay in both (Fig. 7 B). During a normal twitch, both SERCA and NCX are active. The extrusion capacity of SERCA is correct in our model, as SERCA and NCX (whose value in the model was fixed with the caffeine experiment) together produce a Ca2+ transient decay during a normal 1-Hz twitch similar to that of the real cells in our experiments (Fig. 7 B).
During one simulated 1-Hz Ca2+ transient, 17% of the SR Ca2+ content is released to the cytosol (Fig. 8, A and B). The [Ca2+]SR decreases mostly at the release compartment. This decrease inactivates the release as the open probability of the RyR model is regulated by the [Ca2+]SRrelease. The SERCA flux follows tightly the changes in cytosolic Ca2+ but is saturated at the highest cytosolic Ca2+ concentrations (Fig. 8 B). The uptaken cytosolic Ca2+ is diffused from the SR uptake compartment back to the SR release compartment (Jtr in Fig. 8 B). The [Ca2+]SRuptake decreases less than the [Ca2+]SRrelease because of the delay in diffusion between these compartments. The magnitude of passive Ca2+ leak from the SR to the cytosol is almost negligible compared to the RyR and SERCA Ca2+ fluxes (Fig. 8 B), as the SR Ca2+ content is balanced with the more realistic SERCA backflux rather than with an unrealistically large passive leak (32).
Figure 8.
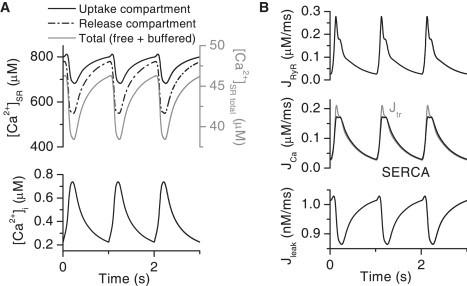
Simulated Ca2+ fluxes and Ca2+ content of the neonatal myocyte. (A) The average cytosolic Ca2+ transients (lower) compared to the corresponding SR Ca2+ concentration in the uptake compartment (solid black line) and in the release compartment (dash-dotted black line) during 1-Hz pacing of the model cell. The total (free + buffered) SR Ca2+ content in the cytosol volume is also plotted (gray solid line). (B) The underlying SR Ca2+ fluxes of the cytosolic and SR Ca2+ signals: Ca2+ release flux via RyR (upper), the SERCA uptake flux (black line (middle)) and the Ca2+ diffusion flux from SRuptake to SRrelease (Jtr,gray line (middle)), and the Ca2+ leak flux from SRuptake to cytosol (lower). The Ca2+ fluxes are within the cytosol volume.
The net Ca2+ fluxes between the SL and cytosol (JCaL + JCaT + JCab − JNCX) and between the SR and cytosol (JRyR + Jleak − JSERCA) maintain the Ca2+ homeostasis during one cycle (Fig. 9 A). Activation of the SL sources produces 10.5 μM Ca2+ intrusion to the cell, whereas activation of the SR sources produces 7.9 μM Ca2+ intrusion to the cell. During relaxation, the same amounts of Ca2+ are removed from the cytosol to the corresponding Ca2+ sources. Even though the amplitude of the simulated Ca2+ transient in the presence of ryanodine was 35% that of the control, the amount of Ca2+ intruding to the cytosol from SL sources is 57% of the total SR + SL Ca2+ intrusion. This difference is mostly due to the limited Ca2+ buffering capacity of the myocyte. When some of the buffering capacity of the cytosol is already occupied by the SL-originated Ca2+, a smaller amount of SR-originated Ca2+ is needed to further increase the free [Ca2+]i (Fig. 9 B). The analysis of free and buffered Ca2+ is further complicated by the spatial differences within the cytosol.
Figure 9.
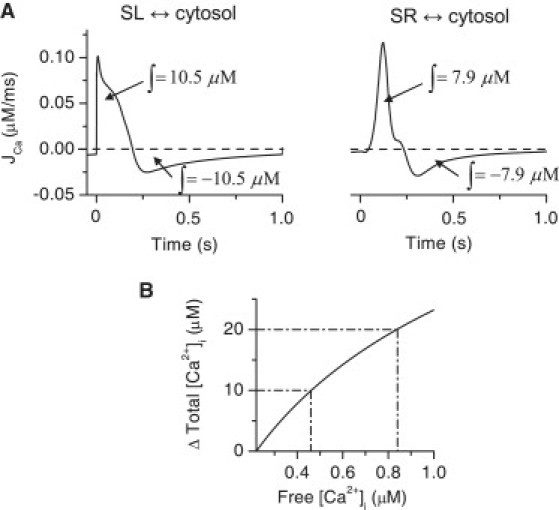
Simulated contributions of calcium fluxes to cytosolic Ca2+ transients of the neonatal cardiomyocytes. (A) The simulated net Ca2+ fluxes during one ECC cycle between the extracellular space (SL) and cytosol (JCaL + JCaT + JCab – JNCX (left)) and between SR and cytosol (JRyR + Jleak – JSERCA (right)). The integrals of the fluxes during activation and relaxation are shown in the figure. The concentrations are in cytosol volume. (B) The increment of total cytosolic Ca2+ content compared to the free [Ca2+]i starting from the diastolic value of free [Ca2+]i. The dash-dotted lines indicate the nonlinearity of the increment in free [Ca2+]i between the 0–10 μM and 10–20 μM increments in the total cytosolic Ca2+.
Increment of cytosol size in hypertrophy
An increase in cell size (hypertrophy) is involved in the development of cardiac failure (1). Although there are many discrepancies between the analyzed phenotypes of hypertrophied myocytes, changes generally observed in ECC are reduced Ca2+ transient amplitude and relaxation, reduced SR Ca2+ content, and prolonged APs. These changes are explained by altered gene expression levels and phosphorylation status of ECC proteins (1). Similar phenotypes and explanations have been reported in several studies where hypertrophy and underlying signaling cascades were studied in cultured rat neonatal ventricular myocytes (28,56,57). In addition to the changes in gene expression and ECC protein function, one aspect that must be considered in hypertrophied cultured neonatal myocytes is the change in cell geometry and dimensions. Neonatal myocytes lack the spatial coupling of ICaL and RyR, and thus the Ca2+ has to diffuse between the SL and SR surface for the CICR to occur (Fig. 5). This diffusion distance increases as the myocyte becomes hypertrophied. When we included the spatial dimension to cytosolic [Ca2+] in our model, we were able to simulate how the change in the Ca2+ diffusion distance between the SR and SL affects the ECC in cultured neonatal myocytes.
One obvious change in Ca2+ signaling when increasing the diffusion distance between the SL and SR is the increased diffusion time from the SL to SR (Fig. 10 A), which subsequently delays the activation of CICR. Increasing the diffusion distance causes several changes in the average cytosolic Ca2+ signals, which resemble those seen in hypertrophied myocytes. The amplitude of the Ca2+ transient decreases dramatically as the diffusion distance increases, leading to reduced contraction force. The decay of the Ca2+ transient increases, which leads to an increase in diastolic Ca2+ as the diastolic interval is too short for complete relaxation of the Ca2+ signal. The AP was slightly prolonged and the resting potential increased when the diffusion distance increased (14% and 4% increase, respectively, between 4.5 μm and 9 μm distance (Fig. 10 C)). The absolute SR Ca2+ content (the concentration in SR volume) did not change (Fig. 10 D). When scaling the SR Ca2+ content to the cytosol volume, as is done in experimental determination of SR Ca2+ content (Fig. 7) (1), the SR Ca2+ content decreases when the diffusion distance, and thereby the cytosolic volume, increases. In general, these results show that in addition to the altered gene expression levels, the phenotype of hypertrophied and failing cultured rat neonatal ventricular myocytes is shaped by the increased diffusion distance between the SL and SR, produced solely by the growth of the cells.
Figure 10.
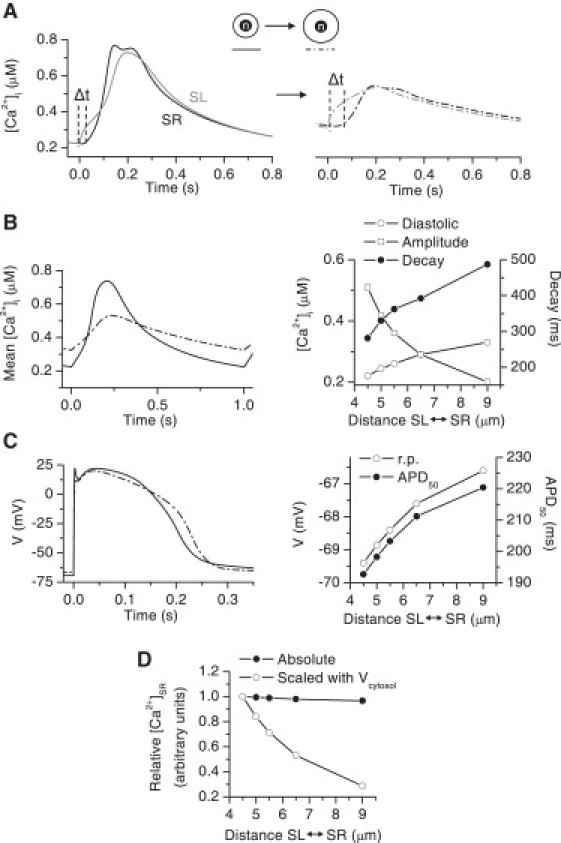
Simulated effect of the increase in diffusion distance between SL and SR on Ca2+ signaling and APs. (A) The sub-SR (black) and sub-SL (gray) cytosolic Ca2+ signals in a normal cell (left) and in a cell with a twofold diffusion distance (right). The Δt indicates the time delay in Ca2+ diffusion from the sub-SL to the sub-SR cytosolic region. (B) Average cytosolic Ca2+ (left) in a normal cell (solid line) and in a cell with a twofold diffusion distance (dash-dotted line). (Right) Diastolic [Ca2+]i, Ca2+-transient amplitude, and Ca2+-transient decay in cells with a diffusion distance between the control value (4.5 μm) and the twofold value (9 μm). (C) The AP in a normal cell (solid line) and in a cell with a twofold diffusion distance (dash-dotted line). (Right) RP and APD50 in cells with a diffusion distance between the control (4.5 μm) and twofold values (9 μm). (D) The absolute (black circles) and cytosol volume scaled (open circles) SR Ca2+ content in cells with a diffusion distance between the control value (4.5 μm) and the twofold value (9 μm). In both cases, the SR Ca2+ contents were scaled with the control values. In A–D, all phenotypes of the model cell were driven at 1-Hz pacing to the steady state.
Discussion
In this study, we developed a mathematical model of the excitation-contraction coupling of rat neonatal ventricular myocytes. This study reveals important consequences originating from the unique structural and functional features of the ECC of these cells. The long-AP, heterogeneous cytosolic Ca2+ signals and strong SL and weak SR Ca2+ cycling produce ECC that differs significantly from those of adult rat and other mammalian ventricular myocytes. These results provide an analysis of the limits of the neonatal cardiomyocyte as a general model of the cardiac cell, as well as information on ECC during cardiomyocyte development.
Diffusion and heterogeneity of cytosolic Ca2+
The most important and unique structural feature of cultured rat neonatal ventricular myocytes compared to adult cardiomyocytes is the lack of the T-tubule system (1,15). In adult mammalian ventricular cells, the fast, uniform, and efficient SR Ca2+ release is based on the tight spatial coupling between the L-type Ca2+ channels of the SL and the RyRs of the SR (1). These functional couplings are mostly located at the T-tubules, which are SL invaginations conducting the electrical excitation to the interiors of the cell. This geometric structure ensures simultaneous activation of L-type Ca2+ channels and CICR in the 3-D space of the cell, resulting in a uniform cytosolic Ca2+ transient. The neonatal ventricular myocytes lack the T-tubule system and consequently the distance between RyRs and voltage-activated Ca2+ channels is much longer than in adult ventricular cells (1). This leads to looser coupling and slower dynamics in CICR and less uniform Ca2+ signals within the cytosol (Fig. 5).
Several findings of this study propose that Ca2+ diffusion between the SL and perinuclear SR might be amplified with local CICRs, as is the case in atrial ventricular myocytes (1,51,54). According to our measurements, the Ca2+ diffusion velocity between the perinuclear SR and SL is comparable to the velocity measured in atrial myocytes by Sheehan and Blatter (0.31 ± 0.07 μm/ms and 0.269 ± 0.015 μm/ms, respectively (51)). To reproduce this diffusion velocity in our model, the diffusion coefficient for Ca2+ was fitted to a value ∼10-fold that in aqueous solutions and cytosol (7 vs. 0.79 μm2/ms (52) and ∼1/2 × 0.79 μm2/ms (53), respectively). Inhibition of CICR by ryanodine reduced the diffusion velocity in a way similar to that observed in atrial myocytes (54). In the model, the experimental Ca2+ signals without possible CICR-amplified diffusion were better reproduced with DCa reduced to the value in aqueous solutions. Based on these findings, it seems that Ca2+ diffusion in the cytosol of neonatal cardiomyocytes might be amplified by the local CICRs.
Sources of cytosolic Ca2+
In adult mammalian ventricular myocytes of most species, [Na+]i is in the range 4–8 mM, but for rat and mouse, [Na+]i is in the range 10–15 mM (58). Another feature that distinguishes rat and mouse from other mammalian species is the short AP in adult ventricular myocytes (∼10–70 ms (42,59) compared to, for example, ∼200–360 ms in rabbit, canine, and human cardiomyocytes (60–62)). The high [Na+]i in rat and mouse myocytes provides a possibility for Ca2+ intrusion via the NCX at high Vm values (1,63), but due to the short APs, the amount of intruded Ca2+ cannot be large. In other mammals, the lower [Na+]i prevents the NCX Ca2+ intrusion mode, although the long APs could provide a positive Vm, which would favor Ca2+ intrusion via the NCX. Neonatal cardiomyocytes have a high [Na+]i (44,45) and long APs (20,28,43) (Fig. 4 A and Table 1), which together favor large and long-lasting Ca2+ influx via the NCX. In the simulations of our model, the NCX contributed significantly to the SL Ca2+ intrusion during APs. The long AP also prolongs the open time of the L-type Ca2+ channel, resulting in a large Ca2+ intrusion. In cultured rat ventricular myocytes, the large Ca2+ intrusion via SL sources (ICaL and NCX) during APs explains their ability to produce Ca2+ signals without SR Ca2+ release (16) (Fig. 6).
In contrast to the stronger Ca2+ cycling via the SL, the SR Ca2+ handling capacity is much weaker in neonatal than in adult rat cardiomyocytes. However, in neonatal cardiomyocytes, SERCA and NCX are still the predominant Ca2+ extrusion mechanisms compared to mitochondria and SL Ca2+-ATPase (64). Based on experiments and modeling, the SR Ca2+ content in the cytosol volume is around two- to threefold smaller in neonatal than in adult rat cardiomyocytes (65–67). Also, the SR Ca2+ release and uptake capacity has to be significantly higher in the adult rat, because adult cytosolic Ca2+ transients originate almost completely from the SR (55). During each contraction, the adult rat cycles ∼78 μM of Ca2+ between the SR and cytosol (based on the fractional release and SR Ca2+ content of Delbridge et al. (66)). In our neonatal model, the amount of cycled Ca2+ between the SR and the cytosol is ∼10% of this value, whereas the total released Ca2+ from the SR and SL sources in our neonatal model is only ∼24% of the total Ca2+ release in adult rat. This smaller amount of Ca2+ is still sufficient to activate regular-sized Ca2+ transients due to the reduced buffering capacity in neonatal myocytes (see Methods). These numbers should not be considered quantitatively accurate, but they demonstrate roughly how the absolute amount of cycled Ca2+ during a twitch and the balance between SR and SL Ca2+ cycling is completely different in neonatal rat myocytes compared to adult rat myocytes. Inhibition of the SR and SL Ca2+ channels, pumps and exchangers thus produces different effects on the function of adult versus neonatal cardiomyocytes. Due to the smaller cytosolic buffering capacity in neonatal cells, the cytosolic Ca2+ signals are less tolerant of interferences in the Ca2+ sources. As a result, the activities of the Ca2+-dependent enzymatic pathways (68–70), which are essential to directing the cell's phenotype from postnatal to adult ventricular myocyte and to promoting cell growth, are subsequently more easily suppressed by interventions in Ca2+ signaling.
Hypertrophy
The gene expression levels of various Ca2+-handling proteins change in hypertrophy and cardiac failure (1) and also in cultured neonatal cardiomyocytes when exposed to growth-promoting agents or conditions (56,57). We hypothesized that apart from the gene expression changes, the growth of the cell itself will have an effect on cell signals in neonatal myocytes, where the spatial Ca2+ dynamics in cytosol play a central role in the function of the cell. Based on our simulations, an increased diffusion distance between the SR and SL alone induces changes in the function of the hypertrophic cardiomyocyte that resemble those commonly induced by altered gene expression during the development of pathological hypertrophy (1). The changes are most dramatic in Ca2+ signaling, where even a small increase in diffusion distance (from 4.5 μm to 5 μm, i.e., an 11% increase) was sufficient to change the Ca2+ signaling properties and SR Ca2+ content by a physiologically significant magnitude (∼10–20%). The increased diffusion distance increases the heterogeneity of cytosolic Ca2+ signals and slows down the diffusion through the cytosol. This results in slower activation and relaxation and flattening of the peak of the total average cytosolic Ca2+ transient. These changes are usually hallmarks of pathological hypertrophy and cardiomyocyte failure (1). The altered cytosolic Ca2+ signal interacts with SL ion channels and prolongs the AP. The magnitude of prolongation of the simulated AP (a 14% increase in APD50 with a twofold diffusion distance) was smaller than that reported in hypertrophied rat neonatal myocytes (a 42% increase in APD50) (28). This indicates that other changes also take place, such as the reported changes in ion current densities (28). However, based on our simulations, the increase in diffusion distance also contributes to prolonging of the AP. The simulated change in RP was small and nonsignificant, which is in line with the experimental results (28).
Our results show that the increase in diffusion distance alone plays an essential role in shaping the cytosolic Ca2+ signals and APs of hypertrophied neonatal cardiomyocytes. For complete modeling of hypertrophy, the relative growth of the nucleus and SR compared to the cytosol should be estimated and included in the model. However, the diffusion distance between the SL and SR (d = rSL − rSL in Fig. 1) always increases in hypertrophy if we assume that the cytosol, nucleus, and SR grow somewhat equally in proportion to each other. For example, a 20% growth (in diameter) of the cell and intracellular structures, regardless of the growth of the SR and nucleus, results in a 20% increase in diffusion distance,
| (9) |
which by itself shapes the Ca2+ signals and APs in hypertrophied myocytes, as we have shown.
Limitations of the study
A general problem in developing a model of cultured rat neonatal ventricular myocytes is the large variability in the observed phenotypes of these cells. The different culture conditions (15) and the age of the culture (14) have been shown to change various properties of these cells, such as the physical structure and the number of ion channels. The data used in model development comes from several different laboratories and it cannot be assumed that the culture conditions and times are identical. We cannot overcome the variability in culture conditions, but to minimize the age-related error, we used data obtained from cells cultured for 3–5 days whenever possible, as this is a culture time often used in experimental studies.
To model the measured Ca2+ diffusion in cytosol we had to use a higher value for the Ca2+ diffusion coefficient than previously reported in aqueous solution or cytosol. The apparent Ca2+ diffusion velocity was close to that measured for the Ca2+ wave propagation and much faster than free Ca2+ diffusion (51–53). One possible contributor to the measured Ca2+ diffusion velocity is the geometry of the studied cells (see below) and the direction of the Ca2+ wave propagation. When measuring the Ca2+ diffusion velocity with confocal line scanning, Ca2+ is assumed to diffuse in a vertical direction to the viewer (on the xy plane). However, in the 3-D cytosol of real cells, Ca2+ also diffuses in a direction parallel to the viewer (the z-direction), which will contribute to the 2-D speed of Ca2+ propagation in cells. Nevertheless, these measurements give a reasonable estimate of Ca2+ propagation in the particular observed 2-D plane within the 3-D cell (18,19,51,71). The model represents this complex phenomenon by means of linear radial diffusion (as in Fig. 5), which was fitted to correspond to the average Ca2+ propagation measured with line scanning. These issues related to the geometry of the cell cannot completely explain the high diffusion velocity. In our experiments, inhibition of the RyR did reduce the propagation velocity of the Ca2+ signal in cytosol. Based on our experiments, we cannot rule out the possibility that Ca2+ diffusion in neonatal cardiomyocytes could indeed be amplified with local CICRs, as reported in atrial cells of different species (1,51,54,72), but more experiments are needed to support our observations.
Modeling Ca2+ diffusion between the perinuclear SR and SL was complicated, because of the possibility that the diffusion might be amplified by local CICRs. There is not sufficient data available on Ca2+ dependence, spatial distribution, activation and inactivation kinetics, and rate of Ca2+ uptake and release flux at the spatial release sites to implement a fire-diffusion-fire model (35,36) of the cell cytosol. On the other hand, approximating DCa (Eq. 8) with a constant number is not optimal, since DCa depends on the local release and uptake fluxes and the Laplacian of the local [Ca2+]. This is seen when local fluxes are altered (Fig. 6). However, when the limitations are kept in mind, our model is able to reproduce the experimental spatial Ca2+ signals at the level of accuracy of the experiments (Fig. 5). We consider that a simple model that can reproduce the experimental data is a better choice than an extremely complex model with several assumptions, equations, and parameters without experimental basis.
The spherical shape of the model cell is a rough estimate of real cells. A more realistic estimation would be a flat ellipsoid, but this would exponentially increase the computational demands of the model. The description of diffusion would require three coordinates compared to the one needed for radial diffusion in a sphere. The Ca2+ would then have additional spatial differences in a direction parallel to the SL and SR surfaces, and the function of Ca2+-transporting ion channels would need to be calculated separately for all points of the SL and SR surface grid. The use of a spherical shape is thus a fair compromise between computational demand and accuracy of the model.
Despite these limitations, our model reproduces faithfully the ECC of cultured rat neonatal myocytes. The spherical shape and the experimental method of determining the spatial cytosolic Ca2+ signals seems to be an accurate approach for analyzing the ECC of these cells. Furthermore, the model has the general features common to all neonatal cells: 1), loose coupling between the RyR and the ICaL; and 2), a long AP with strong SL Ca2+ influx (1). Thus, it describes qualitatively the ECC in neonatal cells in general. We propose that the experimental and computational methods used here could be also adapted successfully for analyzing the ECC in other developing cardiomyocytes with a similar structure.
Conclusion
In this study, we have characterized the action potentials and Ca2+ signaling dynamics underlying the excitation-contraction coupling in cultured rat neonatal ventricular myocytes. We have shown, with experiments and modeling, that important differences exist between neonatal and adult cells. Compared to adult cardiomyocytes, neonatal cardiomyocytes have longer APs, heterogeneous cytosolic Ca2+ signals, the SL as a strong Ca2+ source with significant contribution via the NCX, and weaker SR Ca2+ handling. Structural differences between adult and neonatal cells also exist, and the ECC of these cells may be altered differently by structural changes such as hypertrophy. Distinction of these features will help us to understand the ECC of developing cardiac myocytes, as well as the limitations of cultured rat neonatal and other developing cardiomyocytes as a general model of the cardiomyocyte. Using the results and mathematical model presented here, more detailed studies of ECC can be made with these cell cultures.
We have presented what is to our knowledge the first mathematical model of ECC in rat neonatal ventricular myocytes, with a novel description of the SL membrane currents, SR Ca2+ dynamics, and spatial cytosolic Ca2+. This model faithfully describes the ECC of these cells and, as presented here, can be used also to study dysfunctions in ECC. From a more general viewpoint, we have introduced novel issues in myocyte modeling. With the aim of modeling neonatal myocytes reliably, we have developed the first integrated model of AP-generating SL ion currents, spatial cytosolic Ca2+ signals, and SR Ca2+-handling dynamics. Furthermore, our model is among the first models we know of that describes ECC in the field of developing cardiomyocytes.
Acknowledgments
We thank A. Rautio, J. Ronkainen and E. Kouvalainen for technical assistance and J. Takalo for valuable discussions on the model development.
This study was supported by the Finnish Heart Research Foundation, Academy of Finland, Orion-Farmos Research Foundation, Instrumentarium Science Foundation, Aarne Koskelo Foundation, and Sigrid Juselius Foundation.
Appendix: Model Equations
The model parameters are defined in Tables 2–5. Values in the equations are in units of mV for voltage, μM for concentrations, pl for volume, ms for time, μm for distance, pA/pF for current, and μM/ms (in a 1-pl volume) for fluxes. The scaling factors required for agreement of the units are shown within the equations.
Nernst potentials
| (10) |
| (11) |
| (12) |
SL membrane currents
L-type Ca2+ current
| (13) |
| (14) |
| (15) |
| (16) |
| (17) |
| (18) |
| (19) |
| (20) |
| (21) |
| (22) |
| (23) |
| (24) |
| (25) |
| (26) |
| (27) |
| (28) |
T-type Ca2+ current
| (29) |
| (30) |
| (31) |
| (32) |
| (33) |
| (34) |
| (35) |
Na+/Ca2+ exchanger
| (36) |
Background Ca2+ and Na+ currents
| (37) |
| (38) |
Na+/K+ ATPase
| (39) |
| (40) |
| (41) |
Fast Na+ current
| (42) |
| (43) |
| (44) |
| (45) |
if
| (46) |
| (47) |
and if
| (48) |
| (49) |
| (50) |
| (51) |
| (52) |
Hyperpolarization activated current
| (53) |
| (54) |
| (55) |
| (56) |
| (57) |
| (58) |
Time-independent K+ current
| (59) |
Transient outward K+ current
| (60) |
| (61) |
| (62) |
| (63) |
| (64) |
| (65) |
| (66) |
| (67) |
| (68) |
Slow delayed rectifier K+ current
| (69) |
| (70) |
| (71) |
| (72) |
| (73) |
| (74) |
Rapid delayed rectifier K+ current
| (75) |
| (76) |
| (77) |
| (78) |
| (79) |
| (80) |
| (81) |
| (82) |
| (83) |
| (84) |
| (85) |
| (86) |
| (87) |
Sarcoplasmic reticulum
Ryanodine receptors
| (88) |
| (89) |
| (90) |
| (91) |
| (92) |
SERCA
| (93) |
Leak flux
| (94) |
Ca2+ diffusion between SRuptake and SRrelease
| (95) |
Ca2+ concentration in SR
| (96) |
| (97) |
| (98) |
Cytosol
Na+ concentration
| (99) |
K+ concentration
| (100) |
Ca2+ concentration
In the following equations, c = [Ca2+]i
| (101) |
The general equation for Ca2+ diffusion in spherical coordinates with radial symmetry is
| (102) |
which is reduced to a system of ODEs for the simulation by approximating the radial derivatives with step lengths of Δr. I.e. the cytosol is divided into spherical cores with a thickness of Δr. To calculate the concentrations at the centers of these spherical cores we define a vector
| (103) |
Thus, jnΔr is the spatial coordinate for concentration cn. The system of ODEs for the Ca2+ diffusion with the reflecting boundary conditions at rSL and rSL and with SR and SL Ca2+ fluxes is
for n = 1
| (104) |
for n = 2,3,4,…, a − 1
| (105) |
for n = a
| (106) |
where a is the number of components in the vector j and
| (107) |
| (108) |
| (109) |
| (110) |
In some simulations, the flux to EGTA buffer (-JEGTAn) was added to Eqs. 104–106 in the place of JCa(r,t) in Eq. 102, and additional differential variables for the amount of bound Ca2+ ([EGTACa]) were calculated for n = 1,2,…a
| (111) |
| (112) |
References
- 1.Bers D.M. Kluwer; Dordrecht, London: 2001. Excitation-contraction coupling and cardiac contractile force. [Google Scholar]
- 2.Bondarenko V.E., Szigeti G.P., Bett G.C.L., Kim S.J., Rasmusson R.L. Computer model of action potential of mouse ventricular myocytes. Am. J. Physiol. Heart Circ. Physiol. 2004;287:H1378–H1403. doi: 10.1152/ajpheart.00185.2003. [DOI] [PubMed] [Google Scholar]
- 3.Tavi P., Han C.L., Weckstrom M. Mechanisms of stretch-induced changes in [Ca2+]i in rat atrial myocytes: role of increased troponin C affinity and stretch-activated ion channels. Circ. Res. 1998;83:1165–1177. doi: 10.1161/01.res.83.11.1165. [DOI] [PubMed] [Google Scholar]
- 4.Dokos S., Celler B., Lovell N. Ion currents underlying sinoatrial node pacemaker activity: a new single cell mathematical model. J. Theor. Biol. 1996;181:245–272. doi: 10.1006/jtbi.1996.0129. [DOI] [PubMed] [Google Scholar]
- 5.ten Tusscher K.H.W.J., Noble D., Noble P.J., Panfilov A.V. A model for human ventricular tissue. Am. J. Physiol. Heart Circ. Physiol. 2004;286:H1573–H1589. doi: 10.1152/ajpheart.00794.2003. [DOI] [PubMed] [Google Scholar]
- 6.Pandit S.V., Clark R.B., Giles W.R., Demir S.S. A mathematical model of action potential heterogeneity in adult rat left ventricular myocytes. Biophys. J. 2001;81:3029–3051. doi: 10.1016/S0006-3495(01)75943-7. [DOI] [PMC free article] [PubMed] [Google Scholar]
- 7.Luo C.H., Rudy Y. A dynamic model of the cardiac ventricular action potential. 1. Simulations of ionic currents and concentration changes. Circ. Res. 1994;74:1071–1096. doi: 10.1161/01.res.74.6.1071. [DOI] [PubMed] [Google Scholar]
- 8.Shannon T.R., Wang F., Puglisi J., Weber C., Bers D.M. A mathematical treatment of integrated Ca dynamics within the ventricular myocyte. Biophys. J. 2004;87:3351–3371. doi: 10.1529/biophysj.104.047449. [DOI] [PMC free article] [PubMed] [Google Scholar]
- 9.Wang L.J., Sobie E.A. Mathematical model of the neonatal mouse ventricular action potential. Am. J. Physiol. Heart Circ. Physiol. 2008;294:H2565–H2575. doi: 10.1152/ajpheart.01376.2007. [DOI] [PMC free article] [PubMed] [Google Scholar]
- 10.Korhonen T., Rapila R., Tavi P. Mathematical model of mouse embryonic cardiomyocyte excitation-contraction coupling. J. Gen. Physiol. 2008;132:407–419. doi: 10.1085/jgp.200809961. [DOI] [PMC free article] [PubMed] [Google Scholar]
- 11.Ronkainen V.P., Ronkainen J.J., Hannninen S.L., Leskinen H., Ruas J.L. Hypoxia inducible factor regulates the cardiac expression and secretion of apelin. FASEB J. 2007;21:1821–1830. doi: 10.1096/fj.06-7294com. [DOI] [PubMed] [Google Scholar]
- 12.Ronkainen J.J., Vuolteenaho O., Tavi P. Calcium-calmodulin kinase II is the common factor in calcium-dependent cardiac expression and secretion of A- and B-type natriuretic peptides. Endocrinology. 2007;148:2815–2820. doi: 10.1210/en.2006-1676. [DOI] [PubMed] [Google Scholar]
- 13.Seki S., Nagashima M., Yamada Y., Tsutsuura M., Kobayashi T. Fetal and postnatal development of Ca2+ transients and Ca2+ sparks in rat cardiomyocytes. Cardiovasc. Res. 2003;58:535–548. doi: 10.1016/s0008-6363(03)00255-4. [DOI] [PubMed] [Google Scholar]
- 14.Avila G., Medina I.M., Jimenez E., Elizondo G., Aguilar C.I. Transforming growth factor-β 1 decreases cardiac muscle L-type Ca2+ current and charge movement by acting on the Ca(v)1.2 mRNA. Am. J. Physiol. Heart Circ. Physiol. 2007;292:H622–H631. doi: 10.1152/ajpheart.00781.2006. [DOI] [PubMed] [Google Scholar]
- 15.Delcarpio J.B., Claycomb W.C., Moses R.L. Ultrastructural morphometric analysis of cultured neonatal and adult-rat ventricular cardiac-muscle cells. Am. J. Anat. 1989;186:335–345. doi: 10.1002/aja.1001860403. [DOI] [PubMed] [Google Scholar]
- 16.Seth M., Surnbilla C., Mullen S.P., Lewis D., Klein M.G. Sarco(endo)plasmic reticulurn Ca2+ ATPase (SERCA) gene silencing and remodeling of the Ca2+ signaling mechanism in cardiac myocytes. Proc. Natl. Acad. Sci. USA. 2004;101:16683–16688. doi: 10.1073/pnas.0407537101. [DOI] [PMC free article] [PubMed] [Google Scholar]
- 17.Periasamy M., Kalyanasundaram A. SERCA pump isoforms: their role in calcium transport and disease. Muscle Nerve. 2007;35:430–442. doi: 10.1002/mus.20745. [DOI] [PubMed] [Google Scholar]
- 18.Michailova A., DelPrincipe F., Egger M., Niggli E. Spatiotemporal features of Ca2+ buffering and diffusion in atrial cardiac myocytes with inhibited sarcoplasmic reticulum. Biophys. J. 2002;83:3134–3151. doi: 10.1016/S0006-3495(02)75317-4. [DOI] [PMC free article] [PubMed] [Google Scholar]
- 19.Haddock P.S., Coetzee W.A., Cho E., Porter L., Katoh H. Subcellular [Ca2+]i gradients during excitation-contraction coupling in newborn rabbit ventricular myocytes. Circ. Res. 1999;85:415–427. doi: 10.1161/01.res.85.5.415. [DOI] [PubMed] [Google Scholar]
- 20.Guo J., Massaeli H., Li W., Xu J.M., Luo T. Identification of I-Kr and its trafficking disruption induced by probucol in cultured neonatal rat cardiomyocytes. J. Pharmacol. Exp. Ther. 2007;321:911–920. doi: 10.1124/jpet.107.120931. [DOI] [PubMed] [Google Scholar]
- 21.Pignier C., Potreau D. Characterization of nifedipine-resistant calcium current in neonatal rat ventricular cardiomyocytes. Am. J. Physiol. Heart Circ. Physiol. 2000;279:H2259–H2268. doi: 10.1152/ajpheart.2000.279.5.H2259. [DOI] [PubMed] [Google Scholar]
- 22.Xiao Y.F., Gomez A.M., Morgan J.P., Lederer W.J., Leaf A. Suppression of voltage-gated L-type Ca2+ currents by polyunsaturated fatty acids in adult and neonatal rat ventricular myocytes. Proc. Natl. Acad. Sci. USA. 1997;94:4182–4187. doi: 10.1073/pnas.94.8.4182. [DOI] [PMC free article] [PubMed] [Google Scholar]
- 23.Shi W.M., Wymore R., Yu H.G., Wu J.Y., Wymore R.T. Distribution and prevalence of hyperpolarization-activated cation channel (HCN) mRNA expression in cardiac tissues. Circ. Res. 1999;85:E1–E6. doi: 10.1161/01.res.85.1.e1. [DOI] [PubMed] [Google Scholar]
- 24.Robinson R.B., Yu H.G., Chang F., Cohen I.S. Developmental change in the voltage-dependence of the pacemaker current, if, in rat ventricle cells. Pflug. Arch. 1997;433:533–535. doi: 10.1007/s004240050309. [DOI] [PubMed] [Google Scholar]
- 25.Wahler G.M. Developmental increases in the inwardly rectifying potassium current of rat ventricular myocytes. Am. J. Physiol. 1992;262:C1266–C1272. doi: 10.1152/ajpcell.1992.262.5.C1266. [DOI] [PubMed] [Google Scholar]
- 26.Walsh K.B., Sweet J.K., Parks G.E., Long K.J. Modulation of outward potassium currents in aligned cultures of neonatal rat ventricular myocytes during phorbol ester-induced hypertrophy. J. Mol. Cell. Cardiol. 2001;33:1233–1247. doi: 10.1006/jmcc.2001.1386. [DOI] [PubMed] [Google Scholar]
- 27.Kamiya K., Guo W.N., Yasui K., Toyama J. Hypoxia inhibits the changes in action potentials and ion channels during primary culture of neonatal rat ventricular myocytes. J. Mol. Cell. Cardiol. 1999;31:1591–1598. doi: 10.1006/jmcc.1999.0992. [DOI] [PubMed] [Google Scholar]
- 28.Gaughan J.P., Hefner C.A., Houser S.R. Electrophysiological properties of neonatal rat ventricular myocytes with α1-adrenergic-induced hypertrophy. Am. J. Physiol. 1998;275:H577–H590. doi: 10.1152/ajpheart.1998.275.2.H577. [DOI] [PubMed] [Google Scholar]
- 29.Munoz V., Grzeda K.R., Desplantez T., Pandit S.V., Mironov S. Adenoviral expression of I-Ks contributes to wavebreak and fibrillatory conduction in neonatal rat ventricular cardiomyocyte monolayers. Circ. Res. 2007;101:475–483. doi: 10.1161/CIRCRESAHA.107.149617. [DOI] [PubMed] [Google Scholar]
- 30.Wang S.M., Liu S.G., Morales M.J., Strauss H.C., Rasmusson R.L. A quantitative analysis of the activation and inactivation kinetics of HERG expressed in Xenopus oocytes. J. Physiol. 1997;502:45–60. doi: 10.1111/j.1469-7793.1997.045bl.x. [DOI] [PMC free article] [PubMed] [Google Scholar]
- 31.Nuss H.B., Marban E. Electrophysiological properties of neonatal mouse cardiac myocytes in primary culture. J. Physiol. 1994;479:265–279. doi: 10.1113/jphysiol.1994.sp020294. [DOI] [PMC free article] [PubMed] [Google Scholar]
- 32.Shannon T.R., Ginsburg K.S., Bers D.M. Reverse mode of the sarcoplasmic reticulum calcium pump and load-dependent cytosolic calcium decline in voltage-clamped cardiac ventricular myocytes. Biophys. J. 2000;78:322–333. doi: 10.1016/S0006-3495(00)76595-7. [DOI] [PMC free article] [PubMed] [Google Scholar]
- 33.Ioshii S.O., Imanakayoshida K., Yoshida T. Organization of calsequestrin-positive sarcoplasmic reticulum in rat cardiomyocytes in culture. J. Cell. Physiol. 1994;158:87–96. doi: 10.1002/jcp.1041580112. [DOI] [PubMed] [Google Scholar]
- 34.Sobie E.A., Dilly K.W., Cruz J.D., Lederer W.J., Jafri M.S. Termination of cardiac Ca2+ sparks: an investigative mathematical model of calcium-induced calcium release. Biophys. J. 2002;83:59–78. doi: 10.1016/s0006-3495(02)75149-7. [DOI] [PMC free article] [PubMed] [Google Scholar]
- 35.Dawson S.P., Keizer J., Pearson J.E. Fire-diffuse-fire model of dynamics of intracellular calcium waves. Proc. Natl. Acad. Sci. USA. 1999;96:6060–6063. doi: 10.1073/pnas.96.11.6060. [DOI] [PMC free article] [PubMed] [Google Scholar]
- 36.Keener J.P., Sneyd J. Springer; New York: 1998. Mathematical Physiology. [Google Scholar]
- 37.Bassani R.A., Shannon T.R., Bers D.M. Passive Ca2+ binding in ventricular myocardium of neonatal and adult rats. Cell Calcium. 1998;23:433–442. doi: 10.1016/s0143-4160(98)90100-2. [DOI] [PubMed] [Google Scholar]
- 38.Creazzo T.L., Burch J., Godt R.E. Calcium buffering and excitation-contraction coupling in developing avian myocardium. Biophys. J. 2004;86:966–977. doi: 10.1016/S0006-3495(04)74172-7. [DOI] [PMC free article] [PubMed] [Google Scholar]
- 39.Anversa P., Loud A.V., Giacomelli F., Wiener J. Absolute morphometric study of myocardial hypertrophy in experimental hypertension. II. Ultrastructure of myocytes and interstitium. Lab. Invest. 1978;38:597–609. [PubMed] [Google Scholar]
- 40.Smith P.D., Liesegang G.W., Berger R.L., Czerlinski G., Podolsky R.J. A stopped-flow investigation of calcium ion binding by ethylene glycol bis(β-aminoethyl ether)-N,N'-tetraacetic acid. Anal. Biochem. 1984;143:188–195. doi: 10.1016/0003-2697(84)90575-x. [DOI] [PubMed] [Google Scholar]
- 41.Hund T.J., Kucera J.P., Otani N.F., Rudy Y. Ionic charge conservation and long-term steady state in the Luo-Rudy dynamic cell model. Biophys. J. 2001;81:3324–3331. doi: 10.1016/S0006-3495(01)75965-6. [DOI] [PMC free article] [PubMed] [Google Scholar]
- 42.Voutilainen-Myllyla S., Tavi P., Weckstrom M. Chelerythrine and bisindolylmaleimide I prolong cardiac action potentials by protein kinase C-independent mechanism. Eur. J. Pharmacol. 2003;466:41–51. doi: 10.1016/s0014-2999(03)01541-3. [DOI] [PubMed] [Google Scholar]
- 43.Motlagh D., Alden K.J., Russell B., Garcia J. Sodium current modulation by a tubulin/GTP coupled process in rat neonatal cardiac myocytes. J. Physiol. 2002;540:93–103. doi: 10.1113/jphysiol.2001.013474. [DOI] [PMC free article] [PubMed] [Google Scholar]
- 44.Hojo Y., Ikeda U., Tsuruya Y., Ebata H., Murata M. Thyroid hormone stimulates Na+-Ca2+ exchanger expression in rat cardiac myocytes. J. Cardiovasc. Pharmacol. 1997;29:75–80. doi: 10.1097/00005344-199701000-00012. [DOI] [PubMed] [Google Scholar]
- 45.Hayasaki-Kajiwara Y., Kitano Y., Iwasaki T., Shimamura T., Naya N. Na+ influx via Na+/H+ exchange activates protein kinase C isozymes δ and ɛ in cultured neonatal rat cardiac myocytes. J. Mol. Cell. Cardiol. 1999;31:1559–1572. doi: 10.1006/jmcc.1999.0993. [DOI] [PubMed] [Google Scholar]
- 46.Bers D.M., Christensen D.M., Nguyen T.X. Can Ca entry via Na-Ca exchange directly activate cardiac-muscle contraction. J. Mol. Cell. Cardiol. 1988;20:405–414. doi: 10.1016/s0022-2828(88)80132-9. [DOI] [PubMed] [Google Scholar]
- 47.Guo W.N., Kamiya K., Cheng J.H., Toyama J.J. Changes in action potentials and ion currents in long-term cultured neonatal rat ventricular cells. Am. J. Physiol. Cell Physiol. 1996;40:C93–C102. doi: 10.1152/ajpcell.1996.271.1.C93. [DOI] [PubMed] [Google Scholar]
- 48.Pang Y., Hunton D.L., Bounelis P., Marchase R.B. Hyperglycemia inhibits capacitative calcium entry and hypertrophy in neonatal cardiomyocytes. Diabetes. 2002;51:3461–3467. doi: 10.2337/diabetes.51.12.3461. [DOI] [PubMed] [Google Scholar]
- 49.Lokuta A., Kirby M.S., Gaa S.T., Lederer W.J., Rogers T.B. Establishing primary cultures of neonatal rat ventricular myocytes for analysis over long periods. J. Cardiovasc. Electrophysiol. 1994;5:50–62. doi: 10.1111/j.1540-8167.1994.tb01114.x. [DOI] [PubMed] [Google Scholar]
- 50.Kapiloff M.S., Jackson N., Airhart N. mAKAP and the ryanodine receptor are part of a multicomponent signaling complex on the cardiomyocyte nuclear envelope. J. Cell Sci. 2001;114:3167–3176. doi: 10.1242/jcs.114.17.3167. [DOI] [PubMed] [Google Scholar]
- 51.Sheehan K.A., Blatter L.A. Regulation of junctional and non-junctional sarcoplasmic reticulum calcium release in excitation-contraction coupling in cat atrial myocytes. J. Physiol. 2003;546:119–135. doi: 10.1113/jphysiol.2002.026963. [DOI] [PMC free article] [PubMed] [Google Scholar]
- 52.Cussler E.L. Cambridge University Press; Cambridge, United Kingdom: 1997. Diffusion mass transfer in fluid systems. [Google Scholar]
- 53.Kushmerick M.J., Podolsky R.J. Ionic mobility in muscle cells. Science. 1969;166:1297–1298. doi: 10.1126/science.166.3910.1297. [DOI] [PubMed] [Google Scholar]
- 54.Huser J., Lipsius S.L., Blatter L.A. Calcium gradients during excitation-contraction coupling in cat atrial myocytes. J. Physiol. 1996;494:641–651. doi: 10.1113/jphysiol.1996.sp021521. [DOI] [PMC free article] [PubMed] [Google Scholar]
- 55.Kirby M.S., Sagara Y., Gaa S., Inesi G., Lederer W.J. Thapsigargin inhibits contraction and Ca2+ transient in cardiac cells by specific inhibition of the sarcoplasmic reticulum Ca2+ pump. J. Biol. Chem. 1992;267:12545–12551. [PubMed] [Google Scholar]
- 56.Prasad A.M., Ma H., Sumbilla C., Lee D.I., Klein M.G. Phenylephrine hypertrophy, Ca2+-ATPase (SERCA2), and Ca2+ signaling in neonatal rat cardiac myocytes. Am. J. Physiol. Cell Physiol. 2007;292:C2269–C2275. doi: 10.1152/ajpcell.00441.2006. [DOI] [PubMed] [Google Scholar]
- 57.Barac Y.D., Zeevi-Levin N., Yaniv G., Reiter I., Milman F. The 1,4,5-inositol trisphosphate pathway is a key component in Fas-mediated hypertrophy in neonatal rat ventricular myocytes. Cardiovasc. Res. 2005;68:75–86. doi: 10.1016/j.cardiores.2005.05.015. [DOI] [PubMed] [Google Scholar]
- 58.Bers D.M., Barry W.H., Despa S. Intracellular Na+ regulation in cardiac myocytes. Cardiovasc. Res. 2003;57:897–912. doi: 10.1016/s0008-6363(02)00656-9. [DOI] [PubMed] [Google Scholar]
- 59.Guo W., Xu H., Nerbonne J. Molecular basis of transient outward K+ current diversity in mouse ventricular myocytes. J. Physiol. 1999;521:587–599. doi: 10.1111/j.1469-7793.1999.00587.x. [DOI] [PMC free article] [PubMed] [Google Scholar]
- 60.Pogwizd S.M., Schlotthauer K., Li L., Yuan W.L., Bers D.M. Arrhythmogenesis and contractile dysfunction in heart failure: roles of sodium-calcium exchange, inward rectifier potassium current, and residual β-adrenergic responsiveness. Circ. Res. 2001;88:1159–1167. doi: 10.1161/hh1101.091193. [DOI] [PubMed] [Google Scholar]
- 61.Liu D.W., Antzelevitch C. Characteristics of the delayed rectifier current (IKr and IKs) in canine ventricular epicardial, midmyocardial, and endocardial myocytes: a weaker IKs contributes to the longer action-potential of the M cell. Circ. Res. 1995;76:351–365. doi: 10.1161/01.res.76.3.351. [DOI] [PubMed] [Google Scholar]
- 62.Taggart P., Sutton P.M.I., Boyett M.R., Lab M., Swanton H. Human ventricular action potential duration during short and long cycles: rapid modulation by ischemia. Circulation. 1996;94:2526–2534. doi: 10.1161/01.cir.94.10.2526. [DOI] [PubMed] [Google Scholar]
- 63.Han C.L., Tavi P., Weckstrom M. Role of the Na+-Ca2+ exchanger as an alternative trigger of CICR in mammalian cardiac myocytes. Biophys. J. 2002;82:1483–1496. doi: 10.1016/S0006-3495(02)75502-1. [DOI] [PMC free article] [PubMed] [Google Scholar]
- 64.Bassani J.W.M., Qi M., Samarel A.M., Bers D.M. Contractile arrest increases sarcoplasmic reticulum calcium uptake and SERCA2 gene expression in cultured neonatal rat heart cells. Circ. Res. 1994;74:991–997. doi: 10.1161/01.res.74.5.991. [DOI] [PubMed] [Google Scholar]
- 65.McCall E., Ginsburg K.S., Bassani R.A., Shannon T.R., Qi M. Ca flux, contractility, and excitation-contraction coupling in hypertrophic rat ventricular myocytes. Am. J. Physiol. Heart Circ. Physiol. 1998;43:H1348–H1360. doi: 10.1152/ajpheart.1998.274.4.H1348. [DOI] [PubMed] [Google Scholar]
- 66.Delbridge L.M.D., Satoh H., Yuan W., Bassani J.W.M., Qi M. Cardiac myocyte volume, Ca2+ fluxes, and sarcoplasmic reticulum loading in pressure-overload hypertrophy. Am. J. Physiol. 1997;41:H2425–H2435. doi: 10.1152/ajpheart.1997.272.5.H2425. [DOI] [PubMed] [Google Scholar]
- 67.Diaz M.E., Trafford A.W., Neill S.C.O., Eisner D.A. A measurable reduction of SR Ca content follows spontaneous Ca release in rat ventricular myocytes. Pflug Arch. Eur. J. Physiol. 1997;434:852–854. doi: 10.1007/s004240050475. [DOI] [PubMed] [Google Scholar]
- 68.Aydin J., Korhonen T., Tavi P., Allen D.G., Westerblad H. Activation of Ca2+-dependent protein kinase II during repeated contractions in single muscle fibres from mouse is dependent on the frequency of sarcoplasmic reticulum Ca2+ release. Acta Physiologica. 2007;191:131–137. doi: 10.1111/j.1748-1716.2007.01725.x. [DOI] [PubMed] [Google Scholar]
- 69.Tavi P., Pikkarainen S., Ronkainen J., Niemela P., Ilves M. Pacing-induced calcineurin activation controls cardiac Ca2+ signalling and gene expression. J. Physiol. 2004;554:309–320. doi: 10.1113/jphysiol.2003.053579. [DOI] [PMC free article] [PubMed] [Google Scholar]
- 70.Tavi P., Allen D.G., Niemela P., Vuolteenaho O., Weckstrom M. Calmodulin kinase modulates Ca2+ release in mouse skeletal muscle. J. Physiol. 2003;551:5–12. doi: 10.1113/jphysiol.2003.042002. [DOI] [PMC free article] [PubMed] [Google Scholar]
- 71.Rapila R., Korhonen T., Tavi P. Excitation-contraction coupling of the mouse embryonic cardiomyocyte. J. Gen. Physiol. 2008;132:397–405. doi: 10.1085/jgp.200809960. [DOI] [PMC free article] [PubMed] [Google Scholar]
- 72.Mackenzie L., Roderick H.L., Berridge M.J., Conway S.J., Bootman M.D. The spatial pattern of atrial cardiomyocyte calcium signalling modulates contraction. J. Cell Sci. 2004;117:6327–6337. doi: 10.1242/jcs.01559. [DOI] [PubMed] [Google Scholar]