

Abstract
Background and aims The role of alphafetoprotein (AFP) in the diagnosis and surveillance of hepatocellular carcinoma (HCC) is getting smaller owing to the advances in imaging modalities. The aims of this study were to assess the diagnostic accuracy of tumor markers in small HCC and to find the optimal cutoff value of each tumor marker for efficient surveillance. Methods Studies in all languages were identified by searching MEDLINE from 1982 to 2002. Studies were included when they showed sensitivity and specificity for HCCs 5 cm or smaller and recruited only patients with chronic hepatitis or liver cirrhosis as control. We assessed diagnostic odds ratios (DORs) for the evaluation of diagnostic accuracy of tumor markers and positive likelihood ratios (LRs+) to find the optimal cutoff value. DORs and LRs+ were combined according to the random effect model. The summary receiver operating characteristics (ROC) curve was also assessed. Results Seventeen articles on three tumor markers—AFP, des-gamma-carboxyprothrombin (DCP), and Lens culinaris agglutinin-reactive fraction of AFP (AFP-L3)—were enrolled after full-text evaluation. AFP was inferior to DCP and AFP-L3 in both DOR (4.50 vs. 8.16 and 10.50) and area under the ROC curve (0.647 vs. 0.688 and 0.695). Optimal cutoff values that provide the best LR+ were 200 ng/ml for AFP, 40 mAU/ml for DCP, and 15% for AFP-L3. Conclusions Diagnostic accuracy of AFP in small HCC was substantially limited. Surveillance including other tumor markers with optimal cutoff value should be conducted to confirm the efficacy of the policy.
Keywords: Hepatocellular carcinoma, Alphafetoprotein, Des-gamma-carboxyprothrombin, Lens culinaris agglutinin-reactive fraction of alphafetoprotein, Metaanalysis
Introduction
Hepatocellular carcinoma (HCC) is a common worldwide malignancy, with the United States showing an increasing incidence rate [1, 2]. Approximately, 75–80% of primary liver cancers are attributable to persistent viral infections with either hepatitis B virus (HBV) or hepatitis C virus (HCV) [3–6], and the annual incidence of HCC with cirrhosis is 1–7% [7–11].
In the ordinary diagnostic process of HCC, a space-occupying lesion in the liver is first detected by imaging modalities such as ultrasonography and then confirmed by dynamic CT or MRI with contrast media. Typical HCC shows hypervascularity in the arterial phase and washout of contrast media in the portal-venous phase [12, 13]. The final diagnosis was made pathologically when a patient receives percutaneous biopsy, hepatic resection, or liver transplantation.
Alphafetoprotein (AFP) has served as a diagnostic test for HCC since the 1970s, when most patients with HCC were diagnosed at an advanced stage with clinical symptoms [14]. Concentrations higher than 500 ng/ml can be confirmatory in that situation. Nowadays quite a few small HCCs (e.g., 3 cm or smaller) can be detected owing to advances in imaging modalities, and it is known that significant numbers of small HCCs do not secrete a diagnostic level of AFP [15]. Furthermore, AFP levels are elevated both in patients with HCC and in those with chronic liver diseases, and there is a wide overlap between the two groups [16, 17]. Thus, the role of AFP as a diagnostic test is getting smaller.
Another use of AFP is in detecting asymptomatic HCC via periodic screening for high-risk patients. High positive predictive value with an appropriate cutoff value is mandatory for an effective surveillance program.
To date, many tumor markers have been proposed as a complement or substitute for AFP in the diagnosis of HCC, such as des-gamma-carboxyprothrombin (DCP) [18, 19], Lens culinaris agglutinin-reactive fraction of AFP (AFP-L3) [20, 21], and various cytokines [22–24]. The aim of this study is to compare the diagnostic accuracy of AFP in small HCC with other biomarkers and to find the optimal cutoff value of each tumor marker for efficient surveillance.
Methods
We conducted this study as part of a project to establish evidence-based guidelines for the diagnosis and treatment of HCC. This project is supported by the Ministry of Health, Labour and Welfare of Japan.
Study search protocol
First, we settled upon two research questions: (1) How accurate is each tumor marker at diagnosing small HCC? (2) What is the optimal cutoff value of each tumor marker for an effective screening strategy?
To identify relevant articles, we searched MEDLINE (from January 1982 to December 2002), using liver neoplasms and tumor markers as Medical Subject Headings terms (Appendix 1). Subsequently, we reran searches using more specific terms (Appendix 2). A search algorithm was constructed by experts at the International Medical Information Center (Shinanomachi, Shinjuku, Japan). We supplemented these sources by searching the Cochrane Collaboration Library and hand-searching bibliographies of systematic reviews and relevant original articles. Bibliographies were downloaded into a specially designed database made by FileMaker Ver. 5 (FileMaker, Inc., Santa Clara, CA, USA) for the project.
Inclusion criteria
Studies were included when they met all the following criteria: (1) the sensitivity and specificity were described or could be calculated from tables or figures, (2) the maximum size of nodules was 5 cm or smaller, or sensitivity of nodules smaller than 5 cm could be calculated, and (3) only patients with chronic hepatitis or cirrhosis were recruited as control. We then selected tumor markers for which at least three articles were available. We excluded any meeting abstracts not accompanied by full articles, and other incomplete reports.
Two authors independently reviewed the article titles and abstracts identified by the search, evaluated each study for inclusion, and retrieved potentially eligible articles for full-text evaluation. Any discrepancies were settled by a third author.
Data extraction
Two authors independently extracted data from each eligible article. A 2 × 2 table was reconstructed for every tumor marker in the article. When tables could be reconstructed for 2 or more upper limits of tumor size (e.g., 3 and 5 cm), we adopted the larger size up to 5 cm. When articles provided 2 or more tables for 2 or more cutoff values (e.g., 20 and 100 ng/ml for AFP), all available tables were reconstructed separately.
Potential confounders and quality assessment
We considered eight variables to be potential confounders for explaining heterogeneity and interstudy variability: (1) proportion of chronic hepatitis and cirrhosis patients; (2) proportion of patients with hepatitis B and C; (3) year of publication; (4) study design: cohort or case–control study; (5) proportion of histologically proven HCC patients; (6) blinding: whether final diagnosis of HCC was performed independently from the test result; (7) consecutive recruitment of patients; and (8) existence of verification bias: whether only patients with positive test results received the reference standard. The latter four variables were introduced to assess the quality of articles according to the guidelines of Irwig et al. [25]. All these variables were defined a priori; two authors independently evaluated the articles and a third author independently settled discrepancies.
All data were input to a standardized form for assessing the characteristics of enrolled articles.
Statistical analysis
Diagnostic odds ratio
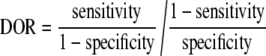
To answer the first research question (i.e., how is the accuracy of each tumor marker at diagnosing small HCC), we assessed the diagnostic odds ratio (DOR) of each tumor marker that represents the comprehensive ability of a diagnostic test according to the following formula. Since there is an inverse association between sensitivity and specificity that differs according to test thresholds, it is inappropriate to estimate their means separately [26].
 |
Assessment for potential confounders
To examine the factors associated with variation in the DOR, a regression model was formulated and tested. We applied linear regression analysis with log DOR as a dependent variable and the previously described eight factors as independent variables. The P value threshold for statistical significance was set at 0.05.
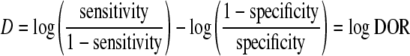
Summary receiver operating characteristic curve
In addition, we applied another approach to combine the results of primary studies, that is, to draw a summary receiver operating characteristic (SROC) curve according to Moses et al. [27]. This model hypothesizes that there is a linear relationship between
 |
and
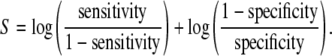 |
We applied weighted linear regression analysis for each tumor marker and drew SROC curves. We also calculated the area under the curve (AUC) and its standard error (SE) according to the method of Walter [28].
Assessment for publication bias
To assess the presence of publication bias, we created funnel plots for each diagnostic test. We plotted the inverse of the standard error of the natural logarithm of the DOR against the natural logarithm of the DOR. Its asymmetry was tested by significance test using the linear regression method suggested by Egger et al. [29]. In the regression, the standardized effect, defined as the effect divided by its standard error, is regressed against the precision of the effect, defined as the inverse of the standard error:
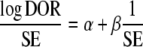 |
The intercept α provides a quantitative measure of the asymmetry and is of major interest. The more the intercept deviates from zero, the more pronounced the asymmetry. Negative values of α will indicate that less precise studies have a more pronounced effect than more precise studies, suggesting publication bias. On the other hand, positive intercept does not suggest selection bias rather than heterogeneity of included studies. A P value less than 0.1 of zero intercept is considered statistically significant.
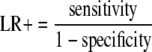
Positive likelihood ratio
To answer the second question (i.e., what is the optimal cutoff value), we assessed positive likelihood ratio (LR+) on the assumption that a positive result may lead to a confirming test (e.g., dynamic CT). LR+, which is always discussed with negative likelihood ratios, was calculated on the following formula and express how much more frequent the positive results is among subjects with disease than among subjects without disease, independent from pretest probability or disease prevalence.
 |
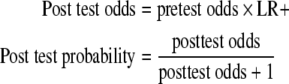
LRs+ above 10 are considered to provide a strong evidence to rule in diagnoses respectively in most circumstances [30]. Positive predictive values (= posttest probabilities) can be calculated on the following formula.
 |
When the sensitivity or specificity equaled zero, we added 0.5 to each cell of the original 2 × 2 table to avoid dividing by zero. We calculated the pooled DORs and LRs and their 95% confidence intervals (CIs) for random effect models on the basis of DerSimonian and Laird [31]. We assessed the heterogeneity of the odds ratio by a homogeneity chi-square test.
We used MetaDiSc statistical software [32] and Comprehensive Meta Analysis Ver. 1.0 (Biostat, Englewood, NJ, USA) for the analysis of LRs and DOR, and S-PLUS 2000 (MathSoft Inc., Seattle, WA, USA) for regression analysis and drawing SROC curves.
Role of the funding sources
The funding sources had no role in the choice of topic; the collection, analysis, or interpretation of the data; or the decision to submit the manuscript for publication.
Results
The primary MEDLINE search identified 2,685 articles potentially relevant to the topic. After reviewing titles and abstracts of these articles, the following three tumor markers were found in at least three articles that provided sensitivity and specificity: AFP, DCP, and AFP-L3. We ran another MEDLINE search using more specific terms (Appendix 2) and identified 985 additional articles to be reviewed. We also identified two systematic reviews on detecting HCC in patients with chronic hepatitis C [33, 34] and checked their bibliographies.
After reviewing titles and abstracts, 54 articles were retrieved for full-text evaluation. Thirty-seven of them were excluded: 32 did not provide sensitivity for tumors less than 5 cm in diameter [15, 19, 21, 22, 35–62], 3 recruited patients without chronic hepatitis [46, 52, 63], and 5 articles did not provide specificity [56, 64–67]. Finally, 17 articles were included in our study (Fig. 1, Table 1) [68–84]. Eleven studies included data on more than one tumor marker [70, 71, 73–77, 79–81, 83], and 4 of them provided sensitivity and specificity of a combination of two tumor markers [70, 74, 77, 79]. As 8 studies provided sensitivity and specificity with more than one cutoff value [68, 70, 71, 74, 76, 80, 83, 85], we could evaluate 50 DORs in total.
Fig. 1.

Study inclusion flow diagram
Table 1.
Characteristics of included studies
| Author (reference) | Diagnostic test | Study design | Country | Patients with HCC | Control | |||||
|---|---|---|---|---|---|---|---|---|---|---|
| n | Etiology | Characteristics of HCC | Modalities of diagnosis | n | Etiology | Characteristics of patients | ||||
| Cottone et al. [68] | AFP (RIA) | Co | Italy | 30 | 7% with HBV, 73% with HCV | 100% ≤5 cm | 100% by pathology | 147 | 12% with HBV, 71% with HCV | 100% with LC |
| Fujiyama et al. [69] | AFP (RIA), DCP (EIA) | CC | Japan | 120 | NR with HBV and HCV | 34% ≤5 cm, 10% ≤2 cm | NR | 334 | NR with HBV and HCV | 41% with LC, 59% with CH |
| Ikoma et al. [70] | AFP (EIA), DCP (EIA) | CC | Japan | 63 | 14% with HBV, 70% with HCV | 56% ≤3 cm, 20% ≤2 cm | 33% by pathology, 67% by imaging | 188 | 22% with HBV, 84% with HCV | 24% with LC, 76% with CH |
| Kasahara et al. [71] | AFP (EIA), DCP (EIA) | CC | Japan | 112 | NR with HBV and HCV | 15% ≤5 cm | 100% by imaging | 403 | NR with HBV and HCV | 28% with LC, 72% with CH |
| Maringhin et al. [72] | AFP (RIA) | Co | Italy | 146 | 80% with HBV | 38% ≤5 cm | 50% by pathology | 217 | 65% with HBV | 100% with LC |
| Mita et al. [73] | AFP (EIA), DCP (sEIA), AFP-L3 (EP) | CC | Japan | 91 | 17% with HBV, 70% with HCV | 47% ≤2 cm | 100% by pathology or imaginge | 57 | 32% with HBV, 40% with HCV | 100% with LC |
| Nomura et al. [74] | AFP (EIA), DCP (EIA) | CC | Japan | 27 | 7% with HBV, 89% with HCV | 100% ≤3 cm | 100% by pathology | 101 | NR with HBV and HCV | 68% with LC, 32% with CH |
| Nomura et al. [75] | AFP (EIA), DCP (EIA, ECLIA, IRMA), AFP-L3 (EP) | CC | Japan | 36 | NR with HBV and HCV | 100% ≤3 cm, 53% ≤2 cm | 100% by pathology | 49 | NR with HBV and HCV | 100% with LC |
| Oka et al. [76] | AFP (variousa), AFP-L3 (EP) | CC | Japan | 388 | 9% with HBV, 78% with HCV | 32% ≤2 cm | 26% by pathology, 74% by imaging | 212 | 100% with HBV or HCV | 100% with CH or LC |
| Saitoh et al. [78] | AFP (RIA), DCP (ABC) | CC | Japan | 115 | 17% with HBV, 80% with HCV | 100% ≤2 cm | 72% by pathology, 28% by imaging | NR with HBV and HCV | 45% with LC, 55% with CH | |
| Sassa et al. [77] | AFP (RIA), DCP (EIA), AFP-L3 (EP) | CC | Japan | 61 | 15% with HBV, 84% with HCV | 100% ≤2 cm | 92% by pathology | 134 | 17% with HBV, 79% with HCV | 56% with LC, 44% with CH |
| Shimauchi et al. [79]b | AFP (RIA), DCP (sEIA), AFP-L3 (EP) | Co | Japan | 21 | 14% with HBV, 76% with HCV | 95% ≤3 cm, 67% ≤2 cm | 100% by pathology | 57 | 14% with HBV, 79% with HCV | 100% with LC |
| Shiraki et al. [80] | AFP (RIA), DCP (EIA), AFP-L3 (EP) | Co | Japan | 51 | 20% with HBV, 80% with HCV | 80% ≤3 cm, 57% ≤2 cm | 88% by pathology, 12% by imaging | 21 | 24% with HBV, 76% with HCV | 100% with LC |
| Suehiro et al. [81] | AFP (NR), DCP (EIA) | CC | Japan | 185 | NR with HBV and HCV | 39% ≤6 cm, 21% ≤3 cm | 49% by pathologyf | 85 | NR with HBV and HCV | 100% with LC |
| Taketa et al. [82]c | AFP (RIA/EIA), AFP-L3 (EP) | CC | Japan | 167 | 21% with HBV, 50% with HCV | 87% ≤5 cm, 68% ≤3 cm | 51% by pathology, 49% by imaging | 181 | 33% with HBV, 44% with HCV | 69% with LC, 31% with CH |
| Tanabe et al. [83]d | AFP (RIA), DCP (EIA) | CC | Japan | 571 | NR with HBV and HCV | 32% ≤5 cm, 8% ≤2 cm | 100% by pathology or imaging | 28 | NR with HBV and HCV | 100% with LC |
| Tsai et al. [84] | AFP (RIA), DCP (EIA, SC) | CC | Taiwan | 39d | 62% with HBV, NR with HCV | 100% ≤5 cm, 54% ≤2 cm | 100% by pathology or imaging | 54 | NR with HBV and HCV | 52% with LC, 48% with CH |
aAccording to each hospital’s available kit
bSpecificity for AFP was not reported
cSensitivity was only reported on AFP-L3
dDCP was reported in only 31 patients with HCC
eExact percentage was not reported
f100% pathologically proven for HCCs smaller than 3 cm in diameter
Abbreviations: ABC, avidin–biotin complex method; AFP, alphafetoprotein; AFP-L3, Lens culinaris agglutinin-reactive fraction of AFP; CC, case–control study; CH, chronic hepatitis; Co, cohort study; DCP, des-gamma-carboxyprothrombin; ECLIA, electrochemiluminescence assay; EIA, enzyme immunoassay; sEIA, sensitive enzyme immunoassay; EP, electrophoresis; HBV, hepatitis B virus; HCV, hepatitis C virus; LC, liver cirrhosis; NR, not reported; RIA, radioimmunoassay
Sensitivity, specificity, and DOR
Diagnostic odds ratios calculated for each tumor marker were stratified by cutoff values and combined (Fig. 2). Combined odds ratios (95% CI) for AFP, DCP, and AFP-L3 according to the random effects model were 4.50 (2.82–7.18), 8.16 (4.95–13.48), and 10.50 (5.39–20.49), respectively. There was significant heterogeneity among studies in AFP and DCP. The DORs of the combinations of two markers are shown in Table 2.
Fig. 2.


Forest plots of DOR of AFP (a), DCP (b), and AFP-L3 (c). Diagnostic odds ratios were combined using cutoff value as stratification factor. AFP, alphafetoprotein; AFP-L3, Lens culinaris agglutinin-reactive fraction of AFP; DCP, des-gamma-carboxyprothrombin
Table 2.
Diagnostic odds ratio of the combination of two diagnostic tests
| Author (reference) | Test | Cutoff value | Sensitivity | Specificity | DOR (95% CI) |
|---|---|---|---|---|---|
| Ikoma et al. [70] | AFP + DCP | 20 ng/ml, 16 mAU/ml | 0.83 | 0.84 | 25.46 (9.73–66.6) |
| Sassa et al. [77] | AFP + DCP | 200 ng/ml, 40 mAU/ml | 0.48 | 0.99 | 59.81 (13.56–263.8) |
| Nomura et al. [74] | AFP-L3 + DCP | 10%, 40 mAU/ml | 0.42 | 0.90 | 6.29 (2.02–19.6) |
| Shimauchi et al. [79] | AFP-L3 + DCP | 10%, 40 mAU/ml | 0.67 | 0.90 | 17.0 (4.92–58.8) |
| Sassa et al. [77] | AFP + AFP-L3 | 200 ng/ml, 10% | 0.25 | 0.99 | 43.4 (5.57–337.5) |
Abbreviations: AFP, alphafetoprotein; AFP-L3, Lens culinaris agglutinin-reactive fraction of AFP; DCP, des-gamma-carboxyprothrombin
Assessment for potential confounders
Table 3 shows the results of regression analysis for potential confounders. We excluded blinding in the reference standard from the analysis because none of the included studies provided sufficient information regarding blinding. A significant decrease in the odds ratio of DCP (slope = −0.551, P = 0.02) was also observed when all patients had pathologically proven HCC. The diagnostic accuracy of AFP significantly deteriorates when the majority of patients were HCV-positive (slope = −1.038, P = 0.03).
Table 3.
Results of regression analysis for potential confounders
| Variable | AFP | DCP | AFP-L3 | |||
|---|---|---|---|---|---|---|
| Slope | P | Slope | P | Slope | P | |
| Liver functiona | 0.382 | 0.89 | −0.183 | 0.70 | NA | NA |
| Etiologyb | −1.038 | 0.03 | NA | NA | 0.044 | 0.94 |
| Publication yearc | −0.573 | 0.07 | 0.147 | 0.57 | −0.404 | 0.38 |
| Study designd | 0.194 | 0.56 | 0.009 | 0.98 | −0.190 | 0.69 |
| Diagnosise | −0.618 | 0.07 | −0.551 | 0.02 | −0.464 | 0.25 |
| Consecutive recruitmentf | 0.160 | 0.63 | −0.093 | 0.75 | −0.190 | 0.69 |
| Verification biasg | 0.845 | 0.19 | NA | NA | NA | NA |
a0, less than 50% of patients had liver cirrhosis; 1, more than 50% of patients had liver cirrhosis
b0, less than 50% of patients were HCV-positive; 1, more than 50% of patients were HCV-positive
c0, year of publication 1994 or earlier; 1, year of publication 1994 or later
d0, case–control study; 1, cohort study
e0, not all patients were diagnosed by pathology; 1, all patients were diagnosed by pathology
f0, nonconsecutive recruitment of patients; 1, consecutive recruitment of patients
g0, present; 1, absent
Values in boldface have statistical significance
Abbreviations: AFP, alphafetoprotein; AFP-L3, Lens culinaris agglutinin-reactive fraction of AFP; DCP, des-gamma-carboxyprothrombin; NA, not applicable because all studies were categorized into a single group
SROC analysis
Figure 3 shows the scatterplot of (1—specificity) against sensitivity in each study for the diagnostic test and SROC curves. AFP-L3 and DCP showed higher diagnostic accuracy than AFP (Table 4). We also plotted the combined sensitivity and specificity of AFP + DCP, AFP-L3 + DCP, and AFP + AFP-L3 provided in four studies [70, 74, 77, 79].
Fig. 3.

SROC curves for 3 diagnostic tests for HCC. Solid line and circles, AFP; dashed line and triangles, DCP; dotted line and diamonds, AFP-L3; asterisks, AFP + DCP; pluses, DCP + AFP-L3; cross, AFP + AFP-L3. AFP, alphafetoprotein; AFP-L3, Lens culinaris agglutinin-reactive fraction of AFP; DCP, des-gamma-carboxyprothrombin; HCC, hepatocellular carcinoma; SROC, summary receiver operating characteristics
Table 4.
Results of SROC analyses for three diagnostic tests for HCC
| Test | Intercept | Slope | AUC | SE (AUC) |
|---|---|---|---|---|
| AFP | 0.940 | −0.321 | 0.647 | 0.027 |
| DCP | 1.207 | −0.230 | 0.688 | 0.083 |
| AFP-L3 | 1.266 | −0.262 | 0.695 | 0.166 |
Abbreviations: AFP, alphafetoprotein; AFP-L3, Lens culinaris agglutinin-reactive fraction of AFP; AUC, area under the curve; DCP, des-gamma-carboxyprothrombin; HCC, hepatocellular carcinoma; SE, standard error; SROC, summary receiver operating characteristics curve
Assessment for publication bias
Funnel plots of three tumor markers showed asymmetry (Appendix Fig. A1). Intercepts and P values of AFP, DCP, and AFP-L3 were 3.59 (P = 0.0003), 5.30 (P = 0.0001), and 6.78 (P = 0.0047), respectively. As previously described, a positive intercept does not suggest publication bias but rather heterogeneity of included studies.
Fig. A1.

Funnel plots of DOR of AFP (a), DCP (b), and AFP-L3 (c). Inverse of standard error of natural logarithm of the odds ratio against natural logarithm of the DOR is plotted. The area of the circle is proportional to the inverse of standard error of natural logarithm of the odds ratio. AFP, alphafetoprotein; AFP-L3, Lens culinaris agglutinin-reactive fraction of AFP; DCP, des-gamma-carboxyprothrombin; DOR, diagnostic odds ratio
Positive likelihood ratio
LRs+ of each tumor marker stratified by cutoff values were calculated and combined (Fig. 4). To assess the optimal cutoff value, we compared LRs+ with the following cutoff values since there were three or fewer studies with other cutoff values: 20 and 200 ng/ml of AFP, 40 and 100 mAU/ml of DCP, and 10% and 15% of AFP-L3. LRs+ with a cutoff value of 200 ng/ml of AFP (5.85, 95% CI: 1.49–22.93), 40 mAU/ml of DCP (12.60, 6.65–23.87), and 15% of AFP-L3 (13.10, 3.89–44.97) were better than those with, respectively, 20 ng/ml of AFP (2.45, 1.74–3.45), 100 mAU/ml of DCP (4.91, 2.43–9.91), and 10% of AFP-L3 (4.89, 2.77–8.61).
Fig. 4.

Forest plots of positive likelihood ratio of AFP (a), DCP (b), and AFP-L3 (c). Likelihood ratios were combined on a cutoff value basis. AFP, alphafetoprotein; AFP-L3, Lens culinaris agglutinin-reactive fraction of AFP; DCP, des-gamma-carboxyprothrombin; LR, likelihood ratio
Discussion
Our literature search identified two potential candidates for substituting or complementing AFP in the diagnosis of HCC, namely, DCP and AFP-L3. DCP, also known as prothrombin induced by vitamin K absence-II (PIVKA-II), is an abnormal prothrombin protein that is present at higher levels in the serum of HCC patients. Since the report by Liebman et al. [18], DCP has been recognized as not only a highly specific marker for HCC but also a predictor of prognosis of HCC patients [86, 87]. AFP-L3 is a fucosylated variant of AFP that reacts with Lens culinaris agglutinin A and can differentiate an increase of AFP due to HCC from that due to benign liver disease [20, 21, 82].
In this study, the diagnostic accuracy of AFP was found to be inferior to that of DCP and AFP-L3 in both meta-analysis with random effects model and SROC analysis. It is apparent that the inferiority of AFP in DORs is due to its lack of specificity as compared with the other two markers. The false-positive rate of AFP with a cutoff value of 20 ng/ml was 0.14–0.32. It should be stated that the role of AFP as a diagnostic test is almost over in the era of advanced imaging technologies. Instead, the other two markers, which showed superior specificity around 0.95, will play a role as a confirmatory test.
During the literature-searching process, we identified two systematic reviews of the diagnostic accuracy of AFP [33, 34]. Both of them focused on HCV-positive patients based on the concept that the natural history of hepatitis C is different from that of hepatitis B [6, 40]. Elevated AFP has been observed more frequently in patients with chronic hepatitis B than C [46, 57], and the present results of meta-regression on the etiology of liver disease may support this finding. Diagnostic accuracy deteriorated when the majority of patients were HCV positive. In contrast, we did not encounter this phenomenon with AFP-L3.
We also assessed potential confounders other than liver disease etiology. The presence or absence of liver cirrhosis, which strongly influences the risk of HCC in HCV-positive patients, did not affect the DOR. The year of publication, which is associated with improvement in the diagnostic accuracy of the reference standard (e.g., dynamic CT), also did not show significant influence on the DOR.
Research on randomized trials and observational studies has suggested that the major reason for not publishing is that investigators do not submit studies with negative results for publication [88]. Publication bias is more serious in observational studies than in interventional studies. Most of the studies on DCP and AFP-L3 included in the current analysis assessed the diagnostic accuracy in comparison with AFP. Thus, there might also be publication bias when true results suggesting inferiority of DCP or AFP-L3 to AFP were possibly left unpublished, but funnel plot analysis could obviously not reveal the existence of such publication bias.
Study design features significantly affect the entire results of a study on diagnostic tests [89–91]. In a case–control study, to prevent the possibility of selection bias, patients should be recruited consecutively from a relevant clinical population covering the spectrum of disease that is likely to be encountered in the current or future use of the test. In surveillance as a cohort study consisting of periodical tests, verification bias exists when the decision to perform the reference test is based on the result of the test under examination. The results of regression analysis showed no significant difference between well-designed studies and others. This might be because the number of quality studies was too small.
As it is inappropriate to conduct surveillance for HCC without ultrasound in a high-risk population [15, 92], the major issue is whether to combine ultrasound and tumor markers in the surveillance. The fact that DCP and AFP-L3 showed LRs+ of larger than 10, which are interpreted as conclusive, make it quite reasonable to consider inclusion of those markers in surveillance. In fact, DCP with a cutoff value of 40 mAU and AFP-L3 with a cutoff value of 15% were adopted in the Japanese guideline for the diagnosis and treatment of HCC [93]. The higher diagnostic accuracy shown in the combination of two tumor markers, rather than by AFP alone, suggests that inclusion of two or three markers may improve the efficiency of surveillance programs.
The aim of this study is not to directly assess the effectiveness of surveillance programs for HCC but to find potential candidates to be included in the surveillance. The effectiveness of surveillance depends on various factors—disease prevalence, identification of high-risk populations, interval of diagnostic tests, type of confirmation tests, and treatment modality when disease is confirmed—and should also finally be assessed in terms of cost-effectiveness. Inclusion of new diagnostic tests in surveillance programs may make it possible to detect additional small HCCs. However, it should be verified whether improvement of effectiveness is always justified by increased cost. In conclusion, surveillance of HCC in high-risk populations that includes DCP and/or AFP-L3 should be conducted and assessed on the basis of acceptable cost-effectiveness.
Acknowledgment
The authors thank Hiromichi Suzuki and Ayami Nishioka at the International Medical Information Center for technical support in article searching and managing the reference database.
Abbreviations
- AFP
Alphafetoprotein
- AFP-L3
Lens culinaris agglutinin-reactive fraction of AFP
- AUC
Area under the curve
- CI
Confidence interval
- DCP
Des-gamma-carboxyprothrombin
- DOR
Diagnostic odds ratio
- HBV
Hepatitis B virus
- HCC
Hepatocellular carcinoma
- HCV
Hepatitis C virus
- LR+
Positive likelihood ratio
- ROC
Receiver operating characteristics
- SE
Standard error
Appendix
Appendix 1.
Primary research
| Key words | No. of articles | |
|---|---|---|
| 1 | Liver Neoplasms [MAJR] AND 1982:2002 [DP] | 36,650 |
| 2 | 1 AND (Human [MeSH] OR hominidae [MeSH]) | 28,685 |
| 3 | 2 AND Tumor Markers, Biological [MeSH] | 2,685 |
Appendix 2.
Secondary research
| Key words | No. of articles | |
|---|---|---|
| 1 | Liver Neoplasms [MAJR] AND 1982:2002 [DP] | 36,650 |
| 2 | 1 AND (Human [MeSH] OR hominidae [MeSH]) | 28,685 |
| 4 | 2 AND (alpha-Fetoproteins [MeSH] OR alpha-fetoprotein [TW] OR alphafetoprotein [TW] OR AFP [TW]) | 2,587 |
| 5 | 2 AND (prothrombin [MeSH] OR des-gamma-carboxyprothrombin [TW] OR des-gamma-carboxy-prothrombin [TW] OR desgammacarboxyprothrombin [TW] OR DCP [TW] OR PIVKA [TW]) | 243 |
| 6 | 4 OR 5 | 2,650 |
| 7 | 3 OR 6 | 3,670 |
Footnotes
This study was supported by the Ministry of Health, Labour and Welfare in Japan (H14-Iryo-032).
References
- 1.Di Bisceglie AM, Rustgi VK, Hoofnagle JH, Dusheiko GM, Lotze MT. NIH conference. Hepatocellular carcinoma. Ann Intern Med 1988;108:390–401. [DOI] [PubMed]
- 2.El-Serag HB, Mason AC. Rising incidence of hepatocellular carcinoma in the United States. N Engl J Med 1999;340:745–50. [DOI] [PubMed]
- 3.Bosch FX, Ribes J, Diaz M, Cleries R. Primary liver cancer: worldwide incidence and trends. Gastroenterology 2004;127:S5–S16. [DOI] [PubMed]
- 4.Blumberg BS, Larouze B, London WT, Werner B, Hesser JE, Millman I, et al. The relation of infection with the hepatitis B agent to primary hepatic carcinoma. Am J Pathol 1975;81:669–82. [PMC free article] [PubMed]
- 5.Tsukuma H, Hiyama T, Tanaka S, Nakao M, Yabuuchi T, Kitamura T, et al. Risk factors for hepatocellular carcinoma among patients with chronic liver disease. N Engl J Med 1993;328:1797–801. [DOI] [PubMed]
- 6.Shiratori Y, Shiina S, Imamura M, Kato N, Kanai F, Okudaira T, et al. Characteristic difference of hepatocellular carcinoma between hepatitis B- and C- viral infection in Japan. Hepatology 1995;22:1027–33. [DOI] [PubMed]
- 7.Fattovich G, Giustina G, Schalm SW, Hadziyannis S, Sanchez-Tapias J, Almasio P, et al., for the EUROHEP Study Group on Hepatitis B Virus and Cirrhosis. Occurrence of hepatocellular carcinoma and decompensation in western European patients with cirrhosis type B. Hepatology 1995;21:77–82. [DOI] [PubMed]
- 8.Kato Y, Nakata K, Omagari K, Furukawa R, Kusumoto Y, Mori I, et al. Risk of hepatocellular carcinoma in patients with cirrhosis in Japan. Analysis of infectious hepatitis viruses. Cancer 1994;74:2234–8. [DOI] [PubMed]
- 9.Cottone M, Turri M, Caltagirone M, Parisi P, Orlando A, Fiorentino G, et al. Screening for hepatocellular carcinoma in patients with Child’s A cirrhosis: an 8-year prospective study by ultrasound and alphafetoprotein. J Hepatol 1994;21:1029–34. [DOI] [PubMed]
- 10.Yoshida H, Shiratori Y, Moriyama M, Arakawa Y, Ide T, Sata M, et al., for the IHIT (Inhibition of Hepatocarcinogenesis by Interferon Therapy) Study Group. Interferon therapy reduces the risk for hepatocellular carcinoma: national surveillance program of cirrhotic and noncirrhotic patients with chronic hepatitis C in Japan. Ann Intern Med 1999;131:174–81. [DOI] [PubMed]
- 11.Fattovich G, Giustina G, Degos F, Tremolada F, Diodati G, Almasio P, et al. Morbidity and mortality in compensated cirrhosis type C: a retrospective follow-up study of 384 patients. Gastroenterology 1997;112:463–72. [DOI] [PubMed]
- 12.Torzilli G, Minagawa M, Takayama T, Inoue K, Hui AM, Kubota K, et al. Accurate preoperative evaluation of liver mass lesions without fine-needle biopsy. Hepatology 1999;30:889–93. [DOI] [PubMed]
- 13.Bruix J, Sherman M. Management of hepatocellular carcinoma. Hepatology 2005;42:1208–36. [DOI] [PubMed]
- 14.Kew MC. Alpha-fetoprotein. In: Read AE, editor. Modern trends in gastroenterology. London: Butterworths; 1975. p. 91.
- 15.Sherman M, Peltekian KM, Lee C. Screening for hepatocellular carcinoma in chronic carriers of hepatitis B virus: incidence and prevalence of hepatocellular carcinoma in a North American urban population. Hepatology 1995;22:432–8. [PubMed]
- 16.Bloomer JR, Waldmann TA, McIntire KR, Klatskin G. Alpha-fetoprotein in noneoplastic hepatic disorders. JAMA 1975;233:38–41. [DOI] [PubMed]
- 17.Alpert E, Feller ER. Alpha-fetoprotein (AFP) in benign liver disease. Evidence that normal liver regeneration does not induce AFP synthesis. Gastroenterology 1978;74:856–8. [PubMed]
- 18.Liebman HA, Furie BC, Tong MJ, Blanchard RA, Lo KJ, Lee SD, et al. Des-gamma-carboxy (abnormal) prothrombin as a serum marker of primary hepatocellular carcinoma. N Engl J Med 1984;310:1427–31. [DOI] [PubMed]
- 19.Okuda H, Obata H, Nakanishi T, Furukawa R, Hashimoto E. Production of abnormal prothrombin (des-gamma-carboxy prothrombin) by hepatocellular carcinoma. A clinical and experimental study. J Hepatol 1987;4:357–63. [DOI] [PubMed]
- 20.Aoyagi Y, Isemura M, Yosizawa Z, Suzuki Y, Sekine C, Ono T, et al. Fucosylation of serum alpha-fetoprotein in patients with primary hepatocellular carcinoma. Biochim Biophys Acta 1985;830:217–23. [DOI] [PubMed]
- 21.Sato Y, Nakata K, Kato Y, Shima M, Ishii N, Koji T, et al. Early recognition of hepatocellular carcinoma based on altered profiles of alpha-fetoprotein. N Engl J Med 1993;328:1802–6. [DOI] [PubMed]
- 22.Izzo F, Cremona F, Delrio P, Leonardi E, Castello G, Pignata S, et al. Soluble interleukin-2 receptor levels in hepatocellular cancer: a more sensitive marker than alfa fetoprotein. Ann Surg Oncol 1999;6:178–85. [DOI] [PubMed]
- 23.Sacco R, Leuci D, Tortorella C, Fiore G, Marinosci F, Schiraldi O, et al. Transforming growth factor beta1 and soluble Fas serum levels in hepatocellular carcinoma. Cytokine 2000;12:811–4. [DOI] [PubMed]
- 24.Kakumu S, Ito S, Ishikawa T, Mita Y, Tagaya T, Fukuzawa Y, et al. Decreased function of peripheral blood dendritic cells in patients with hepatocellular carcinoma with hepatitis B and C virus infection. J Gastroenterol Hepatol 2000;15:431–6. [DOI] [PubMed]
- 25.Irwig L, Tosteson AN, Gatsonis C, Lau J, Colditz G, Chalmers TC, et al. Guidelines for meta-analyses evaluating diagnostic tests. Ann Intern Med 1994;120:667–76. [DOI] [PubMed]
- 26.Irwig L, Macaskill P, Glasziou P, Fahey M. Meta-analytic methods for diagnostic test accuracy. J Clin Epidemiol 1995; 48:119–30; discussion 31–2. [DOI] [PubMed]
- 27.Moses LE, Shapiro D, Littenberg B. Combining independent studies of a diagnostic test into a summary ROC curve: data-analytic approaches and some additional considerations. Stat Med 1993;12:1293–316. [DOI] [PubMed]
- 28.Walter SD. Properties of the summary receiver operating characteristic (SROC) curve for diagnostic test data. Stat Med 2002;21:1237–56. [DOI] [PubMed]
- 29.Egger M, Davey Smith G, Schneider M, Minder C. Bias in meta-analysis detected by a simple, graphical test. BMJ 1997;315:629–34. [DOI] [PMC free article] [PubMed]
- 30.Jaeschke R, Guyatt G, Lijimer J. Diagnostic tests. In: Guyatt G, Rennie D, editors. User’s guide to the medical literature. Chicago: AMA Press; 2002. p. 121–40.
- 31.DerSimonian R, Laird N. Meta-analysis in clinical trials. Control Clin Trials 1986;7:177–88. [DOI] [PubMed]
- 32.Zarmora J, Abraira V, Muriel A, Khan KS, Coomarasamy A. Meta-DiSc: a software for meta-analysis of test accuracy data. BMC Med Res Methodol 2006;6:31 [DOI] [PMC free article] [PubMed]
- 33.Gebo KA, Chander G, Jenckes MW, Ghanem KG, Herlong HF, Torbenson MS, et al. Screening tests for hepatocellular carcinoma in patients with chronic hepatitis C: a systematic review. Hepatology 2002;36:S84–92. [DOI] [PubMed]
- 34.Gupta S, Bent S, Kohlwes J. Test characteristics of alpha-fetoprotein for detecting hepatocellular carcinoma in patients with hepatitis C. A systematic review and critical analysis. Ann Intern Med 2003;139:46–50. [DOI] [PubMed]
- 35.Fujiyama S, Izuno K, Yamasaki K, Sato T, Taketa K. Determination of optimum cutoff levels of plasma des-gamma-carboxy prothrombin and serum alpha-fetoprotein for the diagnosis of hepatocellular carcinoma using receiver operating characteristic curves. Tumour Biol 1992;13:316–23. [DOI] [PubMed]
- 36.Tong MJ, Blatt LM, Kao VW. Surveillance for hepatocellular carcinoma in patients with chronic viral hepatitis in the United States of America. J Gastroenterol Hepatol 2001;16:553–9. [DOI] [PubMed]
- 37.Pateron D, Ganne N, Trinchet JC, Aurousseau MH, Mal F, Meicler C, et al. Prospective study of screening for hepatocellular carcinoma in Caucasian patients with cirrhosis. J Hepatol 1994;20:65–71. [DOI] [PubMed]
- 38.Piantino P, Arrigoni A, Brunetto MR, Gindro T. Alpha-fetoprotein in hepatic pathology and hepatocarcinoma. J Nucl Med Allied Sci 1989;33:34–8. [PubMed]
- 39.Khien VV, Mao HV, Chinh TT, Ha PT, Bang MH, Lac BV, et al. Clinical evaluation of lentil lectin-reactive alpha-fetoprotein-L3 in histology-proven hepatocellular carcinoma. Int J Biol Markers 2001;16:105–11. [DOI] [PubMed]
- 40.Trevisani F, D’Intino PE, Morselli-Labate AM, Mazzella G, Accogli E, Caraceni P, et al. Serum alpha-fetoprotein for diagnosis of hepatocellular carcinoma in patients with chronic liver disease: influence of HBsAg and anti-HCV status. J Hepatol 2001;34:570–5. [DOI] [PubMed]
- 41.McMahon BJ, Bulkow L, Harpster A, Snowball M, Lanier A, Sacco F, et al. Screening for hepatocellular carcinoma in Alaska natives infected with chronic hepatitis B: a 16-year population-based study. Hepatology 2000;32:842–6. [DOI] [PubMed]
- 42.Peng YC, Chan CS, Chen GH. The effectiveness of serum alpha-fetoprotein level in anti-HCV positive patients for screening hepatocellular carcinoma. Hepatogastroenterology 1999;46:3208–11. [PubMed]
- 43.Kuromatsu R, Tanaka M, Shimauchi Y, Shimada M, Tanikawa K, Watanabe K, et al. Usefulness of ED036 kit for measuring serum PIVKA-II levels in small hepatocellular carcinoma. J Gastroenterol 1997;32:507–12. [DOI] [PubMed]
- 44.Furui J, Furukawa M, Kanematsu T. The low positive rate of serum alpha-fetoprotein levels in hepatitis C virus antibody-positive patients with hepatocellular carcinoma. Hepatogastroenterology 1995;42:445–9. [PubMed]
- 45.Grazi GL, Mazziotti A, Legnani C, Jovine E, Miniero R, Gallucci A, et al. The role of tumor markers in the diagnosis of hepatocellular carcinoma, with special reference to the des-gamma-carboxy prothrombin. Liver Transpl Surg 1995;1:249–55. [DOI] [PubMed]
- 46.Tsai JF, Chang WY, Jeng JE, Ho MS, Lin ZY, Tsai JH. Frequency of raised alpha-fetoprotein level among Chinese patients with hepatocellular carcinoma related to hepatitis B and C. Br J Cancer 1994;69:1157–9. [DOI] [PMC free article] [PubMed]
- 47.Oka H, Tamori A, Kuroki T, Kobayashi K, Yamamoto S. Prospective study of alpha-fetoprotein in cirrhotic patients monitored for development of hepatocellular carcinoma. Hepatology 1994;19:61–6. [PubMed]
- 48.Tu Z, Yin Z, Wu M. Prospective study on the diagnosis of hepatocellular carcinoma by using alpha-fetoprotein reactive to lentil lectin. Chin Med Sci J 1992;7:191–6. [PubMed]
- 49.Taketa K, Sekiya C, Namiki M, Akamatsu K, Ohta Y, Endo Y, et al. Lectin-reactive profiles of alpha-fetoprotein characterizing hepatocellular carcinoma and related conditions. Gastroenterology 1990;99:508–18. [DOI] [PubMed]
- 50.Deyashiki Y, Nishioka Y, Takahashi K, Kosaka Y, Suzuki K. Evaluation of des-gamma-carboxy prothrombin as a marker protein of hepatocellular carcinoma. Cancer 1989;64:2546–51. [DOI] [PubMed]
- 51.King MA, Kew MC, Kuyl JM, Atkinson PM. A comparison between des-gamma-carboxy prothrombin and alpha-fetoprotein as markers of hepatocellular carcinoma in southern African blacks. J Gastroenterol Hepatol 1989;4:17–24. [DOI] [PubMed]
- 52.Aoyagi Y, Suzuki Y, Isemura M, Nomoto M, Sekine C, Igarashi K, et al. The fucosylation index of alpha-fetoprotein and its usefulness in the early diagnosis of hepatocellular carcinoma. Cancer 1988;61:769–74. [DOI] [PubMed]
- 53.Chan DW, Kelsten M, Rock R, Bruzek D. Evaluation of a monoclonal immunoenzymometric assay for alpha-fetoprotein. Clin Chem 1986;32:1318–22. [PubMed]
- 54.Saitoh S, Ikeda K, Koida I, Suzuki Y, Kobayashi M, Tsubota A, et al. Diagnosis of hepatocellular carcinoma by concanavalin A affinity electrophoresis of serum alpha-fetoprotein. Cancer 1995;76:1139–44. [DOI] [PubMed]
- 55.Chalasani N, Horlander JC Sr, Said A, Hoen H, Kopecky KK, Stockberger SM Jr, et al. Screening for hepatocellular carcinoma in patients with advanced cirrhosis. Am J Gastroenterol 1999;94:2988–93. [DOI] [PubMed]
- 56.Izzo F, Cremona F, Ruffolo F, Palaia R, Parisi V, Curley SA. Outcome of 67 patients with hepatocellular cancer detected during screening of 1125 patients with chronic hepatitis. Ann Surg 1998;227:513–8. [DOI] [PMC free article] [PubMed]
- 57.Cedrone A, Covino M, Caturelli E, Pompili M, Lorenzelli G, Villani MR, et al. Utility of alpha-fetoprotein (AFP) in the screening of patients with virus-related chronic liver disease: does different viral etiology influence AFP levels in HCC? A study in 350 western patients. Hepatogastroenterology 2000;47:1654–8. [PubMed]
- 58.Nguyen MH, Garcia RT, Simpson PW, Wright TL, Keeffe EB. Racial differences in effectiveness of alpha-fetoprotein for diagnosis of hepatocellular carcinoma in hepatitis C virus cirrhosis. Hepatology 2002;36:410–7. [DOI] [PubMed]
- 59.Larcos G, Sorokopud H, Berry G, Farrell GC. Sonographic screening for hepatocellular carcinoma in patients with chronic hepatitis or cirrhosis: an evaluation. Am J Roentgenol 1998;171:433–5. [DOI] [PubMed]
- 60.Tsai JF, Jeng JE, Ho MS, Chang WY, Lin ZY, Tsai JH. Clinical evaluation of serum alpha-fetoprotein and circulating immune complexes as tumour markers of hepatocellular carcinoma. Br J Cancer 1995;72:442–6. [DOI] [PMC free article] [PubMed]
- 61.Izzo F, Cremona F, Ruffolo F, Palaia R, Parisi V, Curley S. Detection of hepatocellular cancer during screening of 1125 patients with chronic hepatitis virus infection. J Chemother 1997;9:151–2. [DOI] [PubMed]
- 62.Curley SA, Izzo F, Gallipoli A, de Bellis M, Cremona F, Parisi V. Identification and screening of 416 patients with chronic hepatitis at high risk to develop hepatocellular cancer. Ann Surg 1995;222:375–80; discussion 80–3 [DOI] [PMC free article] [PubMed]
- 63.Gambarin-Gelwan M, Wolf DC, Shapiro R, Schwartz ME, Min AD. Sensitivity of commonly available screening tests in detecting hepatocellular carcinoma in cirrhotic patients undergoing liver transplantation. Am J Gastroenterol 2000;95:1535–8. [DOI] [PubMed]
- 64.Izuno K, Fujiyama S, Yamasaki K, Sato M, Sato T. Early detection of hepatocellular carcinoma associated with cirrhosis by combined assay of des-gamma-carboxy prothrombin and alpha-fetoprotein: a prospective study. Hepatogastroenterology 1995;42:387–93. [PubMed]
- 65.Ikeda K, Saitoh S, Koida I, Arase Y, Tsubota A, Chayama K, et al. A multivariate analysis of risk factors for hepatocellular carcinogenesis: a prospective observation of 795 patients with viral and alcoholic cirrhosis. Hepatology 1993;18:47–53. [PubMed]
- 66.Tradati F, Colombo M, Mannucci PM, Rumi MG, De Fazio C, Gamba G, et al., for the Study Group of the Association of Italian Hemophilia Centers. A prospective multicenter study of hepatocellular carcinoma in Italian hemophiliacs with chronic hepatitis C. Blood 1998;91:1173–7. [PubMed]
- 67.Solmi L, Primerano AM, Gandolfi L. Ultrasound follow-up of patients at risk for hepatocellular carcinoma: results of a prospective study on 360 cases. Am J Gastroenterol 1996;91:1189–94. [PubMed]
- 68.Cottone M, Turri M, Caltagirone M, Parisi P, Orlando A, Fiorentino G, et al. Screening for hepatocellular carcinoma in patients with Child’s A cirrhosis: an 8-year prospective study by ultrasound and alphafetoprotein. J Hepatol 1994;21:1029–34. [DOI] [PubMed]
- 69.Fujiyama S, Morishita T, Hashiguchi O, Sato T. Plasma abnormal prothrombin (des-gamma-carboxy prothrombin) as a marker of hepatocellular carcinoma. Cancer 1988;61:1621–8. [DOI] [PubMed]
- 70.Ikoma J, Kaito M, Ishihara T, Nakagawa N, Kamei A, Fujita N, et al. Early diagnosis of hepatocellular carcinoma using a sensitive assay for serum des-gamma-carboxy prothrombin: a prospective study. Hepatogastroenterology 2002;49:235–8. [PubMed]
- 71.Kasahara A, Hayashi N, Fusamoto H, Kawada Y, Imai Y, Yamamoto H, et al. Clinical evaluation of plasma des-gamma-carboxy prothrombin as a marker protein of hepatocellular carcinoma in patients with tumors of various sizes. Dig Dis Sci 1993;38:2170–6. [DOI] [PubMed]
- 72.Maringhini A, Cottone M, Sciarrino E, Marceno MP, La Seta F, Fusco G, et al. Ultrasonography and alpha-fetoprotein in diagnosis of hepatocellular carcinoma in cirrhosis. Dig Dis Sci 1988;33:47–51. [DOI] [PubMed]
- 73.Mita Y, Aoyagi Y, Yanagi M, Suda T, Suzuki Y, Asakura H. The usefulness of determining des-gamma-carboxy prothrombin by sensitive enzyme immunoassay in the early diagnosis of patients with hepatocellular carcinoma. Cancer 1998;82:1643–8. [DOI] [PubMed]
- 74.Nomura F, Ishijima M, Horikoshi A, Nakai T, Ohnishi K. Determination of serum des-gamma-carboxy prothrombin levels in patients with small-sized hepatocellular carcinoma: comparison of the conventional enzyme immunoassay and two modified methods. Am J Gastroenterol 1996;91:1380–3. [PubMed]
- 75.Nomura F, Ishijima M, Kuwa K, Tanaka N, Nakai T, Ohnishi K. Serum des-gamma-carboxy prothrombin levels determined by a new generation of sensitive immunoassays in patients with small-sized hepatocellular carcinoma. Am J Gastroenterol 1999;94:650–4. [DOI] [PubMed]
- 76.Oka H, Saito A, Ito K, Kumada T, Satomura S, Kasugai H, et al. Multicenter prospective analysis of newly diagnosed hepatocellular carcinoma with respect to the percentage of lens culinaris agglutinin-reactive alpha-fetoprotein. J Gastroenterol Hepatol 2001;16:1378–83. [DOI] [PubMed]
- 77.Sassa T, Kumada T, Nakano S, Uematsu T. Clinical utility of simultaneous measurement of serum high-sensitivity des-gamma-carboxy prothrombin and lens culinaris agglutinin A-reactive alpha-fetoprotein in patients with small hepatocellular carcinoma. Eur J Gastroenterol Hepatol 1999;11:1387–92. [DOI] [PubMed]
- 78.Saitoh S, Ikeda K, Koida I, Tsubota A, Arase Y, Chayama K, et al. Serum des-gamma-carboxyprothrombin concentration determined by the avidin–biotin complex method in small hepatocellular carcinomas. Cancer 1994;74:2918–23. [DOI] [PubMed]
- 79.Shimauchi Y, Tanaka M, Kuromatsu R, Ogata R, Tateishi Y, Itano S, et al. A simultaneous monitoring of lens culinaris agglutinin A-reactive alpha-fetoprotein and des-gamma-carboxy prothrombin as an early diagnosis of hepatocellular carcinoma in the follow-up of cirrhotic patients. Oncol Rep 2000;7:249–56. [DOI] [PubMed]
- 80.Shiraki K, Takase K, Tameda Y, Hamada M, Kosaka Y, Nakano T. A clinical study of lectin-reactive alpha-fetoprotein as an early indicator of hepatocellular carcinoma in the follow-up of cirrhotic patients. Hepatology 1995;22:802–7. [PubMed]
- 81.Suehiro T, Sugimachi K, Matsumata T, Itasaka H, Taketomi A, Maeda T. Protein induced by vitamin K absence or antagonist II as a prognostic marker in hepatocellular carcinoma. Comparison with alpha-fetoprotein. Cancer 1994;73:2464–71. [DOI] [PubMed]
- 82.Taketa K, Endo Y, Sekiya C, Tanikawa K, Koji T, Taga H, et al. A collaborative study for the evaluation of lectin-reactive alpha-fetoproteins in early detection of hepatocellular carcinoma. Cancer Res 1993;53:5419–23. [PubMed]
- 83.Tanabe Y, Ohnishi K, Nomura F, Iida S. Plasma abnormal prothrombin levels in patients with small hepatocellular carcinoma. Am J Gastroenterol 1988;83:1386–9. [PubMed]
- 84.Tsai SL, Huang GT, Yang PM, Sheu JC, Sung JL, Chen DS. Plasma des-gamma-carboxyprothrombin in the early stage of hepatocellular carcinoma. Hepatology 1990;11:481–8. [DOI] [PubMed]
- 85.Giannini E, Arzani L, Borro P, Botta F, Fasoli A, Risso D, et al. Does surveillance for hepatocellular carcinoma in HCV cirrhotic patients improve treatment outcome mainly due to better clinical status at diagnosis? Hepatogastroenterology 2000;47:1395–8. [PubMed]
- 86.Koike Y, Shiratori Y, Sato S, Obi S, Teratani T, Imamura M, et al. Des-gamma-carboxy prothrombin as a useful predisposing factor for the development of portal venous invasion in patients with hepatocellular carcinoma: a prospective analysis of 227 patients. Cancer 2001;91:561–9. [DOI] [PubMed]
- 87.Imamura H, Matsuyama Y, Miyagawa Y, Ishida K, Shimada R, Miyagawa S, et al. Prognostic significance of anatomical resection and des-gamma-carboxy prothrombin in patients with hepatocellular carcinoma. Br J Surg 1999;86:1032–8. [DOI] [PubMed]
- 88.Begg CB, Berlin JA. Publication bias and dissemination of clinical research. J Natl Cancer Inst 1989;81:107–15. [DOI] [PubMed]
- 89.Lijmer JG, Mol BW, Heisterkamp S, Bonsel GJ, Prins MH, van der Meulen JH, et al. Empirical evidence of design-related bias in studies of diagnostic tests. JAMA 1999;282:1061–6. [DOI] [PubMed]
- 90.Bossuyt PM, Reitsma JB, Bruns DE, Gatsonis CA, Glasziou PP, Irwig LM, et al. Towards complete and accurate reporting of studies of diagnostic accuracy: The STARD Initiative. Ann Intern Med 2003;138:40–4. [DOI] [PubMed]
- 91.Bossuyt PM, Reitsma JB, Bruns DE, Gatsonis CA, Glasziou PP, Irwig LM, et al. The STARD statement for reporting studies of diagnostic accuracy: explanation and elaboration. Ann Intern Med 2003;138:W1–12. [DOI] [PubMed]
- 92.Lok AS, Lai CL. Alpha-fetoprotein monitoring in Chinese patients with chronic hepatitis B virus infection: role in the early detection of hepatocellular carcinoma. Hepatology 1989;9:110–5. [DOI] [PubMed]
- 93.The Study Group for Evidence Based Guideline for the Diagnosis and Treatment of Hepatocellular Carcinoma. Evidence based guideline for the diagnosis and treatment of hepatocellular carcinoma. Tokyo: Kanehara & Co; 2005.