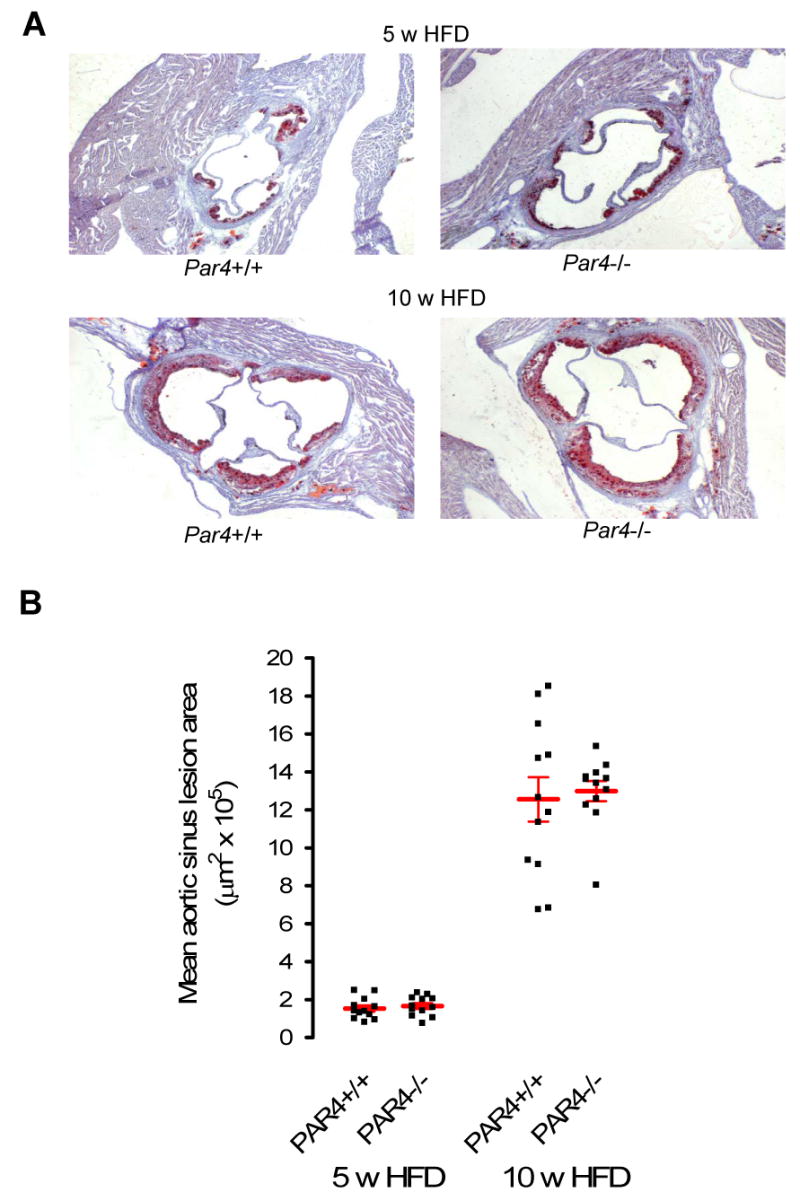
Fig. 3. Size of aortic sinus atheroma.

Aortic sinus lesions were analyzed in littermate ApoE-/- mice that were Par4+/+ or Par4-/- and treated as in Fig.2. A: Representative images of oil red-O staining of aortic sinuses, counterstained with hemotoxylin. Red represents positive staining by oil red-O and therefore lipid deposits. B: Cross sectional area of sinus lesions. Individual data points, each representing an individual mouse, are shown. HFD = High fat diet (21% fat, 0.15% cholesterol). Bars are mean ± sem. N = 12 per group.
