

Abstract
Biological tissues behave in certain respects like liquids. Consequently, the surface tension concept can be used to explain aspects of the in vitro and in vivo behavior of multicellular aggregates. Unfortunately, conventional methods of surface tension measurement cannot be readily applied to small cell aggregates. This difficulty can be overcome by an experimentally straightforward method consisting of centrifugation followed by axisymmetric drop shape analysis (ADSA). Since the aggregates typically show roughness, standard ADSA cannot be applied and we introduce a novel numerical method called ADSA-IP (ADSA for imperfect profile) for this purpose. To examine the new methodology, embryonic tissues from the gastrula of the frog, Xenopus laevis, deformed in the centrifuge are used. It is confirmed that surface tension measurements are independent of centrifugal force and aggregate size. Surface tension is measured for ectodermal cells in four sample batches, and varies between 1.1 and 7.7 mJ/m2. Surface tension is also measured for aggregates of cells expressing cytoplasmically truncated EP/C-cadherin, and is approximately half as large. In parallel, such aggregates show a reduction in convergent extension-driven elongation after activin treatment, reflecting diminished intercellular cohesion.
Introduction
Biological tissues behave in certain respects like liquids. Individual cells are free to move relative to each other, and tend to maximize the cohesive contacts that hold them together. This behavior allows the definition of a surface tension for an aggregate of cells. The surface tension is a macroscopic reflection of the intercellular cohesion, and acts to minimize the exposed area of the aggregate (1). The concept of tissue surface tension can be used to explain aspects of the in vitro and in vivo behavior of multicellular aggregates (2–4). For example, in the gastrula of the frog Xenopus laevis, the forces generated by tissue surface tensions are of the same order of magnitude as other morphogenetic forces. One such other force is that caused by an active cell rearrangement that drives a characteristic narrowing and lengthening of the chordamesoderm, termed convergent extension. In this situation, coating of the chordamesoderm with an epithelial layer reduces surface tension such that the morphogenetic process is facilitated. The effects of surface and of interfacial tensions also contribute to the positioning of tissues in the developing Xenopus embryo (5). Other applications of the tissue surface tension concept include the invasiveness of brain tumors, which can be correlated with the surface tension of tumor tissue (6,7), and the guidance of self-assembly of pancreatic islets in vitro by surface tension differentials (8).
Liquid-fluid surface tension can be measured in various ways by balancing it against a known or applied force. Unfortunately, conventional methods of surface tension measurement cannot be readily used for tissue surface tension measurement. The small size of cell aggregates, due to physiological requirements, precludes use of, e.g., the Wilhelmy plate method or the spinning drop method.
Recently, a new method has been proposed to measure the surface tension of cell aggregates (9–11). In this method, a spherical aggregate is deformed between two parallel plates and allowed to reach a new equilibrium. The aggregate is positioned on the bottom plate, which is then raised until the aggregate is deformed to some extent between the two plates. The upper plate is suspended from the arm of an electrobalance. The exerted force can be found by measuring the change in the weight of the upper plate. After stress relaxation of the cell aggregate, equilibrium is reached, and the aggregate profile is captured by a camera and used to calculate geometrical information such as the principal radii of curvature of the cell cluster. The force exerted on the parallel plates is used to calculate the pressure difference between the aggregate and the surrounding liquid. This pressure difference in conjunction with the Laplace equation of capillarity is used to determine the surface tension of the cell aggregate, with precision of ∼0.2 mJ/m2 (1 mJ/m2 = 1 mN/m = 1 dyne/cm).
Among the conventional methods of surface tension measurement, drop shape techniques have proven to be reliable and easy to handle (12). In these methods, the unknown surface tension is measured by balancing it against a known gravitational force. When the two forces are of comparable magnitude, surface tension can be determined by fitting the shape of a drop to the Laplace equation (12). Despite the high capabilities of drop shape methods, it has been shown that all drop shape methods fail when surface tension overpowers gravity and the shape of the drop is close to spherical (12). The relative strengths of gravity and surface tension are measured by the Bond number, Bo = ΔρgR2/γ. Using typical values from amphibians for aggregate radius (R = 0.3 mm) (13), surface tension (γ = 1 mJ/m2) (13), and density difference relative to water (Δρ = 70 kg/m3) (14), the Bond number is 0.06. This order-of-magnitude argument shows that normal gravity would hardly affect the surface tension-induced spherical shape of the aggregate at equilibrium. A higher external force is required.
This higher force can be produced by centrifugation. Centrifugation has been used to qualitatively determine differences in tissue surface tension (15). However, a quantitative measurement was not attempted due to a density gradient in the culture medium that was believed to be caused by the presence of serum (13). More recently (5), embryonic tissues from X. laevis were deformed in the centrifuge at 100 g. To obtain a numerical estimate of the surface tension of the cell aggregates, a set of Laplacian profiles was generated in the range of surface tension literature values for 100 g. Then, the theoretical profile best matching the cell aggregate profile was selected by visual inspection to determine the operative surface tension (5). In the work reported here, a more accurate and less subjective method is obtained by redeveloping the whole approach in the framework of axisymmetric drop shape analysis (ADSA) (12).
ADSA is a drop shape method that has been used widely to analyze liquid-fluid interfaces (12). In ADSA, the experimental profile's coordinates are obtained through an image analysis process including edge detection and optical correction modules. The experimental profile and physical properties such as density difference are the inputs to the numerical scheme. In the numerical scheme, a series of Laplacian curves with known surface tension are fitted to the experimental profile. The best fit identifies the true liquid-fluid interfacial tension. Despite the high accuracy of ADSA, it was not directly suitable to determine surface tension of cell aggregates. Since cell aggregates are not perfectly homogeneous, they show roughness and irregularities on their surface. These irregularities necessitate a modification in edge detection strategy and, more importantly, would likely lead to local minima in the objective function, preventing convergence to the correct interfacial tension.
Thus, more robust numerical methods were required. The new methodology, or ADSA for imperfect profile (ADSA-IP), employs a suitable technique for edge detection as well as a new, simpler objective function and robust optimization procedure. The resulting overall method can accurately measure tissue surface tensions while requiring only standard laboratory equipment (a centrifuge).
We applied ADSA-IP to study embryos of the frog, Xenopus laevis. During gastrulation, the Xenopus embryo consists essentially of a single tissue whose different parts are engaged, however, in different types of morphogenetic movements. Most of these gastrulation processes involve the rearrangement of cells that adhere reversibly to each other, and the strength of tissue cohesion is an important factor in their movement (16). For example, experimental reduction, but also overstimulation of cell adhesion, have been reported to interfere with convergent extension movement (17,18). Experimental changes in cell adhesiveness are usually demonstrated by assays that involve the breaking up of the tissue into single cells, for example in dissociation/reaggregation assays or in cell-substrate binding tests (19). However, tissue surface tension is a reflection of the cohesive strength between cells in an aggregate, and its measurement can be used to determine cohesiveness in intact cell aggregates (e.g., (11,20)).
Despite its relevance for morphogenesis, surface tensions of gastrula-stage tissues have not been measured extensively. Respective values have been accurately determined for the germ layers of another amphibian, Rana pipiens (13), and for the zebrafish (20). For Xenopus, another major vertebrate model organism, the magnitude of the surface tension has only been estimated for the chordamesoderm (5).
In the following sections, we describe ADSA-IP in greater detail. Then, using Xenopus gastrula tissue, we investigate the independence of surface tension with respect to centrifugal force and aggregate size, to verify that a surface tensionlike property is being measured. After this, values for the surface tension of explants from the ectodermal tissue layer of four batches of Xenopus gastrula are presented. Finally, surface tension measurements are used to characterize the experimental reduction in tissue cohesiveness brought about by an interference with the function of EP/C-cadherin, the major adhesion molecule in the early Xenopus embryo (21–23). The effect of reduced cohesiveness is then related to observations of convergent extension movement.
Methodology
ADSA-IP consists of three main modules. The first is the image processing module, which performs edge detection and computation of the aggregate's geometrical properties using a semiautomatic procedure. The second module generates theoretical shapes of the idealized cell aggregates for hypothetical surface tensions. The third module is the optimization that finds the best match among the theoretical profiles and the corresponding surface tension.
Image processing module
In this module, the experimental profile, consisting of a series of coordinate points, is extracted from the image of a cell aggregate. The images of cell aggregates were converted from color images to digital gray level images. The gray level for every pixel in the image is between 0 and 255, which represents black and white, respectively. A typical edge detector called Canny (24), available as a built-in function in the MATLAB Image Processing Toolbox (The MathWorks, Natick, MA), was used. Some parameters of the Canny edge detector, such as thresholds, were manually adjusted to obtain the desired cell aggregate profiles. Some geometrical properties (volume and main axes) of the aggregate were required for the optimization module. The main axes of the cluster were easily calculated from the coordinates of the points extracted by the edge detector. A sample cell cluster (ectodermal cells) is shown in Fig. 1 A, as well as the interface as detected by the Canny operator (Fig. 1 B). In this figure, Lexp and Wexp represent the two main axes of the cell cluster. Since the volume cannot be obtained experimentally, it was required to estimate the volumes of cell clusters from their two-dimensional images. For this purpose, the samples were assumed to be axisymmetric ellipsoids, i.e., spheroids. Given Lexp and Wexp, the volume of a cell mass can be calculated as
| (1) |
Figure 1.
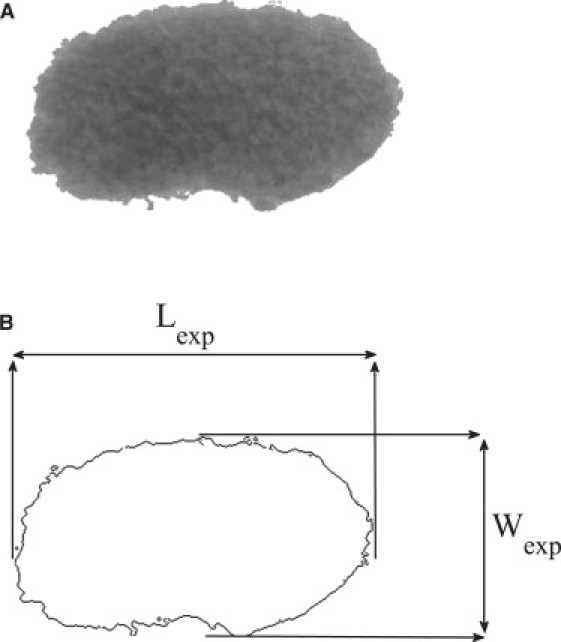
(A) Ectodermal cell aggregate after applying centrifugation of 100 × g. (B) Layout of the interface after edge detection.
Axisymmetric liquid-fluid interfaces (ALFI)
Mathematically, the balance between surface tension and external forces, such as gravity, is given by the Laplace equation of capillarity,
| (2) |
where γ is surface tension, R1 and R2 are the two principal radii of curvature, and ΔP is the pressure difference across the interface. Surface properties can be measured by analyzing the experimental shape of a liquid-fluid interface and comparing it with the solution of the Laplace equation. In a gravitational field pointing in the z direction, the Laplace equation can be rewritten as (25)
| (3) |
| (4) |
where ϕ is the angle of inclination of the interface to the horizontal (x direction), s is the arc length along the interface, b is the curvature at the apex, 1/c is the square of the capillary length, g is the gravitational acceleration, and Δρ is the density difference between the two bulk phases. Since the cell aggregates do not adhere to the agar surface on which they rest, a 180° contact angle boundary condition was assumed.
A program called axisymmetric liquid-fluid interfaces (ALFI) was introduced by del Rio and Neumann (25) for numerical integration of the Laplace equation to generate the theoretical profile of a drop. ALFI predicts the shapes of drops for given surface tension, density difference, gravitational acceleration, and profile curvature at the apex. The volume and the coordinates of the points forming the theoretical profile are the outputs from ALFI. ALFI was originally written in C language using Fortran libraries, and now has been rewritten in MATLAB to take advantage of the user-friendly interface of MATLAB. For the new version of ALFI in MATLAB, a multistep differential equation solver called Adams-Bashforth-Moulton was applied.
Fig. 2 shows ALFI calculations of theoretical aggregate shapes in normal gravity and at 100 × g, beside images of actual cell aggregates under these conditions. It is seen that under normal gravity, as argued in the Introduction, different hypothetical cell aggregate surface tensions (in the range usually observed) lead to virtually identical aggregate shapes (Fig. 2 B), whereas at 100 × g the surface tension strongly influences the shape (Fig. 2 D). Therefore, at 100 × g the experimental shape can be used to accurately infer the operative surface tension by finding the best matching theoretical profile. For this, a suitable optimization algorithm was required.
Figure 2.
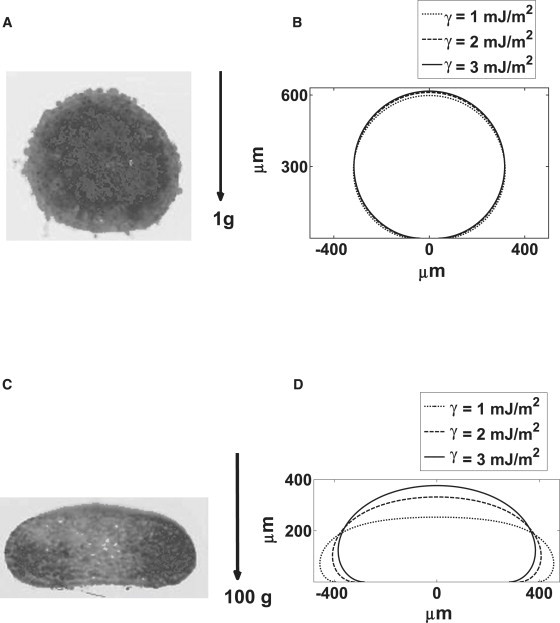
(A) Ectodermal cell aggregate in normal gravity. (B) Laplacian profiles for three different surface tension values in normal gravity for volume of 0.13 μL. (C) Ectodermal cell aggregate after applying centrifugation of 100 × g. (D) Laplacian profiles for three different surface tension values in 100 × g centrifugation for volume of 0.13 μL.
Optimization procedure
In any optimization procedure, an objective function is minimized over a reasonable interval of the appropriate optimization parameters. As these profiles have some irregularities, a simple optimization scheme was developed. The deviation between the volume and the two main axes of the cell aggregate and those of the Laplacian curves were used as the elements of the objective function,
| (5) |
where Lth and Wth are the main axes of the theoretical profile, and Vth is the theoretical volume.
The curvature b at the apex of the drop and the constant c (both in Eq. 3) were considered as the optimization parameters. To minimize the objective function, E, a method called Nelder-Mead simplex was used as the optimization method (26).
After every iteration, the optimization parameters are updated and, consequently, the theoretical profile is changed and generated again. Therefore, the Laplace equation is integrated after every iteration. The minimum of the objective function determines the Laplacian curve that best fits the given experimental profile, from which surface tension can be readily found.
Fig. 3 shows the entire procedure for ADSA-IP. Compared to the standard ADSA, ADSA-IP uses a simpler numerical method for fitting the Laplacian curves to the experimental profile. In the standard ADSA, the sum of squares of normal distances between the experimental points extracted from edge detection and the theoretical profile is minimized to find the best fit. Applying this method to the aggregate profile with high irregularities would lead to local minima. Therefore, to avoid the local minima, a simpler fitting method is implemented in ADSA-IP, which compares the volume and the main axes of the theoretical drop with those of the cell aggregate. This simplification in the optimization process decreases the number of optimization parameters and computational cost in ADSA-IP compared to the standard ADSA.
Figure 3.
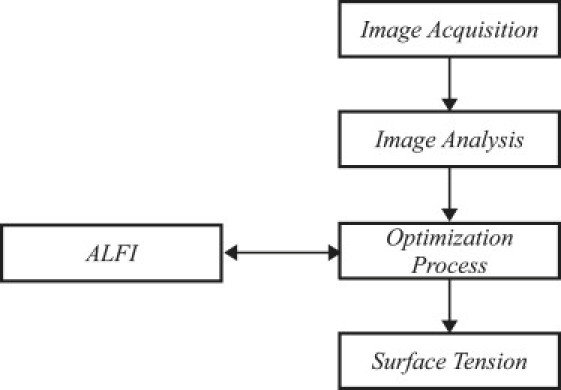
Flowchart of measuring the surface tension for a cell aggregate.
Sensitivity of the method
To examine the method, an image of a cell aggregate was selected and processed (Fig. 4). The surface tension obtained was 2.6 mJ/m2. To illustrate the sensitivity of the method, three different values of the surface tension (2.1, 2.6, and 3.1 mJ/m2) were chosen, and the three corresponding Laplacian curves with the same volume as the sample were generated using the code described for generating Fig. 2, B and D. These theoretical profiles were superimposed on the image of the sample. As shown in Fig. 4, errors of 0.5 mJ/m2 in the surface tension produce clearly inaccurate theoretical profiles. Fig. 4 suggests that a precision of 0.2 ∼ 0.3 mJ/m2 is realistic, which is similar to the accuracy of compression plate tensiometry (27). The minimum measurable tissue surface tension is in fact lower than 0.1 mJ/m2 because the profile becomes more sensitive to the surface tension value at very low surface tensions (not shown). The precision of ADSA-IP is limited by the unavoidable irregularity of the cell aggregate profiles rather than by any feature of the numerical scheme itself.
Figure 4.
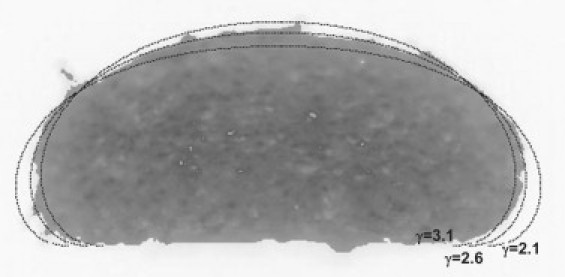
Different Laplacian curves with different surface tensions (2.1, 2.6, and 3.1 mJ/m2) superimposed on a sample cell aggregate. The value of surface tension obtained from the numerical method was 2.6 mJ/m2.
Experimental Procedure
X. laevis embryos were obtained by in vitro fertilization. For ectodermal aggregates, all embryos were injected animally at the four-cell stage, with either EPΔC mRNA or, as a control, β-galactosidase (β-gal) mRNA (28). For the centrifugation experiments, 500 pg per blastomere of mRNA was injected. Ectodermal explants were excised from stage 10 embryos. The outer epithelial layer was peeled from an area 750 μm in diameter around the animal pole region, and the inner layer of cells was isolated (1000–2500 cells). For large explants, four inner layers (diameter of 1000 μm, each with thickness 50–100 μm) were piled up to allow fusion into a single aggregate. Chordamesoderm cell aggregates were prepared uniformly from noninjected embryos as described before (29). The aggregates were allowed to round up for 2–3 h in Steinberg's Solution (SS (30)), and processed for centrifugation at room temperature. The lack of serum in the culture medium meant that density gradients that were problematic in similar earlier work (15) were avoided.
Before loading cell aggregates, the bottoms of the centrifuge tubes were filled with 5% liquid agarose, which solidified during a preliminary centrifugation run and generated a support surface for the aggregates that was perpendicular to the centrifugation force. Immediately after centrifugation, explants were fixed with 4% paraformaldehyde, fractured, and photographed to document the explant profile.
To determine explant density, SS was layered on top of a mixture of SS and Ficoll in centrifugation tubes. Explant fragments were placed in the top phase, and centrifuged at 100 × g for 3 min. Cell aggregates were sinking to the bottom at Ficoll concentrations below 19%, and floating at the interface at concentrations above, indicating that the density of explants corresponded to that of a solution of 19% Ficoll in SS. Weighing a defined volume of that solution gave a density of 1.069 g/ml.
For the elongation assay, ectoderm explants of 600-μm diameter, 50–100-μm thickness were isolated from stage 9 embryos, treated with 5 ng/ml (in SS supplemented with 0.1% BSA) of recombinant human activin A (RD338-AC; Cedarlane Laboratories, Burlington, Canada) for 1 h and cultured in SS until control embryos reached stage 18. Seven to ten explants were prepared for each condition. Length and width of explants were measured after fixation with 4% paraformaldehyde.
Results and Discussion
Verification of surface tension measurement
Since ADSA-IP is applicable to only equilibrium configurations, it was necessary to find the time required for cell aggregates to reach equilibrium shapes in the centrifuge. To determine this time, ADSA-IP results for ectodermal cell aggregates from a single batch were calculated after different centrifugation times at 100 × g. Fig. 5 shows sample ectodermal cell aggregates at different times. After 1 h of centrifugation the average value (of four samples) and standard error from ADSA-IP was 2.7 ± 0.7 mJ/m2, whereas after 2 h it was 2.6 ± 0.5 mJ/m2. Thus, within our precision, equilibrium was reached after 1 h of centrifugation, and the results just quoted did represent tissue surface tensions.
Figure 5.
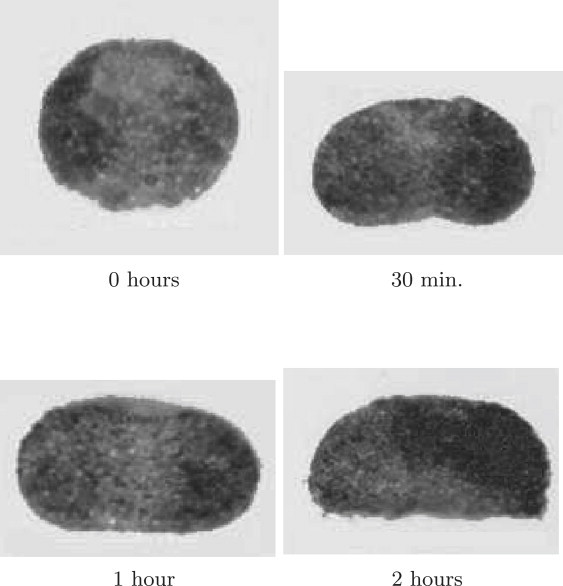
Ectodermal cell aggregates after different durations of centrifugation at 100 × g.
Equilibrium was reached more quickly, both in the centrifuge and for rounding up in normal gravity, than for chick embryo tissues observed by previous researchers (15). This implied a lower viscosity of X. laevis aggregates (31). A lower centrifugal force was also required for deformation of the aggregates compared to previous researchers (2000–12,000 × g (15)); this was due to the lower surface tension of X. laevis tissue (see the discussion of the Bond number in the Introduction).
In the experimental procedure, the cell aggregates were fixed after stopping the centrifuge and then their images were taken. Approximately 2–3 min elapsed between the last moment the aggregates were subjected to 100 × g and the fixation. During this time, the aggregates would have begun to round up into their near-spherical equilibrium shape under normal gravity. However, no visible changes in aggregate shape were observed. Considering the much longer time (2–3 h) required for newly explanted aggregates to round up, the delay before fixation was expected to have only a minor effect on the surface tension results.
Since the value of surface tension should be independent of both the magnitude of centrifugal force and the sample size, ADSA-IP was examined by measuring the surface tensions of cell aggregates at different centrifugal forces and of different sizes. In these experiments, chordamesodermal aggregates were used, and the surface tension was measured after 2 h at three different centrifugal forces, 30 × g, 50 × g, and 100 × g (Fig. 6). The experimental images show that the 30 × g force was sufficient to deform the aggregates and allow surface tension measurement. As seen in Fig. 6, whereas the flattening of the aggregates varied with the centrifugal force, the average values of surface tension were similar. The probability that tissue surface tension varied with centrifugal force was 0.40, as calculated using the F-test. In fact, results were more uniform with chordamesodermal aggregates than with ectodermal aggregates (see below) because the chordamesodermal aggregates each contained a mixture of cells from a few embryos (5). In this case, the surface tension of the mixed aggregate should correspond to the lowest surface tension among the original embryos.
Figure 6.
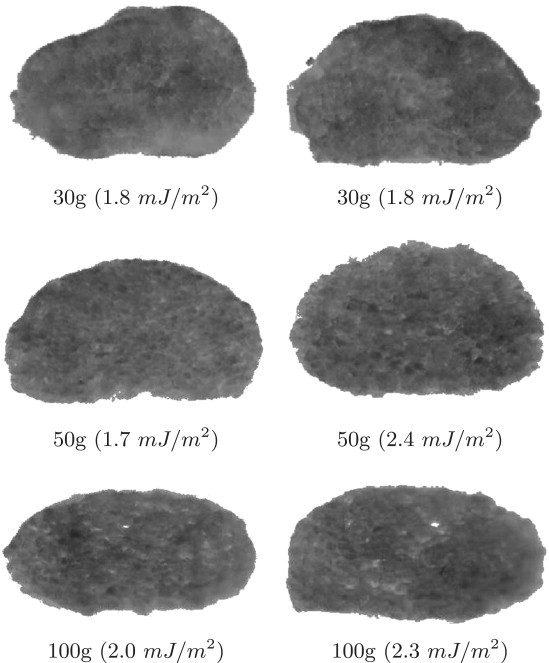
Chordamesoderm cell aggregates at three different centrifugation forces after 2 h.
Different sizes of ectodermal cell aggregates used to test ADSA-IP are shown in Fig. 7. Results from three batches centrifuged at 100 × g are shown in Table 1. (Detailed results for the small aggregates are given in Table 2 and will be discussed below.) It can be seen that for two batches (batches 2 and 3), the difference between the average surface tensions of small and large aggregates is minor, relative to the difference in their volumes. Batch 1 is an exception; however, for the large explants, tissue damage due to hypoxia cannot be excluded.
Figure 7.
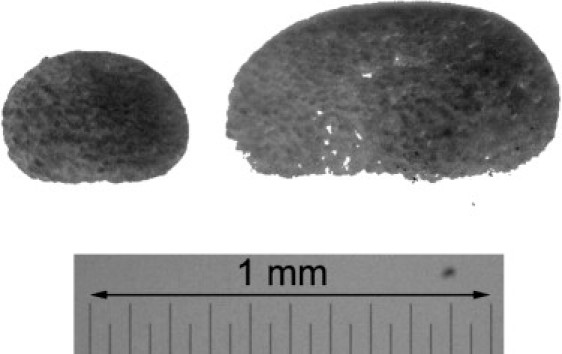
Ectodermal cell aggregates (batch 1, samples a) of two different sizes after 100 × g centrifugation.
Table 1.
Results of ADSA-IP for two different sizes of ectodermal cell aggregates at 100 × g centrifugation
| Batch No. | Aggregate size | Sample No. | Surface tension (mJ/m2) | Average (mJ/m2) | Standard error | p |
|---|---|---|---|---|---|---|
| 1 | Small | — | — | 1.9 | 0.2 | 0.9998 |
| Large | a | 3.6 | 3.8 | 0.3 | ||
| b | 3.4 | |||||
| c | 3.7 | |||||
| d | 4.6 | |||||
| 2 | Small | — | — | 3.1 | 0.6 | 0.67 |
| Large | a | 4.4 | 3.8 | 0.2 | ||
| b | 3.2 | |||||
| c | 3.8 | |||||
| d | 3.8 | |||||
| 3 | Small | — | — | 5.5 | 0.7 | 0.10 |
| Large | a | 5.3 | 5.6 | 0.4 | ||
| b | 6.0 |
The individual results for the small aggregates can be found in Table 2. The last column shows the probability that the true means of the small and large aggregate surface tensions are different, calculated from the Student's t-test.
Table 2.
Results of ADSA-IP for ectodermal cell aggregates centrifuged at 100 × g
| Batch No. | Sample No. | Surface tension (mJ/m2) | Average (mJ/m2) | Standard error |
|---|---|---|---|---|
| 1 | a | 2.0 | 1.9 | 0.2 |
| b | 1.9 | |||
| c | 2.0 | |||
| d | 2.4 | |||
| e | 1.8 | |||
| f | 1.1 | |||
| 2 | a | 4.4 | 3.1 | 0.6 |
| b | 3.9 | |||
| c | 2.3 | |||
| d | 1.7 | |||
| 3 | a | 7.6 | 5.5 | 0.7 |
| b | 7.7 | |||
| c | 3.7 | |||
| d | 4.4 | |||
| e | 5.4 | |||
| f | 4.0 | |||
| 4 | a | 1.9 | 2.7 | 0.7 |
| b | 1.3 | |||
| c | 3.3 | |||
| d | 4.5 |
Surface tension of X. laevis aggregates
Surface tensions determined by ADSA-IP for ectodermal cell aggregates from four different batches of embryos are shown in Table 2. Values were generally higher than those reported for ectodermal tissue from another frog (Rana pipiens) (13) and from zebrafish (20), indicating greater tissue cohesiveness in X. laevis at a similar stage of development.
As seen in Table 2, surface tension was highly variable within each batch. Comparing the average values of surface tension for different batches revealed that there was an additional batch-to-batch variability. According to an analysis of variances test, the probability that the observed differences in the average values of surface tension of different batches was due to chance alone was <0.001.
Mechanical parameters of embryonic tissues show a surprisingly large embryo-to-embryo variability. Although part of this variation may be due to experimental error, a careful analysis of tissue stiffness in sea urchin embryos indicated that there is also a high level of real biological variability in parameter magnitude (32). Such variability is also obvious from our numerical results with Xenopus embryonic tissue. A similar variation of surface tension was observed by others for embryonic tissue from both R. pipiens and zebrafish. Surface tension values for ectodermal tissue ranged from 0.25 to 1.59 mJ/m2 in a set of 11 embryos of R. pipiens (13), and for zebrafish, the surface tension of mesendodermal tissue ranged from 0.1 to 1.2 mJ/m2 in a set of 35 embryos (20).
In all cases, it is not clear what part of the variability is due to measurement errors. However, a striking variation in tissue cohesiveness is immediately experienced when cell aggregates are removed microsurgically from Xenopus embryos. The additional variability of surface tension measurements observed between different batches of embryos, i.e., between groups derived from different parents, suggests that a genetic or a maternal component is involved. However, other sources of variation may contribute, for example, a continuous developmental change of adhesiveness which was not controlled for in these experiments.
Tissue cohesion and convergent extension movement
The strong variation in surface tension values described above indicates a corresponding variability in tissue cohesion. To understand how cohesiveness may limit normal gastrulation movements, we experimentally manipulated cell adhesion by interfering with cadherin function. Diminishing cadherin expression and hence tissue cohesion by injection of antisense morpholino oligonucleotides has been shown to reduce surface tension in the zebrafish gastrula tissue (20). We used ADSA-IP to confirm that expression of cytoplasmically truncated cadherin can also lower cell adhesiveness, by interfering with the function of endogenous cadherin, and can be used to study the role of cohesiveness in convergent extension.
EP/C-cadherin (also C-cadherin, or EP-cadherin) is the main cadherin in the early Xenopus embryo (21–23). As a classic vertebrate cadherin, it possesses five extracellular domains that mediate homophilic adhesive interaction with other cadherins; as well, a transmembrane domain; and a conserved cytoplasmic tail that promotes an interaction with the actin cytoskeleton (33). In a not yet fully understood fashion, this cytoskeletal link is essential for strong cell adhesion. Cadherins whose cytoplasmic domain has been deleted mediate only weak cell binding to cadherin-coated surfaces in vitro (19). Moreover, when overexpressed, such truncated cadherins can interfere with the function of endogenous wild-type cadherin. For example, cytoplasmically truncated EP/C-cadherin leads to the loss of tissue cohesion and an inhibition of gastrulation movements when high doses of the respective mRNA are injected into the cells at early cleavage stages of the Xenopus embryo (17).
It is not clearly understood how cytoplasmically deleted cadherin can interfere with the function of endogenous cadherin to lower adhesiveness. We asked whether lower, nondissociating doses of cytoplasmically deleted EP/C-cadherin (EPΔC) have, in fact, a measurable effect on tissue cohesion. Consistent with published data concerning high doses of EPΔC mRNA (17), it was found that animal injection at the four-cell stage of 1 ng of EPΔC mRNA per blastomere led to mild tissue disintegration in some of the embryos. Moreover, explants of gastrula-stage ectodermal tissue did not round up, or at least not rapidly enough to be used in centrifugation experiments (not shown). At half this dose of mRNA, however, explants readily formed spherical aggregates, which were then used to determine the respective surface tensions (Table 3 and Fig. 8).
Table 3.
Results of ADSA-IP for ectodermal cell aggregates injected with β-gal (control) or EPΔC, and centrifuged at 100 × g for 1 h
| Batch No. | Aggregate type | Sample No. | Surface tension (mJ/m2) | Average (mJ/m2) | Standard error | p |
|---|---|---|---|---|---|---|
| 1 | β-gal | — | — | 1.9 | 0.2 | 0.01 |
| EPΔC | a | 1.7 | 1.2 | 0.1 | ||
| b | 1.4 | |||||
| c | 0.9 | |||||
| d | 0.9 | |||||
| e | 1.2 | |||||
| f | 1.0 | |||||
| 2 | β-gal | — | — | 3.1 | 0.6 | 0.02 |
| EPΔC | a | 1.9 | 1.3 | 0.2 | ||
| b | 1.4 | |||||
| c | 0.7 | |||||
| d | 0.7 | |||||
| e | 2.0 | |||||
| f | 1.2 | |||||
| 3 | β-gal | — | — | 5.5 | 0.7 | 0.04 |
| EPΔC | a | 1.9 | 3.1 | 0.6 | ||
| b | 2.0 | |||||
| c | 2.9 | |||||
| d | 3.9 | |||||
| e | 5.0 | |||||
| 4 | β-gal | — | — | 2.7 | 0.7 | 0.13 |
| EPΔC | a | 0.7 | 1.3 | 0.4 | ||
| b | 0.7 | |||||
| c | 1.5 | |||||
| d | 2.3 |
The individual results for the control aggregates can be found in Table 2. The last column shows the probability that the true means of the control and EPΔC surface tensions are equal, calculated from the Student's t-test.
Figure 8.
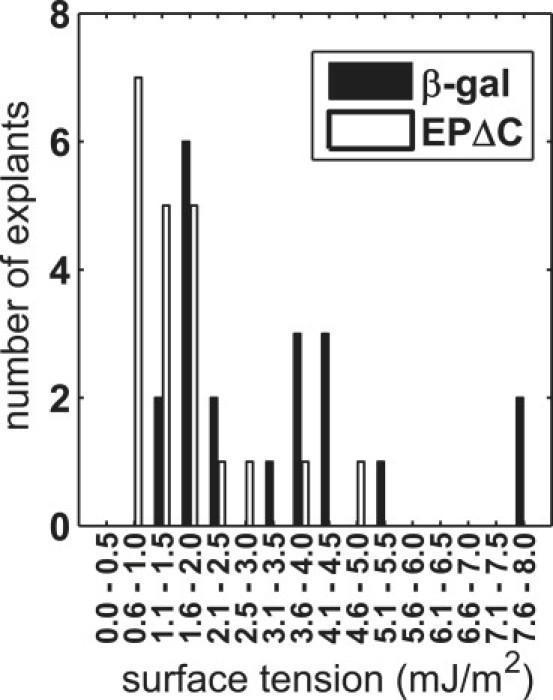
Distribution of surface tension in injected ectodermal explants.
In general, injection of EPΔC mRNA at 0.5 ng/blastomere reduced surface tension to approximately one-half the control value. Whereas control values range from 1.1 to 7.7 mJ/m2 (Table 2), they vary between 0.7 and 5.0 mJ/m2 in explants from EPΔC-injected embryos (Table 3). Thus, both the lowest and the highest surface tension values were similarly reduced by EPΔC expression. Moreover, batch 3 shows the highest surface tension values in controls, but also in the EPΔC-injected explants, arguing against the possibility that EPΔC expression reduces surface tension to a common basal level in all explants. Together with the strong variation of values in both control and EPΔC cell aggregates, this leads to a pronounced overlap between the two distributions (Fig. 8).
The fact that similar surface tension values are found in a large number of both the control and the adhesion-inhibited cell aggregates raises the question of how cohesiveness (as observably manifested by surface tension) could be related to explant performance during morphogenetic movements. These results confirm that high doses of cytoplasmically deleted EP/C-cadherin interfere with normal development. Thus, at the late neurula stage, fusion of the neural folds is visible as a dark, pigmented streak in controls (Fig. 9 A), but not in the embryos that had been injected with EPΔC mRNA (Fig. 9 B). Moreover, such high doses inhibit the elongation of ectodermal explants that had been induced to mesoderm by treatment with the growth factor activin (Fig. 9, C and D), as previously shown (17). This experimental system is a commonly used, well-studied model for the gastrulation process of convergent extension (34). Inhibition of elongation in such induced ectodermal explants indicates a requirement for cadherin-dependent cell-cell adhesion during convergent extension.
Figure 9.
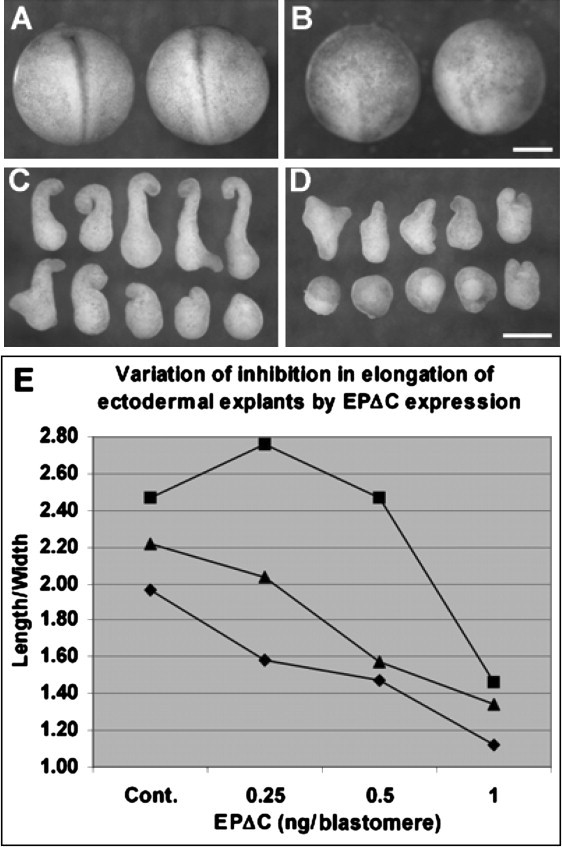
Biological effects of EPΔC expression in Xenopus. (A) Control β-gal mRNA injected neurulae embryos. (B) Disintegrated embryos after EPΔC mRNA injection. (C) Ectodermal explants from control embryos elongate extensively after activin treatment. (D) The elongation is compromised by EPΔC expression. (E) A diagram of the explant elongation shows that the repression profile of EPΔC varies between batches of embryos (diamond, 1; square, 2; triangle, 3). Bars, 500 μm.
Interestingly, although cadherin inhibition reduces explant lengthening in general, significant variability is seen in the degree of elongation of both controls and EPΔC expressing explants (Fig. 9, C and D). To quantitate elongation, we determined the length/width ratio of explants from three batches of embryos that had each been injected with different doses of EPΔC mRNA (Fig. 9 E). In two of these batches, elongation of control-injected explants was moderate, and increasing doses of EPΔC mRNA increasingly diminished explant lengthening—including the 0.5 ng/blastomere dose, at which we had measured a twofold reduction in surface tension (see the previous section). In the batch that showed strongest elongation in controls, only the highest dose inhibited elongation, and the 0.5 ng/blastomere dose had no effect.
Altogether, it appears that convergent extension varies similarly to tissue surface tension, and hence tissue cohesion. At a high dose of EPΔC mRNA (1 ng/blastomere), visible signs of tissue dissociation and lack of explant rounding suggest such a strong reduction of cell adhesion that inhibition of convergent extension is indeed not unexpected. However, when surface tension is reduced even to 0.7–1.0 mJ/m2 by injection of 0.5 ng of EPΔC mRNA per blastomere, explants still possess sufficient cohesiveness to become spherical, but 13 out of a total of 27 explants tested showed no signs of elongation upon activin induction. Since activin treatment does not reduce cohesiveness of the elongating chordamesodermal tissue, in contrast to more anterior mesoderm, as determined from surface tension measurement ((5), Fig. 6, and H. Ninomiya and A. Kalantarian, unpublished results), this suggests a nontrivial requirement for a minimum cohesiveness for the active cell intercalation movement that drives convergent extension. The data are furthermore consistent with the degree of elongation depending on the magnitude of cohesiveness as determined by surface tension.
The results suggest that natural variation in tissue cohesiveness could be a major factor contributing to variation in morphogenetic processes. However, it must be noted that several other sources may contribute to the variation in explant elongation in these experiments. For example, elongation should be sensitive to the amount of inductive signal received (29). In the embryo, convergent extension movement seems to be more robust than it is in activin-induced explants, which stresses this latter concern. However, variation of elongation is also observed in explants of the blastopore lip, where endogenous convergent extension is monitored. A likely interpretation of these observations could be that under artificial in vitro conditions, an intrinsic variation in elongation strength becomes more apparent.
Acknowledgments
The authors thank Regina J. Park for running many of the ADSA-IP analyses.
A.K., R.D., and A.W.N. acknowledge funding from the Natural Sciences and Engineering Research Council (NSERC) of Canada grant No. 8278, and an NSERC postdoctoral fellowship (R.D.). H.N. and R.W. acknowledge funding from the Canadian Institutes of Health Research grant No. MOP-53075.
References
- 1.Steinberg M.S. Differential adhesion in morphogenesis: a modern view. Curr. Opin. Genet. Dev. 2007;17:281–286. doi: 10.1016/j.gde.2007.05.002. [DOI] [PubMed] [Google Scholar]
- 2.Steinberg M.S., Poole T.J. Cellular adhesive differentials as determinants of morphogenetic movements and organ segregation. In: Subtelny S., editor. Developmental Order: Its Origin and Regulation. Alan R. Liss; New York: 1982. pp. 351–378. [Google Scholar]
- 3.Beysens D.A., Forgacs G., Glazier J.A. Cell sorting is analogous to phase ordering in fluids. Proc. Natl. Acad. Sci. USA. 2000;97:9467–9471. doi: 10.1073/pnas.97.17.9467. [DOI] [PMC free article] [PubMed] [Google Scholar]
- 4.Foty R.A., Steinberg M.S. Cadherin-mediated cell-cell adhesion and tissue segregation in relation to malignancy. Int. J. Dev. Biol. 2004;48:397–409. doi: 10.1387/ijdb.041810rf. [DOI] [PubMed] [Google Scholar]
- 5.Ninomiya H., Winklbauer R. Epithelial coating controls mesenchymal shape change through tissue-positioning effects and reduction of surface-minimizing tension. Nat. Cell Biol. 2008;10:61–69. doi: 10.1038/ncb1669. [DOI] [PubMed] [Google Scholar]
- 6.Winters B.S., Shepard S.R., Foty R.A. Biophysical measurement of brain tumor cohesion. Int. J. Cancer. 2005;114:371–379. doi: 10.1002/ijc.20722. [DOI] [PubMed] [Google Scholar]
- 7.Hegedus B., Marga F., Jakab K., Sharpe-Timms K.L., Forgacs G. The interplay of cell-cell and cell-matrix interactions in the invasive properties of brain tumors. Biophys. J. 2006;91:2708–2716. doi: 10.1529/biophysj.105.077834. [DOI] [PMC free article] [PubMed] [Google Scholar]
- 8.Jia D., Dajusta D., Foty R.A. Tissue surface tensions guide in vitro self-assembly of rodent pancreatic islet cells. Dev. Dyn. 2007;236:2039–2049. doi: 10.1002/dvdy.21207. [DOI] [PubMed] [Google Scholar]
- 9.Foty R.A., Forgacs G., Pfleger C.M., Steinberg M.S. Liquid properties of embryonic tissues: measurement of interfacial tensions. Phys. Rev. Lett. 1994;72:2298–2301. doi: 10.1103/PhysRevLett.72.2298. [DOI] [PubMed] [Google Scholar]
- 10.Foty R.A., Pfleger C.M., Forgacs G., Steinberg M.S. Surface tensions of embryonic tissues predict their mutual envelopment behavior. Development. 1996;122:1611–1620. doi: 10.1242/dev.122.5.1611. [DOI] [PubMed] [Google Scholar]
- 11.Foty R.A., Steinberg M.S. The differential adhesion hypothesis: a direct evaluation. Dev. Biol. 2005;278:255–263. doi: 10.1016/j.ydbio.2004.11.012. [DOI] [PubMed] [Google Scholar]
- 12.Hoorfar M., Neumann A.W. Recent progress in axisymmetric drop shape analysis (ADSA) Adv. Colloid Interface Sci. 2006;121:25–49. doi: 10.1016/j.cis.2006.06.001. [DOI] [PubMed] [Google Scholar]
- 13.Davis G.S., Phillips H.M., Steinberg M.S. Germ-layer surface tensions and “tissue affinities” in Rana pipiens gastrulae: quantitative measurements. Dev. Biol. 1997;192:630–644. doi: 10.1006/dbio.1997.8741. [DOI] [PubMed] [Google Scholar]
- 14.Tuft P.H. The uptake and distribution of water in the embryo of Xenopus laevis (Daudin) J. Exp. Biol. 1962;39:1–19. doi: 10.1242/jeb.39.1.1. [DOI] [PubMed] [Google Scholar]
- 15.Phillips H.M., Steinberg M.S. Equilibrium measurements of embryonic chick cell adhesiveness. I. Shape equilibrium in centrifugal fields. Proc. Natl. Acad. Sci. USA. 1969;64:121–127. doi: 10.1073/pnas.64.1.121. [DOI] [PMC free article] [PubMed] [Google Scholar]
- 16.Keller R., Shook D., Skoglund P. The forces that shape embryos: physical aspects of convergent extension by cell intercalation. Phys. Biol. 2008;5:015007. doi: 10.1088/1478-3975/5/1/015007. [DOI] [PubMed] [Google Scholar]
- 17.Lee C.H., Gumbiner B.M. Disruption of gastrulation movements in Xenopus by a dominant-negative mutant for C-cadherin. Dev. Biol. 1995;171:363–373. doi: 10.1006/dbio.1995.1288. [DOI] [PubMed] [Google Scholar]
- 18.Zhong Y., Brieher W.M., Gumbiner B.M. Analysis of C-cadherin regulation during tissue morphogenesis with an activating antibody. J. Cell Biol. 1999;144:351–359. doi: 10.1083/jcb.144.2.351. [DOI] [PMC free article] [PubMed] [Google Scholar]
- 19.Brieher W.M., Yap A., Gumbiner B.M. Lateral dimerization is required for the homophilic binding activity of C-cadherin. J. Cell Biol. 1996;135:487–496. doi: 10.1083/jcb.135.2.487. [DOI] [PMC free article] [PubMed] [Google Scholar]
- 20.Schötz E.M., Burdine R.D., Jülicher F., Steinberg M.S., Heisenberg C.P. Quantitative differences in tissue surface tension influence zebrafish germ layer positioning. HFSP J. 2008;2:42–56. doi: 10.2976/1.2834817. [DOI] [PMC free article] [PubMed] [Google Scholar]
- 21.Choi Y.S., Sehgal R., McCrea P., Gumbiner B. A cadherin-like protein in eggs and cleaving embryos of Xenopus laevis is expressed in oocytes in response to progesterone. J. Cell Biol. 1990;110:1575–1582. doi: 10.1083/jcb.110.5.1575. [DOI] [PMC free article] [PubMed] [Google Scholar]
- 22.Ginsberg D., DeSimone D., Geiger B. Expression of a novel cadherin (EP-cadherin) in unfertilized eggs and early Xenopus embryos. Development. 1991;111:315–325. doi: 10.1242/dev.111.2.315. [DOI] [PubMed] [Google Scholar]
- 23.Heasman J., Ginsberg D., Geiger B., Goldstone K., Pratt T. A functional test for maternally inherited cadherin in Xenopus shows its importance in cell adhesion at the blastula stage. Development. 1994;120:49–57. doi: 10.1242/dev.120.1.49. [DOI] [PubMed] [Google Scholar]
- 24.Canny J.F. Computational approach to edge detection. IEEE Trans. Pattern Anal. Mach. Intell. 1986;8:679–698. [PubMed] [Google Scholar]
- 25.del Rio O.I., Neumann A.W. Axisymmetric drop shape analysis: computational methods for the measurement of interfacial properties from the shape and dimensions of pendant and sessile drops. J. Colloid Interface Sci. 1997;196:136–147. doi: 10.1006/jcis.1997.5214. [DOI] [PubMed] [Google Scholar]
- 26.Nelder J., Mead R. A simplex method for function optimization. Comput. J. 1965;7:308–313. [Google Scholar]
- 27.Norotte C., Marga F., Neagu A., Kosztin I., Forgacs G. Experimental evaluation of apparent tissue surface tension based on the exact solution of the Laplace equation. Europhys. Lett. 2008;81:46003. [Google Scholar]
- 28.Wacker S., Grimm K., Joos T., Winklbauer R. Development and control of tissue separation at gastrulation in Xenopus. Dev. Biol. 2000;224:428–439. doi: 10.1006/dbio.2000.9794. [DOI] [PubMed] [Google Scholar]
- 29.Ninomiya H., Elinson R.P., Winklbauer R. Antero-posterior tissue polarity links mesoderm convergent extension to axial patterning. Nature. 2004;430:364–367. doi: 10.1038/nature02620. [DOI] [PubMed] [Google Scholar]
- 30.Zackson S.L., Steinberg M.S. Cranial neural crest cells exhibit directed migration on the pronephric duct pathway: further evidence for an in vivo adhesion gradient. Dev. Biol. 1986;117:342–353. doi: 10.1016/0012-1606(86)90304-0. [DOI] [PubMed] [Google Scholar]
- 31.Gordon R., Goel N.S., Steinberg M.S., Wiseman L.L. A rheological mechanism sufficient to explain the kinetics of cell sorting. J. Theor. Biol. 1972;37:43–73. doi: 10.1016/0022-5193(72)90114-2. [DOI] [PubMed] [Google Scholar]
- 32.von Dassow M., Davidson L.A. Variation and robustness of the mechanics of gastrulation: the role of tissue mechanical properties during morphogenesis. Birth Defects Res. C. Embryo Today: Rev. 2007;81:253–269. doi: 10.1002/bdrc.20108. [DOI] [PubMed] [Google Scholar]
- 33.Gumbiner B.M. Regulation of cadherin-mediated adhesion in morphogenesis. Nat. Rev. Mol. Cell Biol. 2005;6:622–634. doi: 10.1038/nrm1699. [DOI] [PubMed] [Google Scholar]
- 34.Symes K., Smith J.C. Gastrulation movements provide an early marker of mesoderm induction in Xenopus laevis. Development. 1987;101:339–349. [Google Scholar]