

Abstract
Using the peptide hormone glucagon and Aβ(1–40) as model systems, we have sought to elucidate the mechanisms by which fibrils grow and multiply. We here present real-time observations of growing fibrils at a single-fibril level. Growing from preformed seeds, glucagon fibrils were able to generate new fibril ends by continuously branching into new fibrils. To our knowledge, this is the first time amyloid fibril branching has been observed in real-time. Glucagon fibrils formed by branching always grew in the forward direction of the parent fibril with a preferred angle of 35–40°. Furthermore, branching never occurred at the tip of the parent fibril. In contrast, in a previous study by some of us, Aβ(1–40) fibrils grew exclusively by elongation of preformed seeds. Fibrillation kinetics in bulk solution were characterized by light scattering. A growth process with branching, or other processes that generate new ends from existing fibrils, should theoretically give rise to different fibrillation kinetics than growth without such a process. We show that the effect of adding seeds should be particularly different in the two cases. Our light-scattering data on glucagon and Aβ(1–40) confirm this theoretical prediction, demonstrating the central role of fibril-dependent nucleation in amyloid fibril growth
Abbreviations used: Aβ(1–40), amyloid β-peptide residue 1–40; TIRFM, total internal reflection fluorescence microscopy; SALS, small-angle light scattering; LALS, large-angle light scattering; AFM, atomic force microscopy; IAPP, islet amyloid polypeptide; TEM, transmission electron microscopy
Introduction
The formation of amyloid fibrils involves at least two steps: the formation of growth centers by primary nucleation, which is often a slow process, followed by elongation through addition of monomers. Model systems relying solely on primary nucleation, as exemplified by polyglutamine involved in Huntington's disease (1), could be the exception rather than the rule. Indeed, very often a third process, a so-called secondary nucleation mechanism, is inferred, in which new growth centers are formed from existing fibrils (2–6). The positive feedback from secondary nucleation theoretically gives rise to exponential growth kinetics, in agreement with the reaction profile observed for many proteins. Although several studies indicate the existence of secondary nucleation, and its existence has consequences for the competitive formation of different types of fibrils, the nature of the mechanisms involved remains unclear (4,6–12).
Fibrillation of the 29-residue peptide hormone glucagon and the 40-residue amyloid β-peptide, Aβ(1–40), has been comprehensively studied in our groups over the past years. Glucagon is a hormone involved in regulating blood sugar levels, and it is used as a drug to treat severe hypoglycemic incidents in diabetics (13). Glucagon fibrillation kinetics have the characteristics of an exponential reaction: a long lag phase followed by a sudden increase in fibril mass (14–17). The fibrillation kinetics of Aβ(1–40) have also been characterized extensively (18–25) because of interest in the correlation between amyloid plaque formation and Alzheimer's disease (26).
In this work, we have used TIRFM to image the growth of single glucagon fibrils in real time. Adding small amounts of preformed seeds effectively bypasses primary nucleation and allows us to focus on the way fibrils grow and multiply. By TIRFM, glucagon fibrils were observed to continuously form new fibrils from existing fibrils by branching, whereas previous work showed fibril growth of Aβ(1–40) to be strictly linear (18,21). Light-scattering experiments on seeded solutions of glucagon and Aβ(1–40) confirm that the fibrillation kinetics with and without secondary nucleation are fundamentally different, as predicted by theory.
Methods
Peptide and seed solutions
In all glucagon experiments, pharmaceutical grade glucagon (Novo Nordisk A/S, Bagsværd, Denmark) was dissolved to a final concentration of 0.25 mg/mL (72 μM) in 50mM glycine HCI buffer pH 2.5 sterile filtered through a 0.22 μm filter. In Aβ(1–40) experiments, TFA-salt Aβ(1–40) (Biopeptide Co., Inc., San Diego, CA) was treated as described in reference (27) to substitute TFA with NaOH and eliminate aggregates. First, the peptide was dissolved in 0.02 M NaOH until a pH of 11.0 was reached. The solution was sonicated for 1 min and then lyophilized. Immediately before use, the lyophilized powder was resuspended in 50 mM phosphate buffer, pH 7.5, and filtered through a 20-nm filter (Anotop 10, Whatman, Maidstone, UK). The final Aβ(1–40) concentration was 0.22 mg/mL (50 μM). For both glucagon and Aβ(1–40), dynamic light scattering confirmed that only minute amounts of aggregates were present in the final solution. Peptide concentrations were determined by absorbance measurements using molar extinction coefficients of = 8250 M−1cm−1 and = 1280 M−1cm−1. All glucagon experiments were done at 21°C, and all Aβ(1–40) experiments were done at 37°C. Seed stocks were prepared from already fibrillated samples prepared under identical conditions. Fibrils were disrupted into seeds by sonication of the fibril solution with 15 pulses from a tip sonicator, putting the sample on ice for 1 min to avoid melting of the fibrils, and then sonicating the sample once again. The seed stock was kept at 5°C and briefly vortex mixed before use. For each peptide, two seed concentrations separated by a factor of 10 were used, with one of the seed concentrations chosen to be identical to the seed concentration in the TIRFM experiments. We note that the actual concentration of seeds in a seed stock is a relative measure and that two separate seed stocks were used for the light-scattering and TIRFM experiments, respectively. The seed concentration is reported as the mass in micrograms of fibrillated peptide added to 1 mL freshly prepared peptide solution. The amount of unfibrillated peptide in the seed stock, measured in the supernatant after spinning a fibril solution for 15 min at 32,000 × g, amounted to <5% of the total peptide concentration, and hence the fibril kinetics essentially go to completion.
TIRFM
A detailed description of the TIRFM setup and quartz cleaning procedures are found in earlier work (28). In the case of glucagon, the freshly dissolved glucagon powder was centrifuged for 15 min at 32,000 × g to eliminate aggregates and undissolved powder. Glucagon seeds in a concentration of 0.1 μg/mL were added to the solution along with 10–30 μM thioflavin T (ThT). A drop of glucagon solution was placed between a quartz slide glass and a coverglass, which were then glued together to minimize evaporation. Within ∼1 h, a spot suitable for studying glucagon fibril growth in real time was selected, and the measurement started. Glucagon fibril growth was monitored for up to 19 h with a frame every 15–30 min and an accumulation time of 5–16 s. The frame rate and accumulation time were limited by the bleaching of ThT molecules. After a complete kinetics measurement, the appearance of the spherulites outside the laser illumination area was checked and found to be similar to the spherulites studied. Measurements were repeated several times on newly prepared samples. By visual inspection, the sample-to-sample kinetics was identical. Experimental details of the Aβ(1–40) experiments are found in reference (18).
Light scattering
Peptide solutions were filtered through a 20-nm filter (Anotop 10, Whatman) to eliminate dust and aggregates. Seeds were added immediately before starting the measurements. Glucagon was mixed with either 0.1 or 1 μg/mL seeds, and Aβ(1–40) was mixed with either 0.5 or 5 μg/mL seeds. In this way, the experimental conditions of the TIRFM experiments were reproduced while at the same time allowing for a study of how the kinetics responded to differences in the seed concentration. A single sample solution was prepared for both SALS and LALS experiments, and the experiments were started simultaneously by aliquots from the same sample preparation. Light-scattering experiments were performed on a LALS setup (BI-200SM, Brookhaven Instruments, Holtsville, NY) and on a SALS setup described previously (29,8). With the large-angle equipment, the dynamic and static light scattering was followed at scattering vector q = 23 μm−1 (90°) by continuously acquiring data for 5 min. The SALS setup measures the static signal at scattering vectors 0.02–2 μm−1 (0.1–11°) every 3–5 min. The scattering volumes for the SALS and LALS setup are 2·10−3 and 35 mm3, respectively, and both setups are temperature controlled.
TEM
Glucagon samples were analyzed by TEM as described previously (14).
Results
Fibrillation kinetics was studied by TIRFM and light scattering. TIRFM measures single-fibril growth in real time in a thin layer close to the surface, whereas light scattering measures fibril growth in bulk solution. In all experiments, fibrillation kinetics was initiated by adding small amounts of preformed seeds. In addition to the kinetics experiments, glucagon fibril structure was examined by TEM.
TIRFM
Glucagon fibril growth was monitored in real time for up to 19 h with measurements every 15–30 min. In the experiments, 0.25 mg/mL glucagon was seeded with 0.1 μg/mL preformed seeds. Fig. 1 shows three pictures from a typical TIRFM measurement captured 0, 5, and 17 h after the experiment was started. The entire measurement is posted online as Movie S1 in the Supporting Material. The first picture shows how fibril growth starts from a cluster of seeds and grows radially in all directions. After 5 h, fibrils have grown up to 25 μm in length, and spontaneous fibril branching is observed. At the end of the experiment, fibril growth has stopped, and a large structure with a diameter of 40–50 μm has formed. Multiple branching points on the same fibril as well as new branches on fibrils, themselves formed by branching, give rise to a relatively dense structure. Fig. 2 shows two other examples of branching events from separate experiments. In Fig. 2 a, two fibrils grow in opposite directions from a small cluster of seeds. Although this could be interpreted as bidirectional growth, it should be noted that the optical resolution does not allow for a distinction between single seeds and clusters of seeds. After 3.5 h, a new fibril is formed by branching, and this process repeats itself in the following 2 h, resulting in several new fibrils. In one case, a fibril grows along the parent fibril for a few micrometers before leaving at an angle. In Fig. 2 b, a fibril is observed to grow along the surface. At one point it forms a kink, and in the following observations, several new fibrils appear from the side of the fibril. In both panels of Fig. 2 bleaching of ThT is observed to some extent. The entire measurement in Fig. 2 b is posted online as Movie S2 in the Supporting Material.
Figure 1.
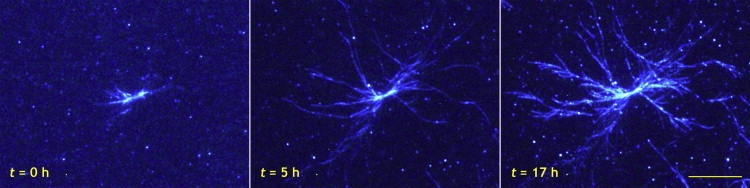
TIRFM pictures showing branched glucagon fibril growth at times specified on the figure. After 5 h, fibrils have grown up to 25 μm in length, and new fibrils have formed by branching. After 17 h, a relatively dense spherulitic structure has formed. The entire measurement is posted online as a movie (Movie S1). The bar represents 10 μm.
Figure 2.
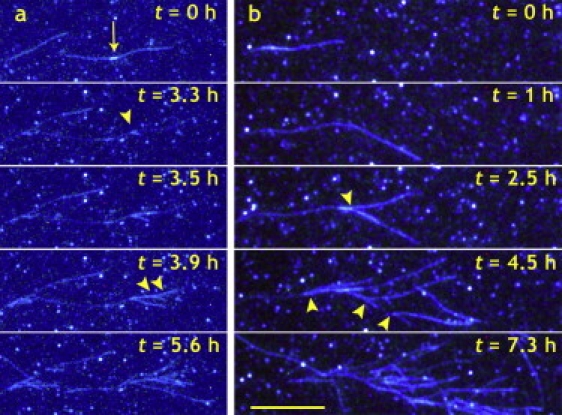
Branching detail from two separate TIRFM experiments. In panel a, two fibrils grow from a cluster of seeds (as indicated by arrow) in the center of the picture. After 3.3 h, a single branching event along the fibril is observed. In the following hours, several branches (some indicated by arrowheads) are observed. In panel b, a fibril grows from a seed in the left side of the picture. After 1 h, the fibril forms a kink, and in the following hours a new fibril protrudes close to the kink (arrowhead at t = 2.5 h). Finally, a cascade of new fibrils is formed (marked by arrowheads), and at t = 7.3 h, fibrils branching from fibrils formed by branching themselves are observed. The bar represents 10 μm. The entire measurement is posted online as a QuickTime movie (Movie S2).
An analysis of 65 branching angles measured with respect to the direction of growth from the entire surface in Fig. 1 was carried out. In Fig. 3 a, angles have been binned and plotted in a histogram. All branching angles were in the range from 15° to 65° relative to the direction of growth of the parent fibril with a maximum around 35–40°. However, in a number of cases, the newly formed fibrils grew in the forward direction along the parent fibril for several micrometers before protruding at an angle. These zero-angle events are not included in the histogram. Six individual fibrils, which all grew from the seeds added initially, were selected for analysis of growth rates (Fig. S1 in the Supporting Material). In Fig. 3 b, the length of each fibril is plotted as a function of time. The final fibril length ranged from 10 to 28 μm. Occasionally, fibrils exhibited stop-and-run behavior in which a fibril after a period of continuous growth temporarily stops growing and then resumes growth. Also, two of the six fibrils stopped growing after <4 h, although fibrils in their vicinity kept growing for several hours (fibrils 1 and 6). Growth rates were calculated for each of the six fibrils plotted in Fig. 3 b. Initially, growth rates ranged from 40 to 140 nm/min, but after a few hours of growth, the growth rates decreased to 20–40 nm/min.
Figure 3.
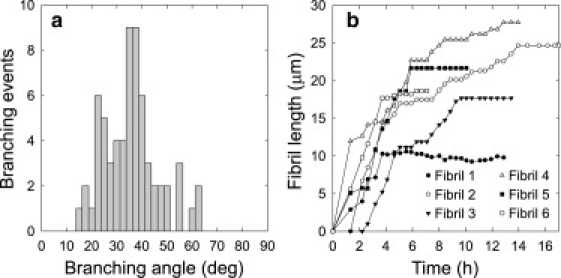
Distribution of branching angles and fibril length versus time of six individual fibrils from a single real-time experiment. (a) Sixty-five branching events were measured with respect to the direction of growth of the parent fibril. Branches most frequently form an angle of 35–40°, and branching opposite the direction of growth was never observed. (b) Length (μm) of six individual fibrils from a single real-time measurement. Fibrils exhibited stop-and-run behavior characterized by intervals where no growth occurs followed by continued growth. The six fibrils measured are shown in Fig. S1.
TEM
The molecular basis of branching glucagon fibrils was examined by TEM of samples formed under conditions identical to the TIRFM experiments. Because TEM sample preparation involves transfer to a carbon-coated grid and staining and drying of the sample, care should be taken when interpreting TEM pictures. For example, the large, branched structures observed by TIRFM are likely to be disrupted during TEM sample preparation. Also, because TIRFM observations show branching points to be micrometers apart, they are expected to be rare events in TEM pictures. The glucagon fibrils had a morphology dominated by two or several protofilaments twisting periodically around each other. Fig. 4 a shows a fibril splitting into four individual fibrils at a single branching point. Fig. 4, b and c, shows single fibrils splitting into two fibrils with an angle between the two, and Fig. 4 d shows an example of a fibril splitting into two individual fibrils, which remain close together after the branching point.
Figure 4.
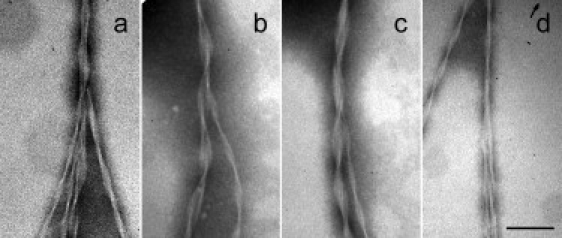
TEM pictures of branching fibrils. The fibrils do not merely twine or untwine because the total number of filaments that make up the fibrils seems to be larger after branching. (a) In some cases, a single fibril was observed to split into several fibrils at a branching point, but most often, the fibrils were observed to split into two fibrils (b–d). In d, the branching angle is close to 0° as also observed occasionally by TIRFM. Scale bar represents 100 nm.
SALS and LALS
The SALS setup is designed specifically for studying the growth of large micrometer structures, in this case fibrils, whereas the LALS setup is more sensitive to the growth of smaller species. We performed SALS and LALS experiments simultaneously with aliquots from the same sample preparation. The SALS setup has a scattering volume of 35 mm3 compared to the scattering volume of the LALS setup of 2·10−3 mm3. Because of the smaller scattering volume of the LALS setup, large single particles diffusing through the scattering volume will completely dominate the total scattered signal and give rise to sharp spikes in the signal.
Fig. 5 a shows the fibrillation kinetics of Aβ(1–40) seeded with 0.5 and 5 μg/mL seeds monitored by SALS. At a seed concentration of 0.5 μg/mL, a linear increase in intensity is observed for 12 h. With 5 μg/mL of seeds, a 1-h linear increase in intensity is followed by a plateau as fibrillation kinetics stop. After 7 h, aggregates start to precipitate, and as a result, the SALS signal decreases abruptly. The LALS signal is plotted in Fig. 5 b. In agreement with the small-angle scattering, a steady linear increase is observed for more than 12 h at low seed concentration. At high seed concentration, a linear phase is observed for 90 min followed by a plateau. By visual inspection, the fibrillated Aβ(1–40) sample at 0.5 μg/mL seed concentration was noticeably more homogeneous than the sample at 5 μg/mL seed concentration. For both samples, precipitation of fibril aggregates was visible after the experiment.
Figure 5.
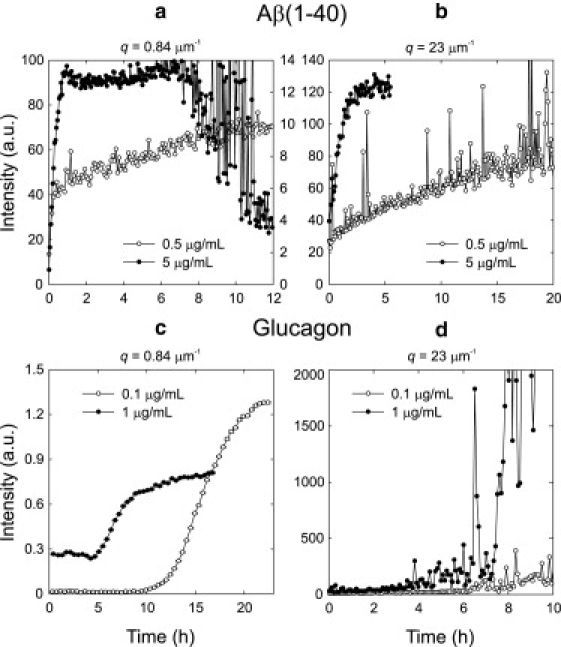
Aβ(1–40) and glucagon kinetics seeded with two different seed concentrations and monitored by SALS at scattering angle q = 0.84 μm−1 and by LALS at q = 23 μm−1. (a) SALS measurements on Aβ(1–40). The scattered intensity is plotted on separate axes with the 0.5 μg/mL data being plotted on the right-hand axis. The peptide solution seeded with 0.5 μg/mL seeds has a linear increase in scattered intensity for 12 h. At a seed concentration of 5 μg/mL, the linear phase lasts for 90 min, and after 8 h precipitation is observed. (b) LALS measurements on Aβ(1–40). The scattered intensity increases linearly, and an increase in seed concentration increases the slope. The 5 μg/mL experiment was stopped shortly after the kinetics had reached a plateau. (c) SALS measurements on glucagon. The two reaction profiles are characterized by a long lag phase: increasing the seed concentration 10-fold decreases the lag time from ∼10 h to 5 h. (d) LALS measurements on glucagon. After a long lag phase, the intensity increases irregularly as large particles diffuse through the scattering volume.
Fig. 5 c shows the SALS intensity from 0.25 mg/mL glucagon solutions seeded with 0.1 and 1 μg/mL seeds as a function of time. At a seed concentration of 0.1 μg/mL, the beginning of the reaction profile is dominated by a long lag phase. After ∼10 h, the scattered intensity increases abruptly and reaches a plateau at the end of the experiment. Increasing the seed concentration to 1 μg/mL conserves the general sigmoid reaction profile but increases the initial scattered intensity, suggesting that the signal at early times is mainly from the seeds. The lag phase is reduced to ∼5 h. The LALS intensity from seeded solutions of glucagon is plotted in Fig. 5 d. After some hours with a relatively moderate increase in scattered intensity, the scattered intensity increases abruptly and fluctuates as large particles diffuse through the scattering volume. This occurs after ∼9 and 5 h for seed concentrations of 0.1 and 1 μg/mL, respectively. By visual inspection at the end of the experiment, the glucagon samples formed transparent gels with a few large millimeter-size white floccules embedded in the gel. At the high seed concentration, more and smaller floccules were seen. Even after several days, no precipitation was visible in either cuvette.
Discussion
Branching of glucagon fibrils
Secondary nucleation designates any mechanism, in which the instantaneous formation of new growth centers depend on the fibril mass already formed. This can happen in several ways, as described by previous authors (2,6,11,30–33). For the purpose of this discussion, we classify secondary nucleation into five different mechanisms according to the scheme of Fig. 6 based on observations from the literature. First we divide schemes into breaking and nonbreaking (Fig. 6). With breaking, two new fibril ends are introduced. Smith et al. (30) characterized the nanoscale properties of insulin fibrils and found that a fibril 10 μm in length spontaneously breaks on average every 47 min as a result of thermal fluctuations. The nonbreaking mechanisms are further divided into two classes: forking at the tip of the growing fibril and nucleus formation on the fibril sides (lateral nucleation). Ruschak and Miranker (11) concluded that the secondary process involved in IAPP fibrillation could be surface-dependent lateral nucleation. We divide lateral nucleation into cases where the nucleus remains permanently attached to the surface and cases where it can detach and diffuse into solution. Diffusible lateral nucleation has been observed in sickle hemoglobin polymerization by Ferrone et al. (34). If the nucleus instead remains attached to the surface, it either forms a branch or continues to grow along the parent fibril, which consequently thickens. Rogers et al. (31) propose branching to be a mechanism involved in the formation of insulin spherulites based on the constant density as function of radius. Fibril thickening has been observed experimentally (32,33). For example, in a time-lapse AFM study by Jansen et al. (32), it was observed that the sides of early insulin fibrils recruited oligomers through lateral interactions, which led to thickening of the fibrils.
Figure 6.
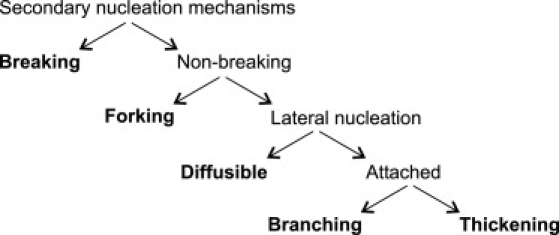
Classification of five secondary nucleation mechanisms.
The most notable observation in the TIRFM study of seeded solutions of glucagon is the fact that the fibrils not only grow by linear elongation but also continuously create new fibrils from the sides of existing fibrils. The newly formed fibrils themselves can also form new fibrils by branching, so we can classify the branching as isotomous, meaning that all branches have equivalent properties. In our opinion, the secondary nucleation mechanism most consistent with the TIRFM observations is branching. Of the mechanisms in Fig. 6, we readily exclude thickening and forking. It is in principle possible that both breaking and diffusible lateral nucleation could give rise to the observed behavior, since the optical resolution of TIRFM does not permit a detailed picture of a branch point. However, the angular distribution (Fig. 3) shows that new fibrils exclusively grow in the forward direction with a preferred angle of 35–40°. In the case of breaking, we would expect the preferred angle to be centered around 0°, whereas the distribution would be isotropic if the nuclei diffused away from the parent fibril before sticking to the quartz again. We therefore classify the secondary nucleation mechanism as branching. It is, in principle, possible to distinguish some of the secondary processes from each other by a rigorous analysis of the kinetics' dependence on monomer concentration (2). However, glucagon fibrillation kinetics is strongly affected by a concentration-dependent change in fibril morphology, which makes such a kinetics analysis impossible (14).
Using TEM, we were able to identify a number of cases where a single fibril branched isotomously into two or several fibrils (Fig. 4). Judging from the pictures, the fibrils do not merely twine or untwine because the total number of filaments that make up the fibrils appears larger after branching. The fact that a single fibril was observed to branch into several fibrils at a specific point makes it unlikely to be an artifact from sample preparation (Fig. 4 a). In some cases, the fibril split into two separate fibrils, which continued side by side (Fig. 4 d). This could be an example of the events observed occasionally by TIRFM, where newly formed fibrils grow along the parent fibril for up to several micrometers.
We speculate that branches grow from defects created during the growth process and therefore have a preferential angle relative to the direction of growth. Defects might form during growth by untwining of single protofilaments from the main bundle, which then continues to grow. Later, the dangling protofilament matures to a growing fibril. A number of groups have reported fibrils splitting into protofilaments during growth without increasing the net number of protofilaments (33,35–38). Most studies are static measurements on fibrillated samples, but Goldsbury et al. (37) described the same phenomenon using time-lapse AFM. Their data show an example of a protofilament growing out of a thicker fibril, which then continues growth in a different direction (Fig. 3 b of Goldsbury et al. (37)). For an untwining mechanism to support continuous branching as shown in Fig. 2 b, the untwined protofilament must be replaced in the growing bundle, or the fibril would run out of protofilaments to untwine. A similar mechanism should exist to augment the dangling protofilament to a full-size fibril capable of forming new branches itself.
Growth rates
Fibril lengths versus time were plotted in Fig. 3 b. Occasionally fibrils temporarily stop growing. For example, after 5 h, fibril 3 twice stops growing for ∼50 min before resuming growth. Although this could be caused by a local depletion of monomers, the stop-and-run behavior could also result from monomers being misaligned at the fibril end. If this is the case, fibril growth would resume after the monomer had either aligned properly to the fibril backbone or dissociated from the fibril end. We also note that of the six fibrils, only two continue growth throughout the experiment (fibrils 2 and 4). The others stop growing after 3.7–9.7 h, although fibrils in their vicinity keep growing. This could indicate that the fibril ends of these fibrils have been permanently terminated as a result of a misaligned monomer or perhaps a morphology-dependent inhibition by a reversible glucagon trimer as proposed in a previous study (14). The initial growth rates were 40–140 nm/min, and after ∼6 h, the growth rates decreased to 20–40 nm/min. The decrease in growth rates could indicate that fibril growth depletes monomers locally, i.e., fibril growth is diffusion limited.
Aβ(1–40) fibril growth
Aβ(1–40) fibril formation at physiological pH has been the subject of many kinetic studies, but in terms of the lag phase often with different conclusions. Some studies report a pronounced lag phase of up to several days (18,22,39), whereas others report no—or a very short—lag phase (19,23–25). We note that lag phases are a rough measure of the kinetics in spontaneous fibril growth and indicate the time frame where only small amounts of fibrils and prefibrillar aggregates are formed. Even small differences in handling and solvent conditions can lead to very different kinetics, and this may help explain the inconsistencies in the lag times reported for Aβ (40–42). The seeded reactions used in this study circumvent these problems by bypassing the primary formation of nuclei from monomers, which can sometimes be difficult to reproduce in different experimental settings, and focusing on the fastest part of the kinetics: the fibril elongation. We note, however, that although seeded reactions ensure lag phase reproducibility, the elongation kinetics depends on the seed preparation and is hence likely to vary from lab to lab.
Some of us previously performed real-time TIRFM experiments on Aβ(1–40) (18,21). The Aβ(1–40) fibrils formed radial star structures from clusters of seeds, but in contrast to glucagon fibril growth, branching was never observed. It has since been shown in a similar work by some of us that the fibril assemblies are very sensitive to solvent conditions, and we cannot rule out that under other conditions, Aβ(1–40) generates fibrils by a secondary nucleation mechanism (43). The Aβ(1–40) fibrils grew unidirectionally to a maximum length of 15 μm, and after ∼80 min monomers were depleted, and fibril growth stopped. The fibril growth rate remained constant at 300 nm/min. This fibril growth rate is significantly higher compared to glucagon despite a lower molar peptide concentration (50 μM and 72 μM, respectively). Aβ(1–40) fibril growth also exhibited stop-and-run behavior, but the growth rates remained constant until monomers were depleted. In the time-lapse AFM study by Goldsbury et al. mentioned above (37), the growth rate of IAPP protofilaments on a mica surface was only ∼1 nm/min, an effect that may be caused by differences in the surface properties of mica and quartz.
Theory of seeded fibril growth
The observation in seeded TIRFM experiments that glucagon fibrils support secondary nucleation, whereas Aβ(1–40) fibrils apparently do not, should result in fundamentally different fibril mass growth for the two peptides. In the Supporting Material, we derive the effect of changing seed concentration on the initial part of the growth kinetics in a very simple model of fibril growth with or without secondary nucleation. We find that in the absence of secondary nucleation, the increase in fibril mass will be linear in time, with a slope proportional to the number of seed ends. In the presence of secondary nucleation, the fibril mass growth is exponential, and an increase in the seed concentration will give a shift on the time axis. These scenarios are sketched in Fig. 7. It is seen that both the form of the seeded fibrillation kinetics and the response to a change in seed concentration are changed dramatically by the presence of a secondary nucleation mechanism. We stress that the lag phase in itself does not imply a secondary nucleation mechanism as demonstrated by the work on microtubule polymerization by Flyvbjerg et al. (44). Only in the case of seeded kinetics does the lag phase imply a secondary nucleation mechanism. In all cases, the total fibril mass must at some point converge toward a constant number, although this is not taken into account in our simple model. At very high seed concentrations, the lag phase will be bypassed altogether even in presence of secondary nucleation (14).
Figure 7.
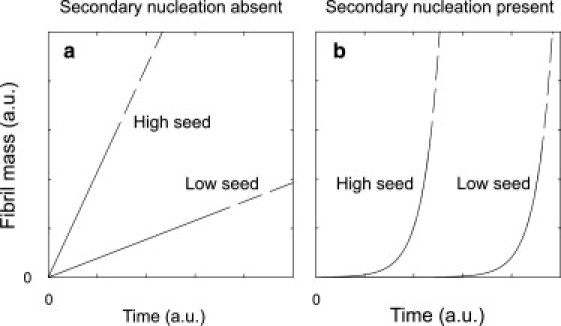
Effect of changing the seed concentration on the initial part of the fibrillation curve. (a) Seeding a kinetic process, in which secondary nucleation is absent, affects the growth rate. Increasing the seed concentration increases the growth rate. (b) Seeding a kinetic process in which secondary nucleation is present shortens the lag phase but does not affect the growth rate.
Light-scattering data
We explored seeded fibrillation of Aβ(1–40) and glucagon by light scattering. Generally, the light-scattering signal from a solution increases when the components aggregate to form larger structures such as fibrils. The light scattered at small angles from a solution containing various fibrillar species mainly comes from large structures, whereas smaller species contribute relatively more at large angles. We use the scattered intensity as a qualitative measure for the growth in fibril mass, although it should be noted that the two are not directly proportional. For example, fibrils bundling together forming large structures can give rise to an increase in the scattered intensity, in particular at small angles, without an increase in fibril mass.
The light-scattering data in Fig. 5 show good agreement with the simple theory. The fibrillation of Aβ(1–40) starts immediately at the beginning of the experiment and proceeds approximately linearly (Fig. 5, a and b). As expected from the model without secondary nucleation, the slope is higher at 5 μg/mL seed concentration than at 0.5 μg/mL seed concentration. At 5 μg/mL seed concentration, the fibrillation process stops after ∼1 h, in good agreement with the ∼80 min of growth observed by TIRFM (18). For glucagon, the picture is quite different (Fig. 5, c and d): at both seed concentrations, several hours of lag phase without detectable growth of fibrils or prefibrillar species is followed by an abrupt increase in fibril mass. The lag time is shorter in the experiment with 1 μg/mL than with 0.1 μg/mL seeds in agreement with the predictions of the model, which includes secondary nucleation.
The simple model predicts that in the absence of a secondary nucleation mechanism, the slope of the mass growth curve should increase 10-fold when 10 times more seeds are added. We do not obtain quantitative agreement between the growth rates of the scattered intensity and this prediction. This could be because the light-scattering signal is not strictly proportional to the total mass as well as because of inaccuracies in the model's simplified picture of fibrillation. However, we find it significant that the predicted difference in seeded fibril growth with and without secondary nucleation clearly stands out in our data and agrees with the observations from TIRFM.
The SALS signal in the glucagon experiment with 1 μg/mL seed is already quite large at t = 0. The initial SALS signal in the experiment with 0.1 μg/mL seeds is one order of magnitude lower, indicating that the signal at t = 0 is caused by scattering from the seeds. The LALS signal from the glucagon samples show large fluctuations at both seed concentrations. This shows that the number of scatterers in the 2·10−3 mm3 detection volume fluctuates strongly because of the low total number density. The signals from the Aβ(1–40) samples fluctuate significantly less, which shows a higher number density of scatterers. We conclude that our procedure for making fibril seeds generates fewer and larger seeds for glucagon than for Aβ(1–40).
Conclusion
Our TIRFM movies of seeded glucagon fibril formation very clearly show repeated branching. The presence and importance of branching in bulk volume are supported by light-scattering experiments in which we observe the signature expected from a simple theory of fibril growth with branching: a sigmoid growth curve, with the lag phase decreased by increase of seed concentration. For Aβ(1–40), for which no branching was observed by TIRFM, a quite different signature is observed in the light scattering experiments.
Acknowledgments
C.B.A. benefits from an Industrial PhD scholarship cofinanced by Novo Nordisk and the Danish Ministry of Science, Technology, and Innovation. D.E.O. is funded by the Villum Kann Rasmussen Foundation (BioNET) and the Danish Research Foundation (inSPIN).
C.B.A. performed research, analyzed data, and wrote the article; H.Y., T.B., and G.C. performed research; M.M. and V.M. performed research and analyzed data; D.E.O. and Y.G. designed research; and C.R. supervised research, analyzed data, and wrote the article.
Supporting Material
References
- 1.Chen S., Ferrone F.A., Wetzel R. Huntington's disease age-of-onset linked to polyglutamine aggregation nucleation. Proc. Natl. Acad. Sci. USA. 2002;99:11884–11889. doi: 10.1073/pnas.182276099. [DOI] [PMC free article] [PubMed] [Google Scholar]
- 2.Ferrone F. Analysis of protein aggregation kinetics. In: Wetzel R., editor. Methods in Enzymology. Elsevier Academic Press; San Diego: 1999. pp. 256–274. [DOI] [PubMed] [Google Scholar]
- 3.Librizzi F., Rischel C. The kinetic behavior of insulin fibrillation is determined by heterogeneous nucleation pathways. Protein Sci. 2005;14:3129–3134. doi: 10.1110/ps.051692305. [DOI] [PMC free article] [PubMed] [Google Scholar]
- 4.Padrick S.B., Miranker A.D. Islet amyloid: phase partitioning and secondary nucleation are central to the mechanism of fibrillogenesis. Biochemistry. 2002;41:4694–4703. doi: 10.1021/bi0160462. [DOI] [PubMed] [Google Scholar]
- 5.Manno M., Craparo E.F., Podesta A., Bulone D., Carrotta R. Kinetics of different processes in human insulin amyloid formation. J. Mol. Biol. 2007;366:258–274. doi: 10.1016/j.jmb.2006.11.008. [DOI] [PubMed] [Google Scholar]
- 6.Collins S.R., Douglass A., Vale R.D., Weissman J.S. Mechanism of prion propagation: Amyloid growth occurs by monomer addition. PLoS Biol. 2004;2:1582–1590. doi: 10.1371/journal.pbio.0020321. [DOI] [PMC free article] [PubMed] [Google Scholar]
- 7.Pedersen J.S., Flink J.M., Dikov D., Otzen D.E. Sulfates dramatically stabilize a salt-dependent type of glucagon fibrils. Biophys. J. 2006;90:4181–4194. doi: 10.1529/biophysj.105.070912. [DOI] [PMC free article] [PubMed] [Google Scholar]
- 8.Manno M., Craparo E.F., Martorana V., Bulone D., San Biagio P.L. Kinetics of insulin aggregation: disentanglement of amyloid fibrillation from large-size cluster formation. Biophys. J. 2006;90:4585–4591. doi: 10.1529/biophysj.105.077636. [DOI] [PMC free article] [PubMed] [Google Scholar]
- 9.Sluzky V., Tamada J.A., Klibanov A.M., Langer R. Kinetics of insulin aggregation in aqueous solutions upon agitation in the presence of hydrophobic surfaces. Proc. Natl. Acad. Sci. USA. 1991;88:9377–9381. doi: 10.1073/pnas.88.21.9377. [DOI] [PMC free article] [PubMed] [Google Scholar]
- 10.Linse S., Cabaleiro-Lago C., Xue W.F., Lynch I., Lindman S. Nucleation of protein fibrillation by nanoparticles. Proc. Natl. Acad. Sci. USA. 2007;104:8691–8696. doi: 10.1073/pnas.0701250104. [DOI] [PMC free article] [PubMed] [Google Scholar]
- 11.Ruschak A.M., Miranker A.D. Fiber-dependent amyloid formation as catalysis of an existing reaction pathway. Proc. Natl. Acad. Sci. USA. 2007;104:12341–12346. doi: 10.1073/pnas.0703306104. [DOI] [PMC free article] [PubMed] [Google Scholar]
- 12.Pedersen J.S., Otzen D.E. Amyloid a state in many guises: survival of the fittest fibril fold. Protein Sci. 2007;17:1–9. doi: 10.1110/ps.073127808. [DOI] [PMC free article] [PubMed] [Google Scholar]
- 13.Drucker D.J. Biologic actions and therapeutic potential of the proglucagon-derived peptides. Nat. Clin. Pract. Endocrinol. Metab. 2005;1:22–31. doi: 10.1038/ncpendmet0017. [DOI] [PubMed] [Google Scholar]
- 14.Andersen C.B., Otzen D., Christiansen G., Rischel C. Glucagon amyloid-like fibril morphology is selected via morphology-dependent growth inhibition. Biochemistry. 2007;46:7314–7324. doi: 10.1021/bi6025374. [DOI] [PubMed] [Google Scholar]
- 15.Pedersen J.S., Dikov D., Flink J.L., Hjuler H.A., Christiansen G. The changing face of glucagon fibrillation: structural polymorphism and conformational imprinting. J. Mol. Biol. 2006;355:501–523. doi: 10.1016/j.jmb.2005.09.100. [DOI] [PubMed] [Google Scholar]
- 16.Beaven G.H., Gratzer W.B., Davies H.G. Formation and structure of gels and fibrils from glucagon. Eur. J. Biochem. 1969;11:37–42. doi: 10.1111/j.1432-1033.1969.tb00735.x. [DOI] [PubMed] [Google Scholar]
- 17.Glenner G.G., Eanes E.D., Bladen H.A., Linke R.P., Termine J.D. β-pleated sheet fibrils—comparison of native amyloid with synthetic protein fibrils. J. Histochem. Cytochem. 1974;22:1141–1158. doi: 10.1177/22.12.1141. [DOI] [PubMed] [Google Scholar]
- 18.Ban T., Hoshino M., Takahashi S., Hamada D., Hasegawa K. Direct observation of Aβ amyloid fibril growth and inhibition. J. Mol. Biol. 2004;344:757–767. doi: 10.1016/j.jmb.2004.09.078. [DOI] [PubMed] [Google Scholar]
- 19.Carrotta R., Manno M., Bulone D., Martorana V., San Biagio P.L. Protofibril formation of amyloid beta-protein at low pH via a non-cooperative elongation mechanism. J. Biol. Chem. 2005;280:30001–30008. doi: 10.1074/jbc.M500052200. [DOI] [PubMed] [Google Scholar]
- 20.Carrotta R., Barthes J., Longo A., Martorana V., Manno M. Large size fibrillar bundles of the Alzheimer amyloid beta-protein. Eur. Biophys. J. 2007;36:701–709. doi: 10.1007/s00249-007-0164-0. [DOI] [PubMed] [Google Scholar]
- 21.Ban T., Morigaki K., Yagi H., Kawasaki T., Kobayashi A. Real-time and single fibril observation of the formation of amyloid beta spherulitic structures. J. Biol. Chem. 2006;281:33677–33683. doi: 10.1074/jbc.M606072200. [DOI] [PubMed] [Google Scholar]
- 22.Jarrett J.T., Berger E.P., Lansbury P.T. The carboxy terminus of the beta-amyloid protein is critical for the seeding of amyloid formation—implications for the pathogenesis of Alzheimers disease. Biochemistry. 1993;32:4693–4697. doi: 10.1021/bi00069a001. [DOI] [PubMed] [Google Scholar]
- 23.Naiki H., Hasegawa K., Yamaguchi I., Nakamura H., Gejyo F. Apolipoprotein E and antioxidants have different mechanisms of inhibiting Alzheimer's beta-amyloid fibril formation in vitro. Biochemistry. 1998;37:17882–17889. doi: 10.1021/bi980550y. [DOI] [PubMed] [Google Scholar]
- 24.Hasegawa K., Yamaguchi I., Omata S., Gejyo F., Naiki H. Interaction between Aβ(1–42) and Aβ (1–40) in Alzheimer's beta-amyloid fibril formation in vitro. Biochemistry. 1999;38:15514–15521. doi: 10.1021/bi991161m. [DOI] [PubMed] [Google Scholar]
- 25.Lomakin A., Chung D.S., Benedek G.B., Kirschner D.A., Teplow D.B. On the nucleation and growth of amyloid beta-protein fibrils: detection of nuclei and quantitation of rate constants. Proc. Natl. Acad. Sci. USA. 1996;93:1125–1129. doi: 10.1073/pnas.93.3.1125. [DOI] [PMC free article] [PubMed] [Google Scholar]
- 26.Caughey B., Lansbury P.T. Protofibrils, pores, fibrils, and neurodegeneration: separating the responsible protein aggregates from the innocent bystanders. Annu. Rev. Neurosci. 2003;26:267–298. doi: 10.1146/annurev.neuro.26.010302.081142. [DOI] [PubMed] [Google Scholar]
- 27.Teplow D.B. Preparation of amyloid beta-protein for structural and functional studies. In: Kheterpal I., Wetzel R., editors. Methods in Enzymology. Elsevier Academic Press; San Diego: 2006. pp. 20–33. [DOI] [PubMed] [Google Scholar]
- 28.Ban T., Goto Y. Direct observation of amyloid growth monitored by total internal reflection fluorescence microscopy. In: Kheterpal I., Wetzel R., editors. Methods in Enzymology. Elsevier Academic Press; San Diego: 2006. pp. 91–102. [DOI] [PubMed] [Google Scholar]
- 29.Bulone D., Giacomazza D., Martorana V., Newman J., San Biagio P.L. Ordering of agarose near the macroscopic gelation point. Phys. Rev. E. 2004;69:041401. doi: 10.1103/PhysRevE.69.041401. [DOI] [PubMed] [Google Scholar]
- 30.Smith J.F., Knowles T.P.J., Dobson C.M., MacPhee C.E., Welland M.E. Characterization of the nanoscale properties of individual amyloid fibrils. Proc. Natl. Acad. Sci. USA. 2006;103:15806–15811. doi: 10.1073/pnas.0604035103. [DOI] [PMC free article] [PubMed] [Google Scholar]
- 31.Rogers S.S., Krebs M.R.H., Bromley E.H.C., van der Linden E., Donald A.M. Optical microscopy of growing insulin amyloid spherulites on surfaces in vitro. Biophys. J. 2006;90:1043–1054. doi: 10.1529/biophysj.105.072660. [DOI] [PMC free article] [PubMed] [Google Scholar]
- 32.Jansen R., Dzwolak W., Winter R. Amyloidogenic self-assembly of insulin aggregates probed by high resolution atomic force microscopy. Biophys. J. 2005;88:1344–1353. doi: 10.1529/biophysj.104.048843. [DOI] [PMC free article] [PubMed] [Google Scholar]
- 33.Anderson M., Bocharova O.V., Makarava N., Breydo L., Salnikov V.V. Polymorphism and ultrastructural organization of prion protein amyloid fibrils: an insight from high resolution atomic force microscopy. J. Mol. Biol. 2006;358:580–596. doi: 10.1016/j.jmb.2006.02.007. [DOI] [PubMed] [Google Scholar]
- 34.Ferrone F.A., Hofrichter J., Eaton W.A. Kinetics of sickle hemoglobin polymerization: II. A double nucleation mechanism. J. Mol. Biol. 1985;183:611–631. doi: 10.1016/0022-2836(85)90175-5. [DOI] [PubMed] [Google Scholar]
- 35.Kad N.M., Myers S.L., Smith D.P., Smith D.A., Radford S.E. Hierarchical assembly of beta(2)-microglobulin amyloid in vitro revealed by atomic force microscopy. J. Mol. Biol. 2003;330:785–797. doi: 10.1016/s0022-2836(03)00583-7. [DOI] [PubMed] [Google Scholar]
- 36.Dong M., Hovgaard M.B., Xu S., Otzen D., Besenbacher F. AFM study of glucagon fibrillation via oligomeric structures resulting in interwoven fibrils. Nanotechnology. 2006;17:4003–4009. doi: 10.1088/0957-4484/17/16/001. [DOI] [PubMed] [Google Scholar]
- 37.Goldsbury C., Kistler J., Aebi U., Arvinte T., Cooper G.J.S. Watching amyloid fibrils grow by time-lapse atomic force microscopy. J. Mol. Biol. 1999;285:33–39. doi: 10.1006/jmbi.1998.2299. [DOI] [PubMed] [Google Scholar]
- 38.De Jong K.L., Incledon B., Yip C.M., DeFelippis M.R. Amyloid fibrils of glucagon characterized by high-resolution atomic force microscopy. Biophys. J. 2006;91:1905–1914. doi: 10.1529/biophysj.105.077438. [DOI] [PMC free article] [PubMed] [Google Scholar]
- 39.Goldsbury C.S., Wirtz S., Muller S.A., Sunderji S., Wicki P. Studies on the in vitro assembly of Aβ 1–40: implications for the search for Aβ fibril formation inhibitors. J. Struct. Biol. 2000;130:217–231. doi: 10.1006/jsbi.2000.4259. [DOI] [PubMed] [Google Scholar]
- 40.Fezoui Y., Hartley D.M., Harper J.D., Khurana R., Walsh D.M. An improved method of preparing the amyloid beta-protein for fibrillogenesis and neurotoxicity experiments. Amyloid. 2000;7:166–178. doi: 10.3109/13506120009146831. [DOI] [PubMed] [Google Scholar]
- 41.Elagnaf O.M.A. Conformations of beta-amyloid in solution. J. Neurochem. 1997;68:437–438. [PubMed] [Google Scholar]
- 42.Kaneko I. Conformations of beta-amyloid in solution—Reply. J. Neurochem. 1997;68:438–439. [PubMed] [Google Scholar]
- 43.Yagi H., Ban T., Morigaki K., Naiki H., Goto Y. Visualization and classification of amyloid beta supramolecular assemblies. Biochemistry. 2007;46:15009–15017. doi: 10.1021/bi701842n. [DOI] [PubMed] [Google Scholar]
- 44.Flyvbjerg H., Jobs E., Leibler S. Kinetics of self-assembling microtubules: an “inverse problem” in biochemistry. Proc. Natl. Acad. Sci. USA. 1996;93:5975–5979. doi: 10.1073/pnas.93.12.5975. [DOI] [PMC free article] [PubMed] [Google Scholar]
Associated Data
This section collects any data citations, data availability statements, or supplementary materials included in this article.