

Abstract
Ca2+ transport through mitochondrial Ca2+ uniporter is the primary Ca2+ uptake mechanism in respiring mitochondria. Thus, the uniporter plays a key role in regulating mitochondrial Ca2+. Despite the importance of mitochondrial Ca2+ to metabolic regulation and mitochondrial function, and to cell physiology and pathophysiology, the structure and composition of the uniporter functional unit and kinetic mechanisms associated with Ca2+ transport into mitochondria are still not well understood. In this study, based on available experimental data on the kinetics of Ca2+ transport via the uniporter, a mechanistic kinetic model of the uniporter is introduced. The model is thermodynamically balanced and satisfactorily describes a large number of independent data sets in the literature on initial or pseudo-steady-state influx rates of Ca2+ via the uniporter measured under a wide range of experimental conditions. The model is derived assuming a multi-state catalytic binding and Eyring's free-energy barrier theory-based transformation mechanisms associated with the carrier-mediated facilitated transport and electrodiffusion. The model is a great improvement over the previous theoretical models of mitochondrial Ca2+ uniporter in the literature in that it is thermodynamically balanced and matches a large number of independently published data sets on mitochondrial Ca2+ uptake. This theoretical model will be critical in developing mechanistic, integrated models of mitochondrial Ca2+ handling and bioenergetics which can be helpful in understanding the mechanisms by which Ca2+ plays a role in mediating signaling pathways and modulating mitochondrial energy metabolism.
Introduction
The Ca2+ ion has multiple roles in mitochondrial function and dysfunction. It is known to mediate signaling pathways between cytosol and mitochondria and modulate mitochondrial energy metabolism. Alteration of mitochondrial Ca2+ homeostasis can lead to mitochondrial dysfunction and cellular injury (1–8). Despite the importance of mitochondrial Ca2+ to metabolic regulation and mitochondrial bioenergetics, and to cell physiology and pathophysiology, there are still significant gaps in our understanding of the structure, composition, and kinetic properties of mitochondrial Ca2+ transport systems (e.g., Ca2+ uniporter).
Mitochondrial Ca2+ uniporter, located on the inner mitochondrial membrane (IMM), is the primary influx pathway for Ca2+ in energized (respiring) mitochondria, and hence is a key regulator of mitochondrial Ca2+ (1,6,7). This uniporter-mediated mitochondrial Ca2+ uptake is known to be inhibited by divalent cations (e.g., Mg2+, Mn2+) and protons (H+) (e.g., see (9–14)). Although the uptake of Ca2+ through the uniporter in respiring mitochondria has been extensively studied experimentally since the late 1960s, the kinetics of Ca2+ uptake has not been well characterized in terms of a mechanistic model that accounts for the thermodynamics of the transport process and other physiochemical mechanisms such as allosteric cooperative binding of Ca2+ to the uniporter and competitive binding and inhibition by other cations (e.g., Mg2+, H+). In fact, there is no mechanistic theoretical model of the uniporter in the literature that is thermodynamically feasible and satisfactorily describes independently published data sets on Ca2+ fluxes via the uniporter measured under a wide range of experimental conditions. Our recently published model of the uniporter (15) that is thermodynamically balanced and fits a large set of data incorporates a phenomenological factor that is not biophysically mechanistic. The need for such a mechanistic, credible and validated model of the uniporter is apparent in developing computer simulations of mitochondrial Ca2+ uptake and forming the basis for constructing biophysically-based, integrated models of mitochondrial Ca2+ handling and bioenergetics, which can be helpful in understanding the mechanisms by which Ca2+ plays a role in mediating signaling pathways and modulating mitochondrial energy metabolism (15).
Magnus and Keizer (16,17) developed a model of mitochondrial Ca2+ uniporter as a module of an integrated model of mitochondrial energy metabolism and Ca2+ handling to understand the direct effects of mitochondrial Ca2+ on ATP production in pancreatic β-cells. The kinetic model of the uniporter was based on a hypothetical four-state allosteric binding mechanism of Ca2+ to the uniporter and the Goldman-Hodgkin-Katz constant-field-type approximation for electrodiffusion and was parameterized using the experimental data of Gunter and co-workers (6,18) on Ca2+ uptake in isolated respiring mitochondria from rat liver. The Magnus-Keizer model was adopted by Cortassa et al. (19) in their integrated model of cellular and mitochondrial energy metabolism and Ca2+ dynamics in cardiomyocytes. However, the Magnus-Keizer model of the uniporter has the limitation that the model collapses for membrane potential ΔΨ ≤ ΔΨ∗ = 91 mV, and is not thermodynamically balanced. In addition, the model does not fit to the earlier experimental data of Scarpa and co-workers (10,11) on Ca2+ uptake in isolated respiring mitochondria from rat liver and rat heart. Furthermore, the Magnus-Keizer integrated model of mitochondrial Ca2+ handling predicts a high steady-state mitochondrial [Ca2+] (∼15 μM) in response to a low cytoplasmic [Ca2+] (∼1 μM) which is uncharacteristic for cardiac cells (13,20).
Due to the limitations in the Magnus-Keizer model of mitochondrial Ca2+ handling, Jafri and co-workers (21,22) recently developed an integrated model of mitochondrial energy metabolism and Ca2+ dynamics to understand the role of Ca2+ in the regulation of NADH and ATP production in cardiac mitochondria. Their model of mitochondrial Ca2+ uniporter, which is based on the assumption that the uniporter is a highly permeable ion channel selective mostly to Ca2+, describes the recent experimental observations of Kirichok et al. (23) on Ca2+ uptake and Ca2+ current through the uniporter obtained using patch-clamp techniques in mitoplasts obtained from cardiac mitochondria. However, their model does not fit to the experimental data of Scarpa and co-workers (10,11) and Gunter and co-workers (6,18).
In this work, we introduce a mechanistic mathematical model of mitochondrial Ca2+ uniporter that extends and provides the biophysical basis for our recently developed model of the uniporter (15). This model is thermodynamically balanced and adequately describes the experimental data of Scarpa and co-workers (10,11) as well as Gunter and co-workers (6,18) on Ca2+ fluxes through the Ca2+ uniporter in respiring mitochondria isolated from rat heart and rat liver measured under a varieties of experimental conditions. The model is based on a combination of Michaelis-Menten kinetics for carrier-mediated facilitated transport (24,25) and Eyring's free-energy barrier theory for absolute reaction rates associated with electrodiffusion (25–28). Specifically, the model accounts for a possible mechanism that assumes allosteric cooperative binding of Ca2+ to the uniporter, as revealed in the experimental data of Scarpa and co-workers (10,11). In addition, the model satisfies the Ussing flux ratio (25,29), which specifies the relationship between overall forward and reverse fluxes in a thermodynamically feasible transport process across a biological membrane (30).
Mathematical Formulation
Experimental data for model development and validation
The structure and composition of mitochondrial Ca2+ uniporter and kinetic mechanism associated with mitochondrial Ca2+ transport via the uniporter are not well known. However, experimental data on the kinetics of mitochondrial Ca2+ uptake are available from the work of Scarpa and co-workers (10,11) and Gunter and co-workers (6,18). This data describes the extra-mitochondrial [Ca2+] and mitochondrial membrane potential ΔΨ dependencies of mitochondrial Ca2+ uptake, measured in respiring mitochondria isolated from rat heart and rat liver. The data of Scarpa and co-workers reveals the sigmoid nature of mitochondrial Ca2+ uptake when plotted against the extra-mitochondrial [Ca2+], suggesting allosteric cooperative binding of at least two Ca2+ to the uniporter in the process of uniporter-mediated Ca2+ transport into mitochondria. The data of Gunter and co-workers reveals a nonlinear, non-Goldman-Hodgkin-Katz type of dependency of mitochondrial Ca2+ uptake on membrane potential ΔΨ. Our kinetic model of the uniporter that is developed here based on physical-chemical principles is parameterized to accurately reproduce the experimental data of Scarpa and co-workers as well as Gunter and co-workers.
Proposed mechanism for Ca2+ transport into mitochondria
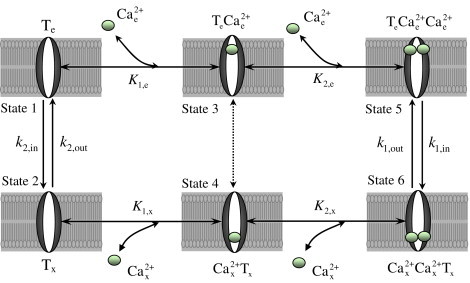
In view of this available kinetic data, a multi-state catalytic binding and interconversion mechanism combined with Eyring's free-energy barrier theory for absolute reaction rates and electrodiffusion (25–28) is proposed to develop the mathematical model of Ca2+ transport via the mitochondrial Ca2+ uniporter. The proposed transport mechanism is schematized in Fig. 1. The uniporter is assumed to have two binding sites for Ca2+ and the binding sites are assumed to be exposed to either side of the IMM. An ionized free Ca2+ molecule from the cytoplasmic (external) side of the IMM first binds to the unbound uniporter (T) (State 1) to form the intermediate complex (State 2) which then favors binding of another ionized free Ca2+ molecule (cooperative binding) to form the ternary complex (State 5). The complex then undergoes conformal changes or flips upside down (Ca2+ translocation) to form the ternary complex (State 6). The complex in the matrix (internal) side of the IMM goes through the reverse process where it dissociates in two steps to form the intermediate complex (State 3), unbound uniporter (T) (State 1), and ionized free Ca2+. The proposed transport scheme also assumes possible cross-interactions between the uniporter, external Ca2+, and internal Ca2+ to form the intermediate ternary complex (State 4, dead end). The intermediate complexes and are assumed not to undergo any conformational changes, as they are likely to be in negligible concentrations. The transport of Ca2+ via the mitochondrial Ca2+ uniporter is limited by the interconversion rate constants kin and kout which are dependent on the mitochondrial membrane potential ΔΨ.
Figure 1.
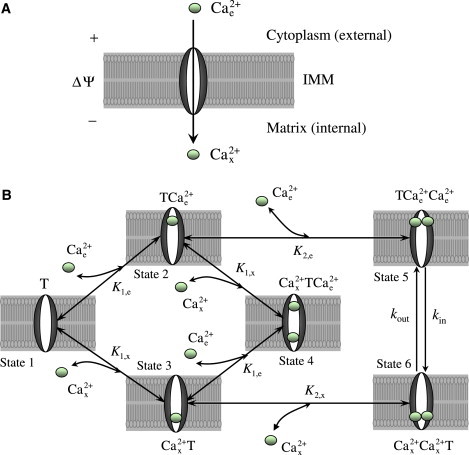
The proposed six-state kinetic mechanism of Ca2+ transport into mitochondria via the Ca2+ uniporter. The uniporter is assumed to have two binding sites for Ca2+ and the Ca2+ is assumed to bind to the uniporter from either side of the IMM. The ionized free Ca2+ from the cytoplasmic (external) side of the IMM cooperatively binds to the unbound uniporter (T) (State 1) in two steps to form the complex (State 5) which then undergo conformal changes (or flips upside down) to form the complex (State 6). The complex in the matrix (internal) side of the IMM goes through the reverse process where it dissociates in two steps to form the unbound uniporter (T) and ionized free Ca2+. The model also assumes the cross-interactions between the uniporter, external Ca2+, and internal Ca2+ to form the intermediate complex (dead end, State 4). The other two states of the uniporter are the bound uniporter (State 2) and (State 3). (K1,e, K1,x) and (K2,e, K2,x) are the two pairs of dissociation (binding) constants for the two step uniporter binding reactions with the external and internal Ca2+. The transport of Ca2+ via the Ca2+ uniporter is limited by the rate constants kin and kout which are dependent on the membrane potential ΔΨ.
Derivation of mitochondrial Ca2+ uniporter flux expression
Based on the proposed uniporter-mediated Ca2+ transport scheme (Fig. 1) and with the assumptions of a quasi-steady state, rapid equilibrium binding of the external and internal Ca2+ with the uniporter, the reactions for the uniporter-Ca2+ binding and the reaction for the conformational change of the ternary uniporter-2Ca2+ binding complex can be written as
| (1) |
where (K1,e, K1,x) and (K2,e, K2,x) are the two pairs of dissociation (binding) constants for the two step uniporter binding reactions with the external and internal Ca2+; kin and kout are the forward and reverse rate constants in the interconversion of and , which limit the uniporter function. Since the conformational change or interconversion of (State 5) into (State 6) involves translocation of positive charges (Ca2+), the rate constants kin and kout are functions of membrane potential ΔΨ. Furthermore, depending on physical locations of the Ca2+ binding sites on the uniporter, the binding constants K1,e, K1,x, K2,e, and K2,x can also be dependent on membrane potential ΔΨ.
Under the quasi-steady state, rapid equilibrium binding assumptions, we have the following relationships between various states of the uniporter:
| (2) |
where the concentrations of free and Ca2+-bound uniporter states are expressed with respect to the mitochondrial matrix volume; [Ca2+]e and [Ca2+]x denote the extra-mitochondrial and matrix concentrations of Ca2+; K1,e, K1,x, K2,e, and K2,x are in the units of concentration (molar).
Since the total uniporter concentration [T]tot is constant, we have by mass conservation
| (3) |
Upon substituting Eq. 2 into Eq. 3 and by rearranging, we can express the concentration of unbound free uniporter [T] in terms of the total uniporter concentration [T]tot as
| (4) |
where
| (5) |
According to the proposed scheme of Ca2+ transport into mitochondria via the Ca2+ uniporter (Fig. 1), the Ca2+ transport flux (due to conformational change) can be expressed as
| (6) |
The generalized flux expression (6) contains four binding constants (K1,e, K1,x, K2,e and K2,x) and two rate constants (kin and kout), that is a total of six unknown kinetic parameters. The number of kinetic parameters can be reduced by two with the following simplifications.
Model 1
In one approximation, the first binding constants K1,e and K1,x are assumed to be large compared to the second binding constants K2,e and K2,x with the constraints that K1,e.K2,e = Ke2 and K1,x.K2,x = Kx2 are finite (cooperative binding). These approximations are valid under the assumptions K1,e ≫ 1 μM, K1,x ≫ 1 μM, K2,e ≪ 1 μM, and K2,x ≪ 1 μM. In this case, the concentrations of , and can be considered negligible compared to the concentrations of the other binding states of the uniporter. The flux expression (6) reduces to
| (7) |
where
| (8) |
The reduced flux expression (7) contains only two binding constants (Ke and Kx) and two rate constants (kin and kout), a total of four unknown kinetic parameters.
Model 2
In another approximation, the first binding constants K1,e and K1,x are assumed to be equal to the second binding constants K2,e and K2,x, respectively; K1,e = K2,e = Ke and K1,x = K2,x = Kx. In this case, the flux expression (6) reduces to
| (9) |
where
| (10) |
As in the case of Model 1, the reduced flux expression (9) contains only two binding constants (Ke and Kx) and two rate constants (kin and kout), a total of four unknown kinetic parameters. However, the denominator D2 is more complex (it contains the contributions from State 2, State 3 and State 4) than the denominator D1. Therefore, even if both models may be able to fit to the same experimental data, the estimates of the kinetic parameters Ke, Kx, kin and kout from these two models are expected to differ.
Further parameter reduction
Under equilibrium transport conditions, the flux of Ca2+ via the Ca2+ uniporter is zero (i.e., JUni = 0). Therefore, the kinetic parameters Ke, Kx, kin and kout can be further constrained by the following equilibrium relationships:
| (11) |
where Keq is the equilibrium constant for trans-membrane Ca2+ transport which is a function of membrane potential ΔΨ (see below). Therefore, the number of unknown kinetic parameters for estimation can be further reduced by one (from four parameters to three parameters).
It is to be noted here that the electrostatic field of the charged membrane will influence both the stages of ternary uniporter-2Ca2+ complex formation and the stages of trans-membrane Ca2+ translocation via the uniporter. We consider below the most general case of interactions between the electric field of the membrane and molecules taking part in Ca2+ translocation. Such interactions are described via dependencies of the kinetic parameters Ke, Kx, kin and kout on the electrostatic potential difference of the membrane.
Dependence of kinetic parameters Ke, Kx, kin and kout on membrane potential ΔΨ
The binding of Ca2+ to the uniporter and the translocation of Ca2+ via the uniporter depends on the electrostatic field of the charged membrane. To take this dependency into account, we assume that the kinetic parameters (dissociation and rate constants: Ke, Kx, kin and kout) depend on the electrostatic potential difference across the membrane. The membrane potential dependencies of the kinetic parameters can be derived based on biophysical principles and well-known laws of thermodynamics, electrostatics and superposition. Our approach is similar to that of Metelkin et al. (31) on the kinetic modeling of mitochondrial adenine nucleotide translocase. In this approach, we assume that the total value of the membrane potential is the sum of local electric potentials and each of the local electric potentials influences the corresponding stages of the Ca2+ binding and translocation processes.
The stages of Ca2+ binding to the uniporter and Ca2+ translocation via the uniporter are schematized in Fig. 2. Every position of Ca2+ on the uniporter can be characterized by an electric potential value. We assume here that the difference in potentials between the adjacent positions of Ca2+ is proportional to the total potential difference across the membrane. In accordance with the rule of superposition, the sum of potential differences between the consecutive positions of Ca2+ is equal to the total potential difference across the membrane. Thus, this approach divides the total drop in potential across the membrane into elementary stages. The scheme depicted in Fig. 2 illustrates the influence of such elementary potential drops on the rate of uniporter operation. Values of the potential drops are marked for all elementary stages of the scheme.
Figure 2.
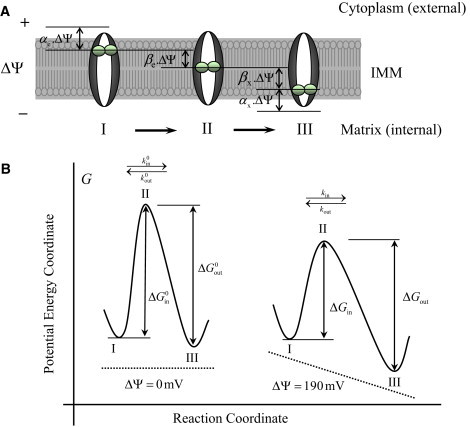
Free-energy barrier formalism for Ca2+ transport into mitochondria via the Ca2+ uniporter. (A) (I–III) Consecutive states of the Ca2+-bound uniporter functional unit in the process of Ca2+ translocation that is used to derive the dependence of the rate of Ca2+ transport on the electrostatic membrane potential ΔΨ. Here, αe is the ratio of the potential difference between Ca2+ bound at the site of uniporter facing the external side of the IMM and Ca2+ in the bulk phase to the total membrane potential ΔΨ, αx is the ratio of the potential difference between Ca2+ bound at the site of uniporter facing the internal side of the IMM and Ca2+ in the bulk phase to the total membrane potential ΔΨ, βe is the displacement of external Ca2+ from the coordinate of maximum potential barrier, and βx is the displacement of internal Ca2+ from the coordinate of maximum potential barrier. (B) Potential energy barrier profile along the reaction coordinate that is used to derive the dependence of the rate of Ca2+ transport on the electrostatic membrane potential ΔΨ. The dashed line shows the profile of the potential created by the electric field of the charged membrane. The points I, II, and III correspond to the Ca2+-bound uniporter states depicted in the upper panel A. The rate constants kin and kout are related to the changes in potential energy (Gibbs free-energy) ΔGin and ΔGout. Note that in the absence of electric field (ΔΨ = 0 mV), the heights of the free-energy barriers in the forward and reverse directions are equal when the dissociation constants for the binding of the external and internal Ca2+ to the uniporter are equal: that is, if and only if .
Equilibrium constant
Since a cycle of uniporter operation involves translocation of four elementary positive charges (2Ca2+) across the mitochondrial membrane, the dependence of the equilibrium constant Keq on the membrane potential ΔΨ for the uniporter-mediated Ca2+ transport across the membrane can be expressed as (Nernst equation)
| (12) |
where ZCa = 2 is the valence of Ca2+; F, R, and T denote the Faraday's constant, ideal gas constant, and absolute temperature, respectively; ΔΦ is the nondimensional potential difference across the membrane. In the absence of electric field (ΔΨ = 0), Eq. 12 gives Keq = 1.
Dissociation constants
To derive the dependence of the dissociation constants of uniporter-Ca2+ binding on the membrane potential ΔΨ, let us first consider the two-step binding of the external Ca2+ to the uniporter. The changes in Gibb's free-energy for the two binding reactions are
| (13) |
where and are the standard changes in Gibbs free-energy of the reactions; αe is the ratio of the potential difference between Ca2+ bound at the site of uniporter facing the external side of the IMM and Ca2+ in the bulk phase to the total membrane potential ΔΨ (ΔΨ = Ψe − Ψx, i.e., outside potential minus inside potential, so ΔΨ is positive). An assumption inherent in this derivation is that both the Ca2+ binding sites on the uniporter are at an equidistant distance from the bulk medium. At equilibrium (Δμ1,e = Δμ2,e = 0), Eq. 13 gives
| (14) |
where and . Equation 14 suggests that the dissociation constants K1,e and K2,e for binding of the external Ca2+ to the uniporter are reduced (i.e., the association becomes easier) in the presence of electric field, provided αe > 0.
For binding of the internal Ca2+ to the uniporter, it can be similarly shown that
| (15) |
where αx is the ratio of the potential difference between Ca2+ bound at the site of uniporter facing the internal side of the IMM and Ca2+ in the bulk phase to the total membrane potential ΔΨ. In contrast to K1,e and K2,e, the dissociation constants K1,x and K2,x for binding of the internal Ca2+ to the uniporter are increased (i.e., the association becomes difficult) in the presence of electric field, provided αx > 0.
In either of the models derived in the previous section (Model 1 and Model 2), the dissociation constants Ke and Kx can be obtained from Eqs. 14 and 15 as
| (16) |
Note that for more generality we have assumed here that and are distinct. Thus the dissociation constants Ke and Kx can be fully characterized by four unknown parameters , , αe and αx. For positive αe and αx, the dissociation constant tends to decrease on the outside and increase on the inside of the IMM.
Rate constants
The influence of the membrane potential ΔΨ on the rate constants of the ternary uniporter-2Ca2+ complex conformational change can be accounted for using Eyring's free-energy barrier theory for absolute reaction rates and electrodiffusion (25–28). For simplicity, we assume here that the free-energy profile of Ca2+ translocation across the membrane (limiting stage) is a single barrier (Fig. 2 B), and the translocation is a jump over the barrier from one potential well to another. We define the reaction coordinate as the coordinate from Ca2+ bound at the external side to Ca2+ bound at the internal side of the membrane along the direction of Ca2+ translocation. The local maximum (peak) (State II) of the free-energy profile corresponds to the barrier that impedes the Ca2+ translocation, whereas the local minima (States I and III) correspond to the uniporter-2Ca2+ complex states on the either side of the membrane. The Ca2+ transport rate is determined by the probability of the uniporter to translocate Ca2+ from one binding site to the other, which depends on the height of the free-energy barrier, which in turn depends on the membrane potential ΔΨ, as schematized in Fig. 2 B.
According to Eyring's free-energy barrier theory, the rate at which an ion can jump from one binding site to the other is given by
| (17) |
where ΔG is the height of the free-energy barrier; κ = kBT/h is a constant (with units of 1/time), where kB is Boltzmann's constant, h is Planck's constant, and T is the temperature. In this case, the heights of the free-energy barrier (State II) from States I and III can be defined by
| (18) |
where and are the heights of the free-energy barriers in the absence of electric field (ΔΨ = 0 mV), βe is the displacement of external Ca2+ (State I) from the coordinate of maximum potential barrier (State II), and βx is the displacement of internal Ca2+ (State III) from the coordinate of maximum potential barrier (State II). Note that subject to the condition . For simplicity, we have assumed that the uniporter has no net charge (neutral) and that the charge on the uniporter-2Ca2+ complex is 2ZCa. Otherwise, we could express and as the effective displacement parameters that can be identified, where Zj is the jth charged species of the uniporter and βe,j and βx,j are the corresponding displacements (βe,Ca and βx,Ca are the displacements of Ca2+ ions).
It is evident from Eq. 18, that the height of the barrier in the inward direction is reduced, while the height in the outward direction is increased in the presence of electric field (Fig. 2 B). This means it becomes easier for the Ca2+ ions to cross the barrier in the inward direction, but more difficult for the Ca2+ ions to exit the matrix in the presence of a positive membrane potential, measured from outside to inside. Upon substituting Eq. 18 into Eq. 17, we obtain the rate constants of Ca2+ translocation as
| (19) |
where are the forward and reverse rate constants in the absence of electric filed (ΔΨ = 0 mV). Thus the rate constants kin and kout can be fully characterized by four unknown parameters , , βe and βx. Also note that , subject to the condition or .
Thermodynamics constraint and parameter reduction
By substituting Eq. 12 for Keq, Eq. 16 for Ke and Kx, and Eq. 19 for kin and kout into Eq. 11, we obtain the following relationships (thermodynamic constraints) between and αe, αx, βe and βx:
| (20) |
These thermodynamic constraints reduce the number of unknown parameters by two, from a total of eight parameters to six parameters.
Derived models of mitochondrial Ca2+ uniporter
By substituting Eq. 16 for Ke and Kx and Eq. 19 for kin and kout into Eqs. 7 and 8, and using the above thermodynamic constraint (Eq. 20), the flux expression for the mitochondrial Ca2+ uniporter corresponding to Model 1 (Eqs. 7 and 8) is reduced to
| (21) |
where is a lumped parameter denoting the activity of the uniporter. Note that for αe = αx = 0 and , the flux expression (21) can approximate the flux expression (see Eq. S1 in the Supporting Material) in our previous model of the uniporter (15) provided .
In a similar fashion, we can rewrite the flux expression for the mitochondrial Ca2+ uniporter corresponding to Model 2 (Eqs. 9 and 10) in the form
| (22) |
Both the models of the Ca2+ uniporter are characterized by six unknown parameters (XUni, , , βe, αe and αx) which are estimated below based on the experimental data of Scarpa and co-workers (10,11) and Gunter and co-workers (6,18) on Ca2+ fluxes through the uniporter in energized mitochondria purified from rat heart and rat liver measured under varying experimental conditions (varying extra-matrix [Ca2+] and varying membrane potential ΔΨ).
Since in most of the experiments the matrix concentration of Ca2+ ([Ca2+]x) is low compared to the extra-matrix concentration of Ca2+ ([Ca2+]e), we may not be able to estimate (identify) all of the above six independent kinetic parameters uniquely and accurately. We explore the parameter estimation (identification) process for two feasible cases: (Case 1) so that and , and (Case 2) and are distinct so that and as well as and are distinct. For simplicity, we also assume that αe = 0, that is, the Ca2+ binding sites on the external side of the uniporter are situated at a negligible distance from the bulk phase, so that the potential barrier the external Ca2+ ions would have to overcome to bind to the uniporter would be negligible. With these assumptions and approximations, the number of unknown parameters for estimation is further reduced to four in Case 1 and reduced to five in Case 2.
Statistical method of optimization and parameter estimation
The mitochondrial Ca2+ uniporter model parameters θ = (XUni, , , βe, αe, αx) characterizing the experimental data of Scarpa and co-workers (10,11) and Gunter and co-workers (6,18) on mitochondrial Ca2+ uptake were estimated by simultaneous least-squares fitting of the model simulated outputs to the experimental data
| (23) |
where Nexp is the number of experiments and Ndata is the number of data points in a particular experiment, are the experimental data on Ca2+ influx rates via the uniporter and are the corresponding model simulated outputs which depend on the model parameter θ, is the maximum value of that is used to normalize the experimental data and model outputs. The minimization of the mean residual error (objective function) E(θ) for optimal estimation of the uniporter model parameters θ = (XUni, , , βe, αe, αx) is carried out using the FMINCON optimizer in Matlab (The MathWorks, Natick, MA) The robustness of the model fitting to the data for a particular uniporter model is assessed based on the value of mean residual error E(θ) in Eq. 23 at the optimal parameter estimates (least-square error).
Results
This section demonstrates the parameterization and independent validation of the two developed mathematical models of the mitochondrial Ca2+ uniporter. Specifically, the two different kinetic models of the uniporter (Model 1 and Model 2; Eqs. 21 and 22) under two different assumptions (Case 1: and Case 2: and are distinct) are used here to simulate and fit the independent experimental data of Scarpa and co-workers (10,11) and Gunter and co-workers (6,18) on mitochondrial Ca2+ uptake, which are shown in Figs. 3 and 4. The solid lines are the simulations from Model 1, whereas the dashed lines are the simulations from Model 2. The left panels (A, C, and E) of Figs. 3 and 4 correspond to the simulations and fittings for the Case 1, whereas the right panels (B, D, and F) of Figs. 3 and 4 correspond to the simulations and fittings for the Case 2. The estimated model parameter values corresponding to these different assumptions and data sets are summarized in Table 1.
Figure 3.
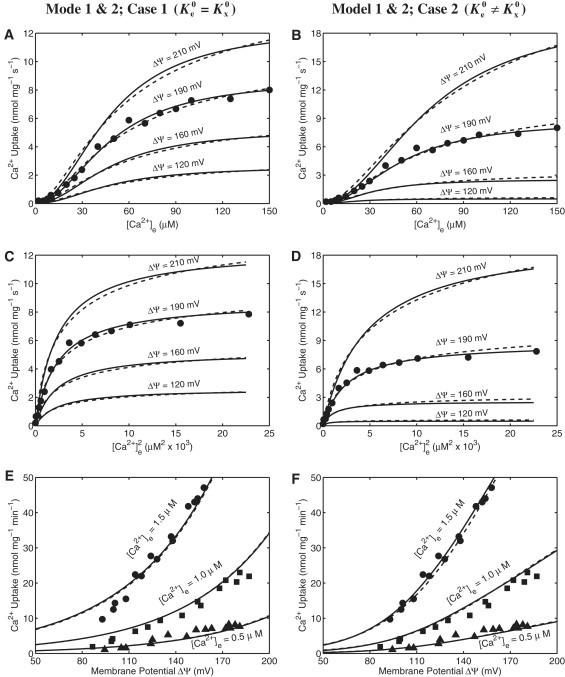
The fittings of Ca2+ uniporter model (lines) to the experimental data (points) on Ca2+ uptake in purified rat liver mitochondria for two different models under two different assumptions. (Upper and middle panels: A–D) The fittings of four different kinetic models of Ca2+ uniporter to the kinetic data of Vinogradov and Scarpa (11) in which the initial rates of Ca2+ uptake (points) were measured in respiring mitochondria purified from rat liver with varying levels of extra-matrix buffer Ca2+. Also shown are the Model simulated mitochondrial Ca2+ uptake at four different levels of membrane potential ΔΨ (lines) in which the models were fitted to the data with ΔΨ = 190 mV (States 2 and 4 membrane potential). The plots in the upper panels (A and B) differ from the plots in the middle panels (C and D) through the labeling of the x axis. (Lower panels: E and F) The fittings of the same four kinetic models to the kinetic data of Gunter and co-workers (6,18) in which the initial rates of Ca2+ uptake in respiring mitochondria purified from rat liver were measured with varying membrane potential ΔΨ for three different levels of extra-matrix buffer Ca2+. To fit the models to these additional data sets, only the uniporter activity parameter (XUni) is readjusted, while keeping the other kinetic parameter fixed at values as estimated from the fittings in plots (A–D) (Table 1). The solid lines are the simulations from Model 1 (K1,e ≫ 1, K1,x ≫ 1, K2,e ≪ 1 and K2,x ≪ 1, such that K1,e. K2,e = Ke2 and K1,x.K2,x = Kx2 are finite), whereas the dashed lines are the simulations from Model 2 (K1,e = K2,e = Ke and K1,x = K2,x = Kx); the left panels (A, C, E) correspond to the fittings and simulations with the assumption that , whereas the right panels (B, D, F) correspond to the fittings and simulations with the assumption that and are distinct.
Figure 4.
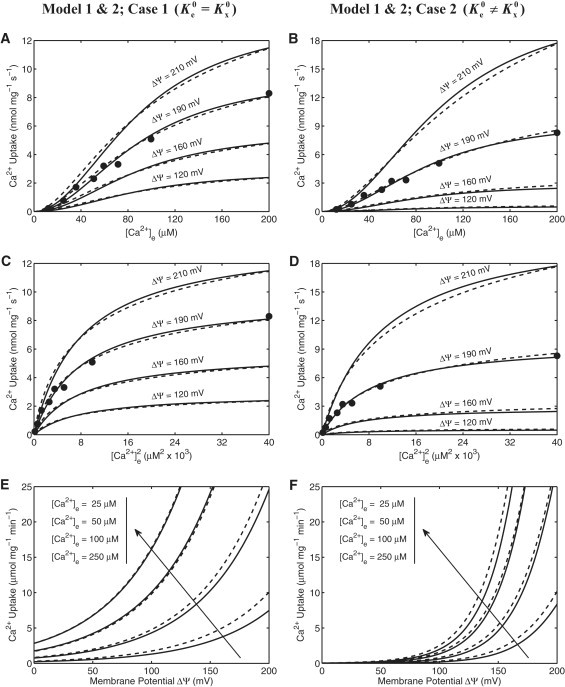
The fittings of Ca2+ uniporter model (lines) to the experimental data (points) on Ca2+ uptake in isolated rat heart mitochondria for two different models under two different assumptions. (Upper and middle panels: A–D) The fittings of four different kinetic models of Ca2+ uniporter to the kinetic data of Scarpa and Graziotti (10) in which the initial rates of Ca2+ uptake (points) were measured in respiring mitochondria isolated from rat heart with varying levels of extra-mitochondrial buffer Ca2+. Also shown are the Model simulated mitochondrial Ca2+ uptake at four different levels of membrane potential ΔΨ (lines) in which the models were fitted to the data with ΔΨ = 190 mV (States 2 and 4 membrane potential). The plots in the upper panels (A and B) differ from the plots in the middle panels (C and D) through the labeling of the x axis. To fit the models to these additional data sets from rat heart mitochondria, only the kinetic parameters XUni, and were readjusted, while keeping the other kinetic parameter αe, αx, βe and βx fixed at values as estimated from the fittings in Fig. 3 for rat liver mitochondria (Table 1). (Lower panels: E and F) The Model simulated Ca2+ uptake in respiring mitochondria isolated from rat heart as a function of membrane potential ΔΨ for four different levels of extra-mitochondrial buffer Ca2+ (relatively higher levels of buffer Ca2+ than those shown in Fig. 3E and F) for rat liver mitochondria; corresponding to the experimental protocol of Kirichok et al. (23)). For these simulations, the uniporter activity parameter (XUni) is increased by 150 times (comparable to that obtained from the data in Fig. 3E and F for rat liver mitochondria), while keeping the other kinetic parameters fixed at values as estimated from the fittings in plots (A–D) (Table 1). The solid lines are the simulations from Model 1, whereas the dashed lines are the simulations from Model 2; the left panels (A, C, E) correspond to the fittings and simulations with the assumption that , whereas the right panels (B, D, F) correspond to the fittings and simulations with the assumption that and are distinct; model specifications are as mentioned in Fig. 3.
Table 1.
The estimated parameter values in the models of mitochondrial Ca2+ uniporter
| Parameter | Values for Model 1 |
Values for Model 2 |
Units | Reference | |||
|---|---|---|---|---|---|---|---|
| Case 1 | Case 2 | Case 1 | Case 2 | ||||
| 49.6 | 0.55 | 36.0 | 0.5 | nmol/mg/sec | a | ||
| 0.32 | 3.55×10⁻³ | 0.40 | 5.56×10⁻³ | b | |||
| 0.354 | 3.986×10⁻³ | 0.45 | 6.76×10⁻³ | c | |||
| 49.6 | 8.5×10⁻³ | 36.0 | 0.028 | nmol/mg/sec | a | ||
| 0.32 | 54.84×10⁻⁶ | 0.40 | 311.1×10⁻⁶ | b | |||
| 0.354 | 61.59×10⁻⁶ | 0.45 | 378.4×10⁻⁶ | c | |||
| 48×10−6 | 15×10−6 | 40×10−6 | 12×10−6 | molar | a | ||
| 48×10−6 | 15×10−6 | 40×10−6 | 12×10−6 | b | |||
| 90×10−6 | 78.75×10⁻⁶ | 75×10−6 | 63×10−6 | c | |||
| 48×10−6 | 1.865×10⁻⁶ | 40×10−6 | 2.84×10⁻⁶ | molar | a | ||
| 48×10−6 | 1.865×10⁻⁶ | 40×10−6 | 2.84×10⁻⁶ | b | |||
| 90×10−6 | 9.79×10⁻⁶ | 75×10−6 | 14.91×10⁻⁶ | c | |||
| αe | 0 | 0 | 0 | 0 | unitless | a, b, c | |
| αx | 0.038 | −0.214 | 0.038 | −0.239 | unitless | a, b, c | |
| βe | 0.112 | 0.264 | 0.112 | 0.259 | unitless | a, b, c | |
| βx | 0.85 | 0.95 | 0.85 | 0.98 | unitless | a, b, c | |
| Standard physiochemical/thermodynamic parameters used in the model | |||||||
| RT | Gas constant times temperature (298 K) | 2.5775 | kJ mol−1 | d | |||
| F | Faraday's constant | 0.096484 | kJ mol−1 mV−1 | d | |||
| ZCa | Valence of Ca2+ | 2 | unitless | d | |||
The rate constants and are redefined here as and . The uniporter activity parameter XUni in Eqs. 21 and 22 is . The kinetic and biophysical parameters satisfy the thermodynamic constraints: and . The rate constants and the uniporter activity parameters in the units of mmol/mg/s can be converted to the units of mmol/L/s by using the conversion factor 1 mg mitochondrial protein = 3.67 μL mitochondria (15).a, Estimated from the data of Wingrove et al. (18) using rat liver mitochondria; b, estimated from the data of Vinogradov & Scarpa (11) using rat liver mitochondria; c, estimated from the data of Scarpa & Graziotti (10) using rat heart mitochondria; and d, standard physiochemical/thermodynamic parameters.
In the experiments of Scarpa and co-workers, the initial (pseudo-steady) rates of Ca2+ uptake through the Ca2+ uniporter were measured in respiring mitochondria purified from rat liver (11) (Fig. 3, A–D) and rat heart (10) (Fig. 4, A–D) after the addition of varying concentrations of Ca2+ (i.e., CaCl2) to the extra-mitochondrial buffer medium in the presence of certain amount of Mg2+ (i.e., MgCl2). For fitting the models to the data, the membrane potential ΔΨ is held fixed at ΔΨ = 190 mV, a typical value corresponding to the States 2 and 4 respiration. In the experiments of Gunter and co-workers, the initial (pseudo-steady) rates of Ca2+ uptake via the Ca2+ uniporter were measured in energized mitochondria isolated from rat liver as a function of membrane potential ΔΨ for three different levels of extra-mitochondrial buffer Ca2+ (i.e., [Ca2+]e = 0.5, 1.0 and 1.5 μM) in the absence of Mg2+, where the membrane potential ΔΨ was varied through addition of varying levels of malonate to the buffer medium (6,18) (Fig. 3, E and F). These experiments provide sufficient sensitive data on the membrane potential-dependent mitochondrial Ca2+ uptake at lower concentrations of extra-mitochondrial buffer Ca2+ for effective identification of membrane potential-dependent biophysical parameters of the model. The corresponding model simulations of the membrane potential-dependent Ca2+ uptake via the Ca2+ uniporter in respiring cardiac mitochondria with comparable uniporter activity as obtained from the data in Fig. 3, E and F for liver mitochondria but higher levels of extra-mitochondrial buffer Ca2+ (i.e., [Ca2+]e = 25, 50, 100 and 250 μM) are shown in Fig. 4, E and F in which the membrane potential ΔΨ was ramped from 0 mV to 200 mV—a simulation protocol similar to the experimental protocol of Kirichok et al. (23) in which the Ca2+ currents through the Ca2+ uniporter were measured using patch-clamp techniques in mitoplasts obtained from cardiac mitochondria.
From our model simulations and fittings of the models to the experimental data (Figs. 3 and 4), it is evident that both the kinetic models of the mitochondrial Ca2+ uniporter (Model 1 and Model 2; solid lines and dashed lines) are indistinguishable. With either of the models, we are able to reproduce the experimental data with almost identical accuracy, with suitable changes in the model parameter values, in consistent with the model assumptions. The model parameter values are different depending on the model used (Model 1 versus Model 2) or the assumptions considered (Case 1 versus Case 2) for model simulations of the experimental data (Table 1). However, it is clear from Figs. 3 and 4 that the assumptions of Case 1 and Case 2 predict significantly different behavior of mitochondrial Ca2+ uptake.
Both the kinetic models of the mitochondrial Ca2+ uniporter under both the assumptions (Case 1: and Case 2: and are distinct) are able to satisfactorily describe the two independent data sets of Scarpa and co-workers on extra-mitochondrial Ca2+-dependent Ca2+ uptake in isolated rat liver (11) and rat heart (10) mitochondria, as shown in Fig. 3, A–D and Fig. 4, A–D. However, the models with the assumption of (Case 1) are not able to simulate the data sets of Gunter and co-workers on membrane potential ΔΨ-dependent Ca2+ uptake in purified rat liver mitochondria (6,18) (Fig. 3 E), especially in the domain ΔΨ ≤ 120 mV. In this domain, the membrane potential factor in the model (Eq. 21) deviates from the empirical factor in our previous model of the uniporter (15) (Eq. S1 and Fig. S1). Only the models with the assumption that and are distinct (Case 2) are able to fit to these observed kinetic data (Fig. 3 F). This analysis suggests that both kinds of kinetic data are essential to uniquely identify the model and the kinetic and biophysical parameters associated with the model. It is also to be noted here that either of the kinetic models (Model 1 or Model 2) with the condition that and are distinct fit all of the available kinetic data sets (Figs. 3 and 4, right panels) significantly better than the kinetic models of Magnus and Keizer (16) and Jafri and co-workers (21,22) (Eqs. S2 and S3 and Figs. S2 and S3).
From this analysis, it is apparent that the extra-mitochondrial Ca2+-dependent mitochondrial Ca2+ uptake data are essential to identify the binding constants ( and ) of the model, whereas the membrane potential ΔΨ-dependent Ca2+ uptake data are necessary to identify the asymmetry of the external and internal binding constants (i.e., the notion that and are distinct) and the other biophysical parameters αe, αx, βe and βx of the model that govern the dependence of the binding constants (Ke and Kx) and rate constants (kin and kout) on the membrane potential ΔΨ. Therefore, the kinetic and biophysical parameters of the models were estimated by simultaneously fitting the models to both kinds of kinetic data sets from a single mitochondrial source (i.e., the Ca2+ uptake data from rat liver mitochondria; Fig. 3). This approach enabled robust (unique and accurate) estimations for the model parameters. Since both the data sets were from the rat liver mitochondria, the binding constants ( and ) were constrained to be the same for both the data sets, whereas the activity parameters ( and ) were assumed to vary over the data sets to implicitly account for different experimental protocols used in the studies of Vinogradov and Scarpa (11) and Wingrove et al. (18) (i.e., the presence versus the absence of Mg2+ in the extra-mitochondrial buffer medium). For Ca2+ uptake data of Scarpa and Graziotti (10) from the rat heart mitochondria, the binding constants ( and ) and the activity parameters ( and ) were allowed to be different from that obtained for the rat liver mitochondria. The biophysical parameters αe, αx, βe and βx were constrained to be the same for all three data sets, which is depicted in the estimated parameter values summarized in Table 1; the estimated values of αe, αx, βe and βx are the same for all three data sets for a particular model (Model 1 or Model 2) under a particular assumption (Case 1 or Case 2).
The fitting of the Model 1 under Case 2 to the kinetic data from cardiac mitochondria (10) (Fig. 4, B and D, solid lines) provides the estimates = 78.75 μM, = 9.8 μM, = 4×10⁻³ nmol/mg/s, and = 61.6×10⁻⁶ nmol/mg/s, whereas the same fitting for liver mitochondria (11) (Fig. 3, B and D, solid lines) provides the estimates = 15 μM, = 1.9 μM, = 3.55×10⁻³ nmol/mg/s, and = 54.8×10⁻⁶ nmol/mg/s. Thus the uniporter activities are similar in both liver and cardiac mitochondria under similar experimental conditions (both in the presence of Mg2+ in the experimental buffer medium), whereas the binding constants of Ca2+ for the uniporter in cardiac mitochondria are estimated to be ∼5.25 times that of the values in liver mitochondria. The simultaneous fitting of the same kinetic model of the uniporter (Model 1, Case 2) to the other three data sets from liver mitochondria (6,18) (Fig. 3 F, solid lines) provides the similar estimates for the binding constant ( = 15 μM and = 1.9 μM), but about two-order of magnitude higher (∼155 times) in the estimates of the uniporter activity parameters ( = 0.55 nmol/mg/s and = 8.5×10⁻³ nmol/mg/s) than that obtained from the fitting in Fig. 3, B and D (11). The differences may be attributed to the fact that the data were from two different mitochondrial preparations and two different experimental protocols (e.g., in the presence versus absence of Mg2+ in the two experimental buffer mediums, which is known to compete with Ca2+ for transport into mitochondria via the Ca2+ uniporter, and hence inhibits mitochondrial Ca2+ uptake (9–13)). Therefore, the apparent activity of the uniporter in either cardiac or liver mitochondria could not be estimated with confidence from this data, without additional knowledge of the chemical constituents of the mitochondrial preparations.
Analysis of different kinetic data with Model 1 and Model 2 under Case 2 showed that the model parameter values are readjusted to provide similar fits of the model to the three independent data sets. Nevertheless, there are consistently similar trends in the estimated model parameter values between different data sets (e.g., ≪ and ≫ ) (Table 1). The estimated values of the biophysical parameters αe, αx, βe and βx did not differ significantly between different models under any particular case (Table 1). The estimated value of αe was consistently negligible and that of αx was negative; so we fixed αe = 0 and estimated αx along with the two most sensitive biophysical parameters βe and βx. The estimates of αe, αx, βe and βx corresponding to Case 2 that provided the best fit of the models to the data suggest that 1), since αx is negative, the charge distribution on the uniporter during Ca2+ binding to the uniporter and Ca2+ translocation via the uniporter is not linearly decreasing along the reaction coordinate (i.e., the direction of Ca2+ translocation from outside to inside of the uniporter), and 2), since βe ≈ 0.26 and βe ≈ 0.96, the free-energy barrier that impedes the Ca2+ translocation, is not symmetric. These estimates result in stiff gradients in Ca2+ uptake profiles with respect to the membrane potential ΔΨ, as depicted in Fig. 3, B, D, and F, and Fig. 4, B, D, and F (right panels).
Discussion
The major contributions of our theoretical study is the detailed characterization of the kinetics of mitochondrial Ca2+ uniporter, which is the primary influx pathway for Ca2+ in respiring (energized) mitochondria, and hence is a key regulator of mitochondrial Ca2+. This characterization is done based on a biophysically-based, mechanistic mathematical model that is compared to several independent experimental data sets on mitochondrial Ca2+ uptake in the literature. Our model differs from the previous attempts (16,21,22) in that it is thermodynamically balanced and adequately describes the independent experimental data sets of Scarpa and co-workers (10,11) as well as Gunter and co-workers (6,18) on Ca2+ influx through the Ca2+ uniporter in energized mitochondria isolated from rat heart and rat liver measured under varying experimental conditions. Although there is no direct experimental evidence regarding the structure and composition of the mitochondrial Ca2+ uniporter functional unit and the mechanisms for Ca2+ binding to the uniporter, our model is consistent with the hypothesis of Scarpa and co-workers (10,11) regarding the presence of at least two Ca2+ binding sites on the uniporter for uniporter-mediated Ca2+ translocation across the IMM. Alternatively, by considering a single Ca2+ binding site on the uniporter, we were not able to fit the resulting model to the experimental data of Scarpa and co-workers.
The mitochondrial Ca2+ uniporter model developed here is able to explain the experimental data of Gunter and co-workers (6,18) on mitochondrial Ca2+ uptake as a function of membrane potential ΔΨ (Fig. 3 F) without introducing the nonphysical assumptions of previous models (6,16). Specifically, these models have introduced an offset potential ΔΨ∗ (≈ 91 mV) and flux expressions that appropriate for potential measured relative to this offset potential. These kinetic models of the uniporter were justified based on the explanation that the electrical potential across the uniporter may not fall to zero concomitantly with the bulk membrane potential, perhaps because of fixed charges producing electric field gradients localized to the uniporter. However, such models cannot be reconciled with measurements of bulk Ca2+ movement between the matrix and extra-matrix buffer space. The current biophysical model of the uniporter is able to account for the observed kinetic data based on a mechanistic formulation that is thermodynamically feasible. In doing this the singularity that occurs at ΔΨ = ΔΨ∗ ≈ 91 mV in previous models does not exist in the current model.
The analysis of the two kinetic models of the mitochondrial Ca2+ uniporter developed here shows that for these models to fit the available kinetic data on mitochondrial Ca2+ uptake, the dissociation constants associated with the binding of external and internal Ca2+ to the uniporter in the absence of electric field (i.e., ΔΨ = 0) has to be asymmetric (i.e., and has to be distinct; is found to be an order of magnitude higher than ; Table 1). The estimates of biophysical parameters αe, αx, βe and βx corresponding to the this condition (Case 2; and are distinct) that provide the best fit of the model to the available kinetic data suggest that 1), the charge distribution on the uniporter during Ca2+ binding to the uniporter and Ca2+ translocation via the uniporter is not linearly decreasing along the direction of Ca2+ translocation from outside to inside of the uniporter (since αx is estimated to be negative), and 2), the free-energy barrier that impedes the Ca2+ translocation is not symmetric (since βe ≈ 0.26 and βe ≈ 0.96).
Based on our model analysis of the available kinetic data, we were not able to distinguish between the two related versions of the kinetic model for the uniporter. The available experimental data are mostly initial (or pseudo steady state) Ca2+ influx rates via the uniporter. In these experiments, [Ca2+]x (intra-mitochondrial Ca2+) was typically negligible compared to [Ca2+]e (amount of Ca2+ added to the extra-mitochondrial buffer medium) for various initial Ca2+ influx measurements. As a result, this experimental data was not enough to fully identify the kinetic mechanisms associated with the binding steps of Ca2+ with the uniporter. Since both kinetic models predict all the available experimental data equally well, neither versions of the kinetic model can be excluded.
Our Ca2+ uniporter model simulations show that as the mitochondrial inner membrane depolarizes (i.e., as the membrane potential ΔΨ decreases), the mitochondrial Ca2+ uptake as well as the maximum uptake velocity and saturating Ca2+ concentration decreases. Furthermore, the gradient of the decrease becomes smaller and smaller with each subsequent decrease of the membrane potential ΔΨ, as depicted in Fig. 3, B, D, and F, and Fig. 4, B, D, and F (right panels). This is consistent in part with the experimental observations of Gunter and co-workers (6,18) (Fig. 3 F). As shown by the model simulations in Fig. 4 F, the Ca2+ uptake in cardiac mitochondria saturates beyond [Ca2+]e = 100 μM. Though precise experimental data were not available to validate these simulations, the Ca2+ uptake kinetics are similar to those of the Ca2+ currents observed in the studies of Kirichok et al. (23) using patch-clamp techniques in mitoplasts isolated from cardiac mitochondria. However, their reported value Km = 19 mM is significantly higher compared to the values obtained here (Km < 100 μM for cardiac mitochondria and Km < 50 μM for liver mitochondria). Therefore, we were unable to successfully compare our model simulations to the experimental data of Kirichok et al. (23) relating the Ca2+ current and membrane potential ΔΨ. Using the assumption that the mitochondrial Ca2+ uniporter is a highly selective ion channel permeable only to Ca2+, Jafri and co-workers (21,22) were able to simulate the data of Kirichok et al. (23) using a simple kinetic model of the uniporter based on the Goldman-Hodgkin-Katz equation (reasonable as the Km is very large; Km = 19 mM). Therefore, the Jafri et al. model is able to explain the data of Kirichok et al. from mitoplasts, whereas our model explains the independent data sets of Scarpa et al. and Gunter et al. from intact mitochondria. Neither model can simultaneously explain all of these data sets. Since the Jafri et al. model is developed from data from patch-clamp mitoplasts and our model is developed from data from intact mitochondria, the differences between these models may reflect fundamentally different behavior of the uniporter in the experimental preparations. A comparison between this model and previous models of the uniporter is given in the Supporting Material.
Current knowledge of cardiac myocytes Ca2+ handling suggests the existence of intracellular Ca2+ sub-domains (junctional cleft or sub membrane space, where higher Ca2+ or Na+ concentrations, compared to the average Ca2+ and Na+ levels in the cytoplasm, may develop during the cell excitation) (32). These Ca2+ sub-domains are believed to be essential in some critical aspects of the cell signaling and cell cycling. Consequently, the mitochondrial population situated near these Ca2+ sub-domains is expected to have different behavior (e.g., higher Ca2+ uptake; also possibly increased redox states and increased respiration) compared to a mitochondrial population that is far away from the Ca2+ sub-domains. Therefore, this biophysical model of the mitochondrial Ca2+ uniporter will form the basis for constructing biophysically-based, integrated models of mitochondrial Ca2+ handling and bioenergetics (by integrating the Ca2+ uniporter model to our existing models of mitochondrial tricarboxylic acid cycle, oxidative phosphorylation, cation handling, and electrophysiology (15,33)), which may be helpful in understanding the mechanisms by which Ca2+ plays a role in mediating signaling pathways and modulating mitochondrial energy metabolism, both locally as well as over the whole cell.
To summarize, we have developed a theoretical model for the kinetics of the mitochondrial Ca2+ uniporter based on a six-state catalytic binding and interconversion mechanism (Fig. 1). In this scheme, the unbound uniporter (T) is assumed to have only one conformational state. The fully bound uniporter (T-2Ca2+) is assumed to undergo a conformational change () transporting Ca2+ from the external (cytosolic) side to the internal (matrix) side of the IMM. The model is effective and convenient because it explains the available experimental data on the kinetics of mitochondrial Ca2+ uptake with a minimum number of adjustable parameters. However, alternate kinetic models are possible. Consider, for example, the kinetic mechanism illustrated in Fig. 5 in which the unbound uniporter (T) is assumed to have two conformational states (Tx and Te) depending on the orientation and position of the Ca2+ binding sites on the external or internal sites of the IMM, in addition to the two conformational states of the fully bound uniporter ( and ). The model involves two additional rate constants for this conformational change which depend on the membrane potential ΔΨ depending on the charge on the unbound uniporter (which is not well known). Applying this model will involve a greater number of adjustable parameters than the model presented here.
Figure 5.
Another possible 6-states kinetic mechanism of Ca2+ transport into mitochondria via the Ca2+ uniporter. The unbound uniporter (T) is assumed to have two binding sites for Ca2+ and present in two conformal states (Te and Tx, State 1 and State 2). The binding sites in Te and Tx face to the external and internal sides of the IMM, respectively. The ionized free Ca2+ from the external side of the IMM () cooperatively binds to the unbound uniporter (Te, State 1) in two steps to form the complex (State 5) which then undergoes conformational changes (or flips upside down) to form the complex (State 6). The complex in the internal side of the IMM goes through the reverse process; it dissociates in two steps to form the unbound uniporter (Tx, State 2) and ionized free Ca2+. The unbound uniporter Tx then undergoes conformational changes (or flips upside down) to the original state Te. (K1,e, K1,x) and (K2,e, K2,x) are the two pairs of dissociation (binding) constants for the two step uniporter binding reactions with the external and internal Ca2+. The transport of Ca2+ via the Ca2+ uniporter is limited by the rate constants k1,in, k1,out, k2,in, and k2,out which are dependent on the membrane potential ΔΨ.
Acknowledgments
This research was supported by the grants R01-HL072011 (D.A.B.) from the National Institute of Health and SDG-0735093N (R.K.D.) from the American Heart Association.
Appendix: Glossary of variables
| Variables | Definition | Units | ||
|---|---|---|---|---|
| [Ca2+]e | Extra-mitochondrial concentration of ionized (free) Ca2+ | M | ||
| [Ca2+]x | Intra-mitochondrial concentration of ionized (free) Ca2+ | M | ||
| Dissociation constants of and (1st binding step) and and (2nd binding step) | M | |||
| M | ||||
| M | ||||
| M | ||||
| Changes in Gibb's free-energy for the dissociation of, , , and | kJ/mol | |||
| The corresponding standard changes in Gibb's free energy: | kJ/mol | |||
| Forward and reverse rate constants for the conformational change reaction: | nmol/mg/sec | |||
| Heights of the free-energy barrier for the forward and reverse rate constants:(Fig. 2B) | kJ/mol | |||
| Keq | Equilibrium constant for trans-membrane Ca2+ transport via the Ca2+ uniporter | unitless | ||
| [T] | Concentration of the unbound (free) transporter (Ca2+ uniporter) | M | ||
| [T]tot | Total concentration of the transporter (Ca2+ uniporter) | M | ||
| D, D1, D2 | Binding polynomial for the Ca2+ and Ca2+ uniporter binding (Eq. 5) | unitless | ||
| XUni, JUni | Activity of the Ca2+ uniporter and the corresponding rate of Ca2+ transport via the Ca2+ uniporter: | nmol/mg/sec | ||
| ΔΨ | Electrostatic potential difference across the IMM | mV | ||
| ΔΦ | Nondimensional electrostatic potential difference across the IMM: (where F, R, T, and ZCa are defined in Table 1) | unitless | ||
| αe (αx) | Ratio of the potential difference between Ca2+ bound at the site of uniporter facing the external (internal) side of the IMM and Ca2+ in the bulk phase to the total IMM potential ΔΨ (Fig. 2A) | unitless | ||
| βe (βx) | Displacement of external or internal Ca2+ (State I or State III) from the coordinate of maximum potential barrier (State II) (Fig. 2A) | unitless | ||
Supporting Material
References
- 1.Bernardi P. Mitochondrial transport of cations: channels, exchangers, and permeability transition. Physiol. Rev. 1999;79:1127–1155. doi: 10.1152/physrev.1999.79.4.1127. [DOI] [PubMed] [Google Scholar]
- 2.Brookes P.S., Yoon Y., Robotham J.L., Anders M.W., Sheu S.S. Calcium, ATP, and ROS: a mitochondrial love-hate triangle. Am. J. Physiol. Cell Physiol. 2004;287:C817–C833. doi: 10.1152/ajpcell.00139.2004. [DOI] [PubMed] [Google Scholar]
- 3.Duchen M.R. Contributions of mitochondria to animal physiology: from homeostatic sensor to calcium signalling and cell death. J. Physiol. 1999;516:1–17. doi: 10.1111/j.1469-7793.1999.001aa.x. [DOI] [PMC free article] [PubMed] [Google Scholar]
- 4.Duchen M.R. Mitochondria and Ca2+ in cell physiology and pathophysiology. Cell Calcium. 2000;28:339–348. doi: 10.1054/ceca.2000.0170. [DOI] [PubMed] [Google Scholar]
- 5.Duchen M.R. Mitochondria and calcium: from cell signalling to cell death. J. Physiol. 2000;529:57–68. doi: 10.1111/j.1469-7793.2000.00057.x. [DOI] [PMC free article] [PubMed] [Google Scholar]
- 6.Gunter T.E., Pfeiffer D.R. Mechanisms by which mitochondria transport calcium. Am. J. Physiol. 1990;258:C755–C786. doi: 10.1152/ajpcell.1990.258.5.C755. [DOI] [PubMed] [Google Scholar]
- 7.Gunter T.E., Gunter K.K., Sheu S.S., Gavin C.E. Mitochondrial calcium transport: physiological and pathological relevance. Am. J. Physiol. 1994;267:C313–C339. doi: 10.1152/ajpcell.1994.267.2.C313. [DOI] [PubMed] [Google Scholar]
- 8.O'Rourke B., Cortassa S., Aon M.A. Mitochondrial ion channels: gatekeepers of life and death. Physiology (Bethesda) 2005;20:303–315. doi: 10.1152/physiol.00020.2005. [DOI] [PMC free article] [PubMed] [Google Scholar]
- 9.Crompton M., Sigel E., Salzmann M., Carafoli E. A kinetic study of the energy-linked influx of Ca2+ into heart mitochondria. Eur. J. Biochem. 1976;69:429–434. [Google Scholar]
- 10.Scarpa A., Graziotti P. Mechanisms for intracellular calcium regulation in heart. I. Stopped-flow measurements of Ca2+ uptake by cardiac mitochondria. J. Gen. Physiol. 1973;62:756–772. doi: 10.1085/jgp.62.6.756. [DOI] [PMC free article] [PubMed] [Google Scholar]
- 11.Vinogradov A., Scarpa A. The initial velocities of calcium uptake by rat liver mitochondria. J. Biol. Chem. 1973;248:5527–5531. [PubMed] [Google Scholar]
- 12.McCormack J.G., Browne H.M., Dawes N.J. Studies on mitochondrial Ca2+-transport and matrix Ca2+ using fura-2-loaded rat heart mitochondria. Biochim. Biophys. Acta. 1989;973:420–427. doi: 10.1016/s0005-2728(89)80384-6. [DOI] [PubMed] [Google Scholar]
- 13.Wan B., LaNoue K.F., Cheung J.Y., Scaduto R.C., Jr. Regulation of citric acid cycle by calcium. J. Biol. Chem. 1989;264:13430–13439. [PubMed] [Google Scholar]
- 14.Gursahani H.I., Schaefer S. Acidification reduces mitochondrial calcium uptake in rat cardiac mitochondria. Am. J. Physiol. Heart Circ. Physiol. 2004;287:H2659–H2665. doi: 10.1152/ajpheart.00344.2004. [DOI] [PubMed] [Google Scholar]
- 15.Dash R.K., Beard D.A. Analysis of cardiac mitochondrial Na+/Ca2+ exchanger kinetics with a biophysical model of mitochondrial Ca2+ handling suggests a 3:1 stoichiometry. J. Physiol. 2008;586:3267–3285. doi: 10.1113/jphysiol.2008.151977. [DOI] [PMC free article] [PubMed] [Google Scholar]
- 16.Magnus G., Keizer J. Minimal model of β-cell mitochondrial Ca2+ handling. Am. J. Physiol. 1997;273:C717–C733. doi: 10.1152/ajpcell.1997.273.2.C717. [DOI] [PubMed] [Google Scholar]
- 17.Magnus G., Keizer J. Model of β-cell mitochondrial calcium handling and electrical activity. II. Mitochondrial variables. Am. J. Physiol. 1998;274:C1174–C1184. doi: 10.1152/ajpcell.1998.274.4.C1174. [DOI] [PubMed] [Google Scholar]
- 18.Wingrove D.E., Amatruda J.M., Gunter T.E. Glucagon effects on the membrane potential and calcium uptake rate of rat liver mitochondria. J. Biol. Chem. 1984;259:9390–9394. [PubMed] [Google Scholar]
- 19.Cortassa S., Aon M.A., Marban E., Winslow R.L., O'Rourke B. An integrated model of cardiac mitochondrial energy metabolism and calcium dynamics. Biophys. J. 2003;84:2734–2755. doi: 10.1016/S0006-3495(03)75079-6. [DOI] [PMC free article] [PubMed] [Google Scholar]
- 20.Miyata H., Silverman H.S., Sollott S.J., Lakatta E.G., Stern M.D. Measurement of mitochondrial free Ca2+ concentration in living single rat cardiac myocytes. Am. J. Physiol. 1991;261:H1123–H1134. doi: 10.1152/ajpheart.1991.261.4.H1123. [DOI] [PubMed] [Google Scholar]
- 21.Nguyen M.H., Jafri M.S. Mitochondrial calcium signaling and energy metabolism. Ann. N. Y. Acad. Sci. 2005;1047:127–137. doi: 10.1196/annals.1341.012. [DOI] [PubMed] [Google Scholar]
- 22.Nguyen M.H., Dudycha S.J., Jafri M.S. The effects of Ca2+ on cardiac mitochondrial energy production is modulated by Na+ and H+ dynamics. Am. J. Physiol. Cell Physiol. 2007;292:2004–2020. doi: 10.1152/ajpcell.00271.2006. [DOI] [PubMed] [Google Scholar]
- 23.Kirichok Y., Krapivinsky G., Clapham D.E. The mitochondrial calcium uniporter is a highly selective ion channel. Nature. 2004;427:360–364. doi: 10.1038/nature02246. [DOI] [PubMed] [Google Scholar]
- 24.Fall C.P., Wagner J., Marland E., editors. Computational Cell Biology. Springer; New York: 2002. [Google Scholar]
- 25.Keener J.P., Sneyd J. Springer; New York: 1998. Mathematical Physiology. [Google Scholar]
- 26.Lauger P. Ion transport through pores: a rate-theory analysis. Biochim. Biophys. Acta. 1973;311:423–441. doi: 10.1016/0005-2736(73)90323-4. [DOI] [PubMed] [Google Scholar]
- 27.Lauger P., Neumcke B. Theoretical analysis of ion conductance in lipid bilayer membranes. Membranes. 1973;2:1–59. [PubMed] [Google Scholar]
- 28.Woodbury J.W. Eyring rate theory model of the current-voltage relationship of ion channels in excitable membranes. In: Hirschfelder J., editor. Chemical Dynamics: Papers in Honor of Henry Eyring. John Wiley and Sons Inc.; New York: 1971. [Google Scholar]
- 29.Ussing H.H. Transport of ions across cellular membranes. Physiol. Rev. 1949;29:127–155. doi: 10.1152/physrev.1949.29.2.127. [DOI] [PubMed] [Google Scholar]
- 30.Beard D.A., Qian H. Relationship between thermodynamic driving force and one-way fluxes in reversible processes. PLoS ONE. 2007;2:e144. doi: 10.1371/journal.pone.0000144. [DOI] [PMC free article] [PubMed] [Google Scholar]
- 31.Metelkin E., Goryanin I., Demin O. Mathematical modeling of mitochondrial adenine nucleotide translocase. Biophys. J. 2006;90:423–432. doi: 10.1529/biophysj.105.061986. [DOI] [PMC free article] [PubMed] [Google Scholar]
- 32.Michailova A., McCulloch A. Model study of ATP and ADP buffering, transport of Ca2+ and Mg2+, and regulation of ion pumps in ventricular myocyte. Biophys. J. 2001;81:614–629. doi: 10.1016/S0006-3495(01)75727-X. [DOI] [PMC free article] [PubMed] [Google Scholar]
- 33.Wu F., Yang F., Vinnakota K.C., Beard D.A. Computer modeling of mitochondrial tricarboxylic acid cycle, oxidative phosphorylation, metabolite transport, and electrophysiology. J. Biol. Chem. 2007;282:24525–24537. doi: 10.1074/jbc.M701024200. [DOI] [PubMed] [Google Scholar]
Associated Data
This section collects any data citations, data availability statements, or supplementary materials included in this article.