

Abstract
The mechanical properties of viral shells are crucial for viral assembly and infection. To study their distribution and heterogeneity on the viral surface, we performed atomistic force-probe molecular dynamics simulations of the complete shell of southern bean mosaic virus, a prototypical T = 3 virus, in explicit solvent. The simulation system comprised more than 4,500,000 atoms. To facilitate direct comparison with atomic-force microscopy (AFM) measurements, a Lennard-Jones sphere was used as a model of the AFM tip, and was pushed with different velocities toward the capsid protein at 19 different positions on the viral surface. A detailed picture of the spatial distribution of elastic constants and yielding forces was obtained that can explain corresponding heterogeneities observed in previous AFM experiments. Our simulations reveal three different deformation regimes: a prelinear regime of outer surface atom rearrangements, a linear regime of elastic capsid deformation, and a rearrangement regime that describes irreversible structural changes and the transition from elastic to plastic deformation. For both yielding forces and elastic constants, a logarithmic velocity dependency is evident over nearly two decades, the explanation for which requires including nonequilibrium effects within the established theory of enforced barrier crossing.
Introduction
Viral capsids are self-assembled nanostructures consisting of a protein shell to protect the genetic material inside. The shell geometry, which is usually icosahedral-like for plant and animal viruses, plays an important role in material properties such as elasticity and stiffness (1). The simplest viral shells consist of 20 identical subunit proteins that assemble to an icosahedral shell, with triangulation number T = 1 geometry (2). Because of the capsid's main function as gene carrier, a number of studies have addressed viral shells as bio-nano-containers, e.g., studies of DNA in gene therapy, or of other materials such as drugs to manipulate living cells (3).
One of the major challenges in this approach involves a fundamental understanding of the shell's elastic properties as a prerequisite for use as a template in materials science. Furthermore, the determination of whether, and to what extent, stiffness parameters such as elastic constants and Young's modulus (as well as fracture behavior) vary across the viral surface (4) will be important in understanding the processes of self-assembly, maturation, and infection of cells (5). Viral capsids exhibit a strong robustness, stability, and also high elasticity, which was found to withstand internal pressures of up to 60 atm, caused by DNA inside (6). Although RNA viruses assemble spontaneously in vitro and RNA does not impose such high internal pressures, these capsids are extremely stable and exhibit highly elastic behavior against external forces. The characterization of the elastic properties of these elastic RNA viral shells should also shine a light on the remarkable stability of DNA viral capsids. However, before genetic material is released from the capsid, a transition of the mature viral shell to a structure that can release DNA/RNA occurs, in some cases observed as swelling of the capsid (7). Moreover, the question of how the mechanical properties change for a swollen virus remains unclear, and the answer would help in understanding where the genetic material leaves the capsid during infection.
A new route to probe elastic properties was opened by atomic-force microscopy (AFM) measurements (8). Many different viruses were investigated, such as spherical plant and animal viruses (9–18), retroviruses such as human immunodeficiency virus (HIV) (19), murine leukemia virus (20), and bacteriophages (21,22). For all capsids, the viral shells exhibited highly elastic behavior upon indentation with the AFM tip, whereas the mechanical properties varied markedly between experiments with empty and full capsids. The elastic response of the empty prohead of bacteriophage ϕ29 during nano-indentation with an AFM tip was reported by Ivanovska et al. (21). A linear elastic response was found when the AFM tip was pushed into the capsid. For indentation below 30% of the capsid length, deformation was found to be reversible. Higher indentations caused a fracture of the viral shell, and a rapid force decline was evident. Further, a bimodal distribution of elastic constants was seen, with peaks at 0.18 N/m and 0.3 N/m. The maximum forces before fracture occurred were ∼2.5 nN.
Similar observations were made by Michel et al. (13) in AFM experiments on full and empty cowpea chlorotic mottle virus (CCMV) (16). A bimodal distribution of elastic constants was also observed, with similar values as for ϕ29. Carrasco et al. investigated the mechanical properties of full and empty icosahedral capsids of the DNA minute virus of mice (MVM) via AFM experiments (23). Those authors reported the stiffness of the empty capsid to be isotropic, whereas the presence of DNA inside the virion led to an anisotropic reinforcement of virus stiffness with respect to the twofold, threefold, and fivefold symmetry axes. The elastic constants and maximum forces for empty capsids were reported as 0.15 N/m and 0.60 nN, respectively, and for full capsids as 0.20 N/m and 0.81 nN, respectively, on average.
The origin of this discrepancy between the bimodal distribution of elastic constants of empty CCMV as well as ϕ29, and the single peak seen for empty MVM, is unclear. This discrepancy may reflect inherently different elastic properties of the studies' shells. Because of their similar architecture, however, other explanations seem more likely. For example, because in an AFM experiment the exact contact is difficult to determine, different elastic constant histograms may result. Moreover, because the typical size of the AFM tip does not allow probing of the mechanical properties of the capsid at atomic resolution, the measured histograms will also depend on the size and shape of the particular tip. A near atomistically sharp tip would alleviate this problem (1).
Theoretical studies are therefore required to complement AFM experiments, and in particular to address the following questions: How do mechanical properties vary between full and empty capsids, and what are the structural determinants? How and why do mechanical properties differ along the twofold, threefold, and fivefold axes for icosahedral viral shells? What is the role of mechanical properties during cell infection, and is there a “gate” that can open to release genetic material? Using elastic network normal mode analysis, Tama and Brooks (24) suggested that pentamers are more flexible and show enhanced internal motions compared with hexamers. In contrast, Hespenheide et al. (25) proposed a larger stiffness of pentamers compared with hexamers from percolation rigidity calculations. Similar results were obtained by Zandi and Reguera (26), who determined local stresses and pressures from continuum modeling calculations.
Recent continuum modeling studies (27,28), as well as coarse-grained modeling (29), investigated the buckling of viral capsids under applied forces. All these theoretical approaches rely on the salient assumption that atomic detail can be neglected in the attempt to quantify and explain the mechanical properties of viral shells. However, because the reaction of many proteins upon mechanical stress depends critically on atomic detail (30), and can be drastically altered, e.g., by single-point mutations (31), this assumption is questionable. Unfortunately, the sheer size of viral capsids has so far prevented molecular dynamics simulations from going beyond equilibrium studies (32), and from addressing the above questions at the atomic level.
We focus on the elastic properties of the RNA plant virus southern bean mosaic virus (SBMV), which is a typical representative of icosahedral viruses with T = 3 geometry (33,34) (Fig. 1 A). The capsid contains 180 copies of a 226-residue protein. Three of the proteins form an asymmetric subunit, whereas 60 subunits build up to the complete structure. Three calcium ions are placed between the proteins of a subunit to stabilize the structure (35–39). The subunits in turn are organized into two different structural units (capsomers), i.e., pentamers and hexamers. For T = 3 viruses, there are 12 pentamers, each surrounded by one of 20 hexamers. The fivefold symmetry axis passes through the center of the pentamers, and the threefold symmetry axis through the center of the hexamers.
Figure 1.
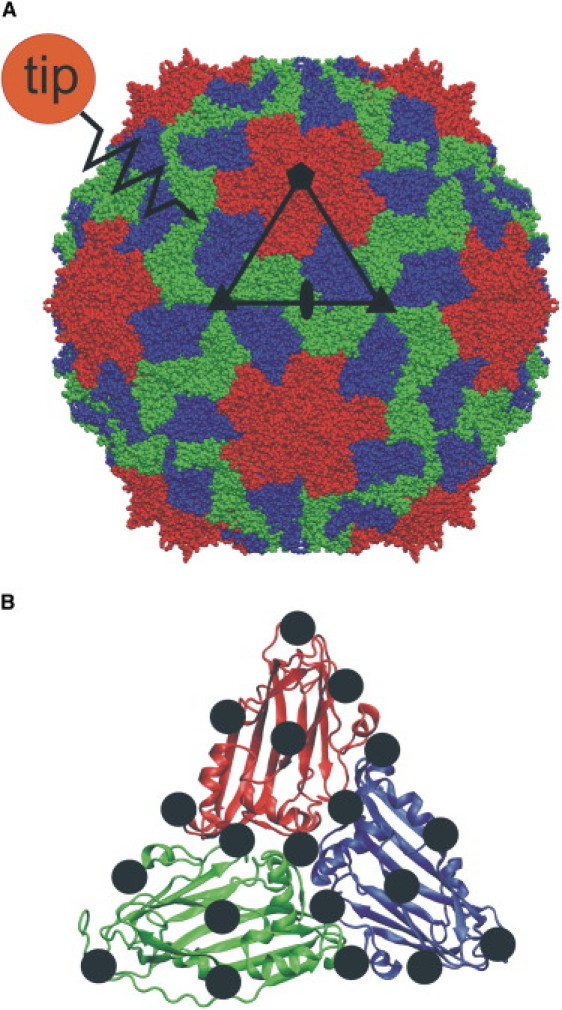
(A) Southern bean mosaic virus is built up from 60 subunits, each composed of protein A (red), protein B (blue), and protein C (green). Black symbols denote fivefold, threefold, and twofold symmetry axes. Triangle (black outline) marks one subunit. The approaching tip-sphere (orange) is located close to the surface, and is attached to a “virtual” spring that pushes the tip-sphere against the viral shell. (B) One of 60 subunits. In each force-probe simulation run, the tip-sphere is pushed with constant velocity against one of 19 grid points (black spheres).
We performed all-atom nonequilibrium force-probe molecular dynamics (FPMD) simulations (30,40,41) of the complete shell of SBMV fully solvated in water. With a radius of r ≈ 18 nm, this virus is relatively small compared with other icosahedral RNA viruses, which rendered our extended molecular dynamics (MD) simulations feasible. In our simulations, a simple model for the AFM tip was pushed with different velocities and at various positions toward and into the surface of the viral capsid. In total, the simulation system contained more than 4,500,000 particles, and is, to our best knowledge, one of the largest biomolecular systems simulated so far.
Methods
System setup and molecular dynamics simulations
The x-ray structure of the SBMV capsid (42,43), including 180 calcium ions, was taken from the Protein Data Bank (code 4sbv) and VIPER databank (44,45). To set up the simulation system, we used the GROMACS-3.3.1 simulation software package (46) with the TIP4P water model (47). After adding hydrogen atoms to the crystal structure of the protein with the GROMACS tool pdb2gmx, the viral capsid was solvated in a rhombic dodecahedral box of 366 × 366 × 372 Å3, with box vector angles of 60° × 60° × 90°. In total, 2576 sodium ions and 2936 chloride ions were added, corresponding to a 150 mM physiological ion concentration. The simulation system contained 564,000 protein atoms, including 180 Ca2+ ions, and ∼1,000,000 water molecules, totaling 4.5 million particles.
Molecular dynamics simulations were performed with GROMACS-3.3.1, using the OPLS-AA force field (48). The protein and the solute were separately coupled to an external temperature bath (49), with coupling times τT as defined below. An isotropic Berendsen barostat with τp = 1.0 ps and a compressibility of 4.5 × 10⁻⁵ bar−1 was used to keep the pressure at 1.0 bar (49). Lennard-Jones and van der Waals interactions were explicitly calculated within a cutoff distance of 0.9 nm, and long-range electrostatic interactions were calculated using the particle-mesh Ewald method (50), with a grid spacing of 0.12 nm.
The system was energy-minimized with a 300-step steepest decent algorithm. Subsequently, the system was equilibrated by MD runs at 10 K and 300 K as follows. First, the system was coupled to a heat bath at τT = 0.001 ps, with no pressure coupling applied. A 50-ps MD simulation was performed, with integration time steps of 0.5 fs and harmonically constrained heavy protein atoms with a force constant of k = 1000 kJ mol−1. For the subsequent 100-ps simulation, the constraints were released, and further 100-ps simulations were performed with integration steps of Δt = 1.0 fs, and all bonds were constrained using the LINCS algorithm (51) and a weaker temperature coupling of τT = 0.01 ps. Integration steps of 2.0 fs were used for further 200 ps at τT = 0.1 ps and a pressure coupling at 1.0 bar, τp = 1.0 ps. Finally, the simulation system was heated up to 300 K at a heating rate of 1 K/ps and subsequently equilibrated for 13 ns in total. During all simulations, the root mean-square deviation (RMSD) from the x-ray structure of the viral shell was monitored, as was its radius of gyration.
Force-probe MD simulations
All FPMD simulations were run on an NPT ensemble with τT = 0.1 ps and τp = 1.0 ps. In contrast to the equilibration runs, FPMD simulations were performed with the GROMACS 4.0 CVS version of July 4, 2007 (52,53) for efficiently reasons. As a simple model of the AFM tip, a Lennard-Jones sphere (Lennard-Jones parameter σ = 5.0 nm and ɛ = 0.001 kJ/mol) was used. This “tip-sphere” was subjected to an isotropic harmonic potential:
| (1) |
the minimum of which was moved at a constant velocity v in a direction perpendicular to the surface of the viral shell (Fig. 1 A). Here, k = 1000 kJ/(mol nm2) is the spring constant, x is the current position of the tip-sphere, and x0 is its initial position.
To obtain an “elasticity map” of the viral surface, 19 simulations were performed, each with the “tip” directed and moving toward a different grid point on the capsid surface (Fig. 1 B). The grid points were evenly distributed on the triangular surface of subunit 12 (one of 60 identical subunits). In all cases, the center of mass of the protein was kept in place during the simulation, to prevent any drift of the viral shell.
The instantaneous force acting on the shell was calculated from the force Ftip acting on the tip-sphere using Hooke's law:
| (2) |
All force-probe simulations were performed with two different probe velocities of the tip-sphere, 0.05 nm/ps and 0.01 nm/ps. To study the variation of forces with probe velocity in more detail, a series of simulations along the fivefold symmetry axis toward the center of a pentamer was performed with nine different probe velocities, ranging from 0.001 nm/ps to 0.05 nm/ps. For each simulation, the velocity vector was chosen to be perpendicular to the tangent through the grid point toward which the tip-sphere was pushed. To rule out anecdotal events, all force-probe simulations were performed at least twice. The first series of force-probe simulations commenced in structures extracted after 12 ns of the equilibration run, and the second series in structures taken after 13 ns. A total of 76 indentation simulations for each probe velocity (0.01 nm/ps and 0.05 nm/ps) was performed. To study the relaxation behavior of the capsid, the pushing potential acting upon the tip-sphere was switched off at different times in a number of selected simulations.
All FPMD simulations were performed on 32 or 64 processors of an SGI Altix 4700 cluster. We used a total of more than 800,000 CPU hours of computation time.
Analysis
Elastic constants from capsid indentation were calculated from the linear regime in the force-distance plot, using linear regression (Fig. 2 A). The start and endpoints of linear regimes were determined manually. Yielding forces were obtained from the maximum force in each force-distance plot.
Figure 2.

(A) Force actings on tip-sphere as a function of time (blue) and distance (red) during typical force-probe simulation in which tip-sphere was pushed against protein A of SU 12 at a probe-velocity of 0.01 nm/ps. Three regimes can be distinguished: 1), a prelinear regime; 2), a linear regime; and 3), a rearrangement regime. Black line depicts slope in the force-distance plot from which the elastic constant (in N/m) is determined. (B) Sketch of SU 12 (yellow) and adjacent subunits (white). Black dots mark grid points at which elastic properties were determined by force-probe simulations in which the tip-sphere was pushed at a probe velocity of 0.01 nm/ps against the capsid. The obtained elastic constants are shown in red, green, and blue; different colors of numbers denote different push-vector directions perpendicular to the viral surface. (C) Color-coded distribution of elastic constants on the viral shell, obtained from values in B (soft, blue; stiff, red). (D) Zoom to subunit 12, with color-coding as described in C. (E) Histogram of elastic constants obtained from 38 FP simulations toward 19 grid points shown in B, at probe-velocity of 0.01 nm/ps.
For a graphic representation of the distribution of elastic constants and yielding forces on the surface of the viral shell and subunit, the elastic constants and yielding forces, respectively, of the 19 chosen grid points were used, and the respective values were interpolated at the position of all atoms of the subunit, using Gaussian functions. Accordingly, the elastic values K′j for atom j at position xj were calculated as
| (3) |
with a Gaussian width of σ = 0.8 nm, chosen to interpolate optimally between the distances of the 19 grid points. Here Ki is the elastic value of one of the 19 grid points.
Results and Discussion
Equilibration
During the 13 ns equilibration phase, the RMSD and the radius of gyration of the viral shell were recorded and compared with the initial x-ray structure. The RMSD rose from 1.96 Å at 1.0 ns to 2.50 Å at 10 ns, and subsequently remained stable at 2.62 Å after 12 ns, such that we consider the system sufficiently equilibrated after 13 ns for the mechanical properties under consideration. The radius of gyration remained constant at 131.5 ± 0.5 Å, the value of the x-ray structure. All Ca2+ ions remained at their original positions.
While the force-probe simulations were being performed, we additionally equilibrated the system for 6.5 ns, totaling 19.5 ns. The RMSD remained stable and did not increase (see the Supporting Material). Some extra force-probe simulations were performed after 19.5 ns of equilibration. Comparison of the force-probe simulations started from structures extracted after 13 ns and 19.5 ns of equilibration revealed no significant differences in mechanical properties. Values obtained after 19.5 ns were within the errors of values obtained after 13 ns of equilibration (see below).
Regimes of deformation
To study the spatial distribution of elastic properties, we chose a grid of 19 evenly distributed points on the triangular surface of subunit (SU) 12, which covered the complete subunit and the directions along the fivefold, threefold, and twofold symmetry axes. To facilitate comparisons with AFM experiments, the tip-sphere was pushed toward each grid point, for a total of 76 simulations: two for every point at probe velocities of 0.01 nm/ps, and two at 0.05 nm/ps. In contrast to the AFM experiments, the tip-sphere could be positioned precisely, such that high spatial resolution of the mechanical properties of the capsid was achieved.
In each of the 76 FPMD simulations, the tip-sphere was first located close to the viral surface, and then pushed through the water layer and against the capsid. Fig. 2 A shows a typical force-distance (red) and corresponding force-time curve (blue), taken from a simulation in which the tip-sphere was pushed toward the center of mass of protein A of SU 12 at a probe velocity of 0.01 nm/ps. At the beginning of the simulation, the tip-sphere moved through the water for 120 ps before it touched the capsid, at which point the force increased. As shown in Fig. 2 A, three regimes can be distinguished: prelinear (1), linear (2), and rearrangement regime (3).
The prelinear regime is characterized by small forces, heterogeneously distributed over the surface. These forces originate from local deformations of an outer capsid layer consisting mainly of loops and β-strands. When the tip-sphere initially touched the capsid, the first layer was pushed toward the viral center, thereby approaching underlying layers. The subsequent contact between the two layers marks the transition from the prelinear (1) to the linear regime (2). The linear regime is characterized by elastic deformation of the viral shell. The slope in the force-distance curve determines the elastic constant of the capsid at its respective position. After ∼390 ps, the force bended over to a nonlinear behavior, and finally leveled off at 560 ps at a yielding force of Fmax = 3310 pN. Subsequently, the tip-sphere was pushed inside the virus and left the shell, resulting in a rapid force decline. Remarkably, substantially increased fluctuations were evident in the rearrangement regime, which, together with mechanical properties, will be analyzed in structural terms below.
These three regimes were observed for all 19 grid points. Because of the heterogeneity of the protein structure and its outer layer, the prelinear regime was less pronounced, e.g., for the grid point between proteins B and C of SU 12. Further, in several cases, the length of the rearrangement regime was much shorter than shown in Fig. 2 A, e.g., only a few picoseconds, as with an approach along the fivefold symmetry axis.
Distribution of elastic constants
Based on the 38 simulations at a probe velocity of 0.01 nm/ps toward the 19 evenly distributed grid points on subunit 12, the distribution of elastic constants was obtained (Fig. 2, B–D). The dots mark the grid points toward which the tip-sphere was directed. The distribution of elastic constants was quite heterogeneous. The largest elastic constant (4.33 N/m) was found at the fivefold symmetry axis toward the center of the pentamer, followed by the two threefold symmetry axes (centers of hexamers) (3.42 N/m and 3.53 N/m, respectively). With regard to the question of whether pentamers or hexamers are more stable, our results show a significantly higher stiffness for pentamers.
The weakest point was found at the center of the subunit (quasi-threefold axis) with an elastic constant of 1.82 N/m, where the three proteins of the subunit met, followed by the elastic constant along the twofold symmetry axis (1.89 N/m). Interestingly, the elastic response for pushing the tip-sphere toward the interface of SUs 12 and 11, as well as the interface of SUs 12 and 28, was consistently larger at the grid points where the A-proteins met (2.46 N/m and 2.61 N/m) than between proteins B and C (2.17 N/m and 2.28 N/m, respectively).
Two effects may contribute to this mechanical asymmetry. First, compared with the grid point at the subunit interface between proteins B and C, the grid point between A-proteins is closer to the center of the pentamer that exhibits the highest elastic constant, which might influence the respective stiffnesses. Second, the interaction between proteins B and C might be weaker than those between the A-proteins, which could give rise to differing mechanical properties.
Next, we focus on the force-probe simulations in which the tip-sphere was pushed toward the three proteins inside SU 12. All resulting elastic constants were found to be in the range of 2.29–2.45 N/m, also at the interfaces of SU proteins A, B, and C. The β-sheet regions proved to be particularly stiff compared with those containing α-helices and loops. As an estimate for the standard deviation of the elastic constants, the 19 differences from the respective mean values were calculated and found to be in a range between 0.1–0.3 N/m.
Distribution of yielding forces
In addition to the elastic constants, we also determined the yielding forces Fmax for the 38 force-probe simulations toward the same 19 grid points of SBMV with a probe velocity of 0.01 nm/ps (Fig. 3). The distribution of Fmax was more homogeneous than that of the elastic constants, with Fmax varying between 2.16–3.80 nN. Unlike the elastic constants, where the largest values were found at the pentamer and hexamer centers, the largest yielding forces were seen at the interfaces between SUs 12-11 and SUs 12-28. Here Fmax varied between 3.27–3.80 nN, whereas the yielding force was smaller at the interface of SUs 12-3 (2.75 nN and 2.79 nN) and along the twofold symmetry axis (2.68 nN). At the center of the pentamer, we determined a yielding force of 2.96 nN, and of 3.36 nN and 3.40 nN, respectively, for the two hexamer centers. The distribution of yielding forces at the interfaces of SUs 12-11 and SUs 12-28 was similar to that of the elastic constants, which also showed greater Fmax at the interface of A-proteins than for the B-C intersection. Within the subunit, Fmax varied between 2.99 nN and 3.31 nN, with the only exception at the subunit center, which exhibited the lowest yielding force (2.16 nN). The estimated standard deviation was in a range of 0.1–0.3 nN.
Figure 3.

Obtained yielding forces (in nN) shown as in Fig. 2, B and D (low stability, blue; high stability, red).
Water permeation, friction, and surface effects
During the equilibration phase and also during force-probe simulations, no water permeated the capsid. This observation is in accordance with the results of Silva et al. (54), who reported a high energy barrier of E = 300 kcal/mol for water at the gate along the fivefold symmetry axis. No other position on the protein shell exhibited a gate for possible water or ion permeation, which is in good agreement with the lack of water flux in our simulations. The resulting compression of water volume inside the capsid during indentation raises a question, however, of the extent to which the observed forces actually reflect the mechanical properties of the shell. To address this question, we estimated the force arising from water compression. When the shell was indented by the tip-sphere, an area the size of a subunit (A ≈ 42 nm2) was pushed into the capsid, and reduced the inner virus volume by ∼3.5 nm3. Assuming a compressibility of TIP4P water of κ = 67 × 10−11bar−1 (55), the inner capsid pressure rose from 1 bar to p ∼5.43 bar, resulting in a force F = p × A = 22.8 pN (∼1% of the yielding force). Therefore, water compression is not expected to affect the observed forces.
Because of the relatively high probe velocity (compared with those of typical AFM experiments) that was necessary to use in our simulations, frictional forces may contribute to the observed force-time and force-distance curves. To separate these frictional forces from the mechanical properties of interest, we performed six force-probe simulations in which the tip-sphere was pushed through bulk water with probe velocities between 0.0001–0.05 nm/ps. As expected from the Stokes equation, a linear increase of the observed frictional force with probe velocity was evident. The resulting slope of 5.63 ± 0.14 nN s/m was somewhat smaller than the value from the Stokes equation, ξ = 6πηr = 6.59 nN s/m, for TIP4P water (56), assuming stick-boundary conditions between solvent and tip-sphere (57). The deviation occurred via the Stokes radius that was determined as the minimum distance (0.70 nm, according to a radial distribution function) between the tip-sphere center and the water molecules. For an applied probe velocity of 0.01 nm/ps, the frictional force in the simulation (Fsim = 65.2 ± 1.5 pN) agrees very well with the force calculated from the Stokes equation (FStoke = 65.9 pN). We note that stick-boundary conditions were used rather than the slip-boundary condition (58) (here the Stokes equation changes to ξ = 4πηr), because the latter was shown to apply only to solutes much larger than the tip-sphere used here (58). In summary, the obtained frictional forces are small with respect to the observed elastic forces. In particular, we consider our probe velocity slow enough that friction can be neglected.
To study to what extent the free energy increases because of a possible increase of the solvent-accessible hydrophobic area (SAS) and contributes to the observed force increase during indentation, this surface area was recorded during force-probe simulations. During deformation of the capsid in the prelinear, linear, and rearrangement regimes up to 480 ps, the capsid SAS area for the hydrophobic and hydrophilic parts remained constant within fluctuations of ΔA = 2.0 nm2. Subsequently, when the force fluctuations in the force-distance plot increased markedly (Fig. 2 A), the SAS area increased by ∼ΔA = 7.0 nm2 up to the point of yielding (480–560 ps). Assuming proportionality between the SAS area and the surface free-energy ΔG with a proportionality constant of 24 cal/mol · Å2 (59,60), we determined the respective free-energy increase and resultant forces F along the indentation path length Δx needed to change the hydrophobic surface area. For ΔA = 2 nm2, a surface free energy of about ΔG = 3.3 × 10⁻²⁰ J was found, resulting in a force of ΔG/Δx = F ≈ 22 pN with Δx = 1.5 nm (Fig. 2 A, blue curve), i.e., 33% of the frictional forces. Upon yielding, the surface free energy increased to ΔG = 11.7 × 10⁻²⁰ J, and the resultant force to F ≈ 150 pN (Δx = 0.8 nm), i.e., <10% of the yielding force.
Structural characterization of deformation
To characterize the deformation of the viral shell during the simulation and explain its mechanical behavior in the rearrangement regime, we chose the FPMD simulations through the center of mass (COM) of protein A, SU 12, at a probe velocity 0.01 nm/ps. We first calculated the distance between the COM of SU 12 and the center of the viral shell. During deformation, the subunit was pushed toward the center of the capsid by 0.45 nm. Subsequently, the tip-sphere penetrated the protein, and the subunit snapped back to its initial position. Moreover, the RMSD of SU 12, with respect to the initial structure, increased to 1.4 nm at 560 ps (yielding point), and subsequently dropped to nearly its initial value after the tip-sphere left the viral shell in the direction of the capsid center, suggesting that, except for the few residues discussed below, the capsid fully recovered its original shape after penetration. Thus SU 12 seems to be highly elastic during the complete deformation phase, even within what we termed the “rearrangement regime.” Although at this point the origins of the nonlinearity and of the increased fluctuations in the force-distance curve remain elusive, the above result suggests that any nonelastic behavior will be restricted to a small regime of the subunit.
Next, we analyzed the propagation of protein deformation by monitoring the RMSD of SUs 11, 28, and 3, which are adjacent to SU 12 (Fig. 2 C). In contrast to the marked deformation of SU 12, its neighbors deformed only slightly, with the RMSD rising by only 0.25 nm at 560 ps, and immediately returning to its initial value. The RMSD of SU 3 did not change at all beyond thermal fluctuations (≈1.0 Å). We conclude that elastic deformation while pushing the tip-sphere toward SU 12 is spatially restricted to the SU 12 region, and hardly affects the remaining viral shell.
To characterize the deformation on the atomic level, we determined the RMSD of every residue (amino acid) of SU 12, fitted on the starting structure of the whole capsid. The maximum value of the RMSD of every residue was then plotted as a function of residue number. As seen in Fig. 4, the average maximum RMSD for protein B and C residues is ∼0.5 nm because the subunit was pressed toward the viral center by 0.45 nm, as mentioned above. The average maximum RMSD of protein A is doubled compared with proteins B and C, whereas only residues 33 and 51 exhibited a maximum RMSD of more than 2.2 nm. Compared with the RMSD calculated for the complete SU 12 mentioned above, we suggest that the subunit RMSD of 1.4 nm was induced by deformation of only a few residues of protein A, which were directly touched or close to the tip-sphere in the simulation.
Figure 4.

Largest RMSD for each residue of proteins A (red), B (green), and C (blue) during simulation in which tip-sphere was moved through center of protein A. Two largest peaks are identified by residue numbers.
We made the same observations when the tip-sphere was pushed along the fivefold symmetry axis through the center of the pentamer. Here, the RMSD of residues close to the pentamer center showed a high deviation from their initial position, whereas the overall pentamer structure remained stable during the simulation and did not deform.
Crossover from elastic to plastic behavior
To address the nature of the deviation from linear to nonlinear behavior within the rearrangement regime, we stopped several force-probe simulations at different simulation times ranging between 400–600 ps, and subsequently let each of these systems relax for 0.5 ns. In particular, we wanted to test if and when plastic deformation of the few more strongly deformed residues identified above would set in. The tip-sphere was kept inside the simulation cell during relaxation, although the external force on the tip-sphere was switched off. To characterize the deformation of selected residues, Fig. 5 depicts the RMSD of the two residues, 31 and 33 (large values in Fig. 4; see also Fig. 7), fitted on the starting structure of the capsid.
Figure 5.

RMSD (black curve) of residues 31 (A) and 33 (B) of protein A, SU 12. The FPMD simulation was stopped at different times (A and B, upper left) and restarted with unrestrained tip-sphere. For subsequent relaxation processes, the RMSDs of two residues are shown in color. For residue 31, plastic deformation began at 560 ps, as obtained from increasing RMSD during relaxation of the system. Residue 33 already behaved plastically at 550 ps.
Figure 7.

Detail of protein A, SU 12 before deformation (top) and during deformation with tip-sphere (green) at the yielding point (560 ps, bottom). Relevant residues (Res) are shown as sticks. The α-helix (orange ribbon, residues 39–42) is stretched, together with residues 31–34. The plastic deformation of residue 33 is characterized by an isomerization of the aromatic ring.
The relaxation RMSD curves fall into two groups. When the force-probe simulation was stopped at 550 ps or earlier, the deformation of residues 31 and 33 was fully reversible and therefore elastic. In contrast, for switch-off times of 560 ps or later, the RMSD dropped only partially, and did not return to its original value, at least within the 0.5 ns equilibration phase, suggesting a plastic deformation of residue 31. A similar behavior was evident for residue 33, except that plastic behavior was already observed at 550 ps. Therefore, fully elastic behavior at the single-residue level is found not only for the linear regime, but also essentially for the whole rearrangement regime.
To address further the apparent differences between the two regimes and in particular the origin of the larger force fluctuations and sublinear behavior observed for the rearrangement regime, Fig. 6, A and B, shows the distances between the COMs of residues 51 and 33 with their respective neighbors during deformation. Within the linear regime, the distances between the nearest neighbors (residues 50–51 and 51–52, and 32–33 and 33–34) and next nearest neighbors (residues 49–51 and 51–53, and 31–33 and 31–34) remain constant within the range of thermal fluctuations (<0.5 Å). Here, in line with the collective elastic movement of the complete subunit observed above, the elastic deformation of residues can be described as a displacement of the complete protein structure, whereas the overall shape and especially the residue distances are retained.
Figure 6.
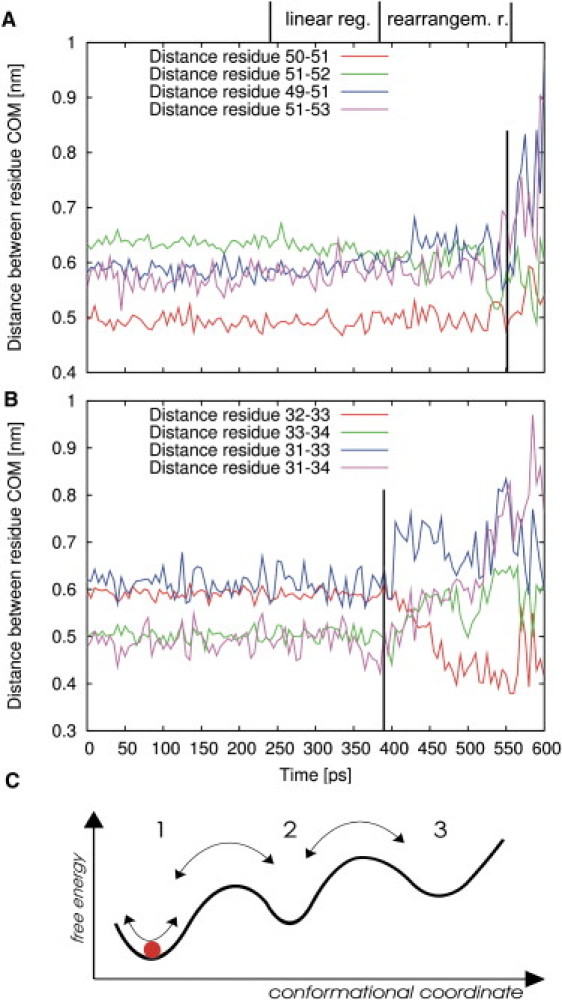
Distances between center of mass (COM) of residue 51 (A) and residue 33 (B) to adjacent residues during deformation. Black vertical lines denote yielding point (A) and transition from linear to rearrangement regime (B). (C) Simplified free-energy landscape can explain large distance fluctuations apparent in Fig. 2A within the rearrangement regime (rearrangem. r.), while the system can still relax quickly into its initial state. Small fluctuations in linear regime (linear reg.) reflect motions within minimum 1 (red disk). Large fluctuations arise from transitions between several distinct minima (arrows).
The distances between residue 51, an amino acid of the β-sheet region located behind residue 33 (Figs. 4 and 7), and its neighbors were conserved for ∼550 ps (Fig. 6 A). Only for later times, when yielding occurred around 550 ps, did the distances deviate, whereas the changes in next-nearest-neighbor distances dominated residues 49 and 51, for instance (Fig. 6 A, blue line). We suggest that the observed stiffness is characterized by a conservation of the shape of the β-sheet region during deformation. Based on these observations, the crossover from elastic to plastic behavior is described by a change in residue neighbor distances. However, this result alone does not reveal the underlying mechanism of the rearrangement regime. To address this issue, we now focus on residue 33 and its neighbor distances as a function of time (Fig. 6 B).
Interestingly, abrupt distance changes and fluctuations are already starting at the transition to the nonlinear behavior of the rearrangement regime. Here, these changes in neighbor distances describe markedly increased fluctuations of single atoms that were close to the tip-sphere during simulations. Because of the interaction with the tip-sphere, these fluctuations translate into similarly increased force fluctuations in the force-distance curve (Fig. 2 A), although the deformation of residues was still reversible.
We rationalize these findings according to the simplified free-energy landscape sketched in Fig. 6 C. For the whole linear regime, the system is confined to a local minimum of the underlying free-energy landscape (Fig. 6 C, minimum 1), giving rise to a nearly linear force response. For further deformation, at the transition to the rearrangement regime, the deformation energy is large enough for the system to overcome the barrier to new local minima (Fig. 6 C, minima 2 and 3). Because the energy of these new minima is greater than that of the initial minimum, and because thermal energy suffices to drive recrossings, frequent transitions between minima result. As one of several possibilities, in this simple picture, the frequent transitions describe the origin of the elasticity as well as the larger fluctuations in the rearrangement regime. In particular, elastic deformation is described in terms of relaxation of the system to the initial minimum when external forces are switched off. This model can describe plastic deformations as well. In this case, the return of the system to the original state is hampered by large energy barriers between minima.
The crossover from elastic to plastic deformation of residues 31 and 33 was evident when the distances between residues 32 and 33 decreased from 0.6 nm to 0.4 nm, whereas the next nearest neighbor distances of residues 31 and 33 increased from 0.6 nm to 0.8 nm, and those between residues 31 and 35 increased from 0.5 nm to 0.8 nm (Fig. 6 B).
This shift in distances can be observed for several residues, e.g., for residues 39–42, which form an α-helix (Fig. 7). A widening of the helix within <20 ps defined the plastic yielding of the single-helix residues, whereas the plastic deformation of residue 33 was determined by an isomerization of the aromatic ring at 560 ps.
In summary, the rearrangement regime is characterized by a marked intramolecular structural change. The transition from elastic to plastic deformation occurs near the yielding point. We suggest that larger force fluctuations in the force-distance plot, compared with the linear regime, are caused by a change from (nearly) harmonic dynamics to highly nonlinear conformational transitions between multiple free-energy minima.
Influence of probe velocity
To study if and how the observed mechanical properties of the viral shell depend on probe velocity, all FPMD simulations were repeated with identical parameters, but with a five times greater probe velocity of 0.05 nm/ps. A distribution of elastic constants similar to those of the 0.01 nm/ps simulations shown above was seen, with individual values consistently increased by ∼14%. The only exceptions involved the elastic constants pushing toward the center of SU 12, which exhibited a larger increase from 2.16 N/m to 2.85 N/m, and the twofold axis, where the value increased from 1.89 N/m to 3.23 N/m. We attribute this strong velocity dependency to the particularly large flexibility observed for residues at the subunit center and the twofold symmetry axis, which was mostly reduced at larger probe velocities. Moreover, the yielding forces showed a consistent increase by ∼33% for larger probe velocities, whereas the overall distribution of Fmax remained constant.
To characterize more quantitatively the dependence of mechanical properties on the probe velocity of the tip-sphere, force-probe simulations toward the center of the pentamers along the fivefold symmetry axis were performed with nine different probe velocities between 0.001–0.05 nm/ps. For each of the nine velocities, five simulations were performed and averaged (Fig. 8).
Figure 8.

Yielding forces (A) and elastic constants (B) for different probe velocities, where tip-sphere was directed toward the center of the pentamer along the fivefold symmetry axis. Dots and error bars denote averages and errors estimated from variances from five simulations each. Logarithmic fits, , are shown as lines. (Insets) Same data on a logarithmic velocity scale.
The yielding forces depended logarithmically on probe velocity over nearly two decades (Fig. 8 A). This observation is supported by the good agreement with the logarithmic fit (Fig. 8 A, solid line), as well as by the same data on a logarithmic velocity scale (Fig. 8 A, inset). Such logarithmic behavior is well-known, and was observed previously in many macromolecular systems, such as ligand unbinding (61) or protein unfolding (31,62). This behavior is most easily described by activated barrier-crossing according to Kramers theory (63), or by more refined theories (64–68). All these treatments rely on the Kramers assumption that all degrees of freedom perpendicular to the reaction coordinate are at or close to equilibrium during (nonequilibrium) unbinding, unfolding, or deformation process, i.e., that this process is governed by an underlying time-independent one-dimensional free-energy landscape. One prediction of this treatment is that the variation of yielding force with probe velocity is attributable to the variation of the point where thermal activation causes rupture with probe velocity. A second property is that, because of the unchanged energy landscape, the initial response of the system at low forces is independent of probe velocity (and is possibly affected only by frictional forces, which typically show a linear dependency).
For the case at hand, this initial response was probed by the elastic constants (Fig. 8 B). However, those constants show a clear logarithmic behavior, contrary to the above expectations. Further, the indentation point where fracture occurs does not markedly vary with probe velocity. Apparently, simple Kramers-like models are incompatible with our results.
These discrepancies force us to extend the theory of enforced barrier crossing. Particularly striking here is the very similar rate dependency of yielding forces and elastic constants, which suggests a common cause.
We therefore tentatively attribute this behavior to the slow relaxation effects of degrees of freedom perpendicular to the reaction coordinate. Because the linear (elastic) response of applied force in the force-time and force-distance curves (Fig. 2 A) implies that the overall shape of the underlying energy landscape is close to harmonic in the vicinity of the minimum, we suggest that relaxation motions, e.g., within or between amino acids in contact with the tip-sphere, imply a time-dependence of the effective free-energy landscape governing the forces that act on the tip-sphere. As a result, the height of the barrier opposing penetration is assumed to decrease gradually in the process, which, generalizing Bell's theory (63), translates into the observed rate dependency. Accordingly, for slower probe velocities, the barrier height is lowered to a larger extent, whereas its position remains stable. Because a similar effect can be expected for the curvature of the minimum such that it scales synchronously to the barrier height, the common behavior of the elastic constant and the yielding force follows as a natural consequence from our theory. A detailed picture will be described elsewhere.
If the proposed relaxations actually occur, they should also be visible in the dynamics of the capsid close to the tip-sphere during indentation. In particular, for slower probe velocities and the associated larger timescales, the relaxation process will follow the perturbation induced by the tip-sphere to a larger extent. Accordingly, larger structural rearrangements are expected. We therefore calculated the RMSD of residues close to the fivefold symmetry axis during deformation with respect to the initial structure of the capsid. An increasing RMSD for decreasing probe velocity was evident (data not shown), corroborating our model as a valid description of the observed logarithmic behavior of both yielding forces and elastic constants.
Influence of tip-sphere size
To study if the mechanical properties depend on the choice of tip-sphere size, FPMD simulations with a larger tip-sphere were performed. In these simulations, the tip-sphere was pushed toward the center of the pentamer along the fivefold symmetry axis at a probe velocity of 0.01 nm/ps and with an increased Lennard-Jones parameter for the van der Waals radius of the tip-sphere, σ = 10.0 nm. Subsequently, elastic constants and yielding forces were compared with previous results obtained for σ = 5.0 nm.
For the larger tip-sphere, an elastic constant of 4.3 N/m was obtained, i.e., the same within the error bars as the value obtained above for a smaller tip-sphere. In contrast, a markedly larger yielding force of 4.8 nN was evident, compared with 3.0 nN for the smaller tip-sphere. This result is not unexpected because, as was seen in the simulations (data not shown), the regime of elastic deformation is roughly the size of one pentamer (∼14 nm in diameter), and is thus much larger than the two tip-spheres used. Therefore, elastic behavior does not depend on tip-sphere size as long as the tip-sphere diameter is much smaller than the size of the subunit. In contrast, the regime that undergoes more severe plastic deformation grows with the size of the penetrating tip-sphere, such that the yielding forces increase accordingly.
Conclusions
We studied the mechanical properties of southern bean mosaic virus by extended force-probe molecular dynamics simulations, totaling ∼100 ns in length. The simulation system, including 1,000,000 water molecules, comprised more than 4,500,000 atoms, i.e., one of the largest biomolecular simulation systems in the world, to the best of our knowledge. To obtain a spatially resolved picture of the elastic properties on the viral surface, the capsid was probed at 19 different grid points. The simulations showed that the viral shell exhibits highly elastic behavior during indentation with the tip-sphere, which served as a model for a very sharp AFM tip. Three different deformation regimes were distinguished from force-distance and force-time behavior during indentation with the tip-sphere. First, a prelinear regime was seen, resulting from local rearrangements of the outer surface layers when the tip-sphere approached the capsid. Such rearrangements were already suggested by elastic network normal mode analysis on SBMV and other capsids (24). Second, a linear force increase was obtained, which is characteristic for elastic deformation, and third, a rearrangement regime of sublinear force increase occurred that yielded a maximum force before rupture.
From the linear regime and maximum force, a highly heterogeneous distribution of elastic constants and yielding forces was observed, the distribution of which is difficult to describe with only a single Gaussian function, as suggested by recent AFM results on the empty capsid of minute virus of mice (Carrasco et al. (23)). Much better agreement is obtained with the bimodal distribution observed by Michel et al. (13), suggesting that the mechanical properties seen in our simulations offer a likely explanation for their results. However, direct comparison of the distributions of elastic constants is complicated because the heterogeneous distribution found in our simulations is caused by structural differences of the capsid on an atomic level, whereas a heterogeneous distribution of elastic constants obtained in AFM experiments might originate from the differing mechanical behaviors of capsomers. The remaining differences between distributions of elastic constants may result from differing tip sizes and geometries, differing accuracies in targeting specific surface regimes or different timescales, or statistical scatter attributable to the limited number of force probe simulations.
Closer inspection of the heterogeneity seen in the simulations reveals that the centers of the pentamers along the fivefold symmetry axes of SBMV exhibit the largest elastic constant, followed by the hexamers along the threefold symmetry axes. Tama and Brooks observed a larger flexibility for the pentamers than for the hexamers of SBMV (24). That result cannot be directly related to the obtained elastic constants in a straightforward manner.
The elastic response to external forces along the twofold symmetry axes was smaller by a factor of two compared with the hexamers, and similar to the elastic constant seen for the subunit centers. Overall, the elastic constants between two A-proteins were consistently larger than the values obtained at the interface between subunits where proteins B and C met. Overall, the elastic constants between two A-proteins were consistently larger than the values obtained at the interface between the subunits where proteins B and C met. We attribute this trend to (at least) two effects. First, purely geometrical properties might render pentamers stiffer than hexamers (69), an effect that might extend to the interaction of A-proteins. Second, Reddy et al. (70) calculated the dimer association energies for SBMV; a larger energy was also found for the interaction between A-proteins (−78.0 kcal/mol) than for protein B-C interactions (−74.0 kcal/mol), which might also contribute to the higher stiffness between A-proteins than B-C proteins.
Force-probe simulations were performed at different probe velocities. Both elastic constants and yielding forces depended logarithmically on probe velocity. To account for this peculiar behavior, a new model involving rate-dependent free-energy landscapes was proposed. Similar logarithmic rate-dependencies of mechanical properties were observed for other materials such as metallic glasses (71). For bacteriophage ϕ29, Ivanovska et al. did not observe a change of elastic constants for increasing probe velocities in AFM experiments, but only an increase in yielding force (21). In contrast to our simulations, the indentation depth at which fracture occurred increased with probe velocities of the AFM tip, correlating with a higher yielding force. This translates into a shift of the yielding point in the force-distance plot toward larger indentations, which is consistent with an unchanged slope (and thus, elastic constant), despite increasing yielding force.
The AFM experiments on coated murine leukemia virus (20) and ϕ29 bacteriophage (21) measured elastic constants in the range of 0.16–0.68 N/m, about one order of magnitude smaller than our data. With respect to the maximum applied force measured by Ivanovska et al. (21), our yielding forces were ∼1.0 nN larger than in the AFM measurements on ϕ29. We attribute this discrepancy to different probe velocities. In AFM experiments, the approach velocity of the tip is ∼5–7 orders of magnitude slower than in our simulations (Kol et al. (19,20), 0.095 × 10⁻⁶ m/s; Ivanovska et al. (21), ∼1.0 × 10⁻⁵ m/s). Extrapolating to an experimental velocity of 1.0 × 10⁻⁵ m/s yields an elastic constant of 0.63 N/m and a yielding force of 0.18 nN. The remaining smaller discrepancies of yielding forces are attributed to differing tip sizes; indeed, our simulations showed that yielding forces increase markedly with tip size, in contrast to elastic constants.
Next, we analyzed structural dynamics and changes during indentation with the tip-sphere. We observed that the β-sheet region showed a higher stiffness than the α-helices and loops, as found by Ackbarow et al. in their study of a model protein structure proposed for Alzheimer's amyloid β-fibrils (72). Beyond the linear response in force-time dependency, we characterized structural deformations in the rearrangement regime. Even this regime was dominated by elastic deformations of the complete proteins, subunits, and residues. Only close to the yielding point did the crossover to plastic deformation occur. This high elasticity is remarkable, and seems to be a property specific to viral shell proteins. Indeed, in force-probe simulations of the globular titin-kinase protein domain (Protein Data Bank code 1tit), in which the tip-sphere was pushed against and through the protein at a probe velocity of 0.01 nm/ps in a manner similar to that of the simulations described here (data not shown), plastic deformations were already evident at the transition from the linear to nonlinear force increase in the force-time curve, much earlier than seen for viral proteins.
On the atomic level, the linear regime is characterized by a deformation of an otherwise topologically unchanged conformation of neighboring atoms, whereas in the rearrangement regime, structural changes are seen, with marked distance changes between nearest and next-nearest neighbors. Thus, elastic deformation of the capsid is characterized by a collective motion of the complete protein or subunit, as proposed earlier by Tama and Brooks (24), whereas plastic yielding involves rearrangements of adjacent single atoms or residues as well as of next-nearest neighbors. No buckling transition of the virus was evident, probably because of the small tip size used here. Fracture only occurred locally, at the position where the tip-sphere penetrated the viral shell.
Beyond the SBMV virus studied here, it would be interesting to disentangle which of the obtained mechanical properties depend on intramolecular properties of the involved viral shell proteins, on the local contact and geometry of individual subunits, pentamers, or on the overall icosahedral geometry of the complete capsid. Comparative studies of further virus shells with the simulation methods established here will shine some light on this issue.
Acknowledgments
We thank C. Kutzner for work on the GROMACS pull-code, and J. Haas and M. Stumpe for programming help. We also acknowledge W. Roos for helpful discussions.
We thank Leibniz-Rechenzentrum München for supercomputing time on the SGI Altix 4700 cluster.
Supporting Material
References
- 1.Roos W.H., Ivanovska I.L., Evilevitch A., Wuite G.J.L. Viral capsids: mechanical characteristics, genome packaging and delivery mechanisms. Cell. Mol. Life Sci. 2007;64:1484–1497. doi: 10.1007/s00018-007-6451-1. [DOI] [PMC free article] [PubMed] [Google Scholar]
- 2.Caspar D.L.D., Klug A. Physical principles in the construction of regular viruses. Cold Spring Harb. Symp. Quant. Biol. 1962;27:1–50. doi: 10.1101/sqb.1962.027.001.005. [DOI] [PubMed] [Google Scholar]
- 3.Douglas T., Young M. Virus particles as templates for materials synthesis. Adv. Mater. 1999;8:1–3. [Google Scholar]
- 4.Klug W.S., Bruinsma R.F., Michel J.-P., Knobler C.M., Ivanovska I.L. Failure of viral shells. Phys. Rev. Lett. 2006;97:228101. doi: 10.1103/PhysRevLett.97.228101. [DOI] [PubMed] [Google Scholar]
- 5.Hagan M.F., Chandler D. Dynamic pathways for viral capsid assembly. Biophys. J. 2006;91:42–54. doi: 10.1529/biophysj.105.076851. [DOI] [PMC free article] [PubMed] [Google Scholar]
- 6.Smith D.E., Tans S.J., Smith S.B., Grimes S., Anderson D.L. The bacteriophage ϕ29 portal motor can package DNA against a large internal force. Nature. 2001;413:748–752. doi: 10.1038/35099581. [DOI] [PubMed] [Google Scholar]
- 7.Shields S.A., Brisco M.J., Wilson T.M.A., Hull R. Southern bean mosaic virus RNA remains associated with swollen virions during translation in wheat germ cell-free extracts. Virology. 1989;171:602–606. doi: 10.1016/0042-6822(89)90630-2. [DOI] [PubMed] [Google Scholar]
- 8.Santos N.C., Castanho M.A.R.B. An overview of the biophysical applications of atomic force microscopy. Biophys. Chem. 2004;107:133–149. doi: 10.1016/j.bpc.2003.09.001. [DOI] [PubMed] [Google Scholar]
- 9.Falvo M.R., Washburn S., Superfine R., Finch M., Brooks J.F.P. Manipulation of individual viruses: friction and mechanical properties. Biophys. J. 1997;72:1396–1403. doi: 10.1016/S0006-3495(97)78786-1. [DOI] [PMC free article] [PubMed] [Google Scholar]
- 10.Ohnesorge F.M., Härber J.K.H., Häberle W., Czerny C., Smith D.P.E. AFM review study on pox viruses and living cells. Biophys. J. 1997;73:2183–2194. doi: 10.1016/S0006-3495(97)78250-X. [DOI] [PMC free article] [PubMed] [Google Scholar]
- 11.Kuznetsov Y.G., Malkin A.J., Lucas R.W., Plomp M., McPherson A. Imaging of viruses by atomic force microscopy. J. Gen. Virol. 2001;82:2025–2034. doi: 10.1099/0022-1317-82-9-2025. [DOI] [PubMed] [Google Scholar]
- 12.Kuznetsov Y.G., Gurnon J.R., Etten J.L.V., McPherson A. Atomic force microscopy investigation of a chlorella virus, PBCV-1. J. Struct. Biol. 2005;149:256–263. doi: 10.1016/j.jsb.2004.10.007. [DOI] [PubMed] [Google Scholar]
- 13.Michel J.P., Ivanovska I.L., Gibbons M.M., Klug W.S., Knobler C.M. Nanoindentation studies of full and empty viral capsids and the effects of capsid protein mutations on elasticity and strength. Proc. Natl. Acad. Sci. USA. 2006;103:6184–6189. doi: 10.1073/pnas.0601744103. [DOI] [PMC free article] [PubMed] [Google Scholar]
- 14.Schmatulla A., Maghelli N., Marti O. Micromechanical properties of tobacco mosaic viruses. J. Microsc. 2007;225:264–268. doi: 10.1111/j.1365-2818.2007.01741.x. [DOI] [PubMed] [Google Scholar]
- 15.Uetrecht C., Versluis C., Watts N.R., Roos W.H., Wuite G.J.L. High-resolution mass spectrometry of viral assemblies: molecular composition and stability of dimorphic hepatitis B virus capsids. Proc. Natl. Acad. Sci. USA. 2008;105:9216–9220. doi: 10.1073/pnas.0800406105. [DOI] [PMC free article] [PubMed] [Google Scholar]
- 16.Lyobschenko Y.L., Oden P.I., Lampner D., Lindsay S.M., Dunker K.A. Atomic force microscopy of DNA and bacteriophage in air, water and propanol: the role of adhesion forces. Nucleic Acids Res. 1993;21:1117–1123. doi: 10.1093/nar/21.5.1117. [DOI] [PMC free article] [PubMed] [Google Scholar]
- 17.Plomp M., Rice M.K., Wagner E.K., McPherson A., Malkin A.J. Rapid visualization at high resolution of pathogens by atomc force microscopy: structural studies of herpes simplex virus-1. Am. J. Pathol. 2002;160:1959–1966. doi: 10.1016/S0002-9440(10)61145-5. [DOI] [PMC free article] [PubMed] [Google Scholar]
- 18.Kuznetsov Y.G., Daijogo S., Zhou J., Semler B.L., McPherson A. Atomic force microscopy analysis of icosahedral virus RNA. J. Mol. Biol. 2007;347:41–52. doi: 10.1016/j.jmb.2005.01.006. [DOI] [PubMed] [Google Scholar]
- 19.Kol N., Shi Y., Barlam D., Shneck R.Z., Kay M.S. A stiffness switch in human immunodeficiency virus. Biophys. J. 2007;92:1777–1783. doi: 10.1529/biophysj.106.093914. [DOI] [PMC free article] [PubMed] [Google Scholar]
- 20.Kol N., Gladnikoff M., Barlam D., Shneck R.Z., Rein A. Mechanical properties of murine leukemia virus particles: effect of maturation. Biophys. J. 2006;91:767–774. doi: 10.1529/biophysj.105.079657. [DOI] [PMC free article] [PubMed] [Google Scholar]
- 21.vanovska I.L., de Pablo P.J., Ibarra B., Sgalari G., MacKintosh F.C. Bacteriophage capsids: tough nanoshells with complex elastic properties. Proc. Natl. Acad. Sci. USA. 2004;101:7600–7605. doi: 10.1073/pnas.0308198101. [DOI] [PMC free article] [PubMed] [Google Scholar]
- 22.Ivanovska I., Wuite G., Joensson B., Evilevitch A. Internal DNA pressure modifies stability of WT phage. Proc. Natl. Acad. Sci. USA. 2007;104:9603–9608. doi: 10.1073/pnas.0703166104. [DOI] [PMC free article] [PubMed] [Google Scholar]
- 23.Carrasco C., Carreira A., Schaap I.A.T., Serena P.A., Gomez-Herrero J. DNA-mediated anisotropic mechanical reinforcement of a virus. Proc. Natl. Acad. Sci. USA. 2006;103:13706–13711. doi: 10.1073/pnas.0601881103. [DOI] [PMC free article] [PubMed] [Google Scholar]
- 24.Tama F., Brooks C.L., III Diversity and identity of mechanical properties of icosahedral viral capsids studied with elastic network normal mode analysis. J. Mol. Biol. 2005;345:299–314. doi: 10.1016/j.jmb.2004.10.054. [DOI] [PubMed] [Google Scholar]
- 25.Hespenheide B.M., Jacobs D.J., Thorpe M.F. Structural rigidity in the capsid assembly of cowpea chlorotic mottle virus. J. Phys. Condens. Matter. 2004;16:S5055–S5064. [Google Scholar]
- 26.Zandi R., Reguera D. Mechanical properties of viral capsids. Phys. Rev. E. 2005;72:021917. doi: 10.1103/PhysRevE.72.021917. [DOI] [PubMed] [Google Scholar]
- 27.Vliegenthart G.A., Gompper G. Mechanical deformation of spherical viruses with icosahedral symmetry. Biophys. J. 2006;91:834–841. doi: 10.1529/biophysj.106.081422. [DOI] [PMC free article] [PubMed] [Google Scholar]
- 28.Widom M., Lidmar J., Nelson D.R. Soft modes near the buckling transition of icosahedral shells. Phys. Rev. E. 2007;76:031911. doi: 10.1103/PhysRevE.76.031911. [DOI] [PubMed] [Google Scholar]
- 29.Arkhipov A., Freddolino P.L., Schulten K. Stability and dynamics of virus capsids described by coarse-grained modeling. Structure. 2006;14:1767–1777. doi: 10.1016/j.str.2006.10.003. [DOI] [PubMed] [Google Scholar]
- 30.Gräter F., Shen J., Jiang H., Gautel M., Grubmüller H. Mechanically induced titin kinase activation studied by force-probe molecular dynamics simulations. Biophys. J. 2005;88:790–804. doi: 10.1529/biophysj.104.052423. [DOI] [PMC free article] [PubMed] [Google Scholar]
- 31.Marszalek P.E., Lu H., Li H., Carrion-Vazquez M., Oberhauser A.F. Mechanical unfolding intermediates in titin modules. Nature. 1999;402:100–103. doi: 10.1038/47083. [DOI] [PubMed] [Google Scholar]
- 32.Freddolino P.L., Arkhipov A.S., Larson S.B., McPherson A., Schulten K. Molecular dynamics simulations of the complete satellite tobacco mosaic virus. Structure. 2006;14:437–449. doi: 10.1016/j.str.2005.11.014. [DOI] [PubMed] [Google Scholar]
- 33.Rossmann M.G., Abad-Zapatero C., Murthy M.R.N. Structural comparisons of some small spherical plant viruses. J. Mol. Biol. 1983;165:711–736. doi: 10.1016/s0022-2836(83)80276-9. [DOI] [PubMed] [Google Scholar]
- 34.Rossmann M.G., Johnson J.E. Icosahedral RNA virus structures. Annu. Rev. Biochem. 1989;58:533–573. doi: 10.1146/annurev.bi.58.070189.002533. [DOI] [PubMed] [Google Scholar]
- 35.Hsu C.H., Sehgal O.P., Pickett E.E. Stabilizing effect of divalent metal ions on virions of southern bean mosaic virus. Virology. 1976;69:587–595. doi: 10.1016/0042-6822(76)90487-6. [DOI] [PubMed] [Google Scholar]
- 36.Hull R. The stabilization of the particles of turnip rosette virus and other members of the southern bean mosaic virus group. Virology. 1977;79:58–66. doi: 10.1016/0042-6822(77)90334-8. [DOI] [PubMed] [Google Scholar]
- 37.Hull R. The stabilization of the particles of turnip rosette virus: III. Divalent cations. Virology. 1978;89:418–422. doi: 10.1016/0042-6822(78)90184-8. [DOI] [PubMed] [Google Scholar]
- 38.Rayment I., Johnson J.E., Rossmann M.G. Metal-free southern bean mosaic virus crystals. J. Biol. Chem. 1979;254:5243–5245. [PubMed] [Google Scholar]
- 39.Brisco M., Haniff C., Hull R., Wilson T.M.A., Sattelle D.B. The kinetics of swelling of southern bean mosaic virus: a study using photon correlation spectroscopy. Virology. 1986;148:218–220. doi: 10.1016/0042-6822(86)90417-4. [DOI] [PubMed] [Google Scholar]
- 40.Grubmüller H., Heymann B., Tavan P. Ligand binding: molecular mechanics calculation of the streptavidin-biotin rupture force. Science. 1996;271:997–999. doi: 10.1126/science.271.5251.997. [DOI] [PubMed] [Google Scholar]
- 41.Heymann B., Grubmüller H. Molecular dynamics force probe simulations of antibody/antigen unbinding: entropic control and nonadditivity of unbinding forces. Biophys. J. 2001;81:1295–1313. doi: 10.1016/S0006-3495(01)75787-6. [DOI] [PMC free article] [PubMed] [Google Scholar]
- 42.Silva A.M., Rossmann M.G. The refinement of southern bean mosaic virus in reciprocal space. Acta Crystallogr. B. 1985;41:147–157. [Google Scholar]
- 43.Silva A.M., Rossmann M.G. Refined structure of southern bean mosaic virus at 2.9 Å resolution. J. Mol. Biol. 1987;197:69–87. doi: 10.1016/0022-2836(87)90610-3. [DOI] [PubMed] [Google Scholar]
- 44.Reddy V.S., Natarajan P., Okerberg B., Li K., Damodaran K.V., Morton R.T., Brooks C.L., III, Johnson J.E. Virus Particle Explorer (VIPER), a website of viral capsid structures and their computational analyses. J. Virol. 2001;75:11943–11947. doi: 10.1128/JVI.75.24.11943-11947.2001. [DOI] [PMC free article] [PubMed] [Google Scholar]
- 45.Natarajan P., Lander G.C., Shepherd C.M., Reddy V.S., Brooks C.L. Exploring icosahedral virus structures with VIPER. Nature. 2005;3:809–817. doi: 10.1038/nrmicro1283. [DOI] [PubMed] [Google Scholar]
- 46.van der Spoel D., Lindahl E., Hess B., Groenhof G., Mark A.E. GROMACS: fast, flexible, and free. J. Comput. Chem. 2005;26:1701–1718. doi: 10.1002/jcc.20291. [DOI] [PubMed] [Google Scholar]
- 47.Jorgensen W.L., Chandrasekhar J., Madura J.D., Impey R.W., Klein M.L. Comparison of simple potential functions for simulating liquid water. J. Chem. Phys. 1983;79:926–935. [Google Scholar]
- 48.Jorgensen W.L., Tirado-Rives J. The OPLS potential function for proteins. Energy minimization of cyclic peptides and crambin. J. Am. Chem. Soc. 1988;110:1657–1666. doi: 10.1021/ja00214a001. [DOI] [PubMed] [Google Scholar]
- 49.Berendsen H.J.L., Postma J.P.M., van Gunsteren W.F., Nola A.D., Haak J.R. Molecular dynamics with coupling to an external bath. J. Chem. Phys. 1984;81:3684–3690. [Google Scholar]
- 50.Darden T., York D., Pedersen L. Particle mesh Ewald—an N log(N) method for Ewald sums in large systems. J. Chem. Phys. 1993;98:10089–10092. [Google Scholar]
- 51.Hess B., Bekker H., Berendsen H.J.C., Fraaije J.G.E.M. Lincs: a linear constraint solver for molecular simulations. J. Comput. Chem. 1997;18:1463–1472. [Google Scholar]
- 52.Kutzner C., van der Spoel D., Fechner M., Lindahl E., Schmitt U.W. Speeding up parallel GROMACS on high-latency networks. J. Comput. Chem. 2007;28:2075–2084. doi: 10.1002/jcc.20703. [DOI] [PubMed] [Google Scholar]
- 53.Hess B., Kutzner C., van der Spoel D., Lindahl E. GROMACS 4: algorithms for highly efficient, load-balanced, and scalable molecular simulation. J. Chem. Theory Comput. 2008;4:435–447. doi: 10.1021/ct700301q. [DOI] [PubMed] [Google Scholar]
- 54.Silva A.M., Cachau R.E., Goldstein D.J. Ion channels in southern bean mosaic virus capsid. Biophys. J. 1987;52:595–602. doi: 10.1016/S0006-3495(87)83249-6. [DOI] [PMC free article] [PubMed] [Google Scholar]
- 55.Jorgensen W.L., Madura J.D. Temperature and size dependence for Monte Carlo simulations of TIP4P water. Mol. Phys. 1985;56:1381–1392. [Google Scholar]
- 56.Bertolini D., Tani A. Stress tensor and viscosity of water: molecular dynamics and generalized hydrodynamics results. Phys. Rev. E. 1995;52:1699. doi: 10.1103/physreve.52.1699. [DOI] [PubMed] [Google Scholar]
- 57.Bocquet L., Barrat J.-L. Hydrodynamic boundary conditions, correlation functions, and Kubo relations for confined fluids. Phys. Rev. E. 1993;49:3079–3092. doi: 10.1103/physreve.49.3079. [DOI] [PubMed] [Google Scholar]
- 58.Schmidt J.R., Skinner J.L. Hydrodynamic boundary conditions, the Stokes-Einstein law, the long-time tails in the Brownian limit. J. Chem. Phys. 2003;119:8062–8068. [Google Scholar]
- 59.Raschke T.M., Tsai J., Levitt M. Quantification of the hydrophobic interaction by simulations of the aggregation of small hydrophobic solutes in water. Proc. Natl. Acad. Sci. USA. 2001;98:5965–5969. doi: 10.1073/pnas.111158498. [DOI] [PMC free article] [PubMed] [Google Scholar]
- 60.Reynolds J.A., Gilbert D.B., Tanford C. Empirical correlation between hydrophobic free energy and aqueous cavity surface area. Proc. Natl. Acad. Sci. USA. 1974;71:2925–2927. doi: 10.1073/pnas.71.8.2925. [DOI] [PMC free article] [PubMed] [Google Scholar]
- 61.Merkel R., Nassoy P., Leung A., Ritchie K., Evans E. Energy landscapes of receptor–ligand bonds explored with dynamic force spectroscopy. Nature. 1999;397:50–53. doi: 10.1038/16219. [DOI] [PubMed] [Google Scholar]
- 62.Puchner E., Alexandrovitch A., Brandmeier B., Hensen U., Schäfer L. Mechanically activated ATP binding of the titin kinase domain revealed by single-molecule force spectroscopy. Proc. Natl. Acad. Sci. USA. 2008;105:13385–13390. doi: 10.1073/pnas.0805034105. [DOI] [PMC free article] [PubMed] [Google Scholar]
- 63.Bell G.I. Models for the specific adhesion of cells to cells. Science. 1978;200:618–627. doi: 10.1126/science.347575. [DOI] [PubMed] [Google Scholar]
- 64.Florin E.L., Moy V.T., Gaub H.E. Ligand binding: molecular mechanics calculation of the streptavidin-biotin rupture force. Science. 1994;264:415–417. doi: 10.1126/science.271.5251.997. [DOI] [PubMed] [Google Scholar]
- 65.Heymann B., Grubmüller H. Dynamic force spectroscopy of molecular adhesion bonds. Phys. Rev. Lett. 2000;84:6126–6128. doi: 10.1103/PhysRevLett.84.6126. [DOI] [PubMed] [Google Scholar]
- 66.Hummer G., Szabo A. Kinetics from nonequilibrium single-molecule pulling experiments. Biophys. J. 2003;85:5–15. doi: 10.1016/S0006-3495(03)74449-X. [DOI] [PMC free article] [PubMed] [Google Scholar]
- 67.Evstigneev M., Reimann P. Rate description in friction force microscopy. Europhys. Lett. 2004;67:907–913. [Google Scholar]
- 68.Evans E.A., Calderwood D.A. Forces and bond dynamics in cell adhesion. Science. 2007;316:1148–1153. doi: 10.1126/science.1137592. [DOI] [PubMed] [Google Scholar]
- 69.Nguyen T.T., Bruinsma R.F., Gelbart W.M. Elasticity theory and shape transitions of viral shells. Phys. Rev. E. 2005;72:051923. doi: 10.1103/PhysRevE.72.051923. [DOI] [PubMed] [Google Scholar]
- 70.Reddy V.S., Giesing H.A., Morton R.T., Kumar A., Post C.B. Energetics of quasiequivalence: computational analysis of protein-protein interactions in icosahedral viruses. Biophys. J. 2002;74:546–558. doi: 10.1016/S0006-3495(98)77813-0. [DOI] [PMC free article] [PubMed] [Google Scholar]
- 71.Zink M., Samwer K., Johnson W.L., Mayr S.G. Validity of temperature and time equivalence in metallic glasses during shear deformation. Phys. Rev. B. 2006;74:012201. [Google Scholar]
- 72.Ackbarow T., Chen X., Keten S., Buehler M.J. Hierarchies, multiple energy barriers, and robustness govern the fracture mechanics of alpha-helical and beta-sheet protein domains. Proc. Natl. Acad. Sci. USA. 2007;16:16410–16415. doi: 10.1073/pnas.0705759104. [DOI] [PMC free article] [PubMed] [Google Scholar]
Associated Data
This section collects any data citations, data availability statements, or supplementary materials included in this article.