

Abstract
The binding of the Ets-1 transcription factor to its target DNA sequence is characterized by a highly unusual conformational change consisting of the unfolding of inhibitory helix 1 (HI-1). To probe the interactions that lead to this unfolding, we performed molecular dynamics simulations of the folded states of apo-Ets-1 and the Ets-1-DNA complex. The simulations showed large differences in correlated motions between helix 4 (H4) and HI-1. In apo-Ets-1, H4 and HI-1 moved in-phase and stabilized each other by hydrogen bonding and macrodipolar interactions, whereas in the DNA-bound state, the motion was out-of-phase, with a disruption of the stabilizing interactions. This change in motion was due to hydrogen-bonding interactions between helix 1 (H1) and the DNA. The dipolar energy between H1 and H4 was modulated by hydrogen bonds between H1 and DNA, and, in accordance with experiments, elimination of the hydrogen bonds increased the stability of HI-1. The simulations confirm that the hydrogen bonds between H1 and DNA act as a conformational switch and show that the presence of DNA is communicated from H1 to H4, destabilizing HI-1. The calculations reveal a critical role for correlated motions at the onset of the DNA-induced unfolding.
Introduction
The human Ets-1 transcription factor is important for embryonic development and angiogenesis (1–5). The protein is also involved in various cancers, stimulating tumor metastasis and invasiveness (6–8). Ets-1 is an independent marker for bad prognosis in breast cancer (9,10), and its expression level in tumors correlates with poor prognosis in colon (11,12), cervix (13), gastric (14), oral (15), and ovary cancers (16–18). Ets-1 consists of six domains ( Fig. 1 A). The pointed (PNT) domain (residues 54–135) is important for protein-protein interactions (6,19). It is adjacent to a Ras-responsive phosphorylation site at threonine 38; phosphorylation of this residue increases Ets-1 activity (20). The C-domain, or activation domain (residues 135–242), is involved in protein-protein interactions and is essential for transcription activation (21). DNA is bound by the winged helix-turn-helix motif of the highly conserved ETS domain (residues 331–415) (22) (Fig. 1 B). Helix H3 of this domain binds the GGAA/T core sequence (23) in the major groove of DNA, whereas the wing between sheets 3 and 4 interacts with the 3′ minor groove (24). The recognition of the core sequence involves a mixture of direct and indirect readout mechanisms (25,26). The ETS domain is flanked by the autoinhibitory module, consisting of residues 415–440 of the F-domain and residues 301–330 of the D- or exon VII domain (27–30). In addition to the N-terminal part of the autoinhibitory module, the exon VII domain also consists of an unstructured serine-rich region (SRR, residues 243–300) (31).
Figure 1.
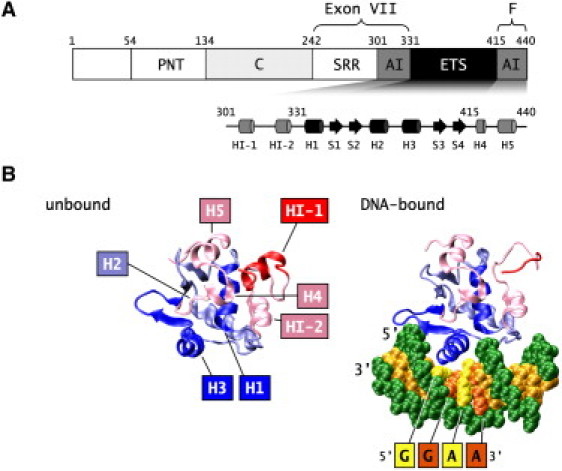
Structure of Ets-1. (A) Domain structure of Ets-1 and the secondary structure of the autoinhibitory module (AI) and the ETS domain. (B) Structure of apo-Ets-1 Δ301 (left) and the Δ301-DNA complex (right). DNA is recognized by the winged helix-turn-helix motif of the ETS domain. In apo-Ets-1, HI-1 is folded into an α-helix; upon binding the GGAA/T core sequence HI-1 unfolds. (Figs. 1B, 4, 5A, 6A and 6 B were prepared with VMD (83) and povray (www.povray.org).)
The binding affinity of Ets-1 for the core sequence is strongly mediated by the autoinhibitory module, by calcium-dependent phosphorylation of the SRR, and by protein-protein interactions (6,32). The autoinhibitory module decreases the binding affinity for DNA by 10- to 20-fold compared to the bare ETS domain (27–30). Autoinhibition may play an important role in the regulation of Ets-1 (32); it is interesting to note that autoinhibition is disrupted in oncogenic v-Ets (27,33). The autoinhibition is offset by cooperative DNA binding with AML1 (acute myeloid leukemia 1, also named runt-related transcription factor 1, RUNX1) through direct interactions of AML1 with the Ets-1 autoinhibitory module of the exon VII domain (34,35). Calcium-dependent phosphorylation of multiple serine residues in the SRR reinforce autoinhibition by decreasing the DNA binding affinity 50- to 1000-fold (31,36–38). The effects of phosphorylations are additive, producing a graded binding affinity rather than a simple on/off switch for binding. To date, such a graded binding affinity has been observed for only two proteins (Ets-1 and the Kv2.1 potassium channel) (31,39).
The binding and autoinhibition mechanisms of Ets-1 involve remarkable structural rearrangements of the protein, which are the subject of this study. Binding induces the unfolding of inhibitory helix 1 (HI-1) of the exon VII autoinhibitory domain (40) (Fig. 1 B). This helix is folded in the apoprotein, although the helix is marginally stable and conformationally dynamic in the millisecond to microsecond time range (41). Upon DNA binding, the HI-1 helix unfolds: in the DNA-bound state, HI-1 samples a random coil configuration, as measured by circular dichroism, proteolytic cleavage, and NMR experiments (40,41). In contrast, phosphorylation of the SRR decreases the unfolding propensity of HI-1, leading to a lowered binding affinity for DNA (31). The binding behavior of Ets-1 is unique: to date, only two proteins (Ets-1 and Bam HI endonuclease) are known to partially unfold upon DNA binding (40,42). Although the unfolded helices bind DNA in Bam HI endonuclease (42), in Ets-1 the unfolded helix is located far away from the DNA (43).
How DNA binding induces the unfolding of HI-1 is the central question addressed in this article. Important insights into the responsible interactions have been obtained from NMR and mutation experiments. Chemical shifts of the autoinhibitory module and helix 1 (H1), a long helix in the center of the ETS domain, were perturbed upon DNA binding (44). In crystal structures of ETS domains bound to DNA (45–50), the amide backbone of Leu337 (residue numbering as in Ets-1) of H1 forms a hydrogen bond with the phosphate backbone of DNA. Ets-1 had a reduced binding affinity for nicked DNA constructs that miss this phosphate group; the binding affinity was also reduced for mutants at the 337 position, and for mutants that were thought to change the position of the H1 helix (51). Based on these findings, it has been suggested that the hydrogen bond between Leu337 of H1 and the DNA phosphate group is a conformational switch that triggers the unfolding of HI-1 upon DNA binding (41,51).
To verify this mechanism, and to gain insights into how the conformational switch induces the unfolding of HI-1, we performed molecular dynamics simulations (52) of the folded state of apo-Ets-1 and the Ets-1-DNA complex. The latter state is hard to study by experimental means, since the equilibrium is shifted toward the unfolded state. Given the possibly long timescales of the unfolding transition (41), we did not anticipate being able to observe the full unfolding of HI-1 of the DNA-bound protein in the ∼15-ns simulations. Instead, we observed how the folded state became destabilized upon DNA binding. Our main goal was to identify the interactions that lead to the onset of the unfolding; with this aim, a comparison of the motions and interactions of the folded apo state with those of the metastable, folded DNA-bound state sufficed, as will be shown in detail below.
Our simulations support the existence of a conformational switching mechanism involving Leu337 and Gln336, illuminate the way in which the presence of the hydrogen bond between H1 and DNA is communicated to HI-1, and identify the mechanism by which HI-1 is destabilized upon DNA binding. The simulations revealed a strong coupling of motion between helices H1, H4, and HI-1, which changed in character upon DNA binding. The calculations suggest that the onset of unfolding of HI-1 upon DNA binding is caused by a disruption of stabilizing interactions between H4 and HI-1, mediated by hydrogen bonding between H1 and the DNA backbone.
Materials and Methods
Since no structure is available for the full-length Ets-1 protein, we studied constructs consisting of the ETS domain with (part of) the autoinhibitory module. Such constructs have also been studied by experimental means. For example, the binding affinity of a construct consisting of residues 280–440 (Δ280) was shown to be identical to the full-length protein, with an ∼10-fold autoinhibition (30,40,41). Since residues 280–300 are in the unstructured SRR (44), high-resolution structural studies have concentrated on apo-Δ301, a construct consisting of residues 301–440 with an intact autoinhibitionary module and ∼2-fold autoinhibition (41). In addition, high-resolution studies have characterized the DNA-bound state of Δ331, a construct consisting of residues 331–440 (50,53). In Δ331, autoinhibition is abolished; it contains the autoinhibitory F-domain, but not the N-terminal part of the autoinhibitory module of the exon VII domain (30,41). Given the availability of high-resolution structural data, we concentrated our studies on Δ301 and Δ331.
The apo structures were modeled after the NMR structure of apo-Δ301 (Brookhaven Protein Data Bank (54) (PDB) entry 1R36) (41). The DNA-bound states were modeled after the x-ray structure of the DNA-bound state of Δ331 (PDB entry 1K79) (50). Since no experimental structure of the DNA-bound folded state of Δ301 is available, we used residues 301–336 from the apoprotein structure 1R36 by overlaying H1 and H4 of 1K79 and 1R36 to generate the initial coordinates of this construct. The protonation states of all residues were calculated using the finite-difference Poisson-Boltzmann method in combination with a Monte Carlo sampling of all states (55); according to these calculations, His403 and His430 are singly protonated at Nɛ 2, allowing for hydrogen bonding between His403 and Asn400, and His430 and the backbone of Gly390. Long equilibrations were performed to relax the structures; although the folded DNA-bound state is metastable, unfolding was not observed in the simulation. We also performed simulations of DNA-bound “electrostatic mutants” of Δ301 and Δ331. In the mutants, the charges of the backbone NH group of Leu337 and the amine group of Gln336 were set to zero, to eliminate the hydrogen bonding between these groups and the DNA backbone.
The 15 basepair DNA of the x-ray study (1K79) with the high-affinity GGAA core sequence has two 5′ overhangs. Molecular dynamics simulations of Ets-1 bound to DNA from which the overhangs were deleted showed large motions of the last two basepairs, leading to partial melting of the tail DNA. We then adjusted the unusual hydrogen bonds at basepair 14, as suggested by Reddi et al. (26), and added a new G-nucleotide with the 3DNA program (56) at position 15 to pair the second overhang. Since simulations of this construct still showed large deviations of the last two basepairs, we also added a 16th CG basepair; this made the DNA stable throughout the simulations without the need of restraints. The simulated DNA sequence is 5′-AGTGCCGGAAATGTGC-3′; the adjusted and added basepairs did not contact the protein.
All simulations were performed using the TIP3P water model (57), using an octahedral simulation box with a water shell around the solute of at least 14 Å at the end of the equilibration. A salt concentration of 65 mM KCL was used; this is the concentration that was used in the experimental binding studies (40). The ions were placed with the SOLVATE program (58) and the total charge of the system was zero. In total, 16,551 water molecules, 36 K+, and 7 Cl− ions were used for the simulations of the Δ331-DNA complex; 11,213 water molecules, 12 K+, and 15 Cl− ions for Δ331; 16,962 water molecules, 36 K+, and 9 Cl− ions for the Δ301-DNA complex; and 12,566 water molecules, 12 K+, and 17 Cl− ions for Δ301. We carefully checked the diffusion of the ions to avoid computational artifacts (59,60).
The simulations were performed with the CHARMM program (61), using the CHARMM27 force field for protein and nucleic acids (62–64). Periodic boundary conditions, a particle-mesh Ewald (65) treatment of the long-range electrostatics, and SHAKE (66) were employed, and a time step of 2 fs was used. The nonbonded interactions were truncated at 12 Å using an atom-based approach and a potential-switching function between 10 and 12 Å for the van der Waals interactions. Nosé-Hoover chains of thermostats were used to control the temperature (67,68). We used different independent chains of length 3 that were separately coupled to the water, the ions, the protein, and the DNA degrees of freedom. For the NPT simulations, an additional chain of thermostats was coupled to the barostat. We used a velocity Verlet integrator using the Liouville operator based on the Trotter factorization scheme (69) for the integration of the thermostats, using three multiple steps. This integrator is implemented as the VV2 integrator in CHARMM.
At the start of the equilibration, the protein and/or DNA were fixed during 5000 steps of minimization while allowing the water molecules and ions to move. These fixed constraints were maintained through a gradual heating under constant volume and temperature conditions. The equilibration was continued for 50 ps in the NPT ensemble at 300 K and 1 atm with fixed constraints placed on the protein and/or DNA, followed by a 500-ps simulation in which harmonic restraints were placed on all protein and/or DNA atoms, with force constants scaled according to the atomic masses. The protein restraints were slowly lowered from m i × 84 to 0 kJ/(mol Å2) until the bulk water reached a density of ∼1 g cm−3. The volume of the bulk water was estimated by subtracting the volume of the protein and DNA from the total volume. Further unrestrained (NPT) MD simulations of 4 ns completed the equilibration phase, after which we performed unrestrained production runs of 10 ns each. Throughout the text, the zero of time refers to the start of the production run. Snapshots were saved every 1 ps. We performed six simulations in total (simulations of apo-Δ301 and apo-Δ331, DNA-bound-state simulations of Δ301, Δ331, and their electrostatic mutants), for a combined simulation time of almost 90 ns.
Helix dipole-dipole interactions were calculated by , where r is the distance and the normalized vector between the centers of the dipoles. The dipoles, , were constructed from N, H, Cα, Hα, C, and O atoms of helix residues; to obtain coordinate system independent dipoles, the total charge of the selected atoms was zero.
We used the local block bootstrap method to increase the statistical accuracy of the calculated variance-covariance matrix (70). In this method, the stored trajectory is divided into n blocks of B frames. For each of the blocks, the B frames are randomly reordered. The randomly reordered frames are used to calculate the matrix , where the atomic fluctuation , and is the atomic position of atom i. Repeating the procedure M times yields the variance-covariance matrix as the average value of all . The value of n follows from the position of the first zero of the autocorrelation function of the atomic fluctuations; in our case, and . To determine the significance of the Pearson correlation coefficient (i.e., the value of significantly different from zero), we used a 95% confidence limit. In addition, we used a null hypothesis for values of the variance-covariance matrix close to zero (elements smaller than 0.15), as suggested in Kubinger et al. (71). The convergence of the normalized variance-covariance matrix (72) was checked by the calculation of , where N is the dimension of the variance-covariance matrix, and t the simulation time. The time shift τ was set to 100 ps; upon convergence . The variance-covariance matrix gives useful information on the correlated motions in the system (72), and has been frequently used in the analysis of MD simulations. We note that nonlinear correlations may be missing from the variance-covariance analysis (73); consequently, carries no information on the convergence of higher moments of the correlation functions (74).
The quasiharmonic modes (75,76) were obtained by standard means. To quantify the differences in quasiharmonic modes between the various simulations, we followed a procedure similar to that of Tournier and Smith (77). The motion of simulation 1 was projected onto the motion of simulation 2 according to . Here, is the eigenvalue of simulation 1, associated with the quasiharmonic mode of simulation 1. is given by the projection of the quasiharmonic mode of simulation 1 onto the quasiharmonic mode of simulation 2: , where denotes element j of the quasiharmonic mode of simulation 2. These projections account for the fact that the quasiharmonic modes may not be ordered in the same way in the simulations; for example, mode 8 of simulation 1 may more closely correspond to mode 10 of simulation 2 than to mode 8 of simulation 2. The projected eigenvalues, , are used to calculate . is a quantitative measure of the difference in amplitude in simulations 1 and 2 for the motion described by mode . For , the amplitude of motion is larger in simulation 2, or, equivalently, the motion is repressed in simulation 1. For the amplitude is larger in simulation 1 or, equivalently, repressed in simulation 2.
Results
We performed molecular dynamics simulations of the Ets-1 Δ301 and Δ331 constructs as apoprotein and bound to DNA. Δ301 consists of Ets-1 residues 301–440, and Δ331 of residues 331–440. Whereas Δ301 contains the intact autoinhibitory module, autoinhibition is abolished in Δ331. To identify the interactions that lead to the unfolding of HI-1, we performed simulations of the folded apo state, and the folded state bound to DNA. Fig. 2 shows the root mean-square deviation (RMSD) from the averaged structures for the Cα atoms of Ets-1 Δ331 (Fig. 2 A) and Δ301 (Fig. 2 B) for the apoprotein (black) and the protein-DNA complex (dark gray). For Δ301, large differences between these residue-based RMSDs were observed for the apo and the DNA-bound state. Upon binding DNA, the RMSD in HI-1, HI-2, and the loop between HI-1 and HI-2 increased significantly, indicating that these areas become destabilized when they bind the DNA. In Δ301 and Δ331, the RMSD of the recognition helix, H3, decreased slightly upon binding DNA, indicating that this helix is held more tightly in place by DNA. Other Cα RMSDs of Δ331 were very similar for the apo and DNA-bound states.
Figure 2.
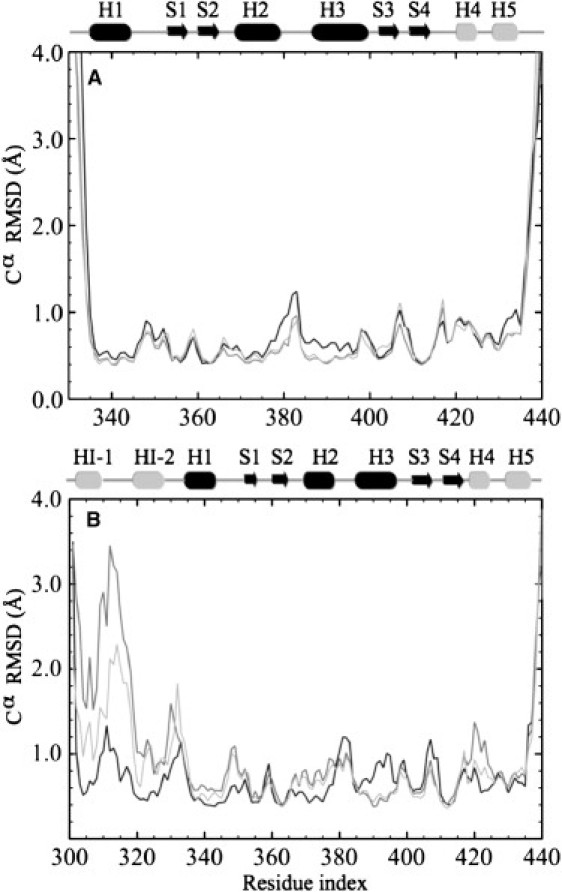
RMSD with the averaged structures for the Cα atoms of apo-Ets-1 (black) and the Ets-1-DNA complex (dark gray); the RMSD for the DNA-bound electrostatic mutant is shown in light gray. (A) Δ331. (B) Δ301.
The RMSDs of the DNA strands were similar in the Δ331 and Δ301 simulations, with a residue-based heavy atom RMSD of ∼1 Å/basepair. Slightly lower RMSD values were obtained for the parts of the DNA that bound the protein. For example, the 5′-G4C5C6-3′ bases of the primary strand had the lowest RMSD, at 0.7 Å/basepair; this part of the DNA was bound by Arg409 and Lys404. The 3′-C8T9T10-5′ bases of the complementary strand, which basepairs the 5′-G7G8A9A10-3′ target sequence, had an RMSD of 0.8 Å/basepair; these bases bind the H3 recognition helix. The tails of the DNA had the largest RMSDs, at 1.8 Å/basepair.
A comparison of the normalized variance-covariance matrix of protein fluctuations showed large differences between the apo and DNA-bound states of Δ301 and Δ331 ( Fig. 3, A and B). The variance-covariance matrix shows how motion between different groups is correlated: elements in this matrix are negative if the motion is anticorrelated (or out-of-phase), and values are positive if the motion is correlated (or in-phase). Since the variance-covariance matrix is symmetric, the comparison between two systems can be made easier by using the lower triangular part for one system, and the upper triangular part for the other system. In Fig. 3 A, the variance-covariance matrix for the Cα atoms of Δ331 is shown. The upper triangular part is for apo-Δ331 and the lower for the DNA-bound state. Fig. 3 B shows the Cα-atom matrix for Δ301. To ensure that the reported results are not a computational artifact due to insufficient sampling, we verified that the calculated variance-covariance matrix had converged. In all cases, was an exponentially decreasing function and convergence was reached at ∼8 ns, with .
Figure 3.
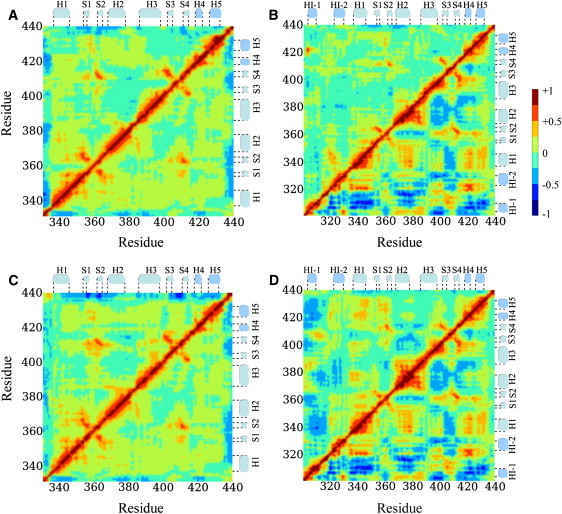
Variance-covariance matrices of Cα fluctuations. (A and B) The upper and lower triangular parts represent the wild-type apoprotein and DNA-bound state, respectively, for Δ331 (A) and Δ301 (B). (C and D) The upper and lower triangular parts represent the electrostatic mutant and wild-type DNA-bound states, respectively, for Δ331 (C) and Δ301 (D).
Fig. 3 shows that there are large differences between the variance-covariance matrices of the apo and DNA-bound states of Δ301. In general, correlated motions are reinforced in the DNA-bound state. If a motion between various residues was anticorrelated in the apoprotein, it was generally more anticorrelated in the DNA-bound state; if a motion was correlated in the apoprotein, it was generally more strongly correlated in the DNA-bound state. There is only one place in which the correlation changed sign. In the apoprotein, the motion between HI-1 and H4 was strongly correlated, whereas in the DNA-bound state it was strongly anticorrelated. In contrast to the large differences observed for Δ301, the variance-covariance matrices of Δ331 are very similar for the DNA-bound and apo states. This meant that the change in correlated motions between the apo and DNA-bound states of Δ301 are due to the presence of the exon VII part of the inhibitory module. We note that the correlated motions within the DNA strands and between the protein and the DNA showed no significant differences for Δ301 and Δ331 (data not shown). Strong, in-phase correlations were observed where Ets-1 binds the DNA, for example, between DNA and H3, H1, S3, and S4.
In the apoprotein, helices H4 and HI-1 of Δ301 were well aligned. The angle between their helical axes is 50° in the NMR apo structure, with the N-terminal end of HI-1 pointing toward the C-terminal end of H4 (41). In the simulation, the angle was decreased to an average of 25 ± 7°. This change happened during the equilibration period through small adjustments of the HI-1, H4, and H5 helices ( Fig. 4 A). The resulting structure was stable throughout the production run, with an average backbone RMSD of 2.3 Å with the NMR structure. This RMSD value is within a normal range; MD simulations starting from NMR structures usually have slightly larger RMSD values than those starting from x-ray structures (78). Of importance is a favorable interaction between HI-1 and H4. The NMR article states that a favorable macrodipolar interaction is likely (41). Moreover, NOE measurements were consistent with hydrogen bonds formed between the amide hydrogen atoms of Phe304 and Lys305 of HI-1, and the carbonyl oxygen atoms of Leu421 and Leu422 of H4, respectively (41). In the simulation, these hydrogen bonds were persistently present, whereas in the NMR structure ensemble, generally only the hydrogen bond between Lys305 and Leu422 is present (Fig. 4, B and C). The average distance between the amide hydrogen atom of Phe304 and the carbonyl oxygen atom of Leu421 is 3.05 ± 0.4 Å in the NMR structure ensemble and 2.13 ± 0.3 Å in the simulation; for Lys305 and Leu422, the average distance is 2.21 ± 0.3 Å in the NMR ensemble and 2.25 ± 0.3 Å in the simulation. As noted in the NMR article, in the domain-swapped crystal structure of Ets-1 Δ300, HI-1 of one monomer and H4 of another form a continuous helix with a bend of 19° at the H4-HI-1 interface, stabilized by Phe304-Leu421 and Lys305-Leu422 hydrogen bonds (43). This is another indication of favorable macrodipolar and hydrogen-bonding interactions between HI-1 and H4. Consistent with the NMR structural ensemble, persistent salt bridges were formed between Lys305 of HI-1 and Glu428 of H5, and Lys316 of the loop between HI-1 and HI-2 and Glu343 of H1 in the simulation. A salt bridge between Lys318 of the loop between HI-1 and HI-2 and Asp347 of H1 was less frequently observed in the simulation; this salt bridge was also less frequently present in the NMR structure ensemble. Given that the overall RMSD with the NMR structure was small, and that the presence of various contacts agreed with the experimental data, we deemed the numerical difference in H4-HI-1 helix angles nonessential for our findings.
Figure 4.
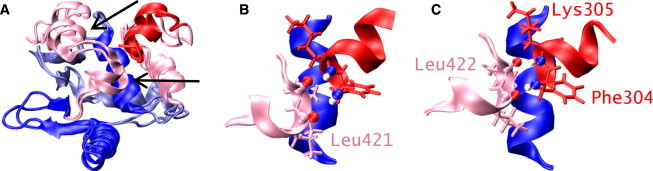
Structure of apo-Δ301. (A) Overlay of the NMR and simulation structure of apo-Δ301. H5 and H4 of the NMR structure are indicated by arrows; the backbone RMSD is 2.3 Å. (B and C) H1, HI-1, and H4 of the NMR structure (B) and the simulation structure (C), with Phe304, Lys305, Leu421, and Leu422 shown as stick models. There is a hydrogen bond between Lys305 and Leu422 in both models, and an additional hydrogen bond between Phe304 and Leu422 in the simulation model. The orientation of H1 is identical in both models.
The good alignment of HI-1 and H4 in the apoprotein persisted throughout the simulation ( Fig. 5). Moreover, the motion between HI-1 and H4 was highly correlated in apo-Δ301 (Fig. 3 A); the helices moved in tandem. This means that there was a continuous stabilization of HI-1 through macrodipolar and hydrogen-bonding interactions with H4: the macrodipolar interaction energy between H4 and HI-1 was −25 kJ/mol throughout the simulation. In contrast, in the DNA-bound state of Δ301, the Phe304-Leu421 and Lys305-Leu422 hydrogen bonds broke, and the motion between the HI-1 and H4 helices was strongly anticorrelated. The helices moved out of phase, and there was much less stabilization of HI-1 through interactions with H4. The angle between HI-1 and H4 varied between 20 and 80° with an average of 52 ± 16° (Fig. 5 C), and the macrodipolar interaction energy was only −8 kJ/mol on average. It is important to note that the use of the helix-dipole model for neighboring groups has been criticized (79). The underlying assumptions of the model require that the distances between the dipoles are larger than the length of the dipole, a condition which is often not satisfied. In accordance with suggestions (79), we also calculated the total electrostatic energies between the helices; in all cases, the trends from these calculations were identical to those of the helix-dipole model. Since the helix-dipole model is widely used in biology (80,81), we report our results in terms of this model.
Figure 5.
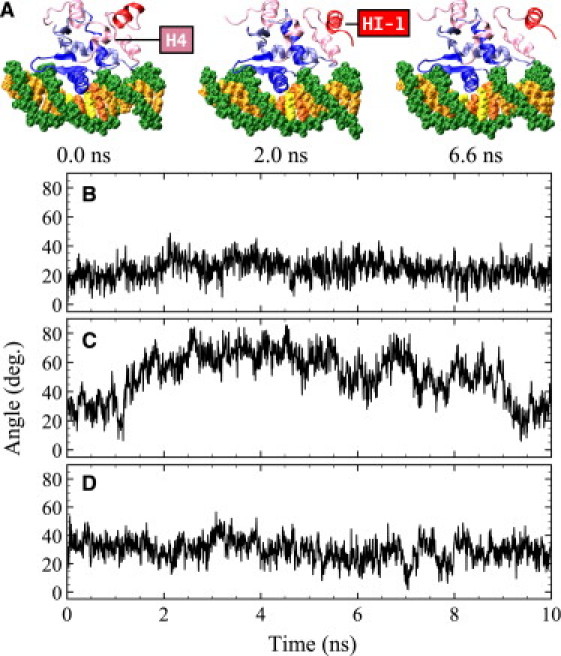
Snapshots of the simulation and angles between H4 and HI-1. (A) Structures from the MD simulations of the DNA-bound states of Δ301. Shown are the initial structure and the structure at 2 ns and 6.6 ns. (B) apo-Δ301. (C) Δ301-DNA complex. (D) Electrostatic-mutant Δ301 bound to DNA.
Given the relatively short length of the simulation compared to the possibly long timescales of folding/unfolding (41), we did not expect to observe the unfolding of the HI-1 helix in the DNA-bound state. Indeed, despite the large RMSD in the DNA-bound state, no unfolding of HI-1 was observed in the simulation. What was observed instead can be interpreted as the onset of the unfolding, consisting of the outward motion of HI-1, away from H4 and HI-2 (Fig. 5 A). During this motion, the Phe304-Leu421 and Lys305-Leu422 hydrogen bonds between HI-1 and H4, and the Lys305-Glu428 salt bridge between HI-1 and H5 broke, whereas the Lys316-Glu343 salt bridge persisted (the Lys318-Asp347 salt bridge was intermittently present in the simulation).
To gain more insight into the change in protein motion upon DNA binding, we performed a quasiharmonic analysis on the Cα atoms of the apo and DNA-bound states of Δ301. The lowest-frequency mode (neglecting the six translational and rotational modes) of the apoprotein mainly showed motion of the C-terminus, and a small bending motion of the protein around the HI-1-H4 axis, whereas the second-lowest mode showed small, symmetric (in-phase) bending and stretching motion of HI-1 and H4, and a stretching motion of H3. In contrast, the lowest mode of the DNA-bound state consisted of a large, asymmetric (out-of-phase) hinge-bending motion of HI-1 and H4 around H1, combined with a large bending motion of HI-2 and the loop between HI-1 and HI-2, and a twisting of H3 ( Fig. 6 A). The second mode of the DNA-bound state showed a large bending and stretching motion of HI-1, HI-2, and the loop between HI-1 and HI-2 away from H4 and the rest of the protein (Fig. 6 B). A projection of the DNA-bound modes onto all the modes of the apoprotein showed that the amplitude of these types of motions was much larger in the DNA-bound state than in the apoprotein (Fig. 6 C). Of the first 10 quasiharmonic modes of the DNA-bound state, modes 4, 6, and 10 also involved motions with much larger amplitude in the DNA-bound state (Fig. 6). These motions involved bending of the loop between HI-1 and HI-2 (mode 4), stretching (mode 6) and twisting (mode 10) of HI-1, HI-2, and the loop between them (mode 6), and in-phase bending of H4 and H5 (mode 10). Motions that were repressed in the DNA-bound state involved the bending of H3 (modes 3, 5, and 7–9), motion of the C-terminus (modes 3, 5, 8, and 9), and bending of H1 (modes 3, 5, and 8); generally, these repressed modes also showed small (compared to modes 1 and 2) bending or stretching motions of HI-1 and HI-2.
Figure 6.
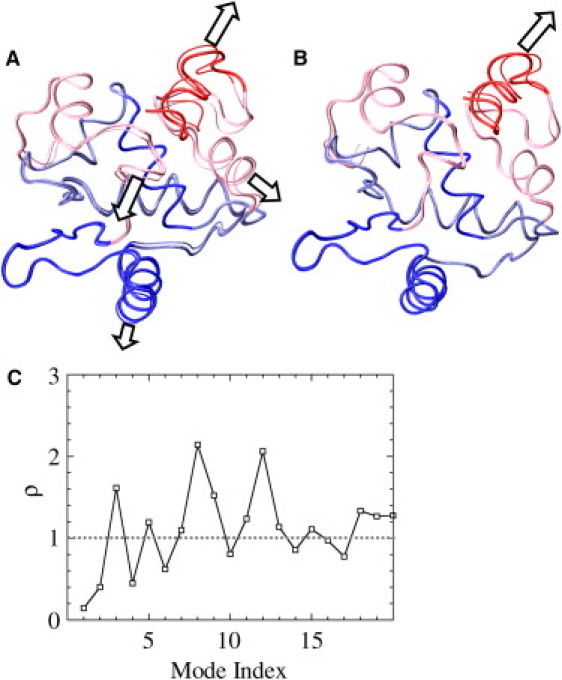
Quasiharmonic analysis of DNA-bound Δ301. (A) First quasiharmonic mode. The mode oscillates between the thick- and thin-lined structures; the arrows indicate major motions. (B) Second quasiharmonic mode. (C) Projection of the motion of the DNA-bound state onto the apo state of Δ301. Shown are the values of for the first 20 quasiharmonic modes (indexed by i). These modes account for 75% of the motion in apo-Ets-1 and for 90% of the motion in the Ets-1-DNA complex. For , the amplitude of motion is larger in the apoprotein, whereas for , the amplitude is larger in the DNA-bound state. The first 10 quasiharmonic modes are described in the text.
What interactions caused the observed changes of motion in Δ301 upon DNA binding? A first indication of the importance of hydrogen bonds between H1 and DNA comes from an analysis of the macrodipolar interaction energies between H1 and H4 in the apo and DNA-bound states of Δ301 and Δ331. For apo-Δ301, the macrodipolar interaction energy between H1 and H4 was 5.0 kJ/mol ( Fig. 7 A), and for apo-Δ331 it was 5.4 kJ/mol (Fig. 7 B). In their DNA-bound states, this interaction energy was 7.5 kJ/mol for Δ301 (Fig. 7 C) and 9.2 kJ/mol for Δ331 (Fig. 7 D). Large drops in the H1-H4 macrodipolar energy were observed when no hydrogen bonds were present between H1 and DNA. Two different hydrogen bonds between H1 and DNA were observed: between the amide backbone of Leu337 and the DNA phosphate, and between the side chain of Gln336 and the DNA phosphate. Leu337 is a highly conserved residue at the N-terminal end of the H1 helix, and has been shown to strongly mediate DNA binding (51). It is thought to form a strong hydrogen bond, due to the facilitating macrodipolar moment of helix H1 and the negative charge of the phosphate group (51,80). In the crystal structure of GABPα/β-DNA, the side chain of Gln336 (residue numbering as in Ets-1) of the ETS domain forms a hydrogen bond with the DNA phosphate (47). Mutation studies of Ets-1 suggest that this residue modulates the binding affinity for DNA (51). In the simulation of the DNA-bound state of Δ301, the Leu337 hydrogen bond with DNA was present until ∼7 ns, and the Gln336 hydrogen bond was present during large sections of the first 7 ns of the production run. At 7 ns, the Leu337 hydrogen bond broke, and for 1 ns no hydrogen bonds were formed between H1 and the DNA. During this time, the H1-H4 macrodipolar interaction energy declined toward its apo value. After 8 ns, both hydrogen bonds were present again, and the H1-H4 macrodipolar interaction energy went back to higher values. For Δ331, the Leu337 hydrogen bond was present during the first 5.6 ns of the production run, during which the Gln336 hydrogen bond was intermittently present. At 5.6 ns, the hydrogen bonds between H1 and the DNA broke, and the H1-H4 macrodipolar interaction energy decreased toward its apo value. At 7.8 ns, the Gln336 hydrogen bond reformed, and the H1-H4 interaction energy went back to its initial value. These results suggest that the interactions between H1 and H4 are mediated through hydrogen bonding of H1 with DNA.
Figure 7.
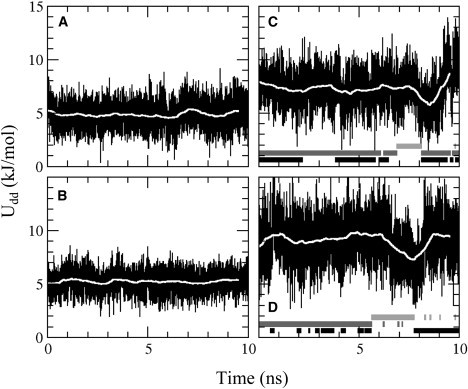
Macrodipolar interaction energy between H1 and H4, with running averages shown as white lines, for (A) apo-Δ301, (B) apo-Δ331, (C) DNA-bound Δ301, and (D) DNA-bound Δ331. In C and D, below the curves, hydrogen bonding between Gln336 and DNA is indicated by black bars, between Leu337 and DNA by dark gray bars, and no hydrogen bonding between H1 and DNA by light gray bars.
The modulation of the dipolar interaction energy between H1 and H4 by the hydrogen bonds between H1 and DNA suggested that these hydrogen bonds may also play a role in the change of the correlation between the motion of HI-1 and H4 upon DNA binding. To test this hypothesis, we performed simulations of Δ301 and Δ331 in which the charges of the amide backbone of Leu337 and the amine of the side chain of Gln336 were set to zero. Hydrogen bonding is a purely electrostatic interaction in the CHARMM force field that we employed (62,63). By setting the charges to zero, we eliminated the hydrogen-bonding capabilities of the backbone of Leu337 and the side chain of Gln336. If the hydrogen bonds of DNA with Leu337 and Gln336 played a role in the sign reversal of the correlation between HI-1 and H4 upon DNA binding, we expected to see changes in the variance-covariance matrix of the DNA-bound “electrostatic mutant”. Since the mutant was still bound to the DNA, we expected not to fully recover the apo values, but instead to obtain a matrix with values in between the apo and DNA-bound values if hydrogen bonding between H1 and DNA was important.
Fig. 3, C and D, shows the variance-covariance matrices for the DNA-bound mutants Δ331 (C) and Δ301 (D). The upper triangular part of the matrices is for the DNA-bound electrostatic mutant, the lower triangular part for the wild-type protein bound to DNA (see also Fig. 3, A and B, lower triangles). Comparison of the DNA-bound mutant Δ301 variance-covariance matrix (Fig. 3 D, upper triangle) to the apo (Fig. 3 B, upper triangle) and DNA-bound state of Δ301 (Fig. 3, B and D, lower triangles) showed significant differences. The correlation between H4 and HI-1 is still negative in the DNA-bound state of the mutant, but significantly less negative than for the wild-type protein. The variance-covariance matrix elements between other parts of the DNA-bound mutant were also in between those of the wild-type apoprotein and DNA-bound complex. For example, the correlation between HI-1 and H1 is more negative in the DNA-bound mutant than in the apo-wild-type, but less negative than in the wild-type DNA-bound state. The correlation between H1 and H4 is more positive in the mutant than in the apo-wild-type, but less positive than in the wild-type DNA-bound state. In contrast, very small differences were observed between the DNA-bound Δ331 mutant (Fig. 3 C, upper triangle) and the apo (Fig. 3 A, upper triangle) and DNA-bound wild-type Δ331 (Fig. 3, A and C, lower triangles).
In addition to the effect on the variance-covariance matrix, the elimination of the hydrogen bonding between H1 and DNA also had large effects on other aspects of the motion of the protein. In Fig. 2, the RMSD with the averaged structures for the Cα atoms of the DNA-bound states of mutant Δ301 (Fig. 2 A) and mutant Δ331 (Fig. 2 B) are shown in gray. For the mutant Δ301, the RMSD values for HI-1, HI-2, and the loop between HI-1 and HI-2 are in between the apo-wild-type (black) and wild-type DNA-bound states (dark gray). The RMSD values of H4 of the mutant are close to the apo-wild-type values, whereas all other RMSDs match the wild-type DNA-bound values. For Δ331, no large differences in RMSDs were observed between the apo-wild-type and DNA-bound structures, and the mutant DNA-bound structure. In Fig. 5 D, the angle between H4 and HI-1 for the DNA-bound electrostatic mutant Δ301 is shown. This angle was 30 ± 8° throughout the simulation, close to the value of 25° for apo-wild-type Δ301 (Fig. 5 B). Finally, the quasiharmonic modes of the DNA-bound mutant Δ301 were similar to those of the DNA-bound wild-type Δ301, but the amplitude of outward motion of HI-1, HI-2, and the loop between HI-1 and HI-2 was much reduced. Fig. 8 shows the projection of the wild-type DNA-bound Δ301 modes onto the DNA-bound mutant modes. This figure shows that the amplitudes of mode 1 (the out-of-phase bending of HI-1 and H4, Fig. 6 A) and mode 2 (the bending of HI-1 and HI-2 away from the protein, Fig. 6 B) are repressed in the mutant.
Figure 8.
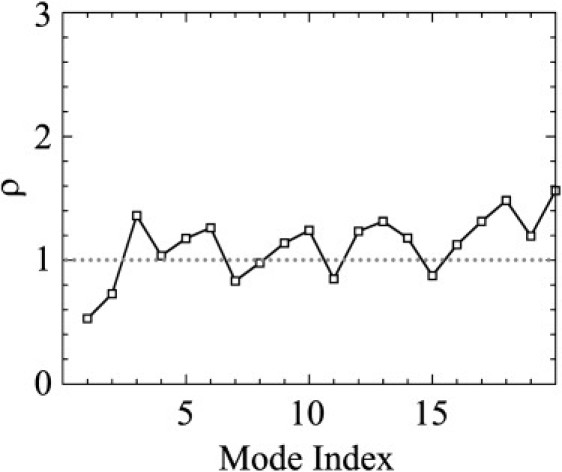
Projection of the motion of the DNA-bound state of Δ301 onto the motion of the DNA-bound state of the electrostatic mutant Δ301. Shown are the values of for the first 20 quasiharmonic modes (indexed by i). For the amplitude of motion is larger in the mutant, whereas for the amplitude is larger in the wild-type protein.
Discussion
We have performed MD simulations of the folded states of Ets-1 Δ331 and Δ301 as apoprotein and bound to DNA to probe the interactions that lead to the DNA-induced unfolding of HI-1. Given the possibly long timescales of the unfolding transition (41), we did not anticipate observing a complete unfolding of HI-1 of the DNA-bound protein in our ∼15-ns simulations. Our main goal was to identify the interactions that lead to the onset of the unfolding; for this aim, simulation of the entire unfolding process was not necessary. We did observe the onset of unfolding, which consisted of the breaking of the backbone Phe304-Leu421 and Lys305-Leu422 hydrogen bonds between HI-1 and H4, the breaking of the Lys305-Glu428 salt bridge between HI-1 and H5, and the outward motion of HI-1, away from H4 and HI-2. We also performed simulations of DNA-bound states of “electrostatic mutants” in which certain charges were neutralized, to uncover the role of the hydrogen-bonding interactions between helix H1 and DNA.
Our main result is that the protein motion changed in character upon binding DNA. In the apoprotein, the motion of HI-1 and H4 was correlated, whereas in the DNA-bound state the motion was anticorrelated. In addition, in the apoprotein HI-1 and H4 were well aligned, whereas in the DNA-bound state this alignment was lost. These results indicate that HI-1 is stabilized in the apoprotein through favorable interactions with H4. These interactions persist over long timescales, since the helices move in tandem. Upon DNA binding, the stabilizing interactions between HI-1 and H4 were disrupted: the backbone Phe304-Leu421 and Lys305-Leu422 hydrogen bonds broke, the helices moved out of phase (disfavoring a continuous stabilization), and the macrodipoles were misaligned. Although we did not observe the actual unfolding of HI-1 in our simulations, large outward motions of the helix were observed. The data indicate that the disruption of stabilizing interactions between H4 and HI-1 trigger the unfolding of HI-1. These results agree with experimental data: chemical shift data showed a perturbation of H4 upon DNA binding (44), and NMR data (41) also indicate critical roles for the Phe304-Leu421 and Lys305-Leu422 hydrogen bonds. The simulations augment the experimental observations by providing detailed structural insights into the role of H4 at the onset of unfolding. Our calculations suggest an important role for the Lys305-Glu428 salt bridge between HI-1 and H5, which breaks upon DNA binding. The importance of this salt bridge could be verified by mutation experiments.
Electrostatic data indicates that the interactions between HI-1 and H4 are modulated by hydrogen bonding of H1 with the DNA backbone. Macrodipolar interactions between H1 and H4 were strongly dependent on the presence of a hydrogen bond between H1 and DNA, and the DNA-bound Δ301 electrostatic mutant showed decreased anticorrelated motion between HI-1 and H4, and a decreased RMSD of HI-1 compared to the DNA-bound wild-type protein. The simulation indicated the importance of two hydrogen-bonding groups: the amide backbone of Leu337 and the side chain of Gln336. The importance of these groups is in agreement with mutation experiments (51) and confirms that the hydrogen bonds between H1 and DNA form a conformational switch (47,51).
Our simulations support a central role for correlated motions and interactions between H1, H4, and HI-1 at the onset of unfolding. The presence of DNA is sensed by H1, and transmitted to H4, which destabilizes HI-1 by a disruption of hydrogen bonding and macrodipolar interactions. The importance of correlated motions for binding is certainly not unique to Ets-1: correlated motions are often essential for protein function. Molecular dynamics simulations can provide direct and comprehensive insights into these correlated motions (82), providing new data that complement experiments.
Acknowledgments
This material is based upon work supported by the National Science Foundation under its programs Partnerships for Advanced Computational Infrastructure, Distributed Terascale Facility (DTF), and Terascale Extensions: Enhancements to the Extensible Terascale Facility. Computer time was also provided by the Fulton High Performance Computing Initiative at Arizona State University.
References
- 1.Wasylyk B., Hahn S., Giovane A. The Ets family of transcription factors. Eur. J. Biochem. 1993;211:7–18. doi: 10.1007/978-3-642-78757-7_2. [DOI] [PubMed] [Google Scholar]
- 2.Maroulakou I., Bowe D. Expression and function of Ets transcription factors in mammalian development: a regulatory network. Oncogene. 2000;19:6432–6442. doi: 10.1038/sj.onc.1204039. [DOI] [PubMed] [Google Scholar]
- 3.Lelièvre E., Lionneton F., Soncin S., Vandenbunder B. The Ets family contains transcriptional activators and repressors involved in angiogenesis. Int. J. Biochem. Cell Biol. 2001;33:391–407. doi: 10.1016/s1357-2725(01)00025-5. [DOI] [PubMed] [Google Scholar]
- 4.Sato Y. Role of ETS family transcription factors in vascular development and angiogenesis. Cell Struct. Funct. 2001;26:19–24. doi: 10.1247/csf.26.19. [DOI] [PubMed] [Google Scholar]
- 5.Oettgen P. Regulation of vascular inflammation and remodeling by ETS factors. Circ. Res. 2006;99:1159–1166. doi: 10.1161/01.RES.0000251056.85990.db. [DOI] [PubMed] [Google Scholar]
- 6.Dittmer J. The biology of the Ets1 proto-oncogene. Mol. Cancer. 2003;2:29. doi: 10.1186/1476-4598-2-29. [DOI] [PMC free article] [PubMed] [Google Scholar]
- 7.Oikawa T. ETS transcription factors: possible targets for cancer therapy. Cancer Sci. 2004;95:626–633. doi: 10.1111/j.1349-7006.2004.tb03320.x. [DOI] [PMC free article] [PubMed] [Google Scholar]
- 8.Seth A., Watson D. ETS transcription factors and their emerging roles in human cancer. Eur. J. Cancer. 2005;41:2462–2478. doi: 10.1016/j.ejca.2005.08.013. [DOI] [PubMed] [Google Scholar]
- 9.Span P., Manders P., Heuvel J., Thomas C., Bosch R. Expression of the transcription factor Ets-1 is an independent prognostic marker for relapse-free survival in breast cancer. Oncogene. 2002;21:8506–8509. doi: 10.1038/sj.onc.1206040. [DOI] [PubMed] [Google Scholar]
- 10.Lincoln D., Bove K. The transcription factor Ets-1 in breast cancer. Front. Biosci. 2005;10:506–511. doi: 10.2741/1546. [DOI] [PubMed] [Google Scholar]
- 11.Tokuhara K., Ogata Y., Nakagawa M., Shirouzu K. Ets-1 expression in vascular endothelial cells as an angiogenic and prognostic factor in colorectal carcinoma. Int. Surg. 2003;88:25–33. [PubMed] [Google Scholar]
- 12.Takai N., Miyazaki T., Fujisawa K., Nasu K., Miyakawa I. Expression of c-Ets1 is associated with malignant potential in endometrial carcinoma. Cancer. 2000;89:2059–2067. doi: 10.1002/1097-0142(20001115)89:10<2059::aid-cncr5>3.0.co;2-3. [DOI] [PubMed] [Google Scholar]
- 13.Fujimoto J., Aoki I., Toyoki H., Khatun S., Tamaya T. Clinical implications of expression of ETS-1 related to angiogenesis in uterine cervical cancers. Ann. Oncol. 2002;13:1598–1604. doi: 10.1093/annonc/mdf248. [DOI] [PubMed] [Google Scholar]
- 14.Tsutsumi S., Kuwano H., Nagashima N., Shimura T., Mochiki E. Ets-1 expression in gastric cancer. Hepatogastroenterology. 2005;52:654–656. [PubMed] [Google Scholar]
- 15.Arora S., Kaur J., Sharma C., Mathur M., Bahadur S. Stromelysin 3, Ets-1, and vascular endothelial growth factor expression in oral precancerous and cancerous lesions: correlation with microvessel density, progression, and prognosis. Clin. Cancer Res. 2005;11:2272–2284. doi: 10.1158/1078-0432.CCR-04-0572. [DOI] [PubMed] [Google Scholar]
- 16.Davidson B., Reich R., Goldberg I., Gotlieb W., Kopolovic J. Ets-1 messenger RNA expression is a novel marker of poor survival in ovarian carcinoma. Clin. Cancer Res. 2001;7:551–557. [PubMed] [Google Scholar]
- 17.Takai N., Miyazaki T., Nishida M., Nasu K., Miyakawa I. c-Ets1 is a promising marker in epithelial ovarian cancer. Int. J. Mol. Med. 2002;9:287–292. doi: 10.3892/ijmm.9.3.287. [DOI] [PubMed] [Google Scholar]
- 18.Fujimoto J., Aoki I., Toyoki H., Khatun S., Sato E. Clinical implications of expression of ETS-1 related to angiogenesis in metastatic lesions of ovarian cancer. Oncology. 2004;66:420–428. doi: 10.1159/000079491. [DOI] [PubMed] [Google Scholar]
- 19.Slupsky C., Gentile L., Donaldson L., Mackereth C., Seidel J. Structure of the Ets-1 pointed domain and mitogen-activated protein kinase phosphorylation site. Proc. Natl. Acad. Sci. USA. 1998;95:12129–12134. doi: 10.1073/pnas.95.21.12129. [DOI] [PMC free article] [PubMed] [Google Scholar]
- 20.Yang B., Hauser C., Henkel G., Colman M., Beveren C. Ras-mediated phosphorylation of a conserved threonine residue enhances the transactivation activities of c-Ets1 and c-Ets2. Mol. Cell. Biol. 1996;16:538–547. doi: 10.1128/mcb.16.2.538. [DOI] [PMC free article] [PubMed] [Google Scholar]
- 21.Gegonne A., Punyammalee B., Rabault B., Bosselut R., Seneca S. Analysis of the DNA-binding and transcriptional activation properties of the Ets1 oncoprotein. New Biol. 1992;4:512–519. [PubMed] [Google Scholar]
- 22.Donaldson L., Petersen J., Graves B., McIntosh L. Secondary structure of the ETS domain places murine Ets-1 in the superfamily of winged helix-turn-helix DNA-binding proteins. Biochemistry. 1994;33:13509–13516. doi: 10.1021/bi00250a001. [DOI] [PubMed] [Google Scholar]
- 23.Nye J., Petersen J., Gunther C., Jonsen M., Graves B. Interaction of murine Ets-1 with GGA-binding sites establishes the ETS domain as a new DNA-binding motif. Genes Dev. 1992;6:975–990. doi: 10.1101/gad.6.6.975. [DOI] [PubMed] [Google Scholar]
- 24.Werner M., Clore G., Fisher C., Fisher R., Trinh L. Correction of the NMR structure of the ETS1/DNA complex. J. Biomol. NMR. 1997;10:317–328. doi: 10.1023/a:1018399711996. [DOI] [PubMed] [Google Scholar]
- 25.Obika S., Reddy S., Bruice T. Sequence specific DNA binding of Ets-1 transcription factor: molecular dynamics study of the Ets domain-DNA complexes. J. Mol. Biol. 2003;331:345–359. doi: 10.1016/s0022-2836(03)00726-5. [DOI] [PubMed] [Google Scholar]
- 26.Reddy S., Obika S., Bruice T. Conformations and dynamics of Ets-1 ETS domain-DNA complexes. Proc. Natl. Acad. Sci. USA. 2003;100:15475–15480. doi: 10.1073/pnas.1936251100. [DOI] [PMC free article] [PubMed] [Google Scholar]
- 27.Hagman J., Grosschedl R. An inhibitory carboxyl-terminal domain in Ets-1 and Ets-2 mediates differential binding of ETS family factors to promotor sequences of the MB-1 gene. Proc. Natl. Acad. Sci. USA. 1992;89:8889–8893. doi: 10.1073/pnas.89.19.8889. [DOI] [PMC free article] [PubMed] [Google Scholar]
- 28.Lim F., Kraut N., Frampton J., Graf T. DNA-binding by c-Ets-1, but not v-Ets, is repressed by an intramolecular mechanism. EMBO J. 1992;11:643–652. doi: 10.1002/j.1460-2075.1992.tb05096.x. [DOI] [PMC free article] [PubMed] [Google Scholar]
- 29.Wasylyk C., Kerckaert J., Wasylyk B. A novel modulator domain of ETS transcription factors. Genes Dev. 1992;6:965–974. doi: 10.1101/gad.6.6.965. [DOI] [PubMed] [Google Scholar]
- 30.Jonsen M., Petersen J., Xu Q., Graves B. Characterization of the cooperative function of inhibitory sequences in Ets-1. Mol. Cell. Biol. 1996;16:2065–2073. doi: 10.1128/mcb.16.5.2065. [DOI] [PMC free article] [PubMed] [Google Scholar]
- 31.Pufall M., Lee G., Nelson M., Kang H., Velyvis A. Variable control of Ets-1 DNA binding by multiple phosphates in an unstructured region. Science. 2005;309:142–145. doi: 10.1126/science.1111915. [DOI] [PubMed] [Google Scholar]
- 32.Pufall M., Graves B. Autoinhibitory domains: modular effectors of cellular regulation. Annu. Rev. Cell Dev. Biol. 2002;18:421–462. doi: 10.1146/annurev.cellbio.18.031502.133614. [DOI] [PubMed] [Google Scholar]
- 33.Hahn S., Wasylyk B. The oncoprotein v-Ets is less selective in DNA-binding than c-Ets-1 due to the C-terminal sequence change. Oncogene. 1994;9:2499–2512. [PubMed] [Google Scholar]
- 34.Kim W., Sieweke M., Ogawa E., Wee H., Englmeier U. Mutual activation of Ets-1 and AML1 DNA binding by direct interaction of their autoinhibitory domains. EMBO J. 1999;18:1609–1620. doi: 10.1093/emboj/18.6.1609. [DOI] [PMC free article] [PubMed] [Google Scholar]
- 35.Goetz T., Gu T., Speck N., Graves B. Auto-inhibition of Ets-1 is counteracted by DNA binding cooperatively with core-binding factor α2. Mol. Cell. Biol. 2000;20:81–90. doi: 10.1128/mcb.20.1.81-90.2000. [DOI] [PMC free article] [PubMed] [Google Scholar]
- 36.Rabault B., Ghysdael J. Calcium-induced phosphorylation of ETS1 inhibits its specific DNA binding activity. J. Biol. Chem. 1994;45:28143–28151. [PubMed] [Google Scholar]
- 37.Cowley D., Graves B. Phosphorylation represses Ets-1 DNA binding by reinforcing autoinhibition. Genes Dev. 2000;14:366–376. [PMC free article] [PubMed] [Google Scholar]
- 38.Liu H., Grundström T. Calcium regulation of GM-CSF by calmodulin-dependent kinase II phosphorylation of Ets1. Mol. Biol. Cell. 2002;13:4497–4507. doi: 10.1091/mbc.E02-03-0149. [DOI] [PMC free article] [PubMed] [Google Scholar]
- 39.Park K., Mohapatra D., Misonou H., Trimmer J. Graded regulation of the Kv2.1 potassium channel by variable phosphorylation. Science. 2006;313:976–979. doi: 10.1126/science.1124254. [DOI] [PubMed] [Google Scholar]
- 40.Petersen J., Skalicky J., Donaldson L., McIntosh L., Alber T. Modulation of transcription factor Ets-1 DNA binding: DNA-induced unfolding of an α-helix. Science. 1995;269:1866–1869. doi: 10.1126/science.7569926. [DOI] [PubMed] [Google Scholar]
- 41.Lee G., Donaldson L., Pufall M., Kang H., Pot I. The structural and dynamic basis of Ets-1 DNA binding autoinhibition. J. Biol. Chem. 2005;280:7088–7099. doi: 10.1074/jbc.M410722200. [DOI] [PubMed] [Google Scholar]
- 42.Newman M., Strzelecka T., Dorner L., Schildkraut I., Aggarwal A. Structure of Bam HI endonuclease bound to DNA: partial folding and unfolding on DNA binding. Science. 1995;269:656–663. doi: 10.1126/science.7624794. [DOI] [PubMed] [Google Scholar]
- 43.Garvie C., Pufall M., Graves B., Wolberger C. Structural analysis of the autoinhibition of Ets-1 and its role in protein partnerships. J. Biol. Chem. 2002;277:45529–45536. doi: 10.1074/jbc.M206327200. [DOI] [PubMed] [Google Scholar]
- 44.Skalicky J., Donaldson L., Petersen J., Graves B., McIntosh L. Structural coupling of the inhibitory regions flanking the ETS domain of murine Ets-1. Protein Sci. 1996;5:296–309. doi: 10.1002/pro.5560050214. [DOI] [PMC free article] [PubMed] [Google Scholar]
- 45.Kodandapani R., Pio F., Ni C., Piccialli G., Klemsz M. A new pattern for helix-turn-helix recognition revealed by the PU.1 ETS-domain-DNA complex. Nature. 1996;380:456–460. doi: 10.1038/380456a0. [DOI] [PubMed] [Google Scholar]
- 46.Mo Y., Vaessen B., Johnston K., Marmorstein R. Structures of SAP-1 bound to DNA targets from the E74 and c-fos promoters: insights into DNA sequence discrimination by Ets proteins. Mol. Cell. 1998;2:201–212. doi: 10.1016/s1097-2765(00)80130-6. [DOI] [PubMed] [Google Scholar]
- 47.Batchelor A., Piper D., de la Brousse F., McKnight S., Wolberger C. The structure of GABPα/β: an ETS domain ankyrin repeat heterodimer bound to DNA. Science. 1998;279:1037–1041. doi: 10.1126/science.279.5353.1037. [DOI] [PubMed] [Google Scholar]
- 48.Mo Y., Vaessen B., Johnston K., Marmorstein R. Structure of the Elk-1-DNA complex reveals how DNA-distal residues affect ETS domain recognition of DNA. Nat. Struct. Biol. 2000;7:292–297. doi: 10.1038/74055. [DOI] [PubMed] [Google Scholar]
- 49.Hassler M., Richmond T. The B-box dominates SAP-1-SRF interactions in the structure of the ternary complex. EMBO J. 2001;20:3018–3028. doi: 10.1093/emboj/20.12.3018. [DOI] [PMC free article] [PubMed] [Google Scholar]
- 50.Garvie C., Hagman J., Wolberger C. Structural studies of Ets-1/Pax5 complex formation on DNA. Mol. Cell. 2001;8:1267–1276. doi: 10.1016/s1097-2765(01)00410-5. [DOI] [PubMed] [Google Scholar]
- 51.Wang H., McIntosh L., Graves B. Inhibitory module of Ets-1 allosterically regulates DNA binding through a dipole-facilitated phosphate contact. J. Biol. Chem. 2002;277:2225–2233. doi: 10.1074/jbc.M109430200. [DOI] [PubMed] [Google Scholar]
- 52.van Gunsteren W., Bakowies D., Baron R., Chandrasekhar I., Christen M. Biomolecular modeling: goals, problems, perspectives. Angew. Chem. Int. Ed. 2006;45:4064–4092. doi: 10.1002/anie.200502655. [DOI] [PubMed] [Google Scholar]
- 53.Donaldson L., Petersen J., Graves B., McIntosh L. Solution structure of the ETS domain from murine Ets-1: a winged helix-turn-helix DNA binding motif. EMBO J. 1996;15:125–134. [PMC free article] [PubMed] [Google Scholar]
- 54.Berman H., Westbrook J., Feng Z., Gilliland G., Bhat T. The protein data bank. Nucleic Acids Res. 2000;128:235–242. doi: 10.1093/nar/28.1.235. [DOI] [PMC free article] [PubMed] [Google Scholar]
- 55.Beroza P., Fredkin D., Okamura M., Feher G. Protonation of interacting residues in a protein by a Monte Carlo method: application to lysozyme and photosynthetic reaction center. Proc. Natl. Acad. Sci. USA. 1990;88:5804–5808. doi: 10.1073/pnas.88.13.5804. [DOI] [PMC free article] [PubMed] [Google Scholar]
- 56.Lu X., Olson W. 3DNA: a software package for the analysis, rebuilding and visualization of three-dimensional nucleic acid structures. Nucleic Acids Res. 2003;31:5108–5121. doi: 10.1093/nar/gkg680. [DOI] [PMC free article] [PubMed] [Google Scholar]
- 57.Jorgensen W., Chandrasekar J., Madura J., Impey R., Klein M. Comparison of simple potential functions for simulating liquid water. J. Chem. Phys. 1983;79:926–935. [Google Scholar]
- 58.Grubmüller H., Heymann B., Tavan P. Ligand binding: molecular mechanics calculation of the streptavidin-biotin rupture force. Science. 1996;271:997–999. doi: 10.1126/science.271.5251.997. [DOI] [PubMed] [Google Scholar]
- 59.Ponomarev S., Thayer K., Beveridge D. Ion motions in molecular dynamics simulations. Proc. Natl. Acad. Sci. USA. 2004;101:14771–14775. doi: 10.1073/pnas.0406435101. [DOI] [PMC free article] [PubMed] [Google Scholar]
- 60.Várnai P., Zakrzewska K. DNA and its counterions: a molecular dynamics study. Nucleic Acids Res. 2004;32:4269–4280. doi: 10.1093/nar/gkh765. [DOI] [PMC free article] [PubMed] [Google Scholar]
- 61.Brooks B., Bruccoleri R., Olafson B., States D., Swaninathan S. CHARMM: a program for macromolecular energy minimization and dynamics calculations. J. Comput. Chem. 1983;4:187–217. [Google Scholar]
- 62.Foloppe N., MacKerell A. All-atom empirical force field for nucleic acids: I. Parameter optimization based on small molecule and condensed phase macromolecular target data. J. Comput. Chem. 2000;21:86–104. [Google Scholar]
- 63.MacKerell A., Banavali N. All-atom empirical force field for nucleic acids: II. Application to molecular dynamics simulations of DNA and RNA in solution. J. Comput. Chem. 2000;21:105–120. [Google Scholar]
- 64.MacKerell A., Feig M., Brooks C. Extending the treatment of backbone energetics in protein force fields: limitations of gas-phase quantum mechanics in reproducing protein conformational distributions in molecular dynamics simulations. J. Comput. Chem. 2004;25:1400–1415. doi: 10.1002/jcc.20065. [DOI] [PubMed] [Google Scholar]
- 65.Essmann U., Perera L., Berkowitz M., Darden T., Lee H. A smooth particle mesh Ewald method. J. Chem. Phys. 1995;103:8577–8593. [Google Scholar]
- 66.Ryckaert J., Ciccotti G., Berendsen H. Numerical integration of the Cartesian equations of motion of a system with constraints: molecular dynamics of n-alkanes. J. Comput. Phys. 1977;23:327–341. [Google Scholar]
- 67.Hoover W. Canonical dynamics: equilibrium phase-space distributions. Phys. Rev. A. 1985;31:1695–1697. doi: 10.1103/physreva.31.1695. [DOI] [PubMed] [Google Scholar]
- 68.Martyna G., Tuckerman M., Klein M. Nosé-Hoover chains. The canonical ensemble via continuous dynamics. J. Chem. Phys. 1992;97:2635–2643. [Google Scholar]
- 69.Martyna G., Tuckerman M., Tobias D., Klein M. Explicit reversible integration algorithms for extended systems. Mol. Phys. 1996;87:1117–1157. [Google Scholar]
- 70.Paparoditis E., Politis D. Local block bootstrap. CR Acad. Sci. I. 2002;335:959–962. [Google Scholar]
- 71.Kubinger K., Rasch D., Simeckova M. Testing a correlation coefficient's significance. Psychol. Sci. 2007;49:74–87. [Google Scholar]
- 72.Ichiye T., Karplus M. Collective motions in proteins: a covariance analysis of atomic fluctuations in molecular dynamics and normal mode simulations. Proteins. 1991;11:205–217. doi: 10.1002/prot.340110305. [DOI] [PubMed] [Google Scholar]
- 73.Lange O., Grubmüller H. Generalized correlation for biomolecular dynamics. Proteins. 2006;62:1053–1061. doi: 10.1002/prot.20784. [DOI] [PubMed] [Google Scholar]
- 74.Clarage J., Romo T., Andrews B., Pettitt B., Phillips G. A sampling problem in molecular dynamics simulations of macromolecules. Proc. Natl. Acad. Sci. USA. 1995;92:3288–3292. doi: 10.1073/pnas.92.8.3288. [DOI] [PMC free article] [PubMed] [Google Scholar]
- 75.Karplus M., Kushick J. Method for estimating the configurational entropy of macromolecules. Macromolecules. 1981;14:325–332. [Google Scholar]
- 76.Teeter M., Case D. Harmonic and quasiharmonic descriptions of crambin. J. Phys. Chem. 1990;94:8091–8097. [Google Scholar]
- 77.Tournier A., Smith J. Principal components of the protein dynamical transition. Phys. Rev. Lett. 2003;91:208106. doi: 10.1103/PhysRevLett.91.208106. [DOI] [PubMed] [Google Scholar]
- 78.Fan H., Mark A. Relative stability of protein structures determined by x-ray crystallography or NMR spectroscopy: a molecular dynamics simulation study. Proteins. 2003;53:111–120. doi: 10.1002/prot.10496. [DOI] [PubMed] [Google Scholar]
- 79.Tidor B., Karplus M. Simulation analysis of the stability mutant R96H of T4 lysozyme. Biochemistry. 1991;30:3217–3228. doi: 10.1021/bi00227a009. [DOI] [PubMed] [Google Scholar]
- 80.Hol W., van Duijnen P., Berendsen H. The α-helix dipole and the properties of proteins. Nature. 1978;273:443–446. doi: 10.1038/273443a0. [DOI] [PubMed] [Google Scholar]
- 81.Sheridan R., Levy R., Salemme F. α-Helix dipole model and electrostatic stabilization of 4-α-helical proteins . Proc. Natl. Acad. Sci. USA. 1982;79:4545–4549. doi: 10.1073/pnas.79.15.4545. [DOI] [PMC free article] [PubMed] [Google Scholar]
- 82.Lange O., Grubmüller H., de Groot B. Molecular dynamics simulations of protein G challenge NMR-derived correlated backbone motions. Angew. Chem. Int. Ed. 2005;44:3394–3399. doi: 10.1002/anie.200462957. [DOI] [PubMed] [Google Scholar]
- 83.Humphrey W., Dalke A., Schulten K. VMD: visual molecular dynamics. J. Mol. Graph. 1996;14:33–38. doi: 10.1016/0263-7855(96)00018-5. [DOI] [PubMed] [Google Scholar]